Zip Codes with the Highest Percentage of Families with Income Above $200,000 in El Paso, TX
RELATED REPORTS & OPTIONS
Family Income | $200k+
El Paso
Compare Zip Codes
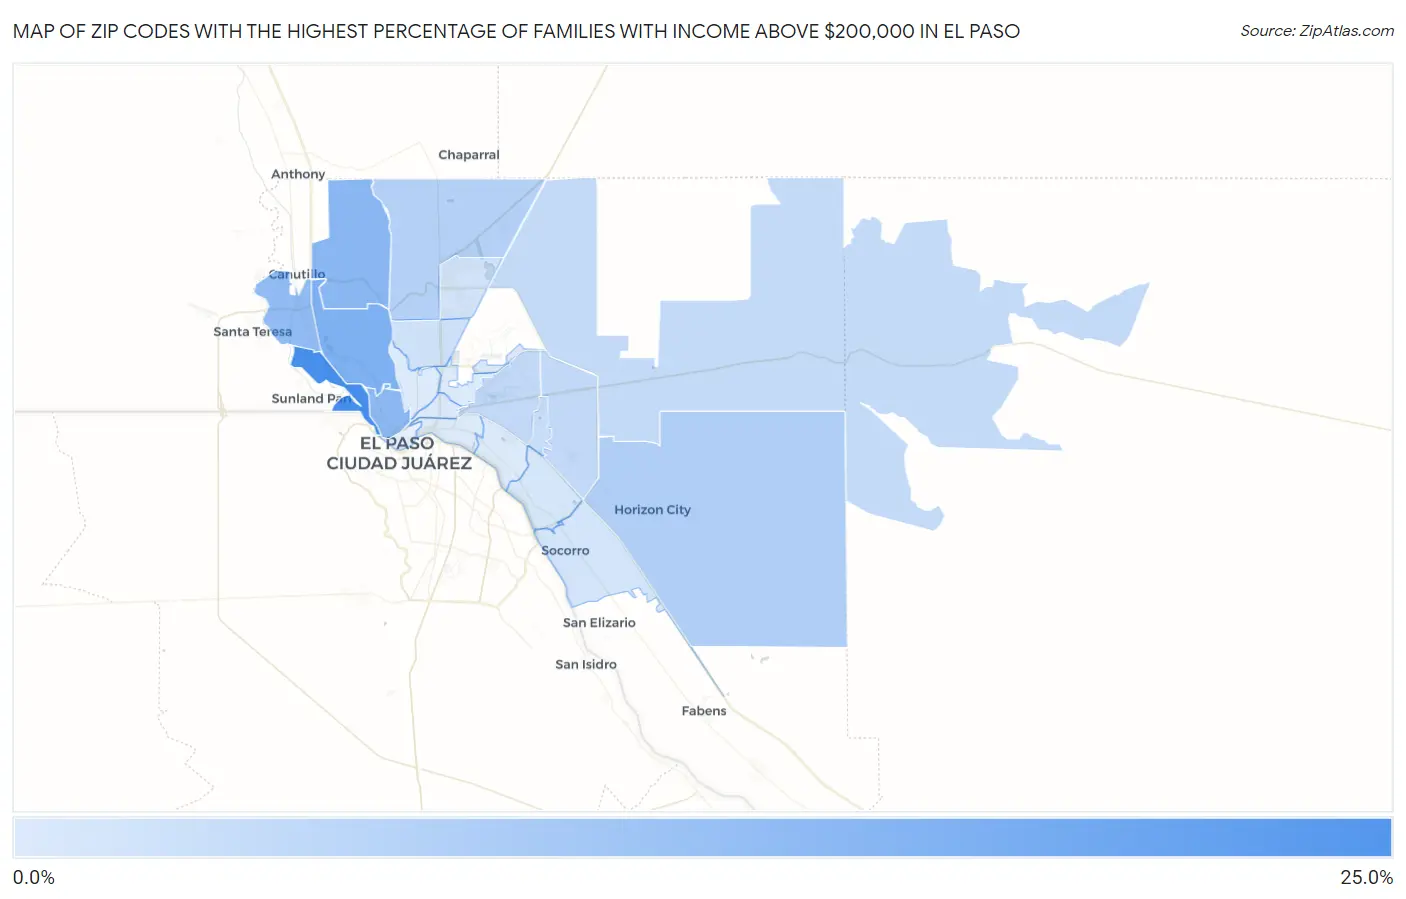
Map of Zip Codes with the Highest Percentage of Families with Income Above $200,000 in El Paso
0.70%
24.9%
Zip Codes with the Highest Percentage of Families with Income Above $200,000 in El Paso, TX
| Zip Code | Families with Income > $200k | vs State | vs National | |
| 1. | 79922 | 24.9% | 13.5%(+11.4)#175 | 14.8%(+10.1)#3,505 |
| 2. | 79912 | 15.4% | 13.5%(+1.90)#347 | 14.8%(+0.600)#6,726 |
| 3. | 79911 | 13.6% | 13.5%(+0.100)#421 | 14.8%(-1.20)#7,819 |
| 4. | 79902 | 12.9% | 13.5%(-0.600)#447 | 14.8%(-1.90)#8,294 |
| 5. | 79932 | 12.3% | 13.5%(-1.20)#481 | 14.8%(-2.50)#8,724 |
| 6. | 79928 | 7.3% | 13.5%(-6.20)#852 | 14.8%(-7.50)#14,160 |
| 7. | 79934 | 6.9% | 13.5%(-6.60)#891 | 14.8%(-7.90)#14,865 |
| 8. | 79936 | 4.9% | 13.5%(-8.60)#1,094 | 14.8%(-9.90)#18,589 |
| 9. | 79925 | 4.7% | 13.5%(-8.80)#1,117 | 14.8%(-10.1)#18,989 |
| 10. | 79938 | 4.4% | 13.5%(-9.10)#1,155 | 14.8%(-10.4)#19,575 |
| 11. | 79935 | 3.9% | 13.5%(-9.60)#1,230 | 14.8%(-10.9)#20,633 |
| 12. | 79904 | 2.8% | 13.5%(-10.7)#1,361 | 14.8%(-12.0)#22,896 |
| 13. | 79924 | 2.4% | 13.5%(-11.1)#1,414 | 14.8%(-12.4)#23,682 |
| 14. | 79927 | 1.9% | 13.5%(-11.6)#1,460 | 14.8%(-12.9)#24,616 |
| 15. | 79907 | 1.7% | 13.5%(-11.8)#1,484 | 14.8%(-13.1)#24,965 |
| 16. | 79903 | 1.1% | 13.5%(-12.4)#1,542 | 14.8%(-13.7)#25,927 |
| 17. | 79908 | 1.1% | 13.5%(-12.4)#1,544 | 14.8%(-13.7)#25,951 |
| 18. | 79930 | 0.80% | 13.5%(-12.7)#1,568 | 14.8%(-14.0)#26,346 |
| 19. | 79905 | 0.80% | 13.5%(-12.7)#1,569 | 14.8%(-14.0)#26,347 |
| 20. | 79915 | 0.70% | 13.5%(-12.8)#1,579 | 14.8%(-14.1)#26,460 |
| 21. | 79906 | 0.70% | 13.5%(-12.8)#1,584 | 14.8%(-14.1)#26,482 |
1
Common Questions
What are the Top 10 Zip Codes with the Highest Percentage of Families with Income Above $200,000 in El Paso, TX?
Top 10 Zip Codes with the Highest Percentage of Families with Income Above $200,000 in El Paso, TX are:
What zip code has the Highest Percentage of Families with Income Above $200,000 in El Paso, TX?
79922 has the Highest Percentage of Families with Income Above $200,000 in El Paso, TX with 24.9%.
What is the Percentage of Families with Income Above $200,000 in El Paso, TX?
Percentage of Families with Income Above $200,000 in El Paso is 5.8%.
What is the Percentage of Families with Income Above $200,000 in Texas?
Percentage of Families with Income Above $200,000 in Texas is 13.5%.
What is the Percentage of Families with Income Above $200,000 in the United States?
Percentage of Families with Income Above $200,000 in the United States is 14.8%.