Zip Codes with the Highest Percentage of Scotch-Irish Population in El Paso, TX

RELATED REPORTS & OPTIONS

Scotch-Irish
Population
Families and Households
Female Fertility
Female Fertility (Unmarried)
Race (Community Size)
Race (Percentage)
Ancestry (Community Size)
AfghanAfricanAmericanApacheArabArgentineanArmenianAustrianBarbadianBasqueBelgianBelizeanBhutaneseBlackfeetBolivianBrazilianBritishBurmeseCajunCanadianCentral AmericanCentral American IndianCherokeeCheyenneChickasawChileanChippewaChoctawColombianComancheCosta RicanCreeCreekCroatianCubanCzechCzechoslovakianDanishDominicanDutchEastern EuropeanEcuadorianEgyptianEnglishEthiopianEuropeanFilipinoFinnishFrenchFrench CanadianGermanGerman RussianGhanaianGreekGuamanian / ChamorroGuatemalanHaitianHonduranHopiHungarianIndian (Asian)IndonesianInupiatIranianIrishIroquoisItalianJamaicanJapaneseJordanianKoreanLaotianLebaneseLithuanianLumbeeLuxembourgerMexicanMexican American IndianMongolianMoroccanNative HawaiianNavajoNicaraguanNigerianNorthern EuropeanNorwegianOttawaPakistaniPanamanianPeruvianPimaPolishPortuguesePotawatomiPuebloPuerto RicanRomanianRussianSalvadoranSamoanScandinavianScotch-IrishScottishSenegaleseSiouxSlovakSloveneSouth AmericanSpaniardSpanishSpanish AmericanSpanish American IndianSri LankanSubsaharan AfricanSwedishSwissSyrianThaiTohono O'OdhamTonganTurkishUkrainianVenezuelanWelshWest IndianYaquiYugoslavian
Ancestry (Percentage)
AfghanAfricanAmericanApacheArabArgentineanArmenianAustrianBarbadianBasqueBelgianBelizeanBhutaneseBlackfeetBolivianBrazilianBritishBurmeseCajunCanadianCentral AmericanCentral American IndianCherokeeCheyenneChickasawChileanChippewaChoctawColombianComancheCosta RicanCreeCreekCroatianCubanCzechCzechoslovakianDanishDominicanDutchEastern EuropeanEcuadorianEgyptianEnglishEthiopianEuropeanFilipinoFinnishFrenchFrench CanadianGermanGerman RussianGhanaianGreekGuamanian / ChamorroGuatemalanHaitianHonduranHopiHungarianIndian (Asian)IndonesianInupiatIranianIrishIroquoisItalianJamaicanJapaneseJordanianKoreanLaotianLebaneseLithuanianLumbeeLuxembourgerMexicanMexican American IndianMongolianMoroccanNative HawaiianNavajoNicaraguanNigerianNorthern EuropeanNorwegianOttawaPakistaniPanamanianPeruvianPimaPolishPortuguesePotawatomiPuebloPuerto RicanRomanianRussianSalvadoranSamoanScandinavianScotch-IrishScottishSenegaleseSiouxSlovakSloveneSouth AmericanSpaniardSpanishSpanish AmericanSpanish American IndianSri LankanSubsaharan AfricanSwedishSwissSyrianThaiTohono O'OdhamTonganTurkishUkrainianVenezuelanWelshWest IndianYaquiYugoslavian
Immigrant Origin (Total)
Immigrant Origin (Percentage)
Income
Income (Families)
Income (Households)
Poverty
Poverty (Families)
Unemployment
Employment Occupations
Employment Industries
Employer Class
Commute Time
Commute Means
School Enrollment
Education by Degree Field
Occupancy
Finances
Physical Characteristics
El Paso
Compare Zip Codes
Comparison Subject

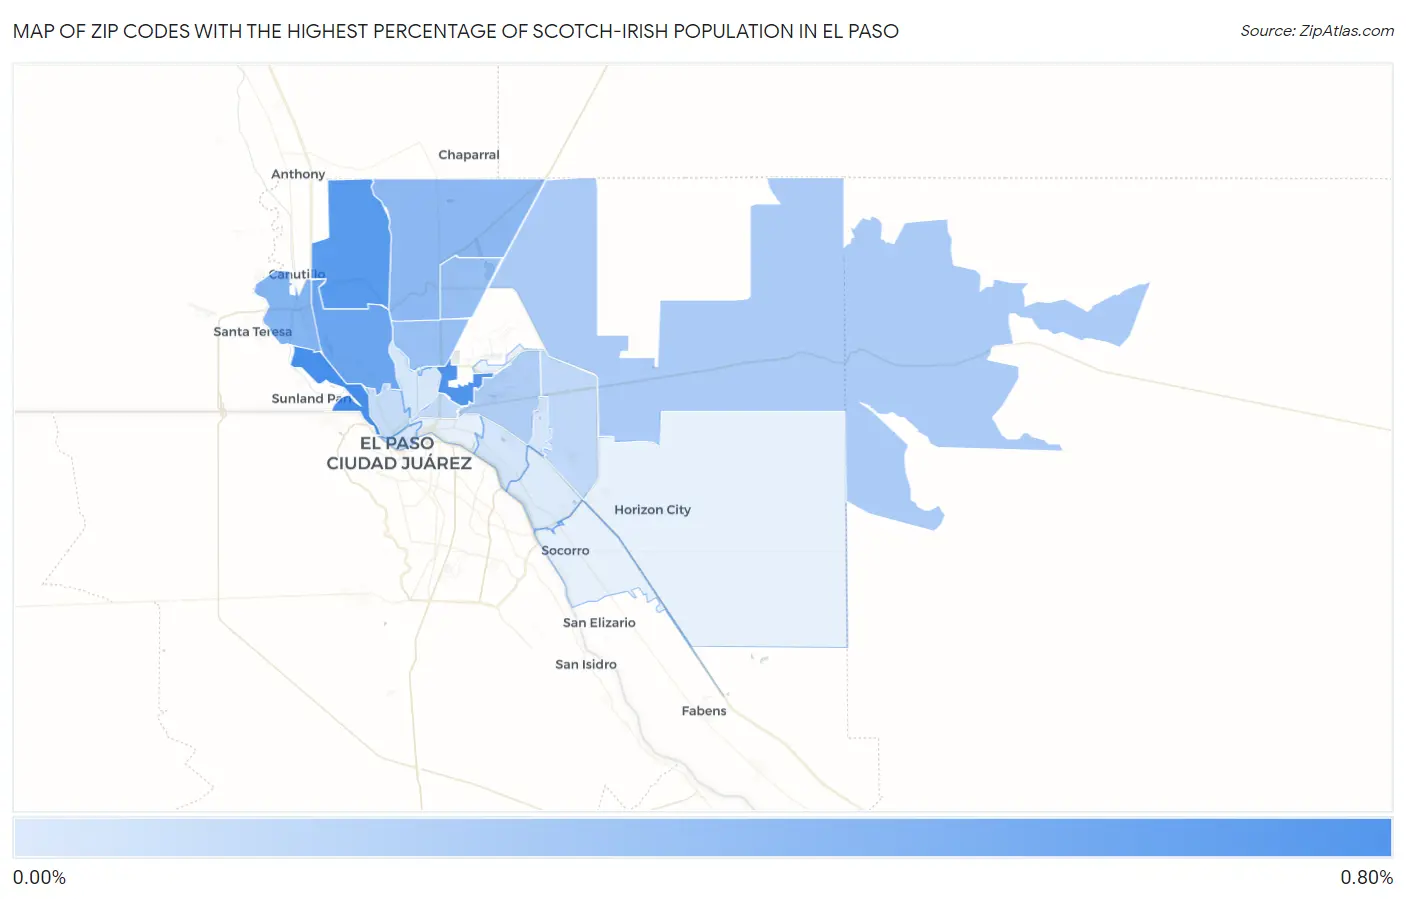
Map of Zip Codes with the Highest Percentage of Scotch-Irish Population in El Paso

0.00%
0.80%
Zip Codes with the Highest Percentage of Scotch-Irish Population in El Paso Map

Zip Codes with the Highest Percentage of Scotch-Irish Population in El Paso, TX

Zip Code Scotch-Irish vs State vs National
1.799220.60%0.79%(-0.183)#9300.82%(-0.215)#14,791
2.799060.57%0.79%(-0.217)#9570.82%(-0.248)#15,305
3.799110.54%0.79%(-0.243)#9780.82%(-0.275)#15,712
4.799120.46%0.79%(-0.324)#1,0640.82%(-0.356)#17,039
5.799320.37%0.79%(-0.417)#1,1350.82%(-0.449)#18,572
6.799340.33%0.79%(-0.452)#1,1720.82%(-0.484)#19,164
7.799040.29%0.79%(-0.495)#1,2090.82%(-0.527)#19,888
8.799240.28%0.79%(-0.503)#1,2190.82%(-0.534)#20,006
9.799380.22%0.79%(-0.568)#1,2770.82%(-0.600)#21,140
10.799250.19%0.79%(-0.591)#1,2990.82%(-0.623)#21,550
11.799360.14%0.79%(-0.650)#1,3490.82%(-0.682)#22,509
12.799030.11%0.79%(-0.672)#1,3700.82%(-0.703)#22,846
13.799020.10%0.79%(-0.681)#1,3770.82%(-0.713)#22,991
14.799350.053%0.79%(-0.733)#1,4200.82%(-0.765)#23,614
15.799150.049%0.79%(-0.737)#1,4230.82%(-0.769)#23,659
16.799300.046%0.79%(-0.740)#1,4270.82%(-0.772)#23,691
17.799010.046%0.79%(-0.740)#1,4280.82%(-0.772)#23,697
18.799070.016%0.79%(-0.770)#1,4530.82%(-0.802)#23,942

Common Questions

What are the Top 10 Zip Codes with the Highest Percentage of Scotch-Irish Population in El Paso, TX?
Top 10 Zip Codes with the Highest Percentage of Scotch-Irish Population in El Paso, TX are:
#1
0.60%
#2
0.57%
#3
0.54%
#4
0.46%
#5
0.37%
#6
0.33%
#7
0.29%
#8
0.28%
#9
0.22%
#10
0.19%
What zip code has the Highest Percentage of Scotch-Irish Population in El Paso, TX?
79922 has the Highest Percentage of Scotch-Irish Population in El Paso, TX with 0.60%.
What is the Percentage of Scotch-Irish Population in El Paso, TX?
Percentage of Scotch-Irish Population in El Paso is 0.20%.
What is the Percentage of Scotch-Irish Population in Texas?
Percentage of Scotch-Irish Population in Texas is 0.79%.
What is the Percentage of Scotch-Irish Population in the United States?
Percentage of Scotch-Irish Population in the United States is 0.82%.