Zip Codes with the Highest Percentage of Households with Income Below $10,000 in El Paso, TX
RELATED REPORTS & OPTIONS
Household Income | $0-10k
El Paso
Compare Zip Codes
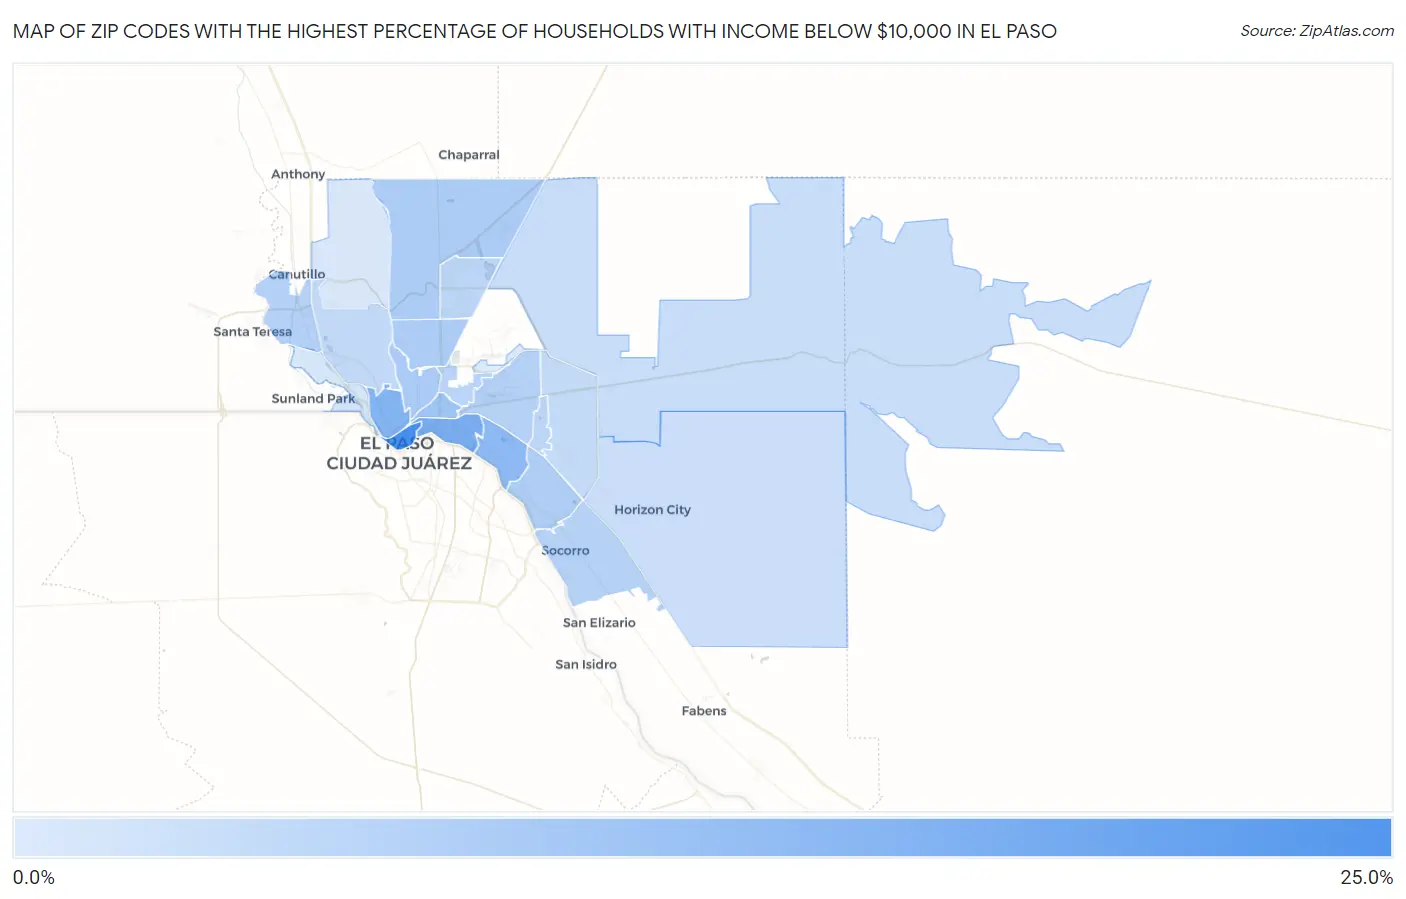
Map of Zip Codes with the Highest Percentage of Households with Income Below $10,000 in El Paso
1.7%
24.4%
Zip Codes with the Highest Percentage of Households with Income Below $10,000 in El Paso, TX
| Zip Code | Households with Income < $10k | vs State | vs National | |
| 1. | 79901 | 24.4% | 5.1%(+19.3)#25 | 4.9%(+19.5)#513 |
| 2. | 79905 | 16.2% | 5.1%(+11.1)#64 | 4.9%(+11.3)#1,291 |
| 3. | 79902 | 14.9% | 5.1%(+9.80)#71 | 4.9%(+10.00)#1,540 |
| 4. | 79915 | 13.1% | 5.1%(+8.00)#104 | 4.9%(+8.20)#2,022 |
| 5. | 79903 | 10.6% | 5.1%(+5.50)#183 | 4.9%(+5.70)#3,178 |
| 6. | 79930 | 8.8% | 5.1%(+3.70)#295 | 4.9%(+3.90)#4,615 |
| 7. | 79904 | 8.5% | 5.1%(+3.40)#321 | 4.9%(+3.60)#4,923 |
| 8. | 79934 | 8.4% | 5.1%(+3.30)#326 | 4.9%(+3.50)#5,030 |
| 9. | 79907 | 8.2% | 5.1%(+3.10)#347 | 4.9%(+3.30)#5,286 |
| 10. | 79932 | 7.6% | 5.1%(+2.50)#401 | 4.9%(+2.70)#6,071 |
| 11. | 79927 | 7.3% | 5.1%(+2.20)#437 | 4.9%(+2.40)#6,473 |
| 12. | 79925 | 7.3% | 5.1%(+2.20)#439 | 4.9%(+2.40)#6,477 |
| 13. | 79906 | 6.4% | 5.1%(+1.30)#562 | 4.9%(+1.50)#8,191 |
| 14. | 79924 | 6.3% | 5.1%(+1.20)#568 | 4.9%(+1.40)#8,290 |
| 15. | 79935 | 6.1% | 5.1%(+1.00)#599 | 4.9%(+1.20)#8,781 |
| 16. | 79912 | 5.7% | 5.1%(+0.600)#654 | 4.9%(+0.800)#9,682 |
| 17. | 79936 | 5.3% | 5.1%(+0.200)#713 | 4.9%(+0.400)#10,706 |
| 18. | 79938 | 4.6% | 5.1%(-0.500)#847 | 4.9%(-0.300)#12,946 |
| 19. | 79928 | 4.3% | 5.1%(-0.800)#904 | 4.9%(-0.600)#14,016 |
| 20. | 79922 | 2.5% | 5.1%(-2.60)#1,336 | 4.9%(-2.40)#21,709 |
| 21. | 79911 | 2.3% | 5.1%(-2.80)#1,374 | 4.9%(-2.60)#22,553 |
| 22. | 79908 | 1.7% | 5.1%(-3.40)#1,505 | 4.9%(-3.20)#24,841 |
1
Common Questions
What are the Top 10 Zip Codes with the Highest Percentage of Households with Income Below $10,000 in El Paso, TX?
Top 10 Zip Codes with the Highest Percentage of Households with Income Below $10,000 in El Paso, TX are:
What zip code has the Highest Percentage of Households with Income Below $10,000 in El Paso, TX?
79901 has the Highest Percentage of Households with Income Below $10,000 in El Paso, TX with 24.4%.
What is the Percentage of Households with Income Below $10,000 in El Paso, TX?
Percentage of Households with Income Below $10,000 in El Paso is 7.6%.
What is the Percentage of Households with Income Below $10,000 in Texas?
Percentage of Households with Income Below $10,000 in Texas is 5.1%.
What is the Percentage of Households with Income Below $10,000 in the United States?
Percentage of Households with Income Below $10,000 in the United States is 4.9%.