Zip Codes with the Highest Percentage of Self-Employed / Not Incorporated in El Paso, TX
RELATED REPORTS & OPTIONS
Self-Employed / Not Incorporated
El Paso
Compare Zip Codes
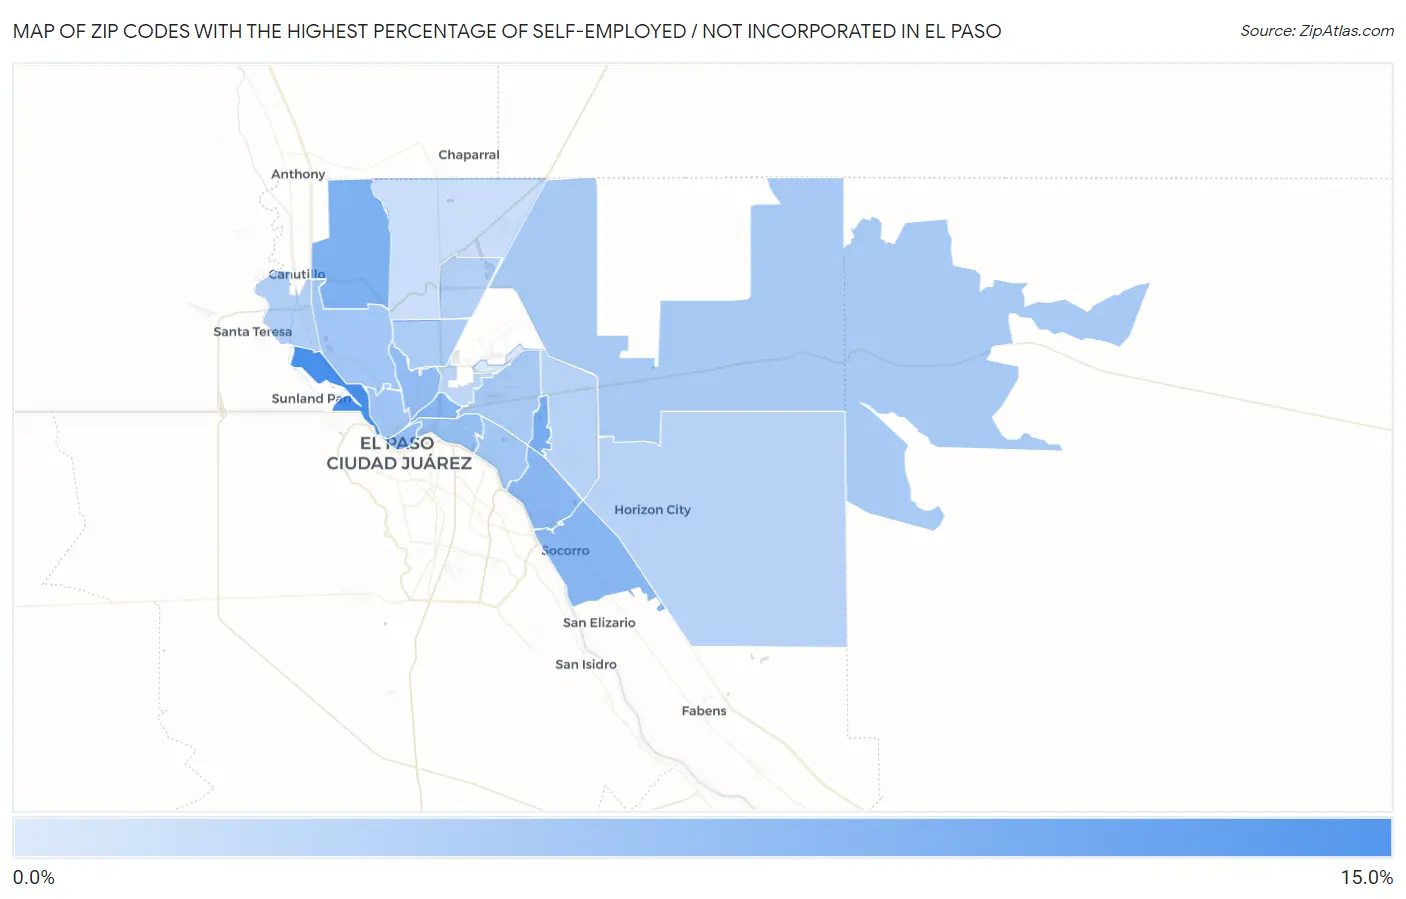
Map of Zip Codes with the Highest Percentage of Self-Employed / Not Incorporated in El Paso
0.0%
15.0%
Zip Codes with the Highest Percentage of Self-Employed / Not Incorporated in El Paso, TX
| Zip Code | % Self-Employed / Not Incorporated | vs State | vs National | |
| 1. | 79922 | 14.9% | 6.7%(+8.15)#185 | 5.8%(+9.06)#3,480 |
| 2. | 79935 | 10.0% | 6.7%(+3.27)#464 | 5.8%(+4.19)#7,350 |
| 3. | 79911 | 9.4% | 6.7%(+2.62)#539 | 5.8%(+3.54)#8,235 |
| 4. | 79903 | 8.8% | 6.7%(+2.08)#606 | 5.8%(+3.00)#9,129 |
| 5. | 79927 | 8.3% | 6.7%(+1.59)#679 | 5.8%(+2.51)#10,021 |
| 6. | 79907 | 8.2% | 6.7%(+1.42)#703 | 5.8%(+2.34)#10,345 |
| 7. | 79930 | 7.5% | 6.7%(+0.814)#819 | 5.8%(+1.73)#11,671 |
| 8. | 79901 | 7.1% | 6.7%(+0.327)#910 | 5.8%(+1.24)#12,873 |
| 9. | 79905 | 7.0% | 6.7%(+0.269)#921 | 5.8%(+1.19)#13,046 |
| 10. | 79902 | 6.0% | 6.7%(-0.690)#1,143 | 5.8%(+0.227)#15,927 |
| 11. | 79912 | 5.8% | 6.7%(-0.914)#1,200 | 5.8%(+0.003)#16,651 |
| 12. | 79915 | 5.8% | 6.7%(-0.936)#1,208 | 5.8%(-0.019)#16,723 |
| 13. | 79925 | 5.4% | 6.7%(-1.36)#1,308 | 5.8%(-0.438)#18,214 |
| 14. | 79938 | 5.4% | 6.7%(-1.36)#1,315 | 5.8%(-0.447)#18,255 |
| 15. | 79904 | 4.9% | 6.7%(-1.87)#1,415 | 5.8%(-0.949)#20,156 |
| 16. | 79932 | 4.5% | 6.7%(-2.28)#1,474 | 5.8%(-1.36)#21,764 |
| 17. | 79924 | 4.0% | 6.7%(-2.71)#1,526 | 5.8%(-1.79)#23,309 |
| 18. | 79936 | 3.9% | 6.7%(-2.86)#1,552 | 5.8%(-1.94)#23,830 |
| 19. | 79928 | 3.7% | 6.7%(-2.99)#1,565 | 5.8%(-2.07)#24,247 |
| 20. | 79906 | 3.5% | 6.7%(-3.27)#1,592 | 5.8%(-2.35)#25,109 |
| 21. | 79934 | 2.2% | 6.7%(-4.53)#1,679 | 5.8%(-3.61)#27,948 |
| 22. | 79908 | 0.44% | 6.7%(-6.29)#1,734 | 5.8%(-5.37)#29,421 |
1
Common Questions
What are the Top 10 Zip Codes with the Highest Percentage of Self-Employed / Not Incorporated in El Paso, TX?
Top 10 Zip Codes with the Highest Percentage of Self-Employed / Not Incorporated in El Paso, TX are:
What zip code has the Highest Percentage of Self-Employed / Not Incorporated in El Paso, TX?
79922 has the Highest Percentage of Self-Employed / Not Incorporated in El Paso, TX with 14.9%.
What is the Percentage of Self-Employed / Not Incorporated in El Paso, TX?
Percentage of Self-Employed / Not Incorporated in El Paso is 5.6%.
What is the Percentage of Self-Employed / Not Incorporated in Texas?
Percentage of Self-Employed / Not Incorporated in Texas is 6.7%.
What is the Percentage of Self-Employed / Not Incorporated in the United States?
Percentage of Self-Employed / Not Incorporated in the United States is 5.8%.