Palmas, PR Map & Demographics
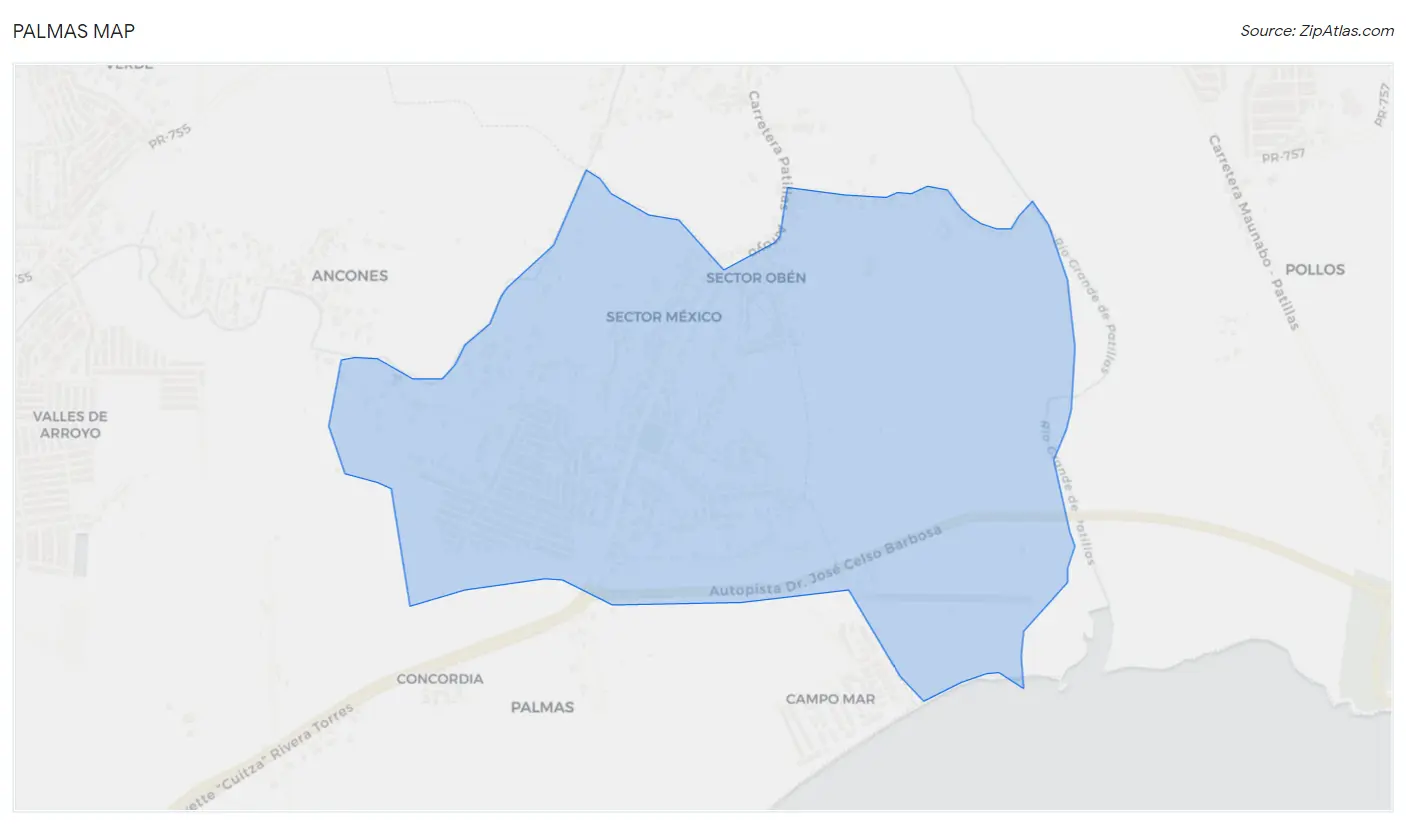
Palmas Map
Palmas Overview
$11,860
PER CAPITA INCOME
$18,576
AVG FAMILY INCOME
$18,634
AVG HOUSEHOLD INCOME
$9,261
FAMILY INCOME DEFICIT
0.45
INEQUALITY / GINI INDEX
1,061
TOTAL POPULATION
482
MALE POPULATION
579
FEMALE POPULATION
83.25
MALES / 100 FEMALES
120.12
FEMALES / 100 MALES
51.7
MEDIAN AGE
2.8
AVG FAMILY SIZE
2.2
AVG HOUSEHOLD SIZE
240
LABOR FORCE [ PEOPLE ]
25.1%
PERCENT IN LABOR FORCE
9.2%
UNEMPLOYMENT RATE
Income in Palmas
Income Overview in Palmas
Per Capita Income in Palmas is $11,860, while median incomes of families and households are $18,576 and $18,634 respectively.
| Characteristic | Number | Measure |
| Per Capita Income | 1,061 | $11,860 |
| Median Family Income | 288 | $18,576 |
| Mean Family Income | 288 | $24,748 |
| Median Household Income | 468 | $18,634 |
| Mean Household Income | 468 | $24,311 |
| Income Deficit | 288 | $9,261 |
| Wage / Income Gap (%) | 1,061 | 0.00% |
| Wage / Income Gap ($) | 1,061 | 100.00¢ per $1 |
| Gini / Inequality Index | 1,061 | 0.45 |
Earnings by Sex in Palmas
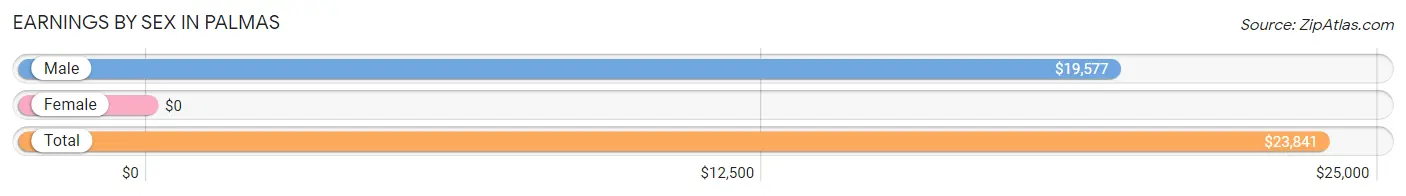
| Sex | Number | Average Earnings |
| Male | 153 (70.2%) | $19,577 |
| Female | 65 (29.8%) | $0 |
| Total | 218 (100.0%) | $23,841 |
Earnings by Sex by Income Bracket in Palmas
The most common earnings brackets in Palmas are $17,500 to $19,999 for men (62 | 40.5%) and $25,000 to $29,999 for women (65 | 100.0%).
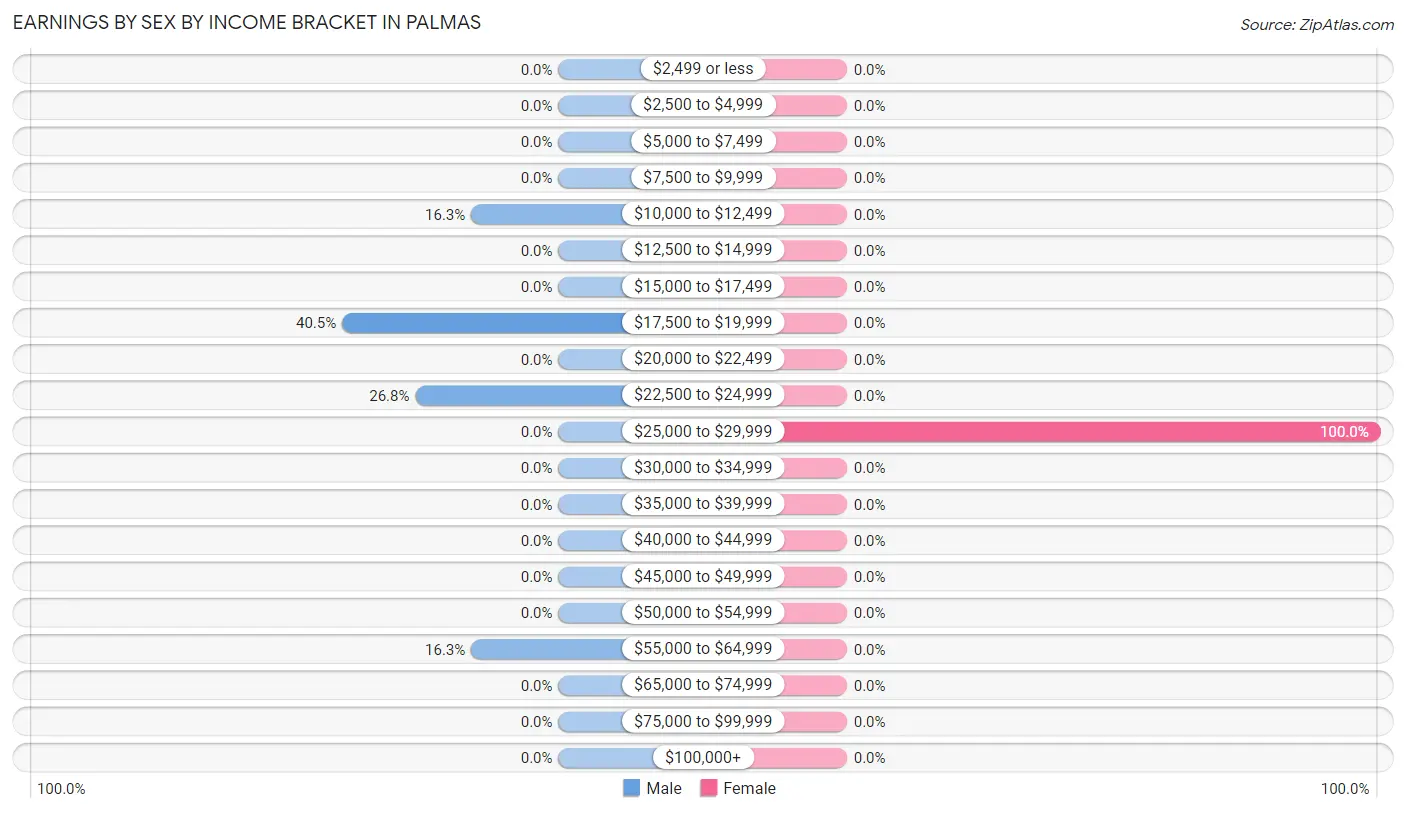
| Income | Male | Female |
| $2,499 or less | 0 (0.0%) | 0 (0.0%) |
| $2,500 to $4,999 | 0 (0.0%) | 0 (0.0%) |
| $5,000 to $7,499 | 0 (0.0%) | 0 (0.0%) |
| $7,500 to $9,999 | 0 (0.0%) | 0 (0.0%) |
| $10,000 to $12,499 | 25 (16.3%) | 0 (0.0%) |
| $12,500 to $14,999 | 0 (0.0%) | 0 (0.0%) |
| $15,000 to $17,499 | 0 (0.0%) | 0 (0.0%) |
| $17,500 to $19,999 | 62 (40.5%) | 0 (0.0%) |
| $20,000 to $22,499 | 0 (0.0%) | 0 (0.0%) |
| $22,500 to $24,999 | 41 (26.8%) | 0 (0.0%) |
| $25,000 to $29,999 | 0 (0.0%) | 65 (100.0%) |
| $30,000 to $34,999 | 0 (0.0%) | 0 (0.0%) |
| $35,000 to $39,999 | 0 (0.0%) | 0 (0.0%) |
| $40,000 to $44,999 | 0 (0.0%) | 0 (0.0%) |
| $45,000 to $49,999 | 0 (0.0%) | 0 (0.0%) |
| $50,000 to $54,999 | 0 (0.0%) | 0 (0.0%) |
| $55,000 to $64,999 | 25 (16.3%) | 0 (0.0%) |
| $65,000 to $74,999 | 0 (0.0%) | 0 (0.0%) |
| $75,000 to $99,999 | 0 (0.0%) | 0 (0.0%) |
| $100,000+ | 0 (0.0%) | 0 (0.0%) |
| Total | 153 (100.0%) | 65 (100.0%) |
Earnings by Sex by Educational Attainment in Palmas
| Educational Attainment | Male Income | Female Income |
| Less than High School | - | - |
| High School Diploma | - | - |
| College or Associate's Degree | - | - |
| Bachelor's Degree | - | - |
| Graduate Degree | - | - |
| Total | - | - |
Family Income in Palmas
Family Income Brackets in Palmas
According to the Palmas family income data, there are 113 families falling into the $15,000 to $24,999 income range, which is the most common income bracket and makes up 39.2% of all families.
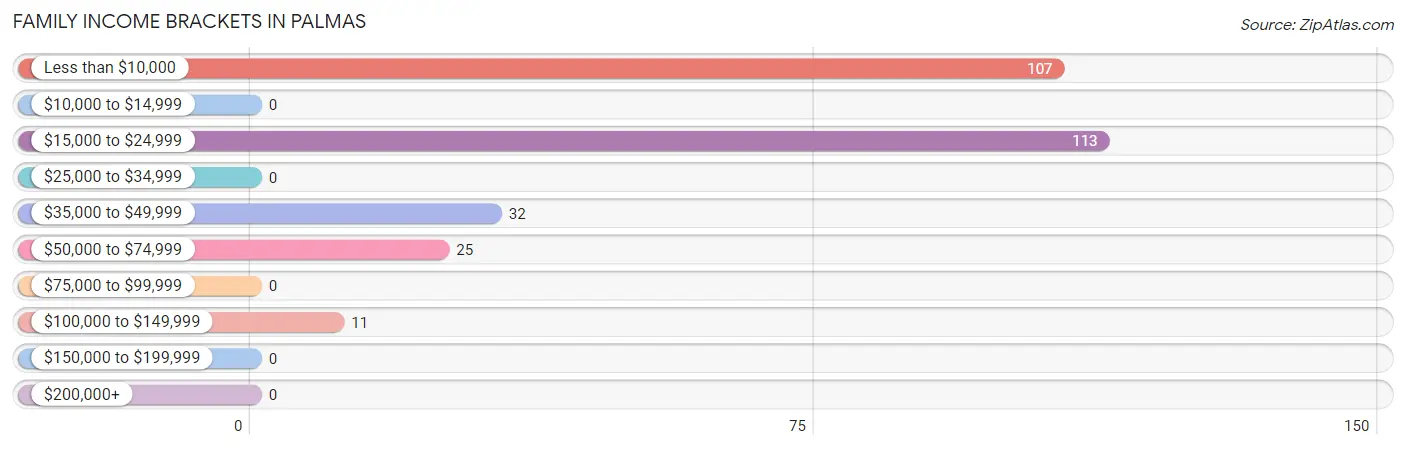
| Income Bracket | # Families | % Families |
| Less than $10,000 | 107 | 37.2% |
| $10,000 to $14,999 | 0 | 0.0% |
| $15,000 to $24,999 | 113 | 39.2% |
| $25,000 to $34,999 | 0 | 0.0% |
| $35,000 to $49,999 | 32 | 11.1% |
| $50,000 to $74,999 | 25 | 8.7% |
| $75,000 to $99,999 | 0 | 0.0% |
| $100,000 to $149,999 | 11 | 3.8% |
| $150,000 to $199,999 | 0 | 0.0% |
| $200,000+ | 0 | 0.0% |
Family Income by Famaliy Size in Palmas
3-person families (113 | 39.2%) account for the highest median family income in Palmas with $18,554 per family, while 3-person families (113 | 39.2%) have the highest median income of $6,185 per family member.
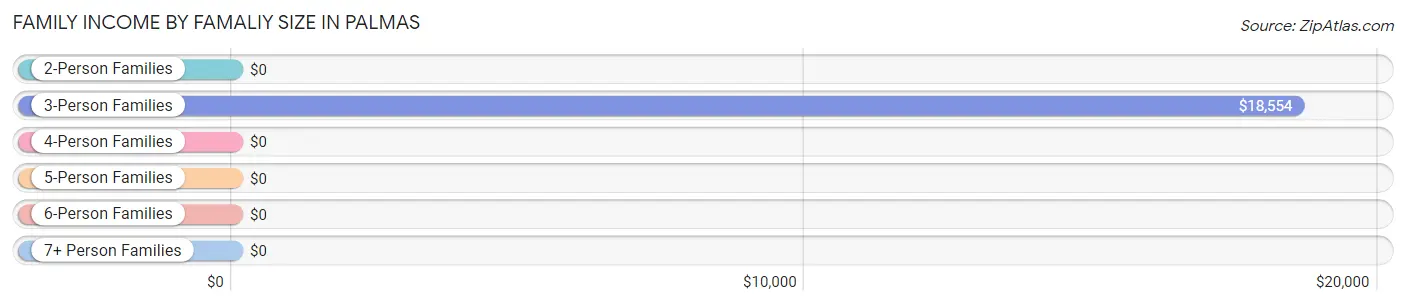
| Income Bracket | # Families | Median Income |
| 2-Person Families | 175 (60.8%) | $0 |
| 3-Person Families | 113 (39.2%) | $18,554 |
| 4-Person Families | 0 (0.0%) | $0 |
| 5-Person Families | 0 (0.0%) | $0 |
| 6-Person Families | 0 (0.0%) | $0 |
| 7+ Person Families | 0 (0.0%) | $0 |
| Total | 288 (100.0%) | $18,576 |
Family Income by Number of Earners in Palmas
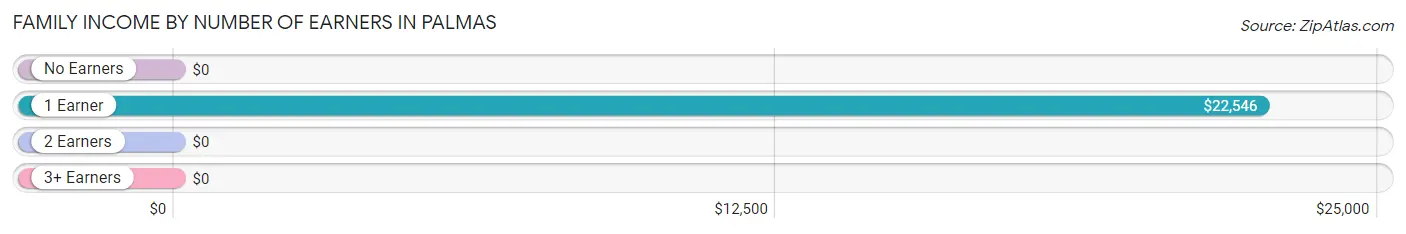
| Number of Earners | # Families | Median Income |
| No Earners | 185 (64.2%) | $0 |
| 1 Earner | 103 (35.8%) | $22,546 |
| 2 Earners | 0 (0.0%) | $0 |
| 3+ Earners | 0 (0.0%) | $0 |
| Total | 288 (100.0%) | $18,576 |
Household Income in Palmas
Household Income Brackets in Palmas
With 123 households falling in the category, the less than $10,000 income range is the most frequent in Palmas, accounting for 26.3% of all households.
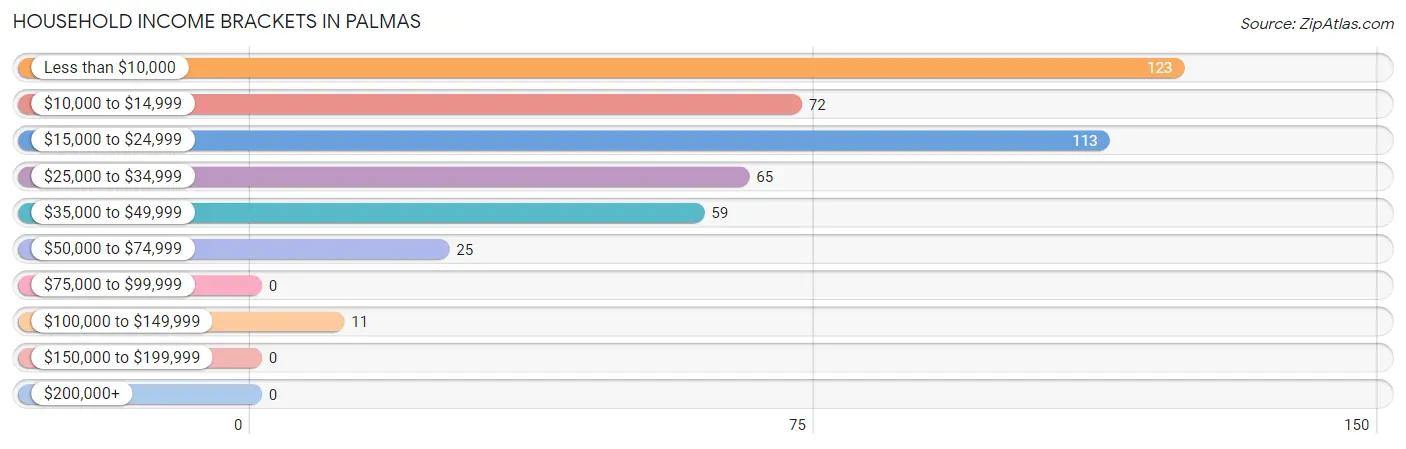
| Income Bracket | # Households | % Households |
| Less than $10,000 | 123 | 26.3% |
| $10,000 to $14,999 | 72 | 15.4% |
| $15,000 to $24,999 | 113 | 24.1% |
| $25,000 to $34,999 | 65 | 13.9% |
| $35,000 to $49,999 | 59 | 12.6% |
| $50,000 to $74,999 | 25 | 5.3% |
| $75,000 to $99,999 | 0 | 0.0% |
| $100,000 to $149,999 | 11 | 2.4% |
| $150,000 to $199,999 | 0 | 0.0% |
| $200,000+ | 0 | 0.0% |
Household Income by Householder Age in Palmas
The median household income in Palmas is $18,634, with the highest median household income of $19,038 found in the 45 to 64 years age bracket for the primary householder. A total of 308 households (65.8%) fall into this category.
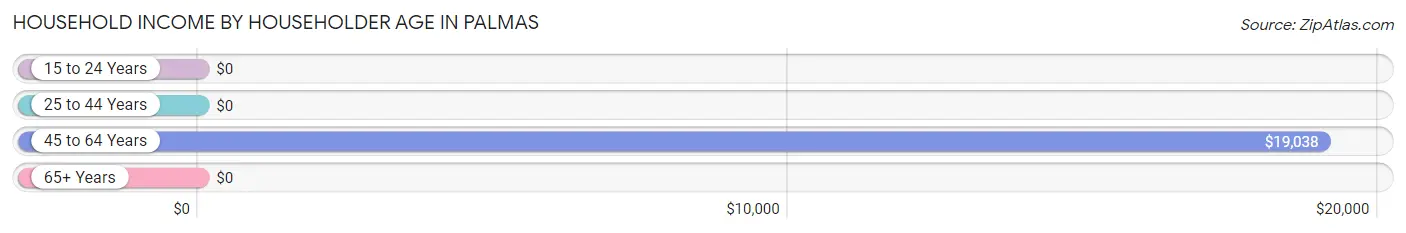
| Income Bracket | # Households | Median Income |
| 15 to 24 Years | 0 (0.0%) | $0 |
| 25 to 44 Years | 38 (8.1%) | $0 |
| 45 to 64 Years | 308 (65.8%) | $19,038 |
| 65+ Years | 122 (26.1%) | $0 |
| Total | 468 (100.0%) | $18,634 |
Poverty in Palmas
Income Below Poverty by Sex and Age in Palmas
With 73.0% poverty level for males and 67.6% for females among the residents of Palmas, 18 to 24 year old males and 6 to 11 year old females are the most vulnerable to poverty, with 87 males (100.0%) and 34 females (100.0%) in their respective age groups living below the poverty level.
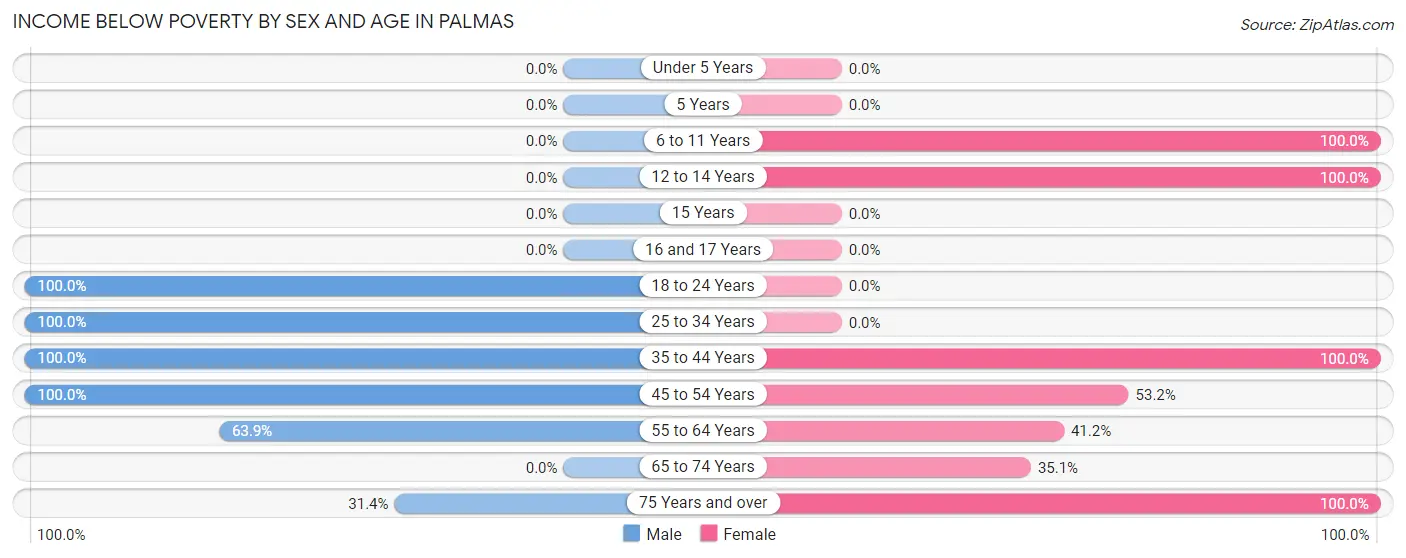
| Age Bracket | Male | Female |
| Under 5 Years | 0 (0.0%) | 0 (0.0%) |
| 5 Years | 0 (0.0%) | 0 (0.0%) |
| 6 to 11 Years | 0 (0.0%) | 34 (100.0%) |
| 12 to 14 Years | 0 (0.0%) | 69 (100.0%) |
| 15 Years | 0 (0.0%) | 0 (0.0%) |
| 16 and 17 Years | 0 (0.0%) | 0 (0.0%) |
| 18 to 24 Years | 87 (100.0%) | 0 (0.0%) |
| 25 to 34 Years | 66 (100.0%) | 0 (0.0%) |
| 35 to 44 Years | 41 (100.0%) | 83 (100.0%) |
| 45 to 54 Years | 41 (100.0%) | 74 (53.2%) |
| 55 to 64 Years | 101 (63.9%) | 40 (41.2%) |
| 65 to 74 Years | 0 (0.0%) | 33 (35.1%) |
| 75 Years and over | 16 (31.4%) | 49 (100.0%) |
| Total | 352 (73.0%) | 382 (67.6%) |
Income Above Poverty by Sex and Age in Palmas
According to the poverty statistics in Palmas, males aged 65 to 74 years and females aged 65 to 74 years are the age groups that are most secure financially, with 100.0% of males and 64.9% of females in these age groups living above the poverty line.
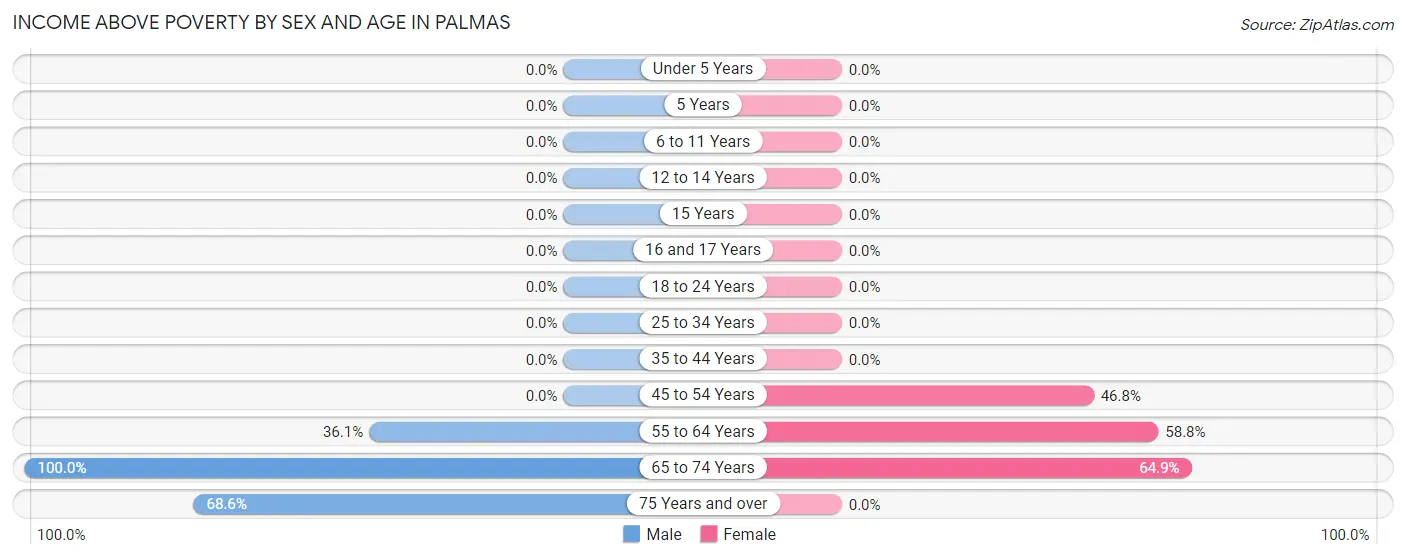
| Age Bracket | Male | Female |
| Under 5 Years | 0 (0.0%) | 0 (0.0%) |
| 5 Years | 0 (0.0%) | 0 (0.0%) |
| 6 to 11 Years | 0 (0.0%) | 0 (0.0%) |
| 12 to 14 Years | 0 (0.0%) | 0 (0.0%) |
| 15 Years | 0 (0.0%) | 0 (0.0%) |
| 16 and 17 Years | 0 (0.0%) | 0 (0.0%) |
| 18 to 24 Years | 0 (0.0%) | 0 (0.0%) |
| 25 to 34 Years | 0 (0.0%) | 0 (0.0%) |
| 35 to 44 Years | 0 (0.0%) | 0 (0.0%) |
| 45 to 54 Years | 0 (0.0%) | 65 (46.8%) |
| 55 to 64 Years | 57 (36.1%) | 57 (58.8%) |
| 65 to 74 Years | 38 (100.0%) | 61 (64.9%) |
| 75 Years and over | 35 (68.6%) | 0 (0.0%) |
| Total | 130 (27.0%) | 183 (32.4%) |
Income Below Poverty Among Married-Couple Families in Palmas
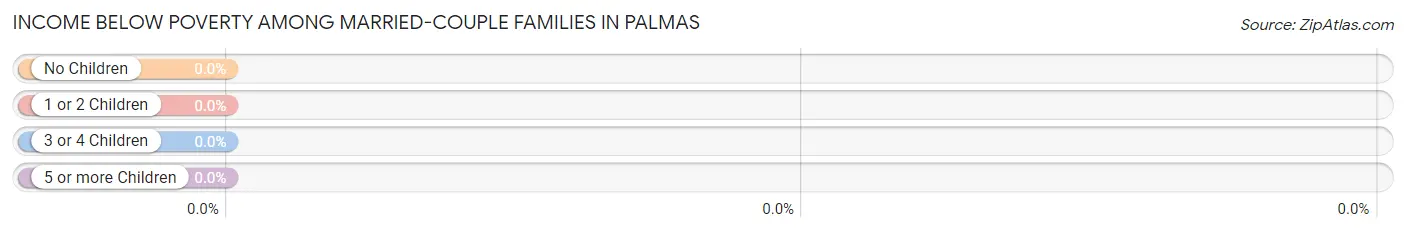
| Children | Above Poverty | Below Poverty |
| No Children | 68 (100.0%) | 0 (0.0%) |
| 1 or 2 Children | 0 (0.0%) | 0 (0.0%) |
| 3 or 4 Children | 0 (0.0%) | 0 (0.0%) |
| 5 or more Children | 0 (0.0%) | 0 (0.0%) |
| Total | 68 (100.0%) | 0 (0.0%) |
Income Below Poverty Among Single-Parent Households in Palmas
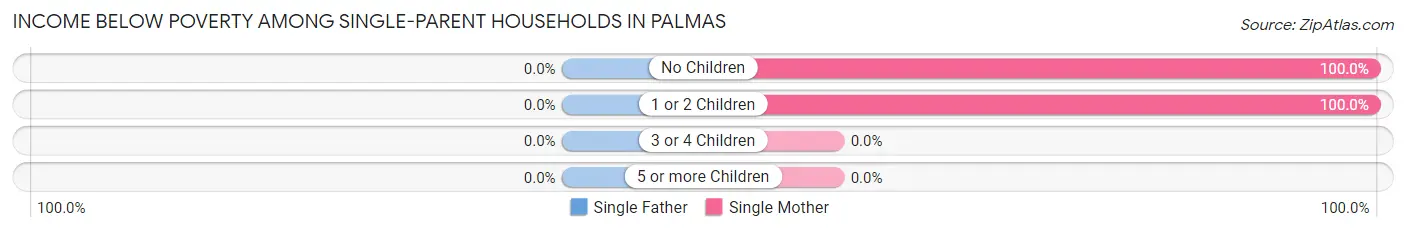
| Children | Single Father | Single Mother |
| No Children | 0 (0.0%) | 112 (100.0%) |
| 1 or 2 Children | 0 (0.0%) | 73 (100.0%) |
| 3 or 4 Children | 0 (0.0%) | 0 (0.0%) |
| 5 or more Children | 0 (0.0%) | 0 (0.0%) |
| Total | 0 (0.0%) | 185 (100.0%) |
Income Below Poverty Among Married-Couple vs Single-Parent Households in Palmas
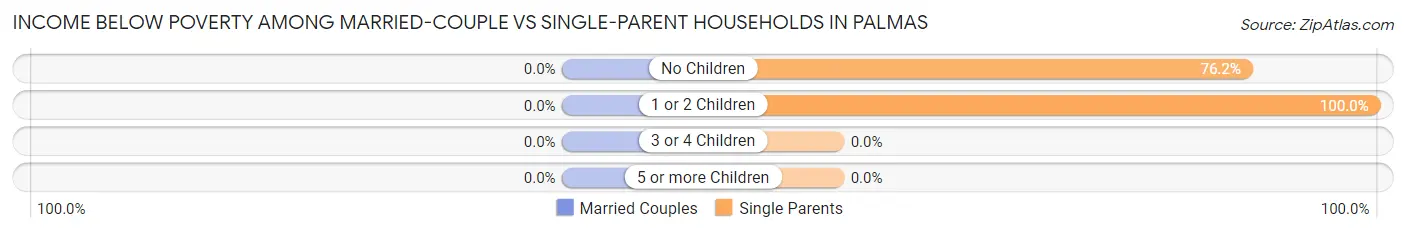
| Children | Married-Couple Families | Single-Parent Households |
| No Children | 0 (0.0%) | 112 (76.2%) |
| 1 or 2 Children | 0 (0.0%) | 73 (100.0%) |
| 3 or 4 Children | 0 (0.0%) | 0 (0.0%) |
| 5 or more Children | 0 (0.0%) | 0 (0.0%) |
| Total | 0 (0.0%) | 185 (84.1%) |
Race in Palmas
The most populous races in Palmas are Hispanic or Latino (1,061 | 100.0%), Some other Race (437 | 41.2%), and White / Caucasian (380 | 35.8%).
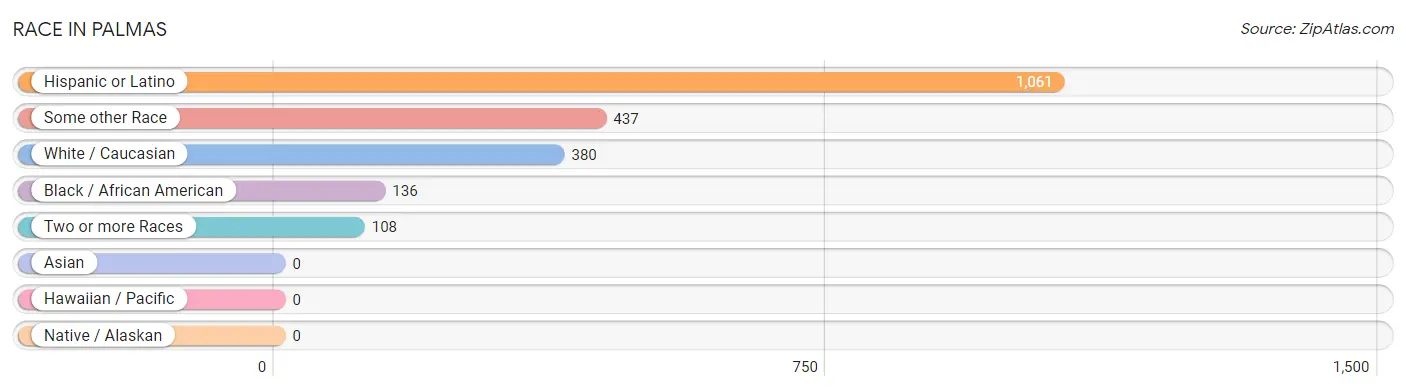
| Race | # Population | % Population |
| Asian | 0 | 0.0% |
| Black / African American | 136 | 12.8% |
| Hawaiian / Pacific | 0 | 0.0% |
| Hispanic or Latino | 1,061 | 100.0% |
| Native / Alaskan | 0 | 0.0% |
| White / Caucasian | 380 | 35.8% |
| Two or more Races | 108 | 10.2% |
| Some other Race | 437 | 41.2% |
| Total | 1,061 | 100.0% |
Ancestry in Palmas
The most populous ancestries reported in Palmas are Puerto Rican (1,061 | 100.0%), Thai (26 | 2.5%), and American (22 | 2.1%), together accounting for 104.5% of all Palmas residents.
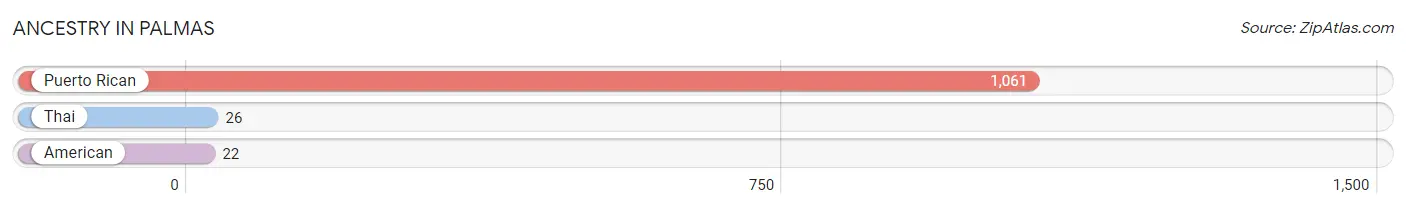
| Ancestry | # Population | % Population |
| American | 22 | 2.1% |
| Puerto Rican | 1,061 | 100.0% |
| Thai | 26 | 2.5% | View All 3 Rows |
Immigrants in Palmas

| Immigration Origin | # Population | % Population | View All 0 Rows |
Sex and Age in Palmas
Sex and Age in Palmas
The most populous age groups in Palmas are 60 to 64 Years (133 | 27.6%) for men and 50 to 54 Years (104 | 18.0%) for women.
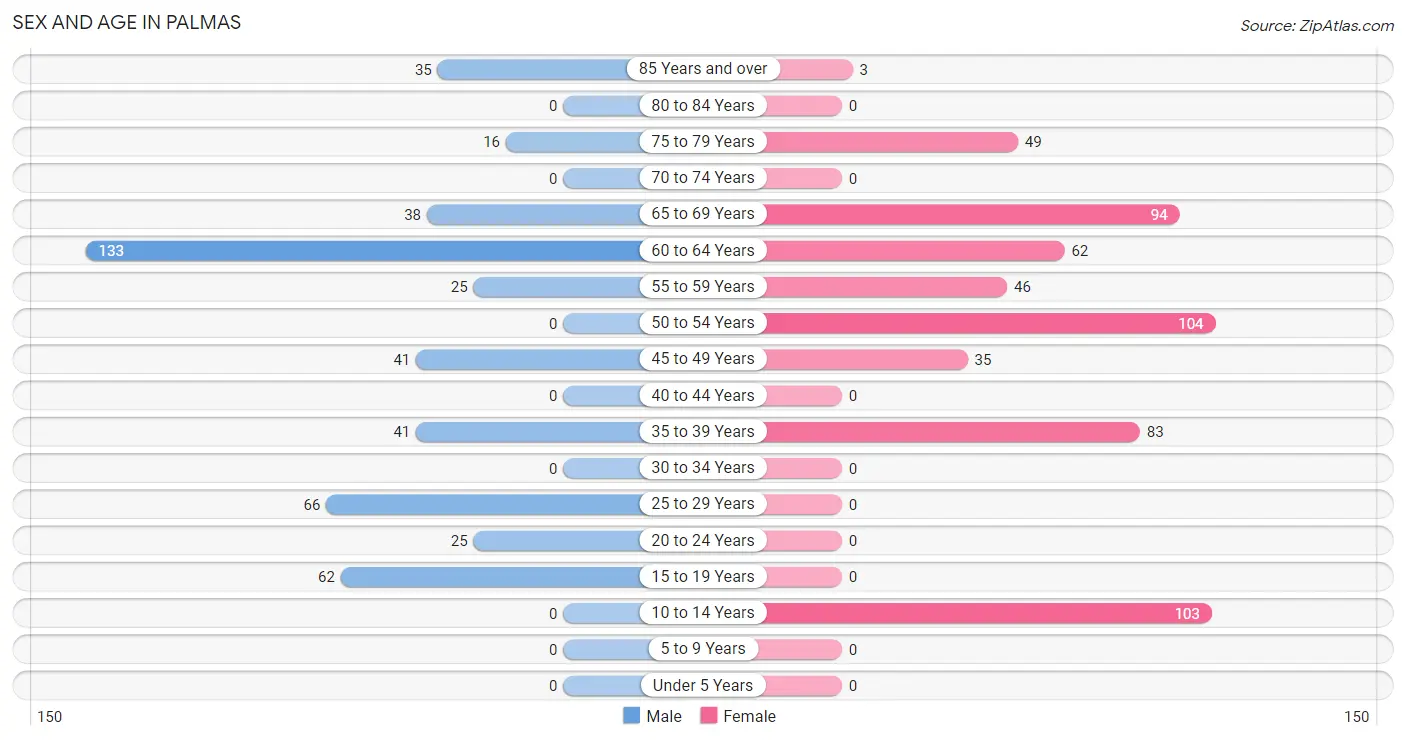
| Age Bracket | Male | Female |
| Under 5 Years | 0 (0.0%) | 0 (0.0%) |
| 5 to 9 Years | 0 (0.0%) | 0 (0.0%) |
| 10 to 14 Years | 0 (0.0%) | 103 (17.8%) |
| 15 to 19 Years | 62 (12.9%) | 0 (0.0%) |
| 20 to 24 Years | 25 (5.2%) | 0 (0.0%) |
| 25 to 29 Years | 66 (13.7%) | 0 (0.0%) |
| 30 to 34 Years | 0 (0.0%) | 0 (0.0%) |
| 35 to 39 Years | 41 (8.5%) | 83 (14.3%) |
| 40 to 44 Years | 0 (0.0%) | 0 (0.0%) |
| 45 to 49 Years | 41 (8.5%) | 35 (6.0%) |
| 50 to 54 Years | 0 (0.0%) | 104 (18.0%) |
| 55 to 59 Years | 25 (5.2%) | 46 (7.9%) |
| 60 to 64 Years | 133 (27.6%) | 62 (10.7%) |
| 65 to 69 Years | 38 (7.9%) | 94 (16.2%) |
| 70 to 74 Years | 0 (0.0%) | 0 (0.0%) |
| 75 to 79 Years | 16 (3.3%) | 49 (8.5%) |
| 80 to 84 Years | 0 (0.0%) | 0 (0.0%) |
| 85 Years and over | 35 (7.3%) | 3 (0.5%) |
| Total | 482 (100.0%) | 579 (100.0%) |
Families and Households in Palmas
Median Family Size in Palmas
The median family size in Palmas is 2.77 persons per family, with single female/mother families (185 | 64.2%) accounting for the largest median family size of 3.11 persons per family. On the other hand, married-couple families (68 | 23.6%) represent the smallest median family size with 2.06 persons per family.
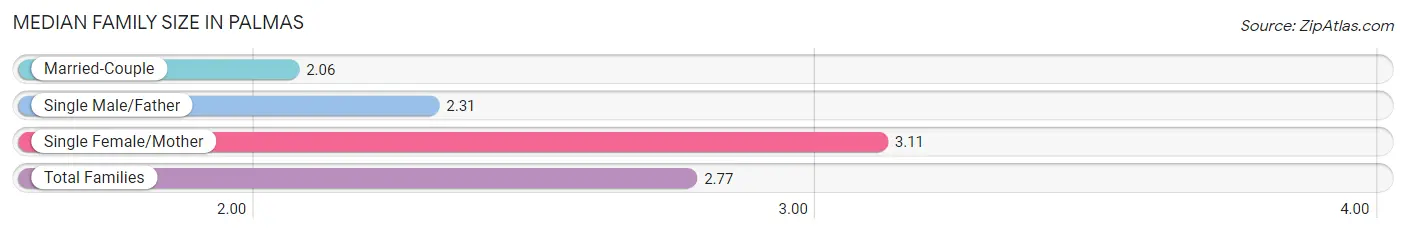
| Family Type | # Families | Family Size |
| Married-Couple | 68 (23.6%) | 2.06 |
| Single Male/Father | 35 (12.1%) | 2.31 |
| Single Female/Mother | 185 (64.2%) | 3.11 |
| Total Families | 288 (100.0%) | 2.77 |
Median Household Size in Palmas
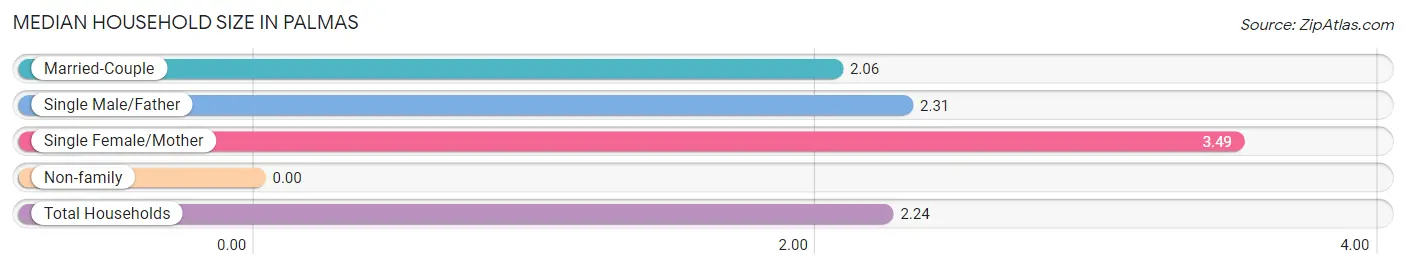
| Household Type | # Households | Household Size |
| Married-Couple | 68 (14.5%) | 2.06 |
| Single Male/Father | 35 (7.5%) | 2.31 |
| Single Female/Mother | 185 (39.5%) | 3.49 |
| Non-family | 180 (38.5%) | - |
| Total Households | 468 (100.0%) | 2.24 |
Household Size by Marriage Status in Palmas
Out of a total of 468 households in Palmas, 288 (61.5%) are family households, while 180 (38.5%) are nonfamily households. The most numerous type of family households are 2-person households, comprising 136, and the most common type of nonfamily households are 1-person households, comprising 180.
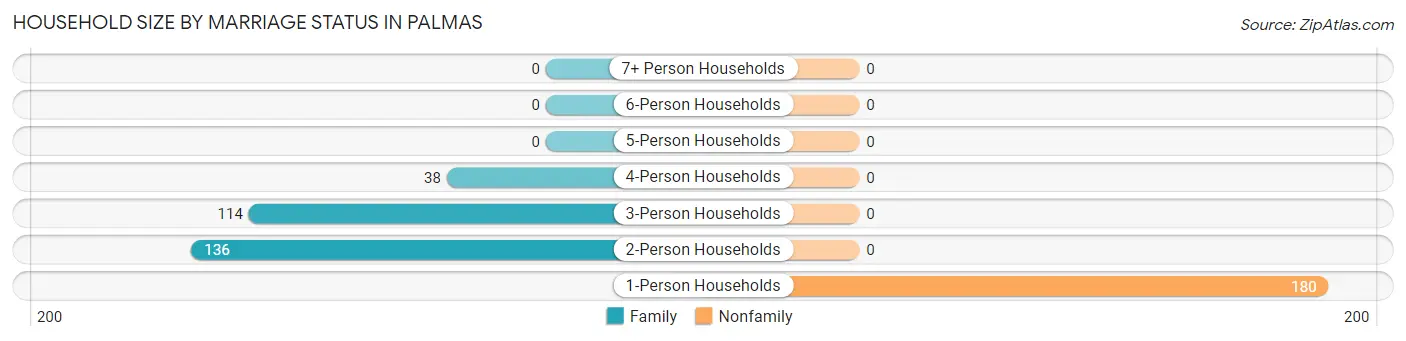
| Household Size | Family Households | Nonfamily Households |
| 1-Person Households | - | 180 (38.5%) |
| 2-Person Households | 136 (29.1%) | 0 (0.0%) |
| 3-Person Households | 114 (24.4%) | 0 (0.0%) |
| 4-Person Households | 38 (8.1%) | 0 (0.0%) |
| 5-Person Households | 0 (0.0%) | 0 (0.0%) |
| 6-Person Households | 0 (0.0%) | 0 (0.0%) |
| 7+ Person Households | 0 (0.0%) | 0 (0.0%) |
| Total | 288 (61.5%) | 180 (38.5%) |
Female Fertility in Palmas
Fertility by Age in Palmas
| Age Bracket | Women with Births | Births / 1,000 Women |
| 15 to 19 years | 0 (0.0%) | 0.0 |
| 20 to 34 years | 0 (0.0%) | 0.0 |
| 35 to 50 years | 0 (0.0%) | 0.0 |
| Total | 0 (0.0%) | 0.0 |
Fertility by Age by Marriage Status in Palmas
| Age Bracket | Married | Unmarried |
| 15 to 19 years | 0 (0.0%) | 0 (0.0%) |
| 20 to 34 years | 0 (0.0%) | 0 (0.0%) |
| 35 to 50 years | 0 (0.0%) | 0 (0.0%) |
| Total | 0 (0.0%) | 0 (0.0%) |
Fertility by Education in Palmas
| Educational Attainment | Women with Births | Births / 1,000 Women |
| Less than High School | 0 (0.0%) | 0.0 |
| High School Diploma | 0 (0.0%) | 0.0 |
| College or Associate's Degree | 0 (0.0%) | 0.0 |
| Bachelor's Degree | 0 (0.0%) | 0.0 |
| Graduate Degree | 0 (0.0%) | 0.0 |
| Total | 0 (0.0%) | 0.0 |
Fertility by Education by Marriage Status in Palmas
| Educational Attainment | Married | Unmarried |
| Less than High School | 0 (0.0%) | 0 (0.0%) |
| High School Diploma | 0 (0.0%) | 0 (0.0%) |
| College or Associate's Degree | 0 (0.0%) | 0 (0.0%) |
| Bachelor's Degree | 0 (0.0%) | 0 (0.0%) |
| Graduate Degree | 0 (0.0%) | 0 (0.0%) |
| Total | 0 (0.0%) | 0 (0.0%) |
Employment Characteristics in Palmas
Employment by Class of Employer in Palmas
Among the 218 employed individuals in Palmas, private company employees (153 | 70.2%), and state government employees (65 | 29.8%) make up the most common classes of employment.
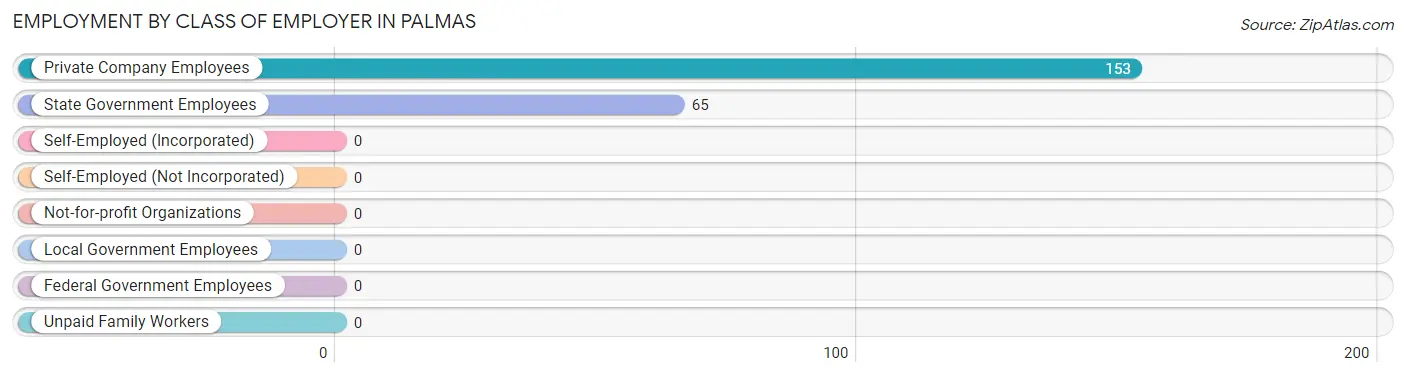
| Employer Class | # Employees | % Employees |
| Private Company Employees | 153 | 70.2% |
| Self-Employed (Incorporated) | 0 | 0.0% |
| Self-Employed (Not Incorporated) | 0 | 0.0% |
| Not-for-profit Organizations | 0 | 0.0% |
| Local Government Employees | 0 | 0.0% |
| State Government Employees | 65 | 29.8% |
| Federal Government Employees | 0 | 0.0% |
| Unpaid Family Workers | 0 | 0.0% |
| Total | 218 | 100.0% |
Employment Status by Age in Palmas
According to the labor force statistics for Palmas, out of the total population over 16 years of age (958), 25.1% or 240 individuals are in the labor force, with 9.2% or 22 of them unemployed. The age group with the highest labor force participation rate is 16 to 19 years, with 100.0% or 62 individuals in the labor force. Within the labor force, the 25 to 29 years age range has the highest percentage of unemployed individuals, with 100.0% or 22 of them being unemployed.
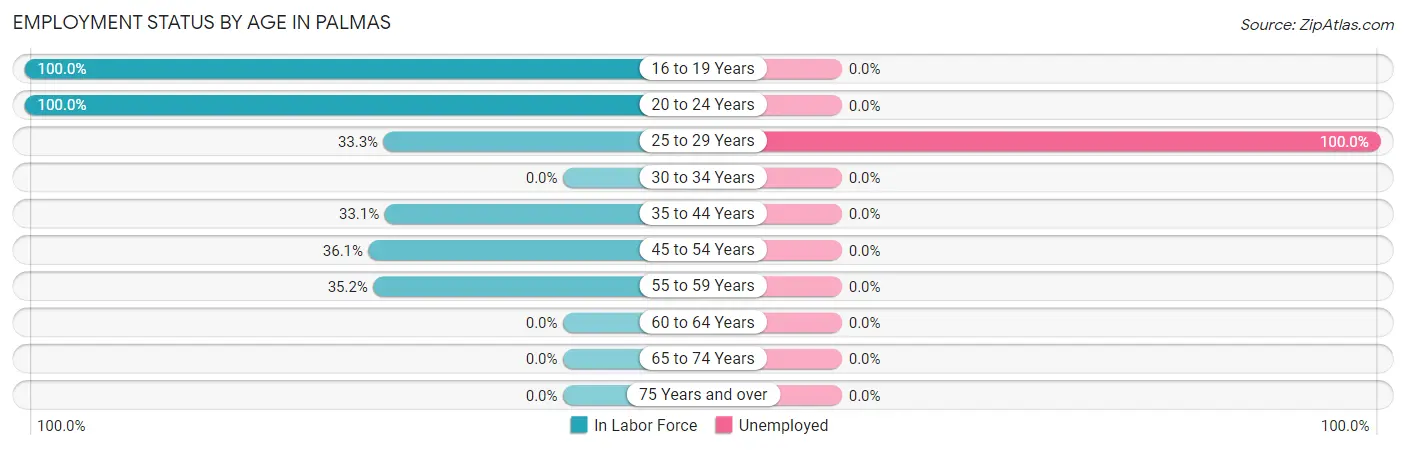
| Age Bracket | In Labor Force | Unemployed |
| 16 to 19 Years | 62 (100.0%) | 0 (0.0%) |
| 20 to 24 Years | 25 (100.0%) | 0 (0.0%) |
| 25 to 29 Years | 22 (33.3%) | 22 (100.0%) |
| 30 to 34 Years | 0 (0.0%) | 0 (0.0%) |
| 35 to 44 Years | 41 (33.1%) | 0 (0.0%) |
| 45 to 54 Years | 65 (36.1%) | 0 (0.0%) |
| 55 to 59 Years | 25 (35.2%) | 0 (0.0%) |
| 60 to 64 Years | 0 (0.0%) | 0 (0.0%) |
| 65 to 74 Years | 0 (0.0%) | 0 (0.0%) |
| 75 Years and over | 0 (0.0%) | 0 (0.0%) |
| Total | 240 (25.1%) | 22 (9.2%) |
Employment Status by Educational Attainment in Palmas
According to labor force statistics for Palmas, 24.1% of individuals (153) out of the total population between 25 and 64 years of age (636) are in the labor force, with 14.4% or 22 of them being unemployed. The group with the highest labor force participation rate are those with the educational attainment of bachelor's degree or higher, with 76.3% or 106 individuals in the labor force. Within the labor force, individuals with high school diploma education have the highest percentage of unemployment, with 100.0% or 22 of them being unemployed.
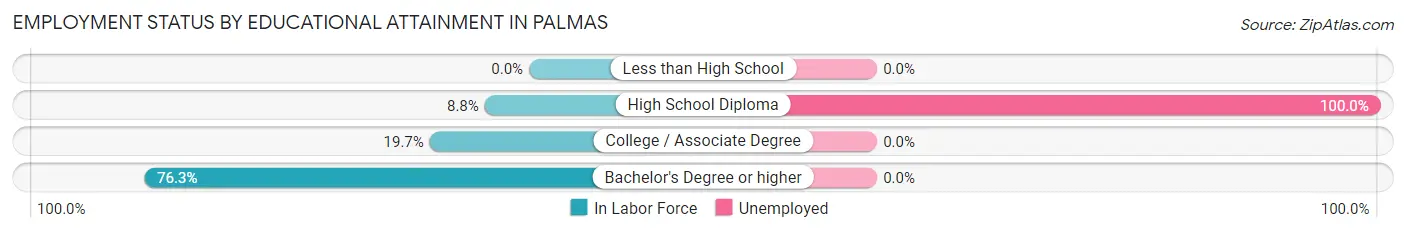
| Educational Attainment | In Labor Force | Unemployed |
| Less than High School | 0 (0.0%) | 0 (0.0%) |
| High School Diploma | 22 (8.8%) | 251 (100.0%) |
| College / Associate Degree | 25 (19.7%) | 0 (0.0%) |
| Bachelor's Degree or higher | 106 (76.3%) | 0 (0.0%) |
| Total | 153 (24.1%) | 92 (14.4%) |
Employment Occupations by Sex in Palmas
Management, Business, Science and Arts Occupations
The most common Management, Business, Science and Arts occupations in Palmas are Business & Financial (65 | 29.8%), Community & Social Service (41 | 18.8%), Education Instruction & Library (41 | 18.8%), Computers, Engineering & Science (25 | 11.5%), and Architecture & Engineering (25 | 11.5%).
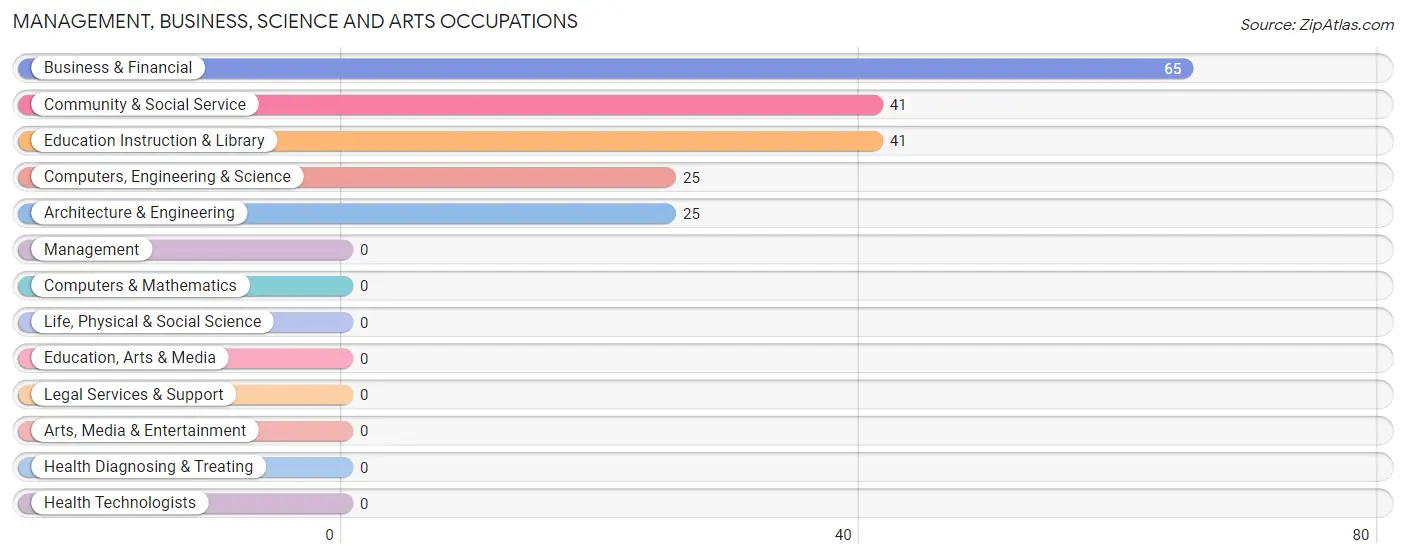
Management, Business, Science and Arts Occupations by Sex
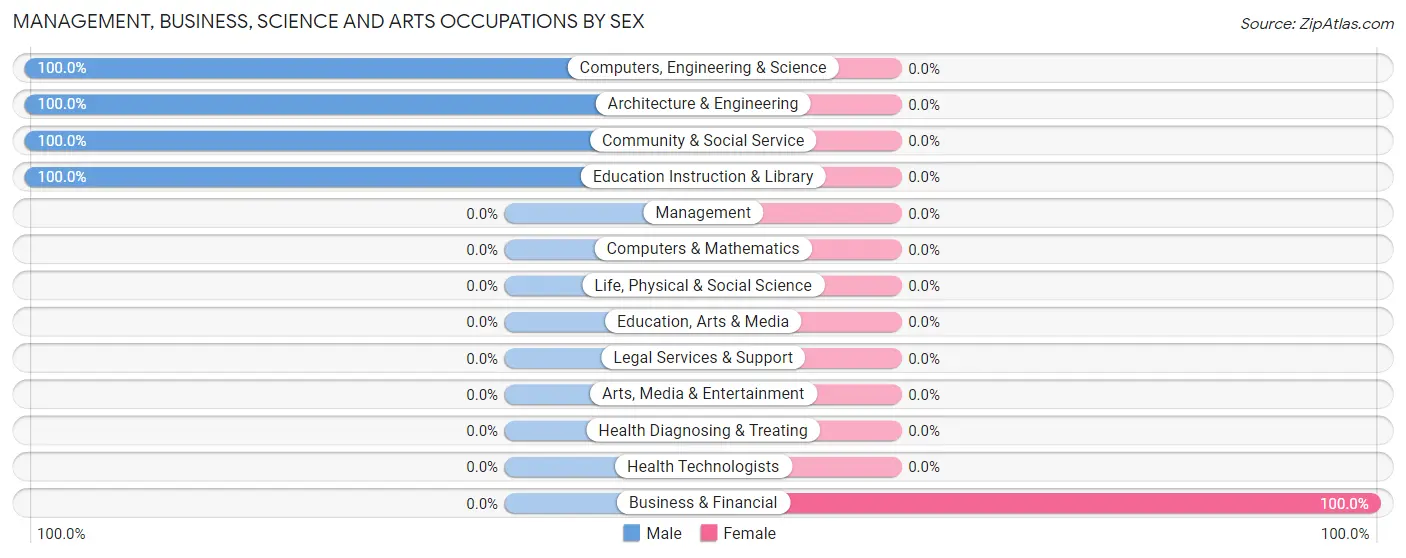
| Occupation | Male | Female |
| Management | 0 (0.0%) | 0 (0.0%) |
| Business & Financial | 0 (0.0%) | 65 (100.0%) |
| Computers, Engineering & Science | 25 (100.0%) | 0 (0.0%) |
| Computers & Mathematics | 0 (0.0%) | 0 (0.0%) |
| Architecture & Engineering | 25 (100.0%) | 0 (0.0%) |
| Life, Physical & Social Science | 0 (0.0%) | 0 (0.0%) |
| Community & Social Service | 41 (100.0%) | 0 (0.0%) |
| Education, Arts & Media | 0 (0.0%) | 0 (0.0%) |
| Legal Services & Support | 0 (0.0%) | 0 (0.0%) |
| Education Instruction & Library | 41 (100.0%) | 0 (0.0%) |
| Arts, Media & Entertainment | 0 (0.0%) | 0 (0.0%) |
| Health Diagnosing & Treating | 0 (0.0%) | 0 (0.0%) |
| Health Technologists | 0 (0.0%) | 0 (0.0%) |
| Total (Category) | 66 (50.4%) | 65 (49.6%) |
| Total (Overall) | 153 (70.2%) | 65 (29.8%) |
Services Occupations
Services Occupations by Sex
| Occupation | Male | Female |
| Healthcare Support | 0 (0.0%) | 0 (0.0%) |
| Security & Protection | 0 (0.0%) | 0 (0.0%) |
| Firefighting & Prevention | 0 (0.0%) | 0 (0.0%) |
| Law Enforcement | 0 (0.0%) | 0 (0.0%) |
| Food Preparation & Serving | 0 (0.0%) | 0 (0.0%) |
| Cleaning & Maintenance | 0 (0.0%) | 0 (0.0%) |
| Personal Care & Service | 0 (0.0%) | 0 (0.0%) |
| Total (Category) | 0 (0.0%) | 0 (0.0%) |
| Total (Overall) | 153 (70.2%) | 65 (29.8%) |
Sales and Office Occupations
The most common Sales and Office occupations in Palmas are , and Sales & Related (62 | 28.4%).
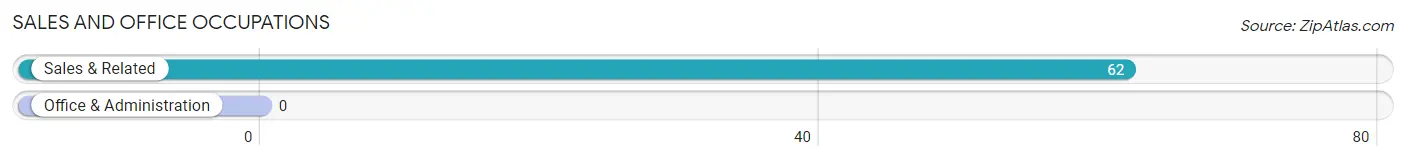
Sales and Office Occupations by Sex

| Occupation | Male | Female |
| Sales & Related | 62 (100.0%) | 0 (0.0%) |
| Office & Administration | 0 (0.0%) | 0 (0.0%) |
| Total (Category) | 62 (100.0%) | 0 (0.0%) |
| Total (Overall) | 153 (70.2%) | 65 (29.8%) |
Natural Resources, Construction and Maintenance Occupations
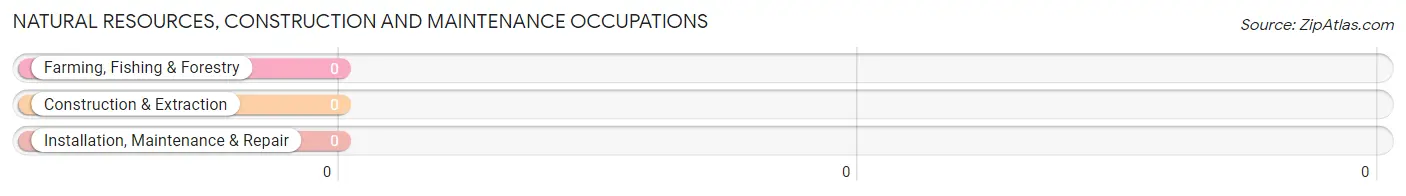
Natural Resources, Construction and Maintenance Occupations by Sex
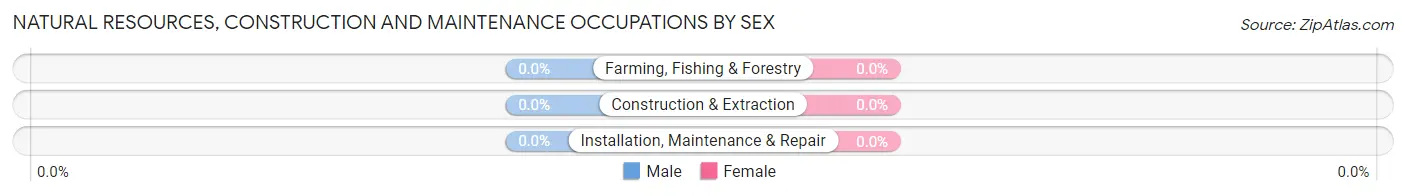
| Occupation | Male | Female |
| Farming, Fishing & Forestry | 0 (0.0%) | 0 (0.0%) |
| Construction & Extraction | 0 (0.0%) | 0 (0.0%) |
| Installation, Maintenance & Repair | 0 (0.0%) | 0 (0.0%) |
| Total (Category) | 0 (0.0%) | 0 (0.0%) |
| Total (Overall) | 153 (70.2%) | 65 (29.8%) |
Production, Transportation and Moving Occupations
The most common Production, Transportation and Moving occupations in Palmas are , and Production (25 | 11.5%).
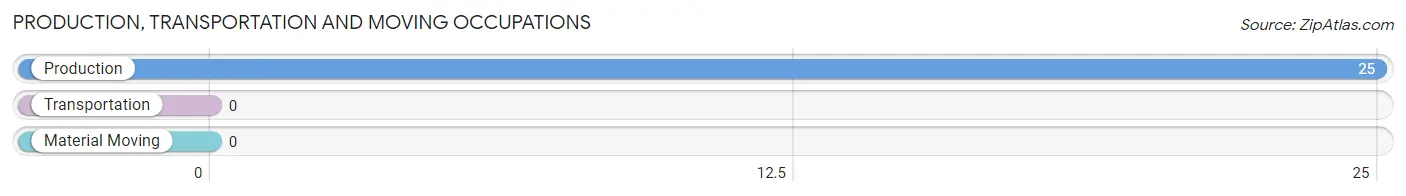
Production, Transportation and Moving Occupations by Sex
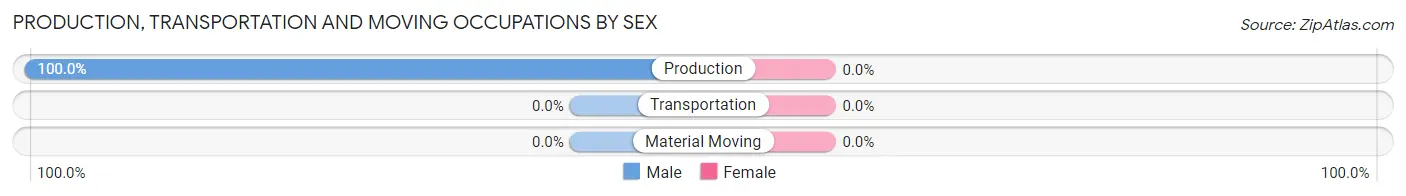
| Occupation | Male | Female |
| Production | 25 (100.0%) | 0 (0.0%) |
| Transportation | 0 (0.0%) | 0 (0.0%) |
| Material Moving | 0 (0.0%) | 0 (0.0%) |
| Total (Category) | 25 (100.0%) | 0 (0.0%) |
| Total (Overall) | 153 (70.2%) | 65 (29.8%) |
Employment Industries by Sex in Palmas
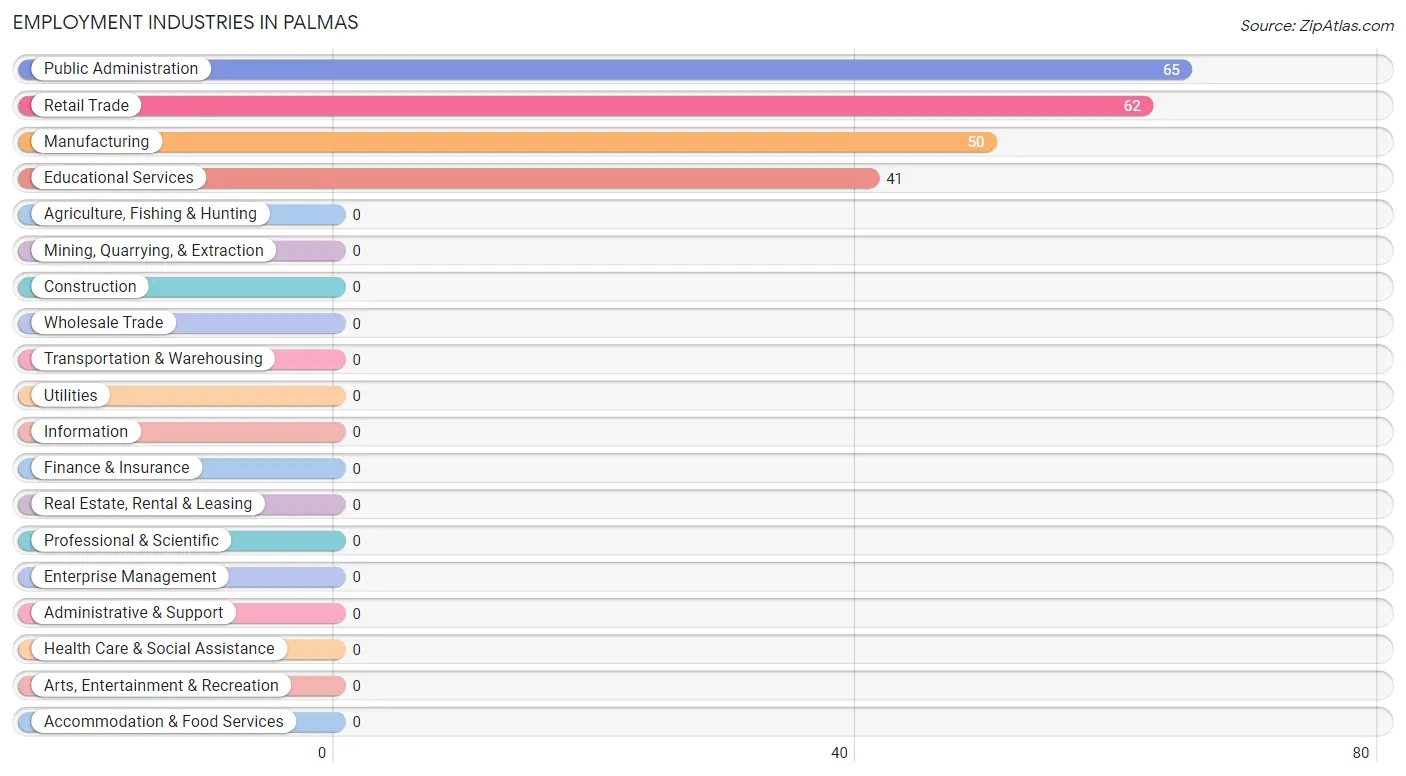
Employment Industries in Palmas
The major employment industries in Palmas include Public Administration (65 | 29.8%), Retail Trade (62 | 28.4%), Manufacturing (50 | 22.9%), and Educational Services (41 | 18.8%).
Employment Industries by Sex in Palmas
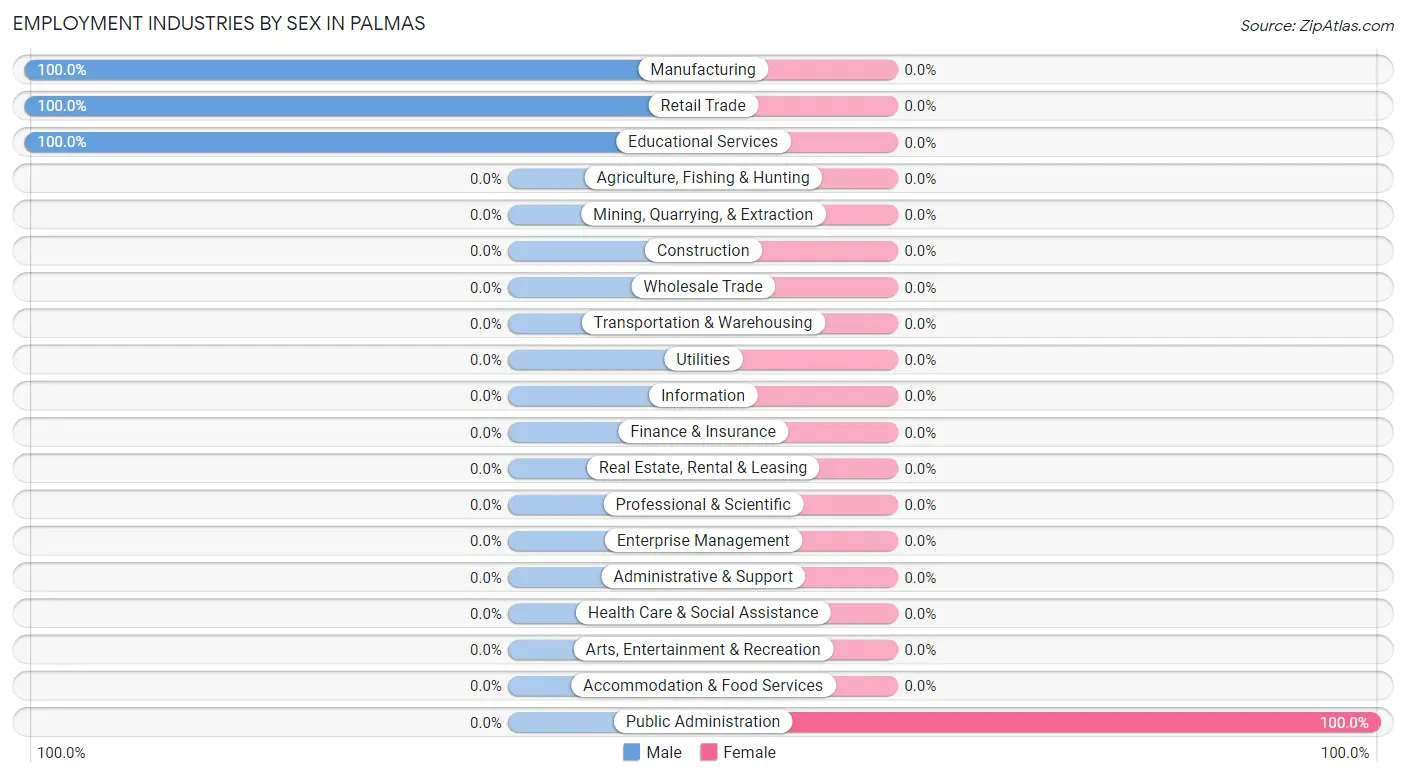
| Industry | Male | Female |
| Agriculture, Fishing & Hunting | 0 (0.0%) | 0 (0.0%) |
| Mining, Quarrying, & Extraction | 0 (0.0%) | 0 (0.0%) |
| Construction | 0 (0.0%) | 0 (0.0%) |
| Manufacturing | 50 (100.0%) | 0 (0.0%) |
| Wholesale Trade | 0 (0.0%) | 0 (0.0%) |
| Retail Trade | 62 (100.0%) | 0 (0.0%) |
| Transportation & Warehousing | 0 (0.0%) | 0 (0.0%) |
| Utilities | 0 (0.0%) | 0 (0.0%) |
| Information | 0 (0.0%) | 0 (0.0%) |
| Finance & Insurance | 0 (0.0%) | 0 (0.0%) |
| Real Estate, Rental & Leasing | 0 (0.0%) | 0 (0.0%) |
| Professional & Scientific | 0 (0.0%) | 0 (0.0%) |
| Enterprise Management | 0 (0.0%) | 0 (0.0%) |
| Administrative & Support | 0 (0.0%) | 0 (0.0%) |
| Educational Services | 41 (100.0%) | 0 (0.0%) |
| Health Care & Social Assistance | 0 (0.0%) | 0 (0.0%) |
| Arts, Entertainment & Recreation | 0 (0.0%) | 0 (0.0%) |
| Accommodation & Food Services | 0 (0.0%) | 0 (0.0%) |
| Public Administration | 0 (0.0%) | 65 (100.0%) |
| Total | 153 (70.2%) | 65 (29.8%) |
Education in Palmas
School Enrollment in Palmas
The most common levels of schooling among the 103 students in Palmas are middle school (70 | 68.0%), and high school (33 | 32.0%).
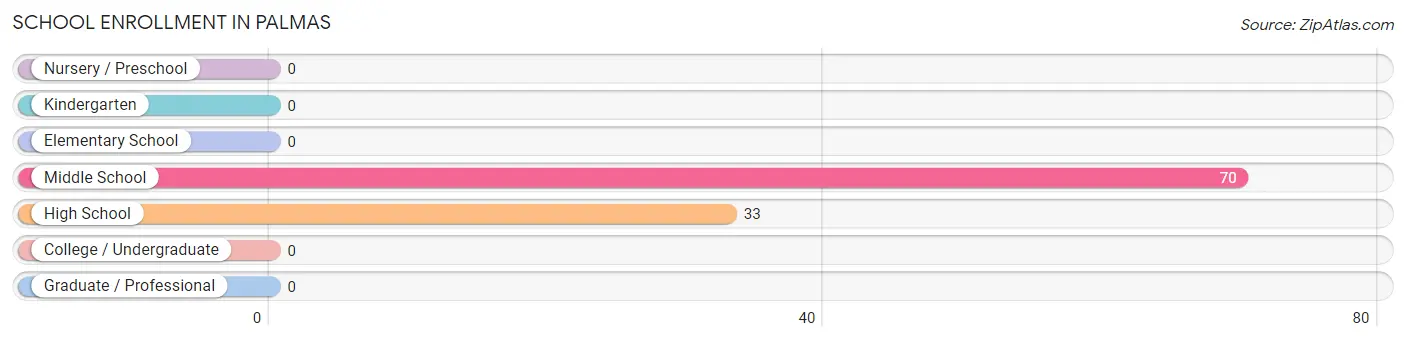
| School Level | # Students | % Students |
| Nursery / Preschool | 0 | 0.0% |
| Kindergarten | 0 | 0.0% |
| Elementary School | 0 | 0.0% |
| Middle School | 70 | 68.0% |
| High School | 33 | 32.0% |
| College / Undergraduate | 0 | 0.0% |
| Graduate / Professional | 0 | 0.0% |
| Total | 103 | 100.0% |
School Enrollment by Age by Funding Source in Palmas
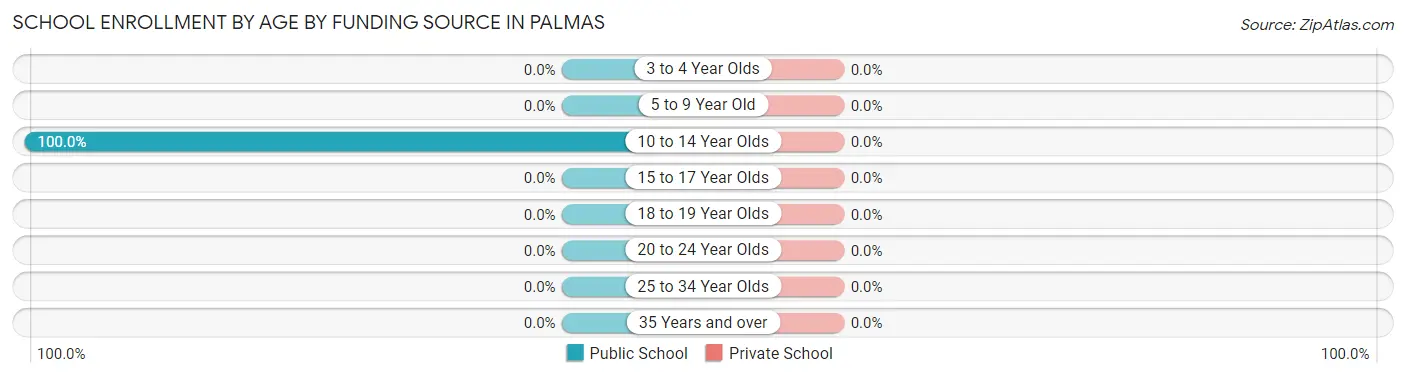
| Age Bracket | Public School | Private School |
| 3 to 4 Year Olds | 0 (0.0%) | 0 (0.0%) |
| 5 to 9 Year Old | 0 (0.0%) | 0 (0.0%) |
| 10 to 14 Year Olds | 103 (100.0%) | 0 (0.0%) |
| 15 to 17 Year Olds | 0 (0.0%) | 0 (0.0%) |
| 18 to 19 Year Olds | 0 (0.0%) | 0 (0.0%) |
| 20 to 24 Year Olds | 0 (0.0%) | 0 (0.0%) |
| 25 to 34 Year Olds | 0 (0.0%) | 0 (0.0%) |
| 35 Years and over | 0 (0.0%) | 0 (0.0%) |
| Total | 103 (100.0%) | 0 (0.0%) |
Educational Attainment by Field of Study in Palmas
Education (97 | 52.1%), business (65 | 34.9%), and arts & humanities (24 | 12.9%) are the most common fields of study among 186 individuals in Palmas who have obtained a bachelor's degree or higher.
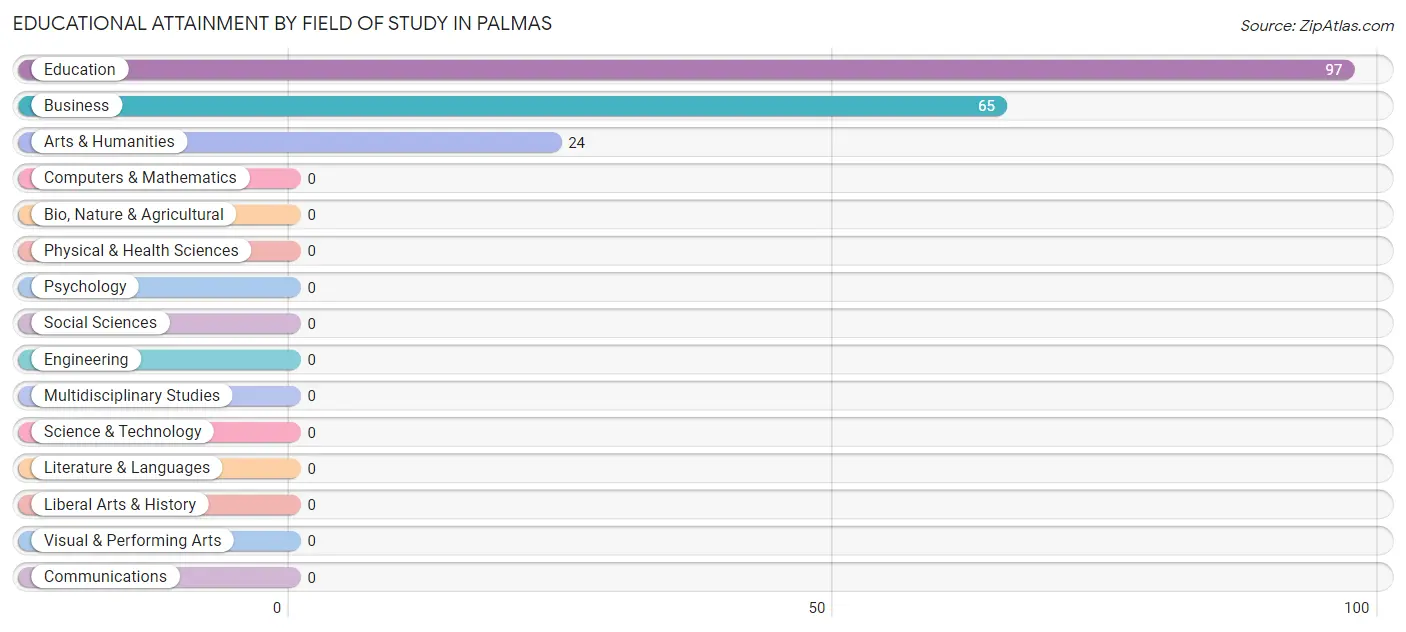
| Field of Study | # Graduates | % Graduates |
| Computers & Mathematics | 0 | 0.0% |
| Bio, Nature & Agricultural | 0 | 0.0% |
| Physical & Health Sciences | 0 | 0.0% |
| Psychology | 0 | 0.0% |
| Social Sciences | 0 | 0.0% |
| Engineering | 0 | 0.0% |
| Multidisciplinary Studies | 0 | 0.0% |
| Science & Technology | 0 | 0.0% |
| Business | 65 | 34.9% |
| Education | 97 | 52.1% |
| Literature & Languages | 0 | 0.0% |
| Liberal Arts & History | 0 | 0.0% |
| Visual & Performing Arts | 0 | 0.0% |
| Communications | 0 | 0.0% |
| Arts & Humanities | 24 | 12.9% |
| Total | 186 | 100.0% |
Transportation & Commute in Palmas
Vehicle Availability by Sex in Palmas
The most prevalent vehicle ownership categories in Palmas are males with 1 vehicle (62, accounting for 40.5%) and females with 1 vehicle (65, making up 95.4%).
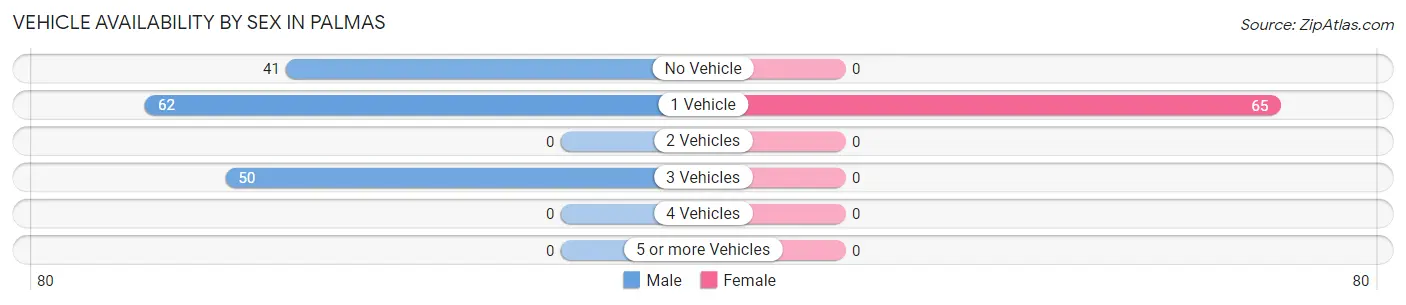
| Vehicles Available | Male | Female |
| No Vehicle | 41 (26.8%) | 0 (0.0%) |
| 1 Vehicle | 62 (40.5%) | 65 (100.0%) |
| 2 Vehicles | 0 (0.0%) | 0 (0.0%) |
| 3 Vehicles | 50 (32.7%) | 0 (0.0%) |
| 4 Vehicles | 0 (0.0%) | 0 (0.0%) |
| 5 or more Vehicles | 0 (0.0%) | 0 (0.0%) |
| Total | 153 (100.0%) | 65 (100.0%) |
Commute Time in Palmas
The most frequently occuring commute durations in Palmas are 60 to 89 minutes (65 commuters, 29.8%), 10 to 14 minutes (62 commuters, 28.4%), and 30 to 34 minutes (41 commuters, 18.8%).
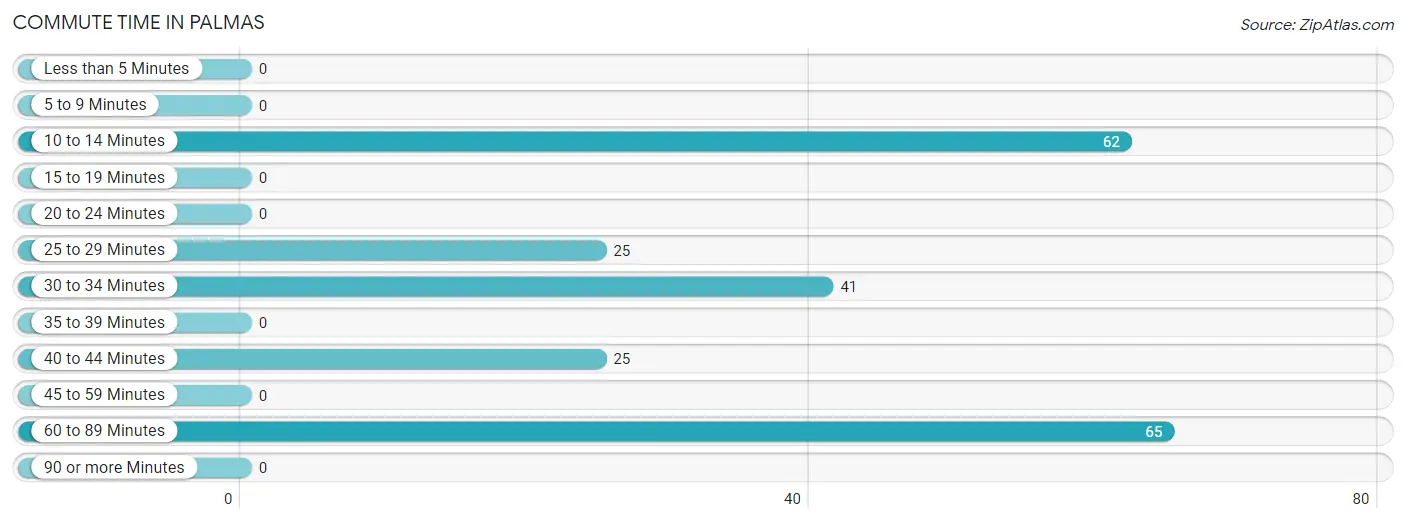
| Commute Time | # Commuters | % Commuters |
| Less than 5 Minutes | 0 | 0.0% |
| 5 to 9 Minutes | 0 | 0.0% |
| 10 to 14 Minutes | 62 | 28.4% |
| 15 to 19 Minutes | 0 | 0.0% |
| 20 to 24 Minutes | 0 | 0.0% |
| 25 to 29 Minutes | 25 | 11.5% |
| 30 to 34 Minutes | 41 | 18.8% |
| 35 to 39 Minutes | 0 | 0.0% |
| 40 to 44 Minutes | 25 | 11.5% |
| 45 to 59 Minutes | 0 | 0.0% |
| 60 to 89 Minutes | 65 | 29.8% |
| 90 or more Minutes | 0 | 0.0% |
Commute Time by Sex in Palmas
The most common commute times in Palmas are 10 to 14 minutes (62 commuters, 40.5%) for males and 60 to 89 minutes (65 commuters, 100.0%) for females.
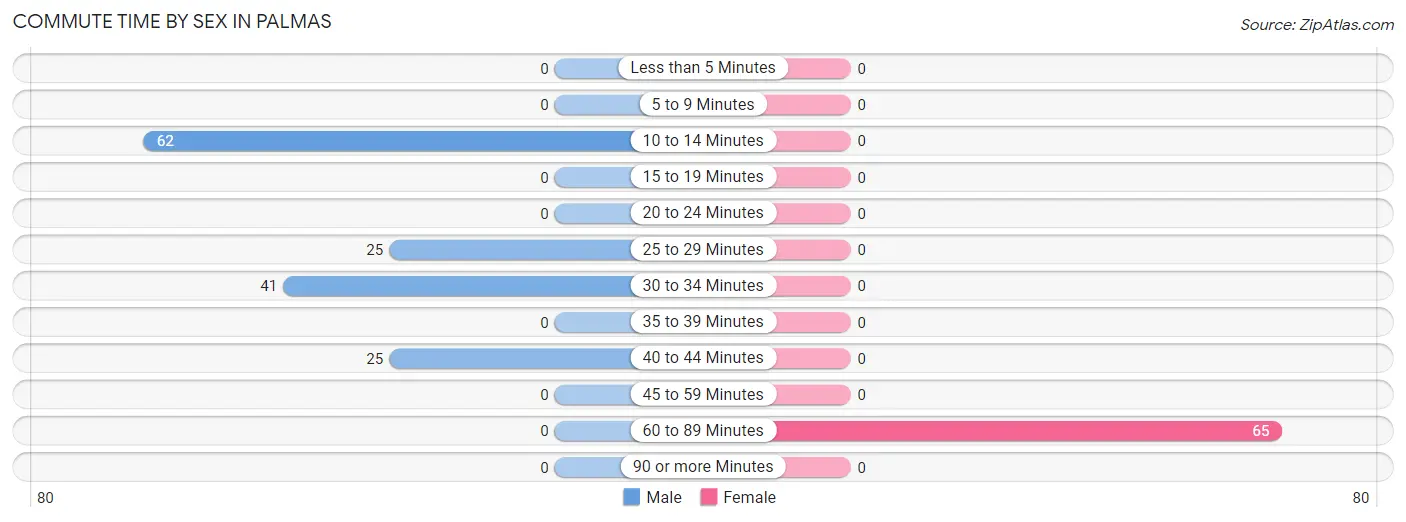
| Commute Time | Male | Female |
| Less than 5 Minutes | 0 (0.0%) | 0 (0.0%) |
| 5 to 9 Minutes | 0 (0.0%) | 0 (0.0%) |
| 10 to 14 Minutes | 62 (40.5%) | 0 (0.0%) |
| 15 to 19 Minutes | 0 (0.0%) | 0 (0.0%) |
| 20 to 24 Minutes | 0 (0.0%) | 0 (0.0%) |
| 25 to 29 Minutes | 25 (16.3%) | 0 (0.0%) |
| 30 to 34 Minutes | 41 (26.8%) | 0 (0.0%) |
| 35 to 39 Minutes | 0 (0.0%) | 0 (0.0%) |
| 40 to 44 Minutes | 25 (16.3%) | 0 (0.0%) |
| 45 to 59 Minutes | 0 (0.0%) | 0 (0.0%) |
| 60 to 89 Minutes | 0 (0.0%) | 65 (100.0%) |
| 90 or more Minutes | 0 (0.0%) | 0 (0.0%) |
Time of Departure to Work by Sex in Palmas
The most frequent times of departure to work in Palmas are 7:30 AM to 7:59 AM (62, 40.5%) for males and 6:00 AM to 6:29 AM (65, 100.0%) for females.
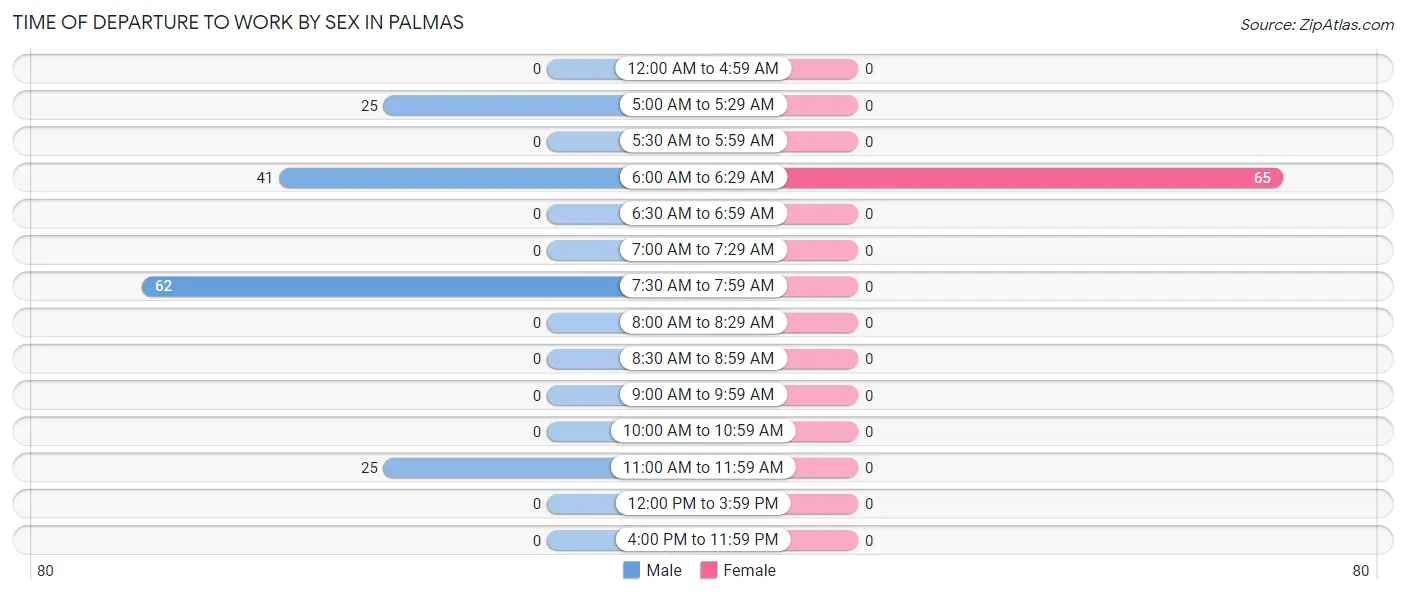
| Time of Departure | Male | Female |
| 12:00 AM to 4:59 AM | 0 (0.0%) | 0 (0.0%) |
| 5:00 AM to 5:29 AM | 25 (16.3%) | 0 (0.0%) |
| 5:30 AM to 5:59 AM | 0 (0.0%) | 0 (0.0%) |
| 6:00 AM to 6:29 AM | 41 (26.8%) | 65 (100.0%) |
| 6:30 AM to 6:59 AM | 0 (0.0%) | 0 (0.0%) |
| 7:00 AM to 7:29 AM | 0 (0.0%) | 0 (0.0%) |
| 7:30 AM to 7:59 AM | 62 (40.5%) | 0 (0.0%) |
| 8:00 AM to 8:29 AM | 0 (0.0%) | 0 (0.0%) |
| 8:30 AM to 8:59 AM | 0 (0.0%) | 0 (0.0%) |
| 9:00 AM to 9:59 AM | 0 (0.0%) | 0 (0.0%) |
| 10:00 AM to 10:59 AM | 0 (0.0%) | 0 (0.0%) |
| 11:00 AM to 11:59 AM | 25 (16.3%) | 0 (0.0%) |
| 12:00 PM to 3:59 PM | 0 (0.0%) | 0 (0.0%) |
| 4:00 PM to 11:59 PM | 0 (0.0%) | 0 (0.0%) |
| Total | 153 (100.0%) | 65 (100.0%) |
Housing Occupancy in Palmas
Occupancy by Ownership in Palmas
Of the total 468 dwellings in Palmas, owner-occupied units account for 441 (94.2%), while renter-occupied units make up 27 (5.8%).
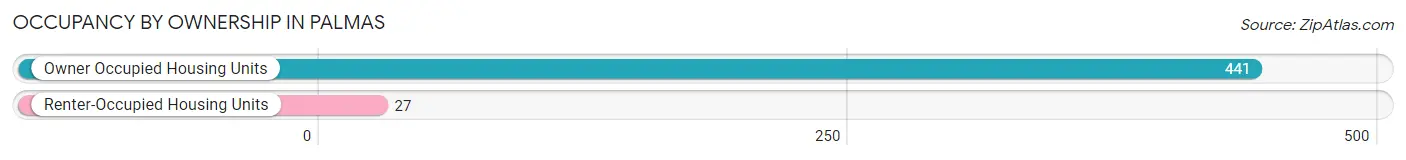
| Occupancy | # Housing Units | % Housing Units |
| Owner Occupied Housing Units | 441 | 94.2% |
| Renter-Occupied Housing Units | 27 | 5.8% |
| Total Occupied Housing Units | 468 | 100.0% |
Occupancy by Household Size in Palmas
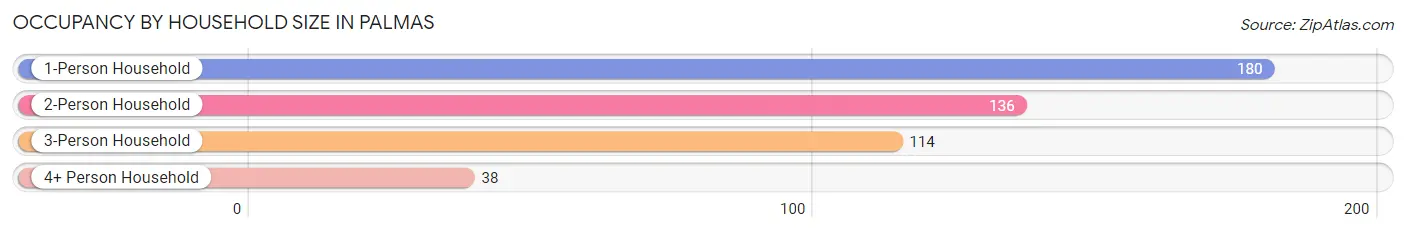
| Household Size | # Housing Units | % Housing Units |
| 1-Person Household | 180 | 38.5% |
| 2-Person Household | 136 | 29.1% |
| 3-Person Household | 114 | 24.4% |
| 4+ Person Household | 38 | 8.1% |
| Total Housing Units | 468 | 100.0% |
Occupancy by Ownership by Household Size in Palmas
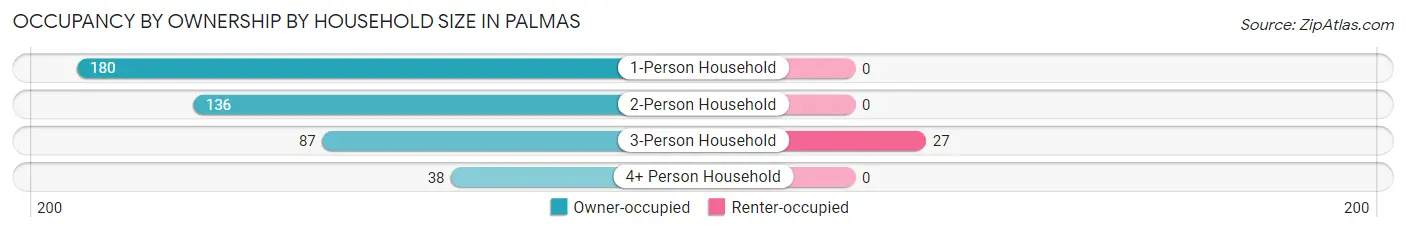
| Household Size | Owner-occupied | Renter-occupied |
| 1-Person Household | 180 (100.0%) | 0 (0.0%) |
| 2-Person Household | 136 (100.0%) | 0 (0.0%) |
| 3-Person Household | 87 (76.3%) | 27 (23.7%) |
| 4+ Person Household | 38 (100.0%) | 0 (0.0%) |
| Total Housing Units | 441 (94.2%) | 27 (5.8%) |
Occupancy by Educational Attainment in Palmas
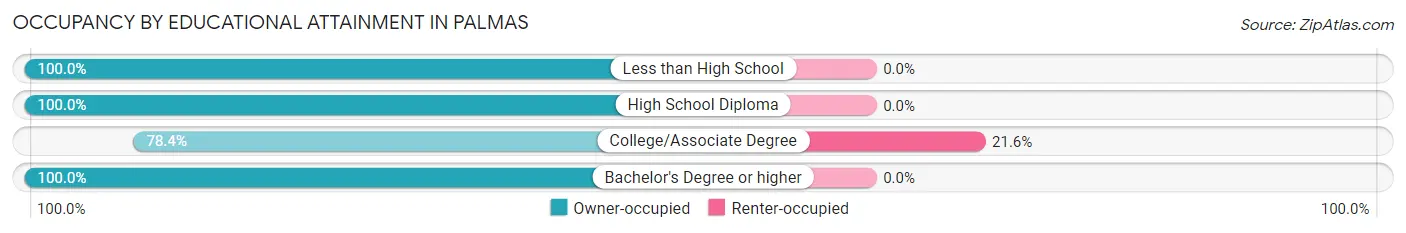
| Household Size | Owner-occupied | Renter-occupied |
| Less than High School | 163 (100.0%) | 0 (0.0%) |
| High School Diploma | 115 (100.0%) | 0 (0.0%) |
| College/Associate Degree | 98 (78.4%) | 27 (21.6%) |
| Bachelor's Degree or higher | 65 (100.0%) | 0 (0.0%) |
Occupancy by Age of Householder in Palmas
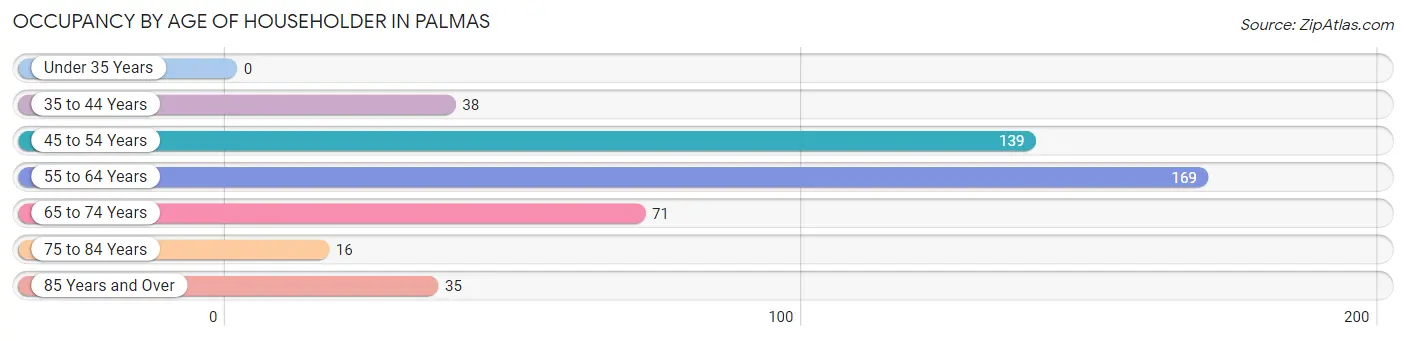
| Age Bracket | # Households | % Households |
| Under 35 Years | 0 | 0.0% |
| 35 to 44 Years | 38 | 8.1% |
| 45 to 54 Years | 139 | 29.7% |
| 55 to 64 Years | 169 | 36.1% |
| 65 to 74 Years | 71 | 15.2% |
| 75 to 84 Years | 16 | 3.4% |
| 85 Years and Over | 35 | 7.5% |
| Total | 468 | 100.0% |
Housing Finances in Palmas
Median Income by Occupancy in Palmas
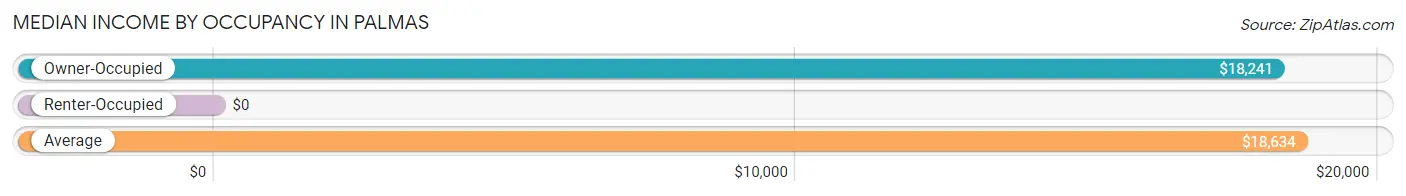
| Occupancy Type | # Households | Median Income |
| Owner-Occupied | 441 (94.2%) | $18,241 |
| Renter-Occupied | 27 (5.8%) | $0 |
| Average | 468 (100.0%) | $18,634 |
Occupancy by Householder Income Bracket in Palmas
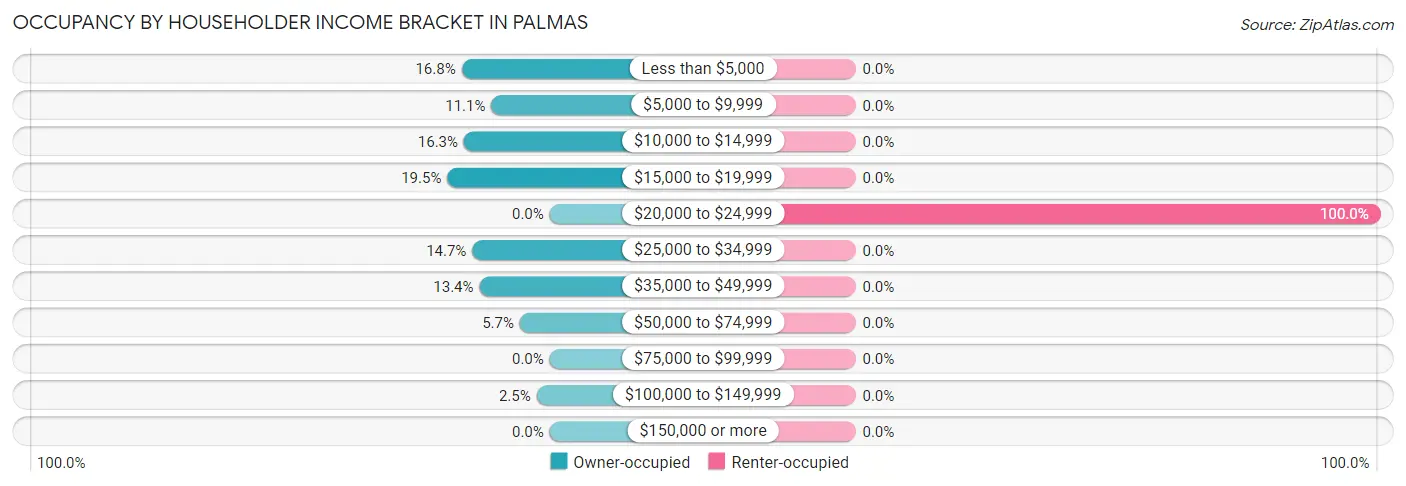
| Income Bracket | Owner-occupied | Renter-occupied |
| Less than $5,000 | 74 (16.8%) | 0 (0.0%) |
| $5,000 to $9,999 | 49 (11.1%) | 0 (0.0%) |
| $10,000 to $14,999 | 72 (16.3%) | 0 (0.0%) |
| $15,000 to $19,999 | 86 (19.5%) | 0 (0.0%) |
| $20,000 to $24,999 | 0 (0.0%) | 27 (100.0%) |
| $25,000 to $34,999 | 65 (14.7%) | 0 (0.0%) |
| $35,000 to $49,999 | 59 (13.4%) | 0 (0.0%) |
| $50,000 to $74,999 | 25 (5.7%) | 0 (0.0%) |
| $75,000 to $99,999 | 0 (0.0%) | 0 (0.0%) |
| $100,000 to $149,999 | 11 (2.5%) | 0 (0.0%) |
| $150,000 or more | 0 (0.0%) | 0 (0.0%) |
| Total | 441 (100.0%) | 27 (100.0%) |
Monthly Housing Cost Tiers in Palmas
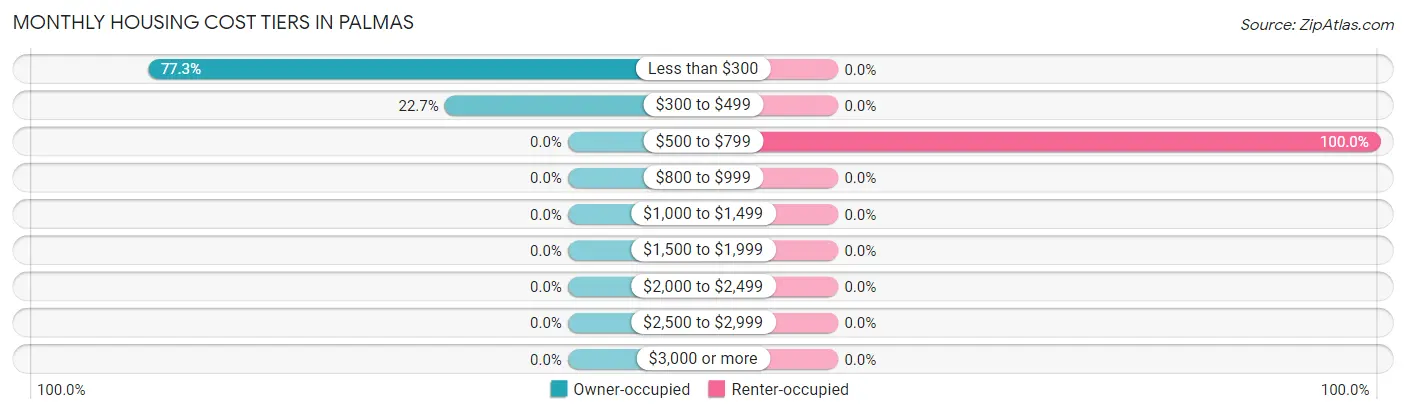
| Monthly Cost | Owner-occupied | Renter-occupied |
| Less than $300 | 341 (77.3%) | 0 (0.0%) |
| $300 to $499 | 100 (22.7%) | 0 (0.0%) |
| $500 to $799 | 0 (0.0%) | 27 (100.0%) |
| $800 to $999 | 0 (0.0%) | 0 (0.0%) |
| $1,000 to $1,499 | 0 (0.0%) | 0 (0.0%) |
| $1,500 to $1,999 | 0 (0.0%) | 0 (0.0%) |
| $2,000 to $2,499 | 0 (0.0%) | 0 (0.0%) |
| $2,500 to $2,999 | 0 (0.0%) | 0 (0.0%) |
| $3,000 or more | 0 (0.0%) | 0 (0.0%) |
| Total | 441 (100.0%) | 27 (100.0%) |
Physical Housing Characteristics in Palmas
Housing Structures in Palmas
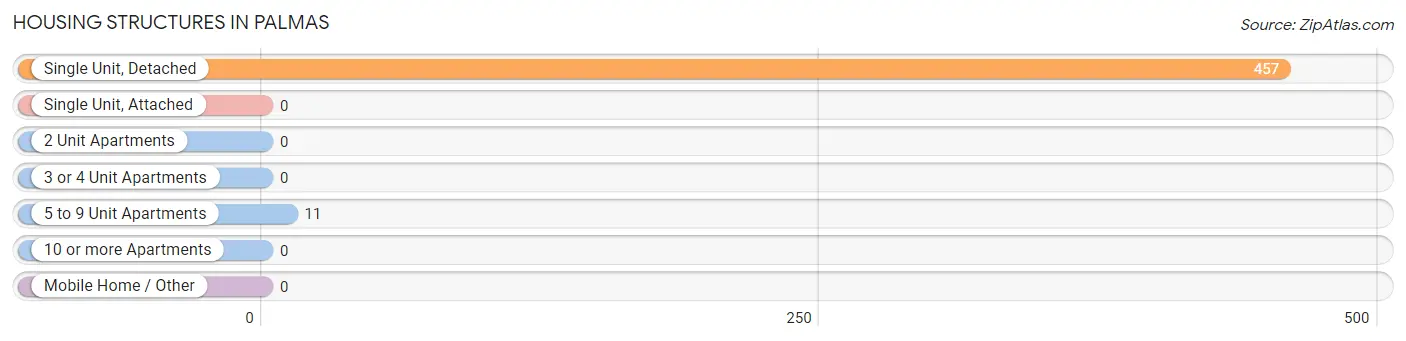
| Structure Type | # Housing Units | % Housing Units |
| Single Unit, Detached | 457 | 97.7% |
| Single Unit, Attached | 0 | 0.0% |
| 2 Unit Apartments | 0 | 0.0% |
| 3 or 4 Unit Apartments | 0 | 0.0% |
| 5 to 9 Unit Apartments | 11 | 2.4% |
| 10 or more Apartments | 0 | 0.0% |
| Mobile Home / Other | 0 | 0.0% |
| Total | 468 | 100.0% |
Housing Structures by Occupancy in Palmas
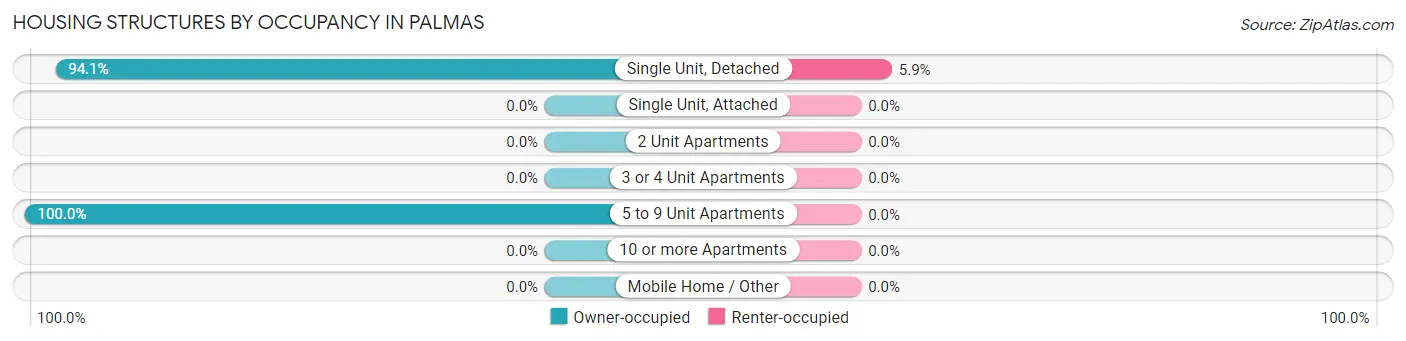
| Structure Type | Owner-occupied | Renter-occupied |
| Single Unit, Detached | 430 (94.1%) | 27 (5.9%) |
| Single Unit, Attached | 0 (0.0%) | 0 (0.0%) |
| 2 Unit Apartments | 0 (0.0%) | 0 (0.0%) |
| 3 or 4 Unit Apartments | 0 (0.0%) | 0 (0.0%) |
| 5 to 9 Unit Apartments | 11 (100.0%) | 0 (0.0%) |
| 10 or more Apartments | 0 (0.0%) | 0 (0.0%) |
| Mobile Home / Other | 0 (0.0%) | 0 (0.0%) |
| Total | 441 (94.2%) | 27 (5.8%) |
Housing Structures by Number of Rooms in Palmas
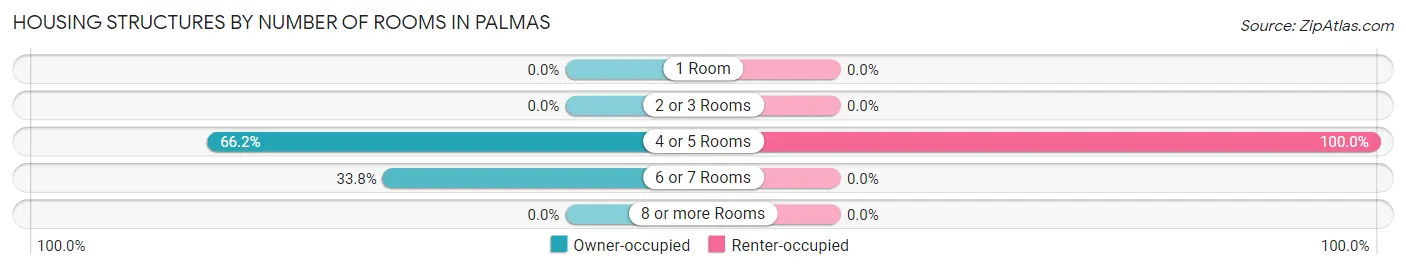
| Number of Rooms | Owner-occupied | Renter-occupied |
| 1 Room | 0 (0.0%) | 0 (0.0%) |
| 2 or 3 Rooms | 0 (0.0%) | 0 (0.0%) |
| 4 or 5 Rooms | 292 (66.2%) | 27 (100.0%) |
| 6 or 7 Rooms | 149 (33.8%) | 0 (0.0%) |
| 8 or more Rooms | 0 (0.0%) | 0 (0.0%) |
| Total | 441 (100.0%) | 27 (100.0%) |
Housing Structure by Heating Type in Palmas
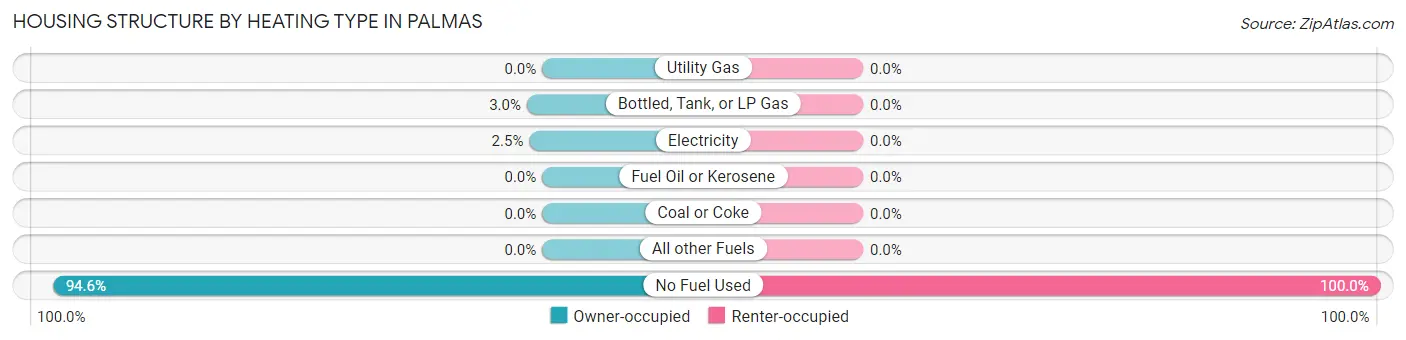
| Heating Type | Owner-occupied | Renter-occupied |
| Utility Gas | 0 (0.0%) | 0 (0.0%) |
| Bottled, Tank, or LP Gas | 13 (2.9%) | 0 (0.0%) |
| Electricity | 11 (2.5%) | 0 (0.0%) |
| Fuel Oil or Kerosene | 0 (0.0%) | 0 (0.0%) |
| Coal or Coke | 0 (0.0%) | 0 (0.0%) |
| All other Fuels | 0 (0.0%) | 0 (0.0%) |
| No Fuel Used | 417 (94.6%) | 27 (100.0%) |
| Total | 441 (100.0%) | 27 (100.0%) |
Household Vehicle Usage in Palmas
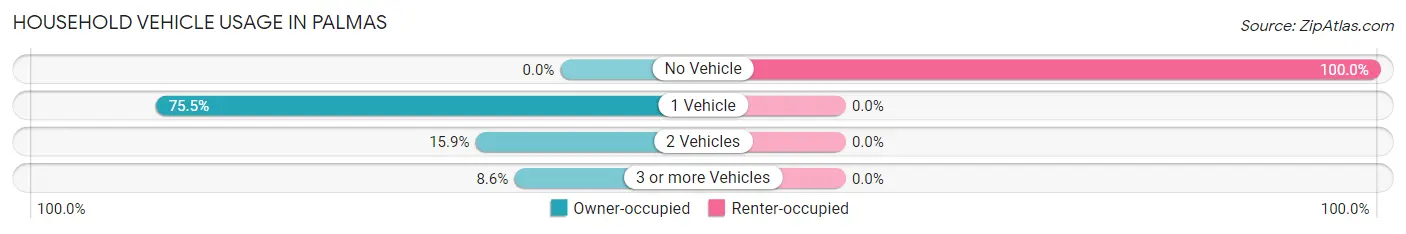
| Vehicles per Household | Owner-occupied | Renter-occupied |
| No Vehicle | 0 (0.0%) | 27 (100.0%) |
| 1 Vehicle | 333 (75.5%) | 0 (0.0%) |
| 2 Vehicles | 70 (15.9%) | 0 (0.0%) |
| 3 or more Vehicles | 38 (8.6%) | 0 (0.0%) |
| Total | 441 (100.0%) | 27 (100.0%) |
Real Estate & Mortgages in Palmas
Real Estate and Mortgage Overview in Palmas
| Characteristic | Without Mortgage | With Mortgage |
| Housing Units | 376 | 65 |
| Median Property Value | $100,600 | $0 |
| Median Household Income | $14,757 | $0 |
| Monthly Housing Costs | $199 | $0 |
| Real Estate Taxes | - | - |
Property Value by Mortgage Status in Palmas
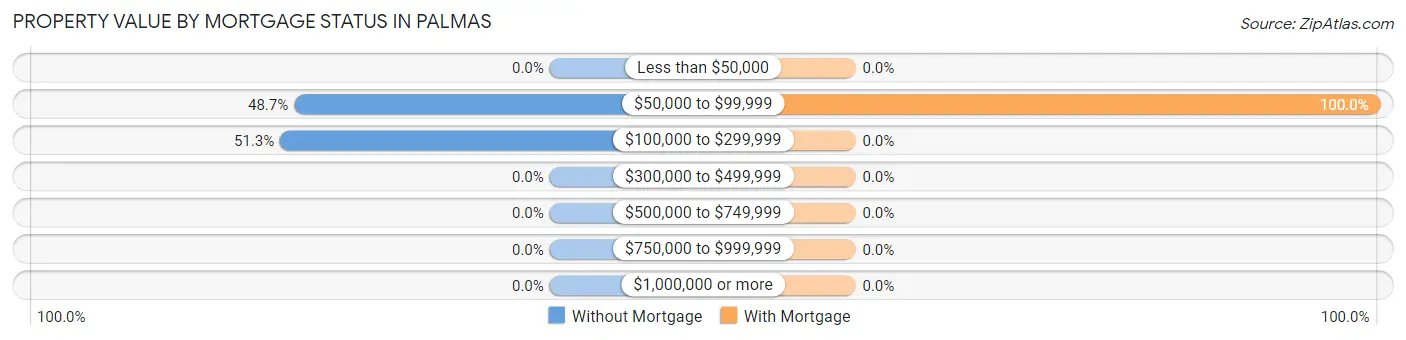
| Property Value | Without Mortgage | With Mortgage |
| Less than $50,000 | 0 (0.0%) | 0 (0.0%) |
| $50,000 to $99,999 | 183 (48.7%) | 65 (100.0%) |
| $100,000 to $299,999 | 193 (51.3%) | 0 (0.0%) |
| $300,000 to $499,999 | 0 (0.0%) | 0 (0.0%) |
| $500,000 to $749,999 | 0 (0.0%) | 0 (0.0%) |
| $750,000 to $999,999 | 0 (0.0%) | 0 (0.0%) |
| $1,000,000 or more | 0 (0.0%) | 0 (0.0%) |
| Total | 376 (100.0%) | 65 (100.0%) |
Household Income by Mortgage Status in Palmas
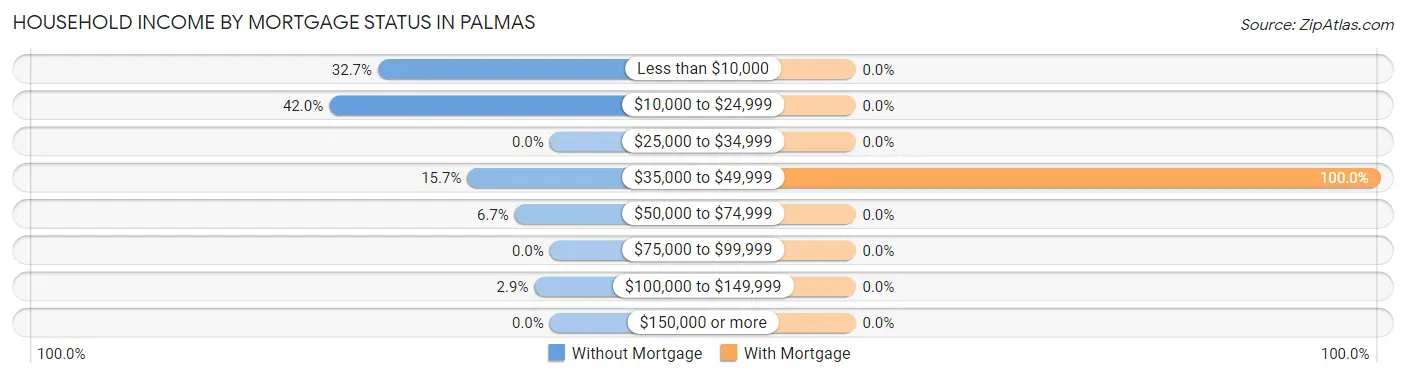
| Household Income | Without Mortgage | With Mortgage |
| Less than $10,000 | 123 (32.7%) | 0 (0.0%) |
| $10,000 to $24,999 | 158 (42.0%) | 0 (0.0%) |
| $25,000 to $34,999 | 0 (0.0%) | 0 (0.0%) |
| $35,000 to $49,999 | 59 (15.7%) | 65 (100.0%) |
| $50,000 to $74,999 | 25 (6.7%) | 0 (0.0%) |
| $75,000 to $99,999 | 0 (0.0%) | 0 (0.0%) |
| $100,000 to $149,999 | 11 (2.9%) | 0 (0.0%) |
| $150,000 or more | 0 (0.0%) | 0 (0.0%) |
| Total | 376 (100.0%) | 65 (100.0%) |
Property Value to Household Income Ratio in Palmas
| Value-to-Income Ratio | Without Mortgage | With Mortgage |
| Less than 2.0x | 36 (9.6%) | 0 (0.0%) |
| 2.0x to 2.9x | 59 (15.7%) | 0 (0.0%) |
| 3.0x to 3.9x | 13 (3.5%) | 0 (0.0%) |
| 4.0x or more | 233 (62.0%) | 65 (100.0%) |
| Total | 376 (100.0%) | 65 (100.0%) |
Real Estate Taxes by Mortgage Status in Palmas
| Property Taxes | Without Mortgage | With Mortgage |
| Less than $800 | 0 (0.0%) | 0 (0.0%) |
| $800 to $1,499 | 0 (0.0%) | 0 (0.0%) |
| $800 to $1,499 | 0 (0.0%) | 0 (0.0%) |
| Total | 376 (100.0%) | 65 (100.0%) |
Health & Disability in Palmas
Health Insurance Coverage by Age in Palmas
| Age Bracket | With Coverage | Without Coverage |
| Under 6 Years | 0 (0.0%) | 0 (0.0%) |
| 6 to 18 Years | 165 (100.0%) | 0 (0.0%) |
| 19 to 25 Years | 25 (100.0%) | 0 (0.0%) |
| 26 to 34 Years | 44 (66.7%) | 22 (33.3%) |
| 35 to 44 Years | 124 (100.0%) | 0 (0.0%) |
| 45 to 54 Years | 180 (100.0%) | 0 (0.0%) |
| 55 to 64 Years | 255 (100.0%) | 0 (0.0%) |
| 65 to 74 Years | 132 (100.0%) | 0 (0.0%) |
| 75 Years and older | 100 (100.0%) | 0 (0.0%) |
| Total | 1,025 (97.9%) | 22 (2.1%) |
Health Insurance Coverage by Citizenship Status in Palmas
| Citizenship Status | With Coverage | Without Coverage |
| Native Born | 0 (0.0%) | 0 (0.0%) |
| Foreign Born, Citizen | 165 (100.0%) | 0 (0.0%) |
| Foreign Born, not a Citizen | 25 (100.0%) | 0 (0.0%) |
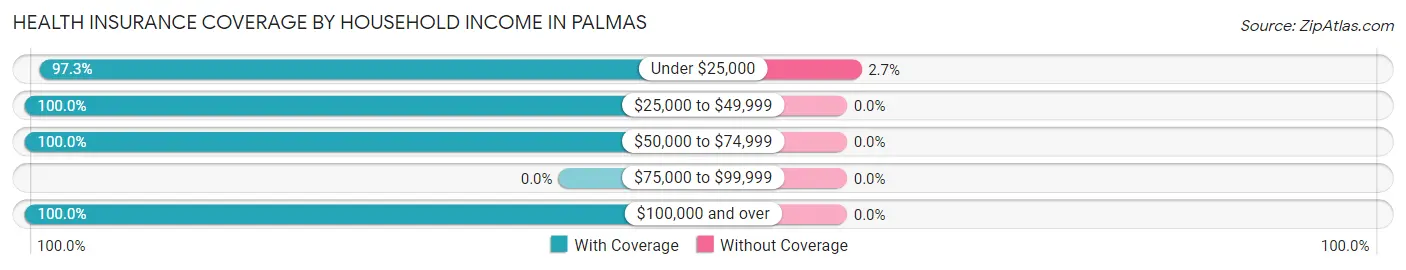
Health Insurance Coverage by Household Income in Palmas
| Household Income | With Coverage | Without Coverage |
| Under $25,000 | 793 (97.3%) | 22 (2.7%) |
| $25,000 to $49,999 | 157 (100.0%) | 0 (0.0%) |
| $50,000 to $74,999 | 49 (100.0%) | 0 (0.0%) |
| $75,000 to $99,999 | 0 (0.0%) | 0 (0.0%) |
| $100,000 and over | 26 (100.0%) | 0 (0.0%) |
Public vs Private Health Insurance Coverage by Age in Palmas
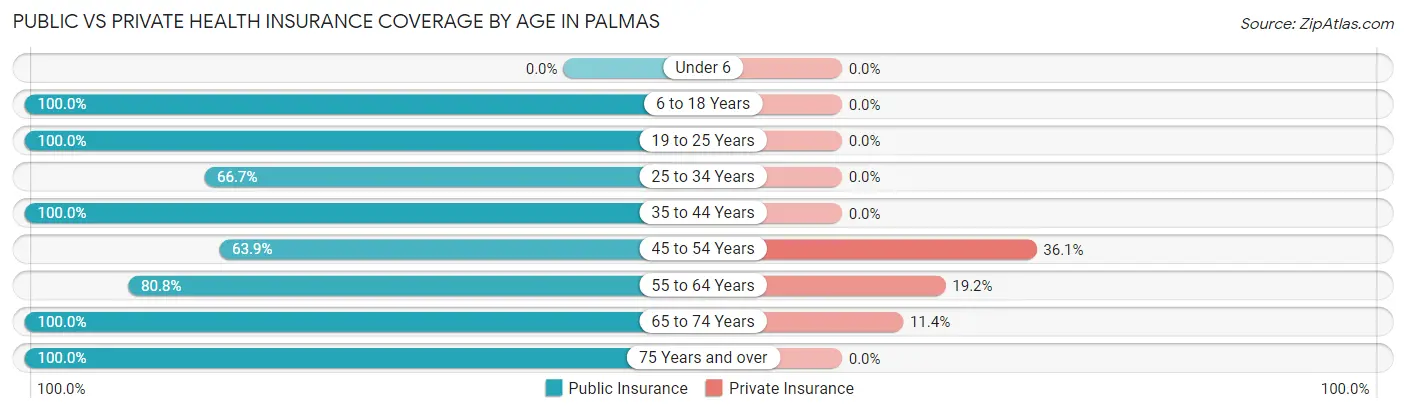
| Age Bracket | Public Insurance | Private Insurance |
| Under 6 | 0 (0.0%) | 0 (0.0%) |
| 6 to 18 Years | 165 (100.0%) | 0 (0.0%) |
| 19 to 25 Years | 25 (100.0%) | 0 (0.0%) |
| 25 to 34 Years | 44 (66.7%) | 0 (0.0%) |
| 35 to 44 Years | 124 (100.0%) | 0 (0.0%) |
| 45 to 54 Years | 115 (63.9%) | 65 (36.1%) |
| 55 to 64 Years | 206 (80.8%) | 49 (19.2%) |
| 65 to 74 Years | 132 (100.0%) | 15 (11.4%) |
| 75 Years and over | 100 (100.0%) | 0 (0.0%) |
| Total | 911 (87.0%) | 129 (12.3%) |
Disability Status by Sex by Age in Palmas
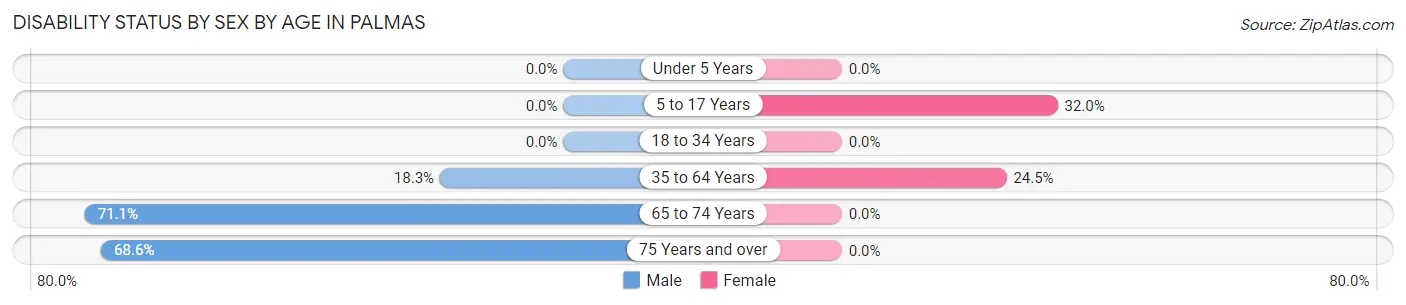
| Age Bracket | Male | Female |
| Under 5 Years | 0 (0.0%) | 0 (0.0%) |
| 5 to 17 Years | 0 (0.0%) | 33 (32.0%) |
| 18 to 34 Years | 0 (0.0%) | 0 (0.0%) |
| 35 to 64 Years | 44 (18.3%) | 78 (24.4%) |
| 65 to 74 Years | 27 (71.1%) | 0 (0.0%) |
| 75 Years and over | 35 (68.6%) | 0 (0.0%) |
Disability Class by Sex by Age in Palmas
Disability Class: Hearing Difficulty
| Age Bracket | Male | Female |
| Under 5 Years | 0 (0.0%) | 0 (0.0%) |
| 5 to 17 Years | 0 (0.0%) | 0 (0.0%) |
| 18 to 34 Years | 0 (0.0%) | 0 (0.0%) |
| 35 to 64 Years | 0 (0.0%) | 0 (0.0%) |
| 65 to 74 Years | 0 (0.0%) | 0 (0.0%) |
| 75 Years and over | 0 (0.0%) | 0 (0.0%) |
Disability Class: Vision Difficulty
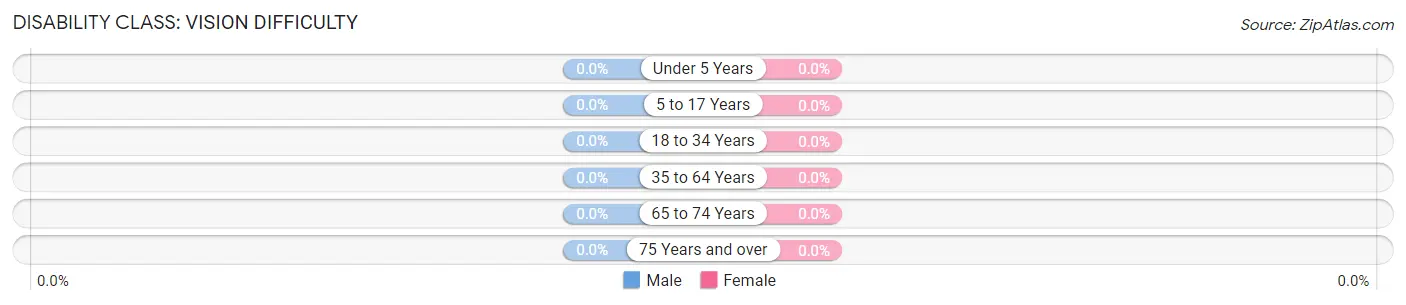
| Age Bracket | Male | Female |
| Under 5 Years | 0 (0.0%) | 0 (0.0%) |
| 5 to 17 Years | 0 (0.0%) | 0 (0.0%) |
| 18 to 34 Years | 0 (0.0%) | 0 (0.0%) |
| 35 to 64 Years | 0 (0.0%) | 0 (0.0%) |
| 65 to 74 Years | 0 (0.0%) | 0 (0.0%) |
| 75 Years and over | 0 (0.0%) | 0 (0.0%) |
Disability Class: Cognitive Difficulty
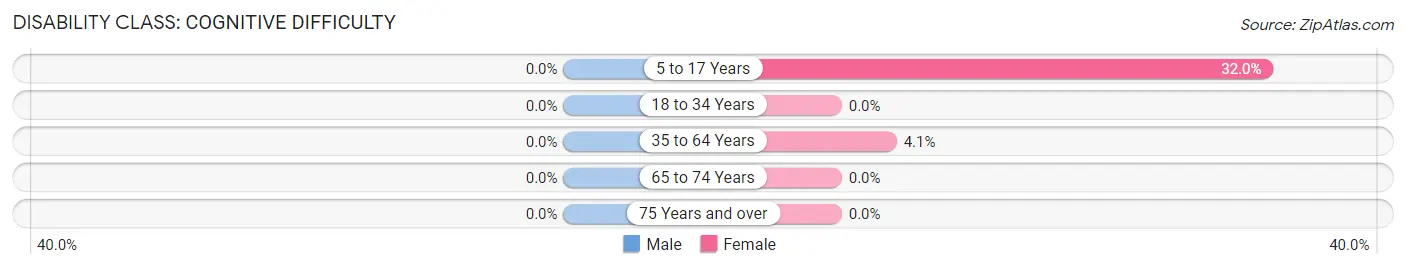
| Age Bracket | Male | Female |
| 5 to 17 Years | 0 (0.0%) | 33 (32.0%) |
| 18 to 34 Years | 0 (0.0%) | 0 (0.0%) |
| 35 to 64 Years | 0 (0.0%) | 13 (4.1%) |
| 65 to 74 Years | 0 (0.0%) | 0 (0.0%) |
| 75 Years and over | 0 (0.0%) | 0 (0.0%) |
Disability Class: Ambulatory Difficulty
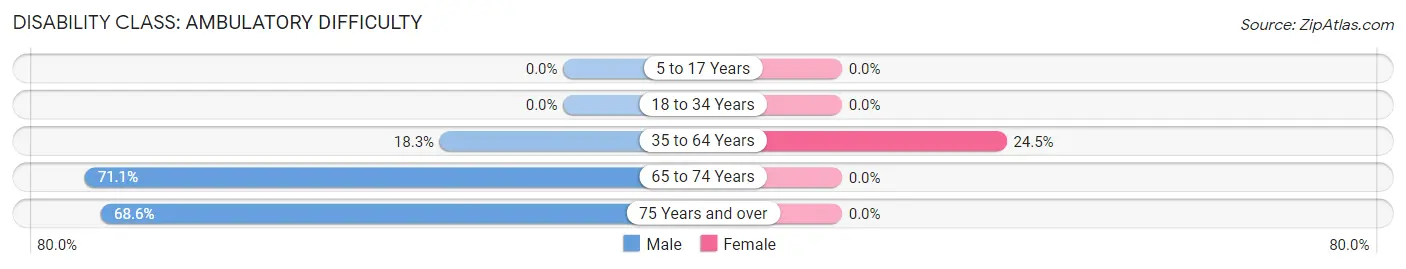
| Age Bracket | Male | Female |
| 5 to 17 Years | 0 (0.0%) | 0 (0.0%) |
| 18 to 34 Years | 0 (0.0%) | 0 (0.0%) |
| 35 to 64 Years | 44 (18.3%) | 78 (24.4%) |
| 65 to 74 Years | 27 (71.1%) | 0 (0.0%) |
| 75 Years and over | 35 (68.6%) | 0 (0.0%) |
Disability Class: Self-Care Difficulty
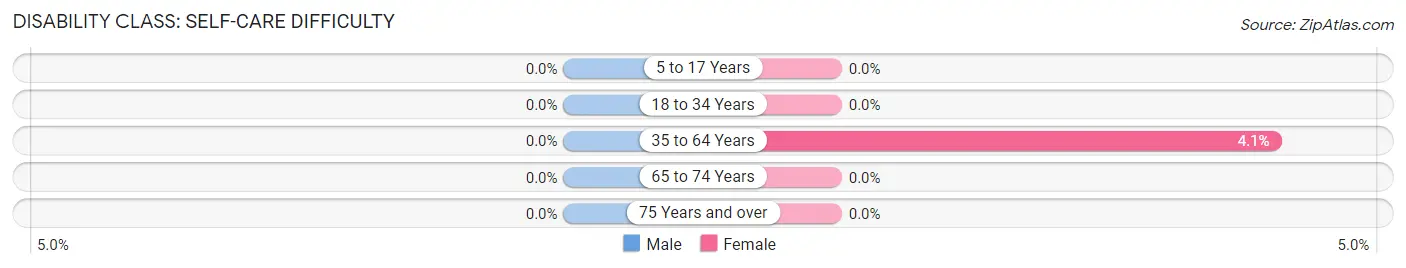
| Age Bracket | Male | Female |
| 5 to 17 Years | 0 (0.0%) | 0 (0.0%) |
| 18 to 34 Years | 0 (0.0%) | 0 (0.0%) |
| 35 to 64 Years | 0 (0.0%) | 13 (4.1%) |
| 65 to 74 Years | 0 (0.0%) | 0 (0.0%) |
| 75 Years and over | 0 (0.0%) | 0 (0.0%) |
Technology Access in Palmas
Computing Device Access in Palmas
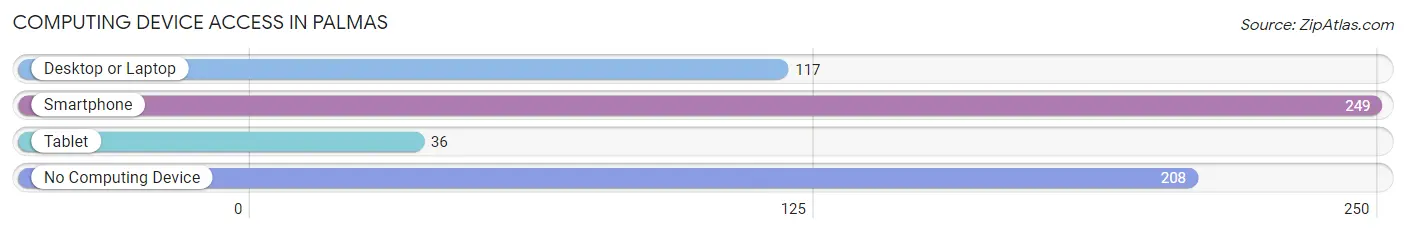
| Device Type | # Households | % Households |
| Desktop or Laptop | 117 | 25.0% |
| Smartphone | 249 | 53.2% |
| Tablet | 36 | 7.7% |
| No Computing Device | 208 | 44.4% |
| Total | 468 | 100.0% |
Internet Access in Palmas
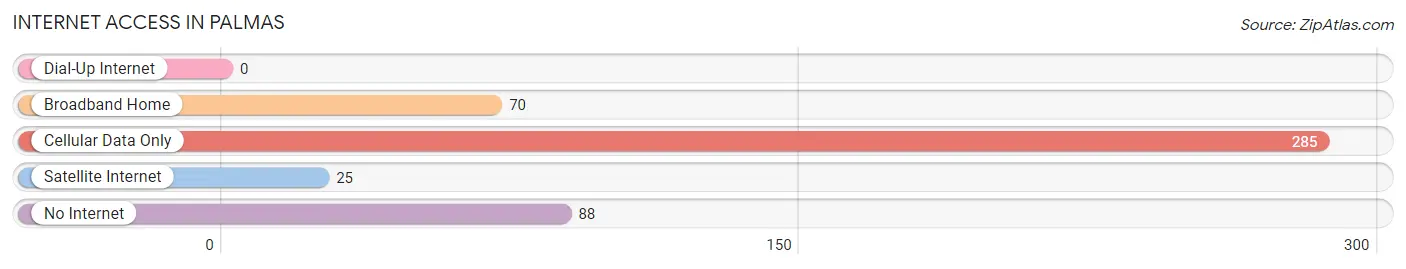
| Internet Type | # Households | % Households |
| Dial-Up Internet | 0 | 0.0% |
| Broadband Home | 70 | 15.0% |
| Cellular Data Only | 285 | 60.9% |
| Satellite Internet | 25 | 5.3% |
| No Internet | 88 | 18.8% |
| Total | 468 | 100.0% |
Palmas Summary
Palmas is a municipality located in the eastern part of the island of Puerto Rico. It is part of the metropolitan area of San Juan, the capital of Puerto Rico. The municipality is located in the northern coast of the island, and is bordered by the municipalities of Loíza, Carolina, Canóvanas, and Río Grande. It has a population of approximately 40,000 people, making it the second most populous municipality in Puerto Rico.
History
The area of Palmas was originally inhabited by the Taíno Indians, who were the first inhabitants of Puerto Rico. The Taíno Indians were a peaceful people who lived in small villages and were mainly farmers. The Taíno Indians were eventually displaced by the Spanish, who arrived in Puerto Rico in the late 15th century. The Spanish established a settlement in the area of Palmas in 1510, and named it Palmas de San Juan. The settlement was part of the Spanish colonial system, and was used as a base for the Spanish to control the area.
In the 19th century, the area of Palmas was part of the municipality of Carolina. In 1838, the area was separated from Carolina and became its own municipality. The municipality was named Palmas in honor of the original settlement.
Geography
Palmas is located in the northern coast of Puerto Rico, and is bordered by the municipalities of Loíza, Carolina, Canóvanas, and Río Grande. The municipality has a total area of 24.7 square miles, and is divided into two regions: the coastal region and the mountain region. The coastal region is located in the northern part of the municipality, and is characterized by its beaches and coastal plains. The mountain region is located in the southern part of the municipality, and is characterized by its hills and mountains.
The municipality of Palmas is home to several rivers, including the Río Grande de Loíza, the Río Grande de Manatí, and the Río Grande de Palmas. The municipality also has several lakes, including the Lago de Palmas and the Lago de Loíza.
Economy
The economy of Palmas is mainly based on agriculture and tourism. The municipality is home to several agricultural products, including sugar cane, coffee, and tobacco. The municipality is also home to several tourist attractions, including beaches, historical sites, and natural parks.
The municipality of Palmas is also home to several industrial parks, which are home to several manufacturing and technology companies. The industrial parks are located in the towns of Canóvanas and Río Grande.
Demographics
As of the 2010 census, the population of Palmas was 40,092. The population is mainly composed of people of Puerto Rican descent, with a small percentage of people of other ethnicities. The majority of the population is Roman Catholic, with a small percentage of people of other religions. The median household income in Palmas is $20,000, and the median age is 37. The unemployment rate in Palmas is 8.3%, which is higher than the national average.
Common Questions
What is Per Capita Income in Palmas?
Per Capita income in Palmas is $11,860.
What is the Median Family Income in Palmas?
Median Family Income in Palmas is $18,576.
What is the Median Household income in Palmas?
Median Household Income in Palmas is $18,634.
What is Family Income Deficit in Palmas?
Family Income Deficit in Palmas is $9,261.
Families that are below poverty line in Palmas earn $9,261 less on average than the poverty threshold level.
What is Inequality or Gini Index in Palmas?
Inequality or Gini Index in Palmas is 0.45.
What is the Total Population of Palmas?
Total Population of Palmas is 1,061.
What is the Total Male Population of Palmas?
Total Male Population of Palmas is 482.
What is the Total Female Population of Palmas?
Total Female Population of Palmas is 579.
What is the Ratio of Males per 100 Females in Palmas?
There are 83.25 Males per 100 Females in Palmas.
What is the Ratio of Females per 100 Males in Palmas?
There are 120.12 Females per 100 Males in Palmas.
What is the Median Population Age in Palmas?
Median Population Age in Palmas is 51.7 Years.
What is the Average Family Size in Palmas
Average Family Size in Palmas is 2.8 People.
What is the Average Household Size in Palmas
Average Household Size in Palmas is 2.2 People.
How Large is the Labor Force in Palmas?
There are 240 People in the Labor Forcein in Palmas.
What is the Percentage of People in the Labor Force in Palmas?
25.1% of People are in the Labor Force in Palmas.
What is the Unemployment Rate in Palmas?
Unemployment Rate in Palmas is 9.2%.