Yabucoa, PR Map & Demographics
Yabucoa Map
Yabucoa Overview
$11,342
PER CAPITA INCOME
$20,657
AVG FAMILY INCOME
$16,423
AVG HOUSEHOLD INCOME
5.6%
WAGE / INCOME GAP [ % ]
94.4¢/ $1
WAGE / INCOME GAP [ $ ]
$11,883
FAMILY INCOME DEFICIT
0.54
INEQUALITY / GINI INDEX
6,082
TOTAL POPULATION
2,844
MALE POPULATION
3,238
FEMALE POPULATION
87.83
MALES / 100 FEMALES
113.85
FEMALES / 100 MALES
43.6
MEDIAN AGE
3.1
AVG FAMILY SIZE
2.4
AVG HOUSEHOLD SIZE
1,923
LABOR FORCE [ PEOPLE ]
38.3%
PERCENT IN LABOR FORCE
13.1%
UNEMPLOYMENT RATE
Yabucoa Zip Codes
Yabucoa Area Codes
Income in Yabucoa
Income Overview in Yabucoa
Per Capita Income in Yabucoa is $11,342, while median incomes of families and households are $20,657 and $16,423 respectively.
| Characteristic | Number | Measure |
| Per Capita Income | 6,082 | $11,342 |
| Median Family Income | 1,529 | $20,657 |
| Mean Family Income | 1,529 | $28,030 |
| Median Household Income | 2,536 | $16,423 |
| Mean Household Income | 2,536 | $25,367 |
| Income Deficit | 1,529 | $11,883 |
| Wage / Income Gap (%) | 6,082 | 5.57% |
| Wage / Income Gap ($) | 6,082 | 94.43¢ per $1 |
| Gini / Inequality Index | 6,082 | 0.54 |
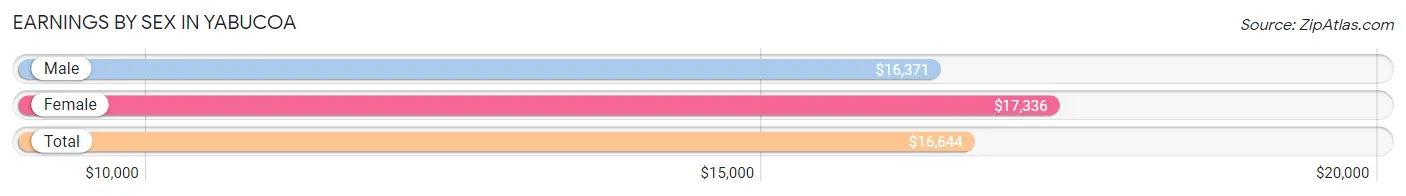
Earnings by Sex in Yabucoa
Average Earnings in Yabucoa are $16,644, $16,371 for men and $17,336 for women, a difference of 5.6%.
| Sex | Number | Average Earnings |
| Male | 908 (47.3%) | $16,371 |
| Female | 1,010 (52.7%) | $17,336 |
| Total | 1,918 (100.0%) | $16,644 |
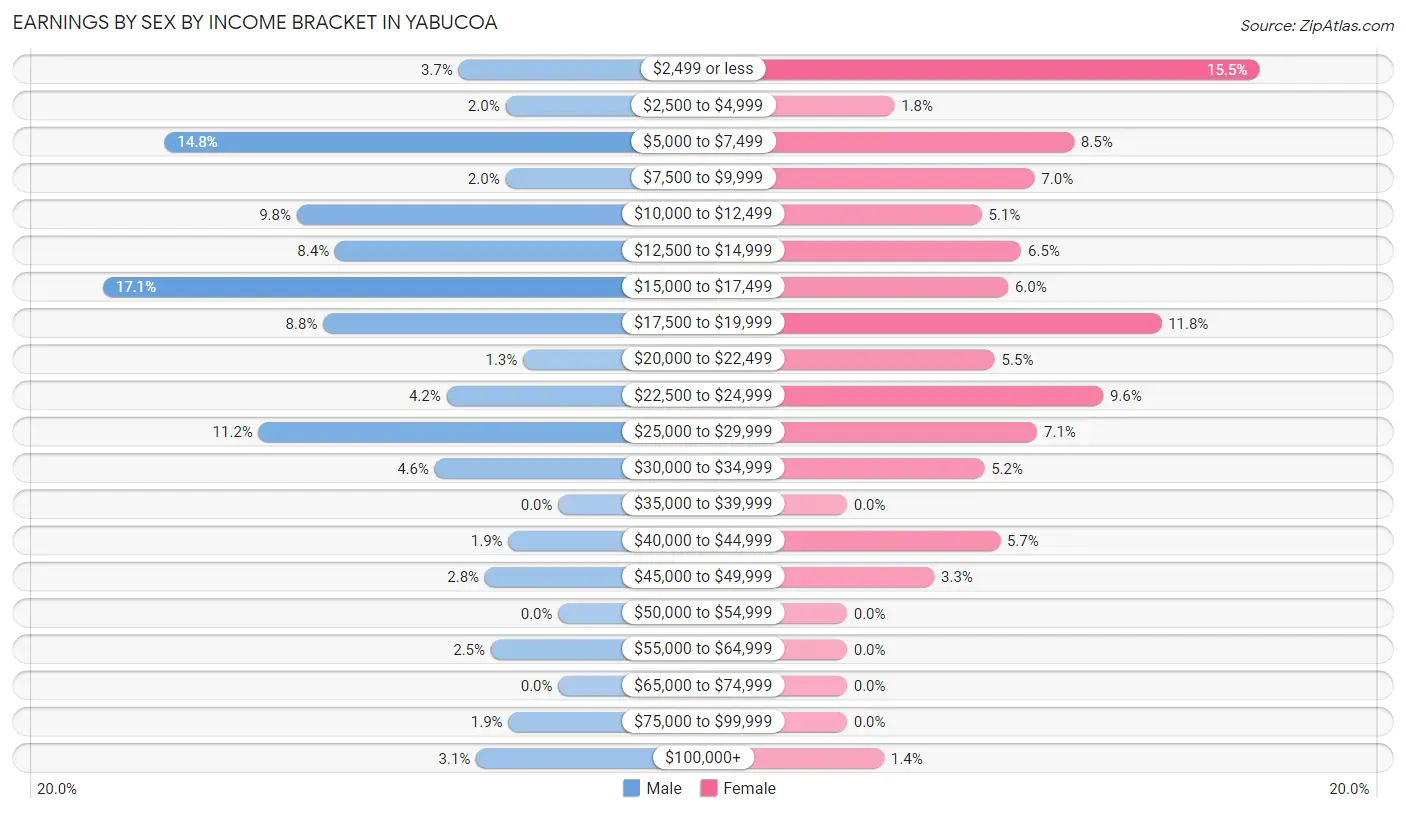
Earnings by Sex by Income Bracket in Yabucoa
The most common earnings brackets in Yabucoa are $15,000 to $17,499 for men (155 | 17.1%) and $2,499 or less for women (156 | 15.4%).
| Income | Male | Female |
| $2,499 or less | 34 (3.7%) | 156 (15.4%) |
| $2,500 to $4,999 | 18 (2.0%) | 18 (1.8%) |
| $5,000 to $7,499 | 134 (14.8%) | 86 (8.5%) |
| $7,500 to $9,999 | 18 (2.0%) | 71 (7.0%) |
| $10,000 to $12,499 | 89 (9.8%) | 51 (5.1%) |
| $12,500 to $14,999 | 76 (8.4%) | 66 (6.5%) |
| $15,000 to $17,499 | 155 (17.1%) | 61 (6.0%) |
| $17,500 to $19,999 | 80 (8.8%) | 119 (11.8%) |
| $20,000 to $22,499 | 12 (1.3%) | 56 (5.5%) |
| $22,500 to $24,999 | 38 (4.2%) | 97 (9.6%) |
| $25,000 to $29,999 | 102 (11.2%) | 72 (7.1%) |
| $30,000 to $34,999 | 42 (4.6%) | 52 (5.1%) |
| $35,000 to $39,999 | 0 (0.0%) | 0 (0.0%) |
| $40,000 to $44,999 | 17 (1.9%) | 58 (5.7%) |
| $45,000 to $49,999 | 25 (2.8%) | 33 (3.3%) |
| $50,000 to $54,999 | 0 (0.0%) | 0 (0.0%) |
| $55,000 to $64,999 | 23 (2.5%) | 0 (0.0%) |
| $65,000 to $74,999 | 0 (0.0%) | 0 (0.0%) |
| $75,000 to $99,999 | 17 (1.9%) | 0 (0.0%) |
| $100,000+ | 28 (3.1%) | 14 (1.4%) |
| Total | 908 (100.0%) | 1,010 (100.0%) |
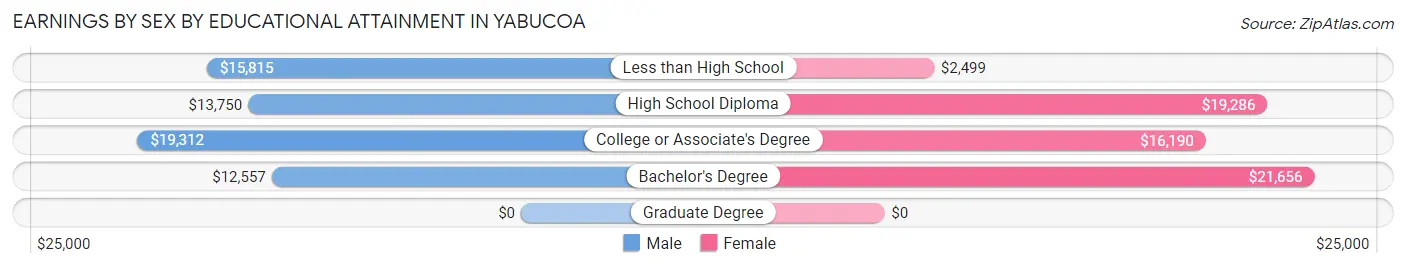
Earnings by Sex by Educational Attainment in Yabucoa
Average earnings in Yabucoa are $16,745 for men and $18,267 for women, a difference of 8.3%. Men with an educational attainment of college or associate's degree enjoy the highest average annual earnings of $19,312, while those with bachelor's degree education earn the least with $12,557. Women with an educational attainment of bachelor's degree earn the most with the average annual earnings of $21,656, while those with less than high school education have the smallest earnings of $2,499.
| Educational Attainment | Male Income | Female Income |
| Less than High School | $15,815 | $2,499 |
| High School Diploma | $13,750 | $19,286 |
| College or Associate's Degree | $19,312 | $16,190 |
| Bachelor's Degree | $12,557 | $21,656 |
| Graduate Degree | - | - |
| Total | $16,745 | $18,267 |
Family Income in Yabucoa
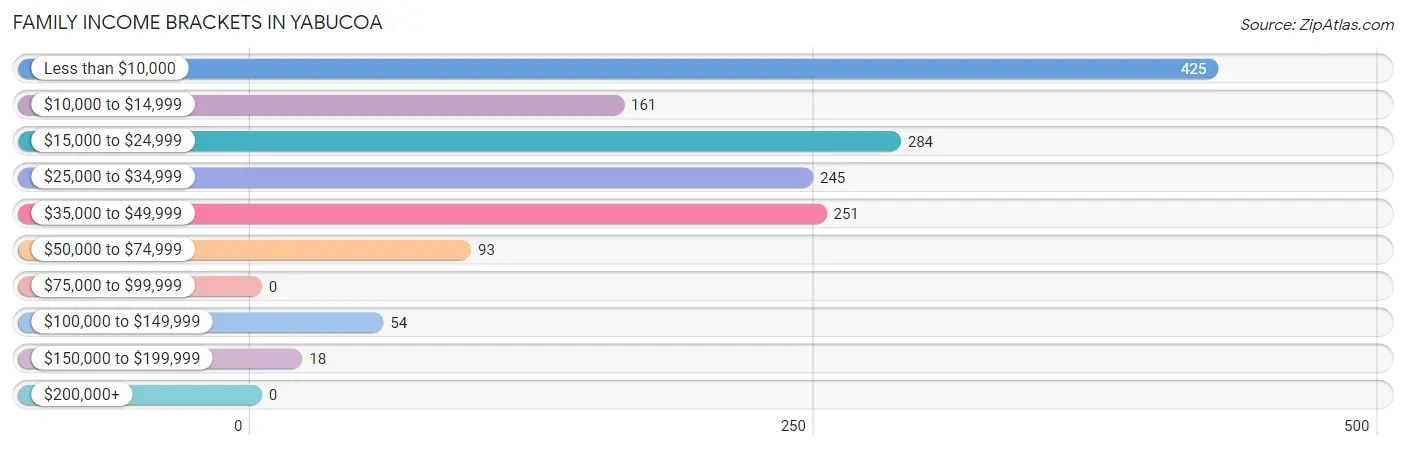
Family Income Brackets in Yabucoa
According to the Yabucoa family income data, there are 425 families falling into the less than $10,000 income range, which is the most common income bracket and makes up 27.8% of all families.
| Income Bracket | # Families | % Families |
| Less than $10,000 | 425 | 27.8% |
| $10,000 to $14,999 | 161 | 10.5% |
| $15,000 to $24,999 | 284 | 18.6% |
| $25,000 to $34,999 | 245 | 16.0% |
| $35,000 to $49,999 | 251 | 16.4% |
| $50,000 to $74,999 | 93 | 6.1% |
| $75,000 to $99,999 | 0 | 0.0% |
| $100,000 to $149,999 | 54 | 3.5% |
| $150,000 to $199,999 | 18 | 1.2% |
| $200,000+ | 0 | 0.0% |
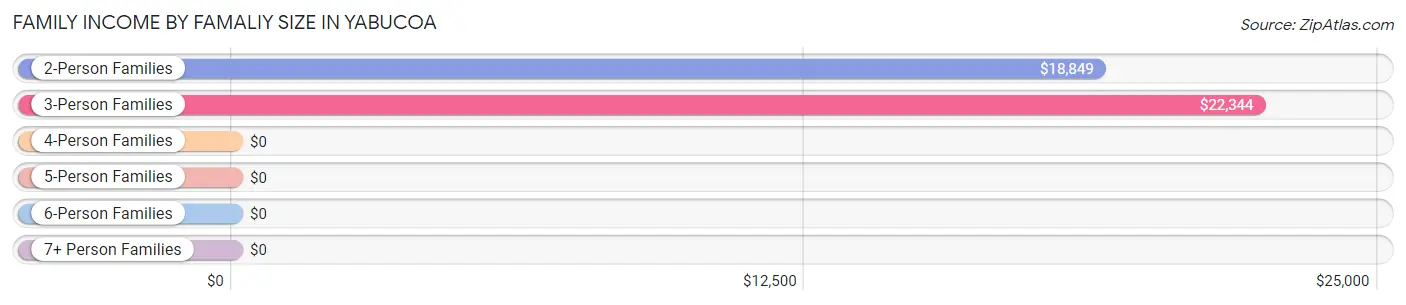
Family Income by Famaliy Size in Yabucoa
3-person families (476 | 31.1%) account for the highest median family income in Yabucoa with $22,344 per family, while 2-person families (807 | 52.8%) have the highest median income of $9,424 per family member.
| Income Bracket | # Families | Median Income |
| 2-Person Families | 807 (52.8%) | $18,849 |
| 3-Person Families | 476 (31.1%) | $22,344 |
| 4-Person Families | 152 (9.9%) | $0 |
| 5-Person Families | 50 (3.3%) | $0 |
| 6-Person Families | 34 (2.2%) | $0 |
| 7+ Person Families | 10 (0.6%) | $0 |
| Total | 1,529 (100.0%) | $20,657 |
Family Income by Number of Earners in Yabucoa
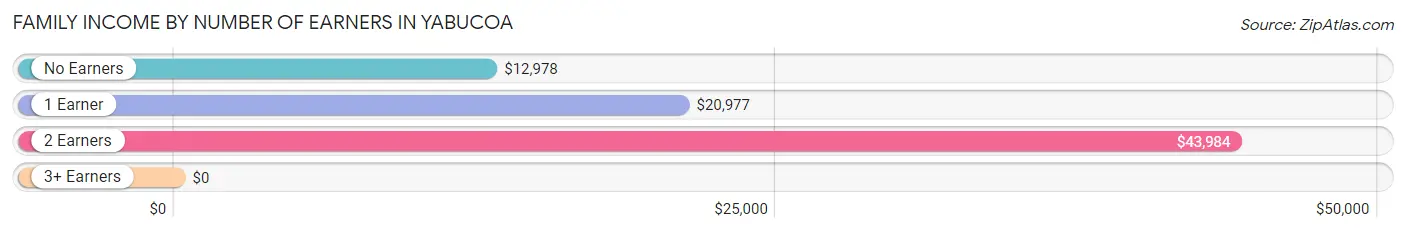
| Number of Earners | # Families | Median Income |
| No Earners | 706 (46.2%) | $12,978 |
| 1 Earner | 472 (30.9%) | $20,977 |
| 2 Earners | 323 (21.1%) | $43,984 |
| 3+ Earners | 28 (1.8%) | $0 |
| Total | 1,529 (100.0%) | $20,657 |
Household Income in Yabucoa
Household Income Brackets in Yabucoa
With 809 households falling in the category, the less than $10,000 income range is the most frequent in Yabucoa, accounting for 31.9% of all households.
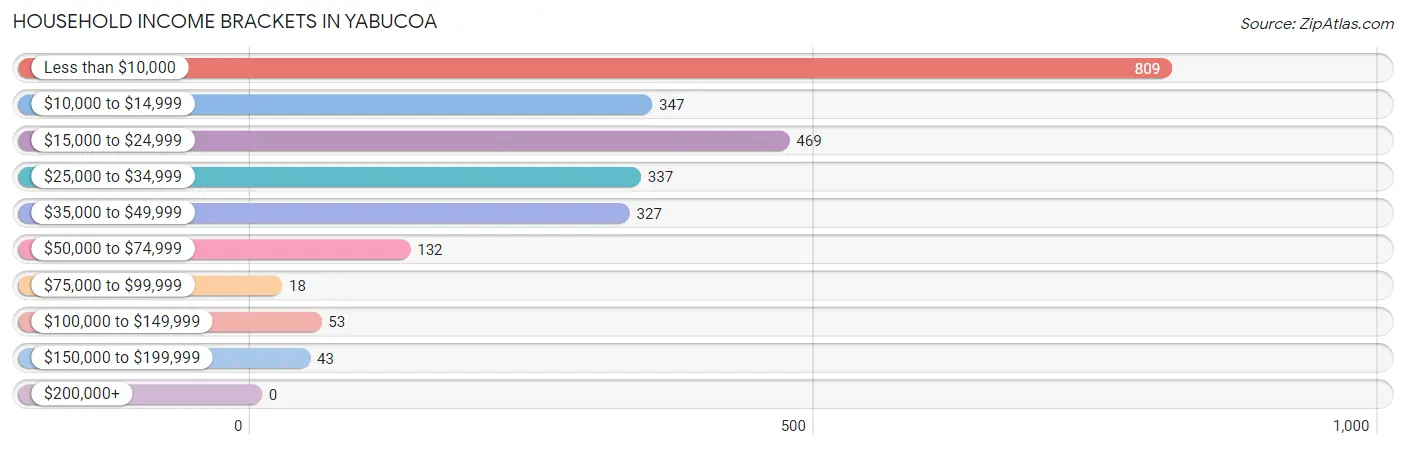
| Income Bracket | # Households | % Households |
| Less than $10,000 | 809 | 31.9% |
| $10,000 to $14,999 | 347 | 13.7% |
| $15,000 to $24,999 | 469 | 18.5% |
| $25,000 to $34,999 | 337 | 13.3% |
| $35,000 to $49,999 | 327 | 12.9% |
| $50,000 to $74,999 | 132 | 5.2% |
| $75,000 to $99,999 | 18 | 0.7% |
| $100,000 to $149,999 | 53 | 2.1% |
| $150,000 to $199,999 | 43 | 1.7% |
| $200,000+ | 0 | 0.0% |
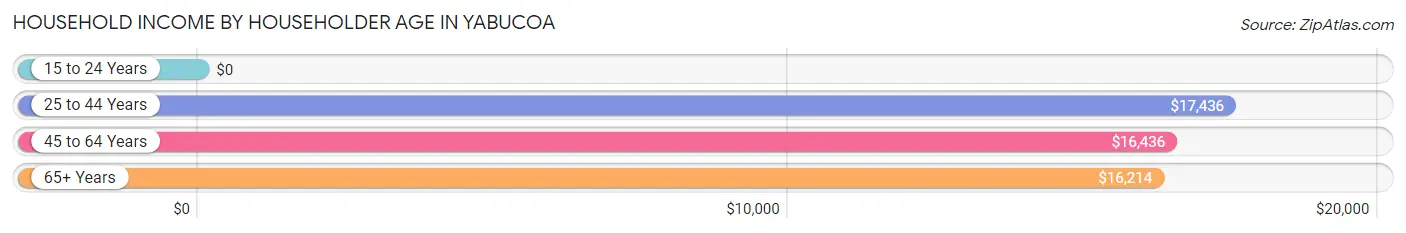
Household Income by Householder Age in Yabucoa
The median household income in Yabucoa is $16,423, with the highest median household income of $17,436 found in the 25 to 44 years age bracket for the primary householder. A total of 601 households (23.7%) fall into this category. Meanwhile, the 15 to 24 years age bracket for the primary householder has the lowest median household income of $0, with 61 households (2.4%) in this group.
| Income Bracket | # Households | Median Income |
| 15 to 24 Years | 61 (2.4%) | $0 |
| 25 to 44 Years | 601 (23.7%) | $17,436 |
| 45 to 64 Years | 998 (39.4%) | $16,436 |
| 65+ Years | 876 (34.5%) | $16,214 |
| Total | 2,536 (100.0%) | $16,423 |
Poverty in Yabucoa
Income Below Poverty by Sex and Age in Yabucoa
With 50.3% poverty level for males and 59.1% for females among the residents of Yabucoa, 5 year old males and 5 year old females are the most vulnerable to poverty, with 47 males (100.0%) and 22 females (100.0%) in their respective age groups living below the poverty level.
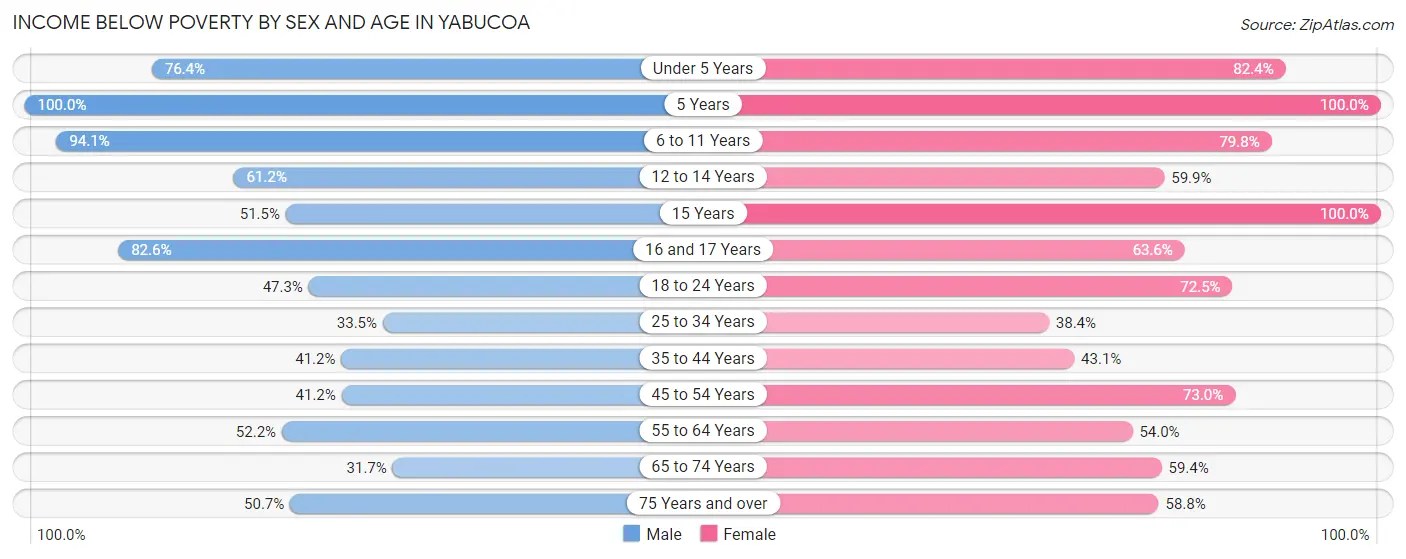
| Age Bracket | Male | Female |
| Under 5 Years | 97 (76.4%) | 70 (82.4%) |
| 5 Years | 47 (100.0%) | 22 (100.0%) |
| 6 to 11 Years | 175 (94.1%) | 126 (79.7%) |
| 12 to 14 Years | 120 (61.2%) | 88 (59.9%) |
| 15 Years | 17 (51.5%) | 60 (100.0%) |
| 16 and 17 Years | 38 (82.6%) | 35 (63.6%) |
| 18 to 24 Years | 104 (47.3%) | 174 (72.5%) |
| 25 to 34 Years | 134 (33.5%) | 186 (38.4%) |
| 35 to 44 Years | 122 (41.2%) | 160 (43.1%) |
| 45 to 54 Years | 170 (41.2%) | 292 (73.0%) |
| 55 to 64 Years | 222 (52.2%) | 198 (53.9%) |
| 65 to 74 Years | 77 (31.7%) | 257 (59.4%) |
| 75 Years and over | 106 (50.7%) | 244 (58.8%) |
| Total | 1,429 (50.3%) | 1,912 (59.1%) |
Income Above Poverty by Sex and Age in Yabucoa
According to the poverty statistics in Yabucoa, males aged 65 to 74 years and females aged 25 to 34 years are the age groups that are most secure financially, with 68.3% of males and 61.6% of females in these age groups living above the poverty line.
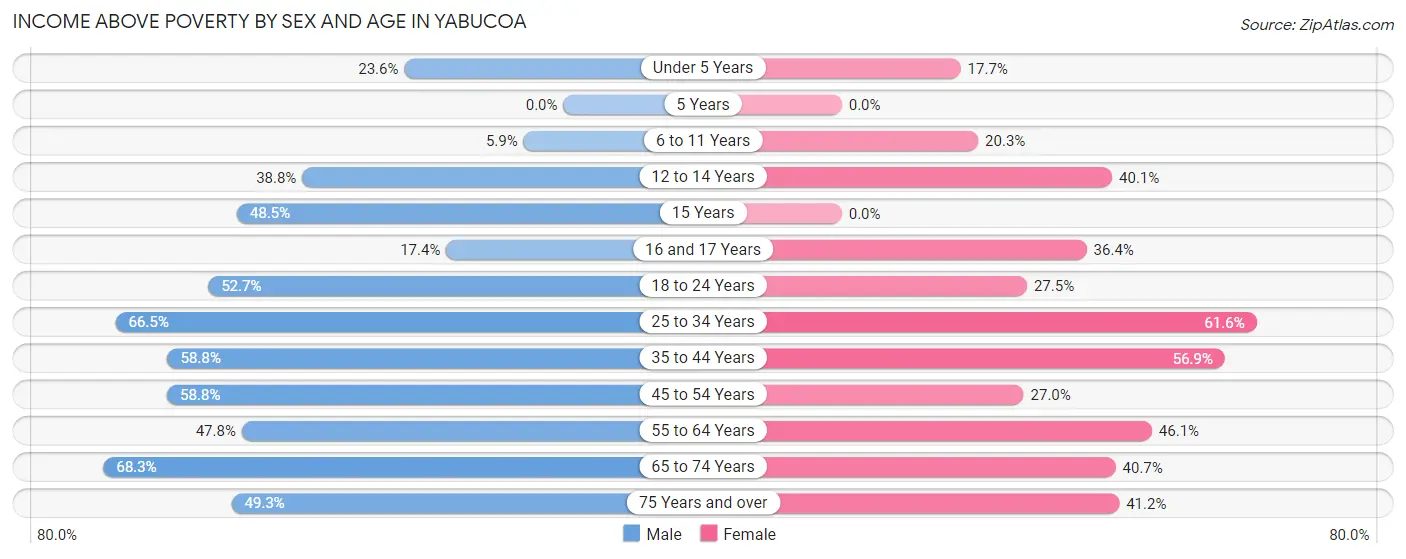
| Age Bracket | Male | Female |
| Under 5 Years | 30 (23.6%) | 15 (17.6%) |
| 5 Years | 0 (0.0%) | 0 (0.0%) |
| 6 to 11 Years | 11 (5.9%) | 32 (20.3%) |
| 12 to 14 Years | 76 (38.8%) | 59 (40.1%) |
| 15 Years | 16 (48.5%) | 0 (0.0%) |
| 16 and 17 Years | 8 (17.4%) | 20 (36.4%) |
| 18 to 24 Years | 116 (52.7%) | 66 (27.5%) |
| 25 to 34 Years | 266 (66.5%) | 298 (61.6%) |
| 35 to 44 Years | 174 (58.8%) | 211 (56.9%) |
| 45 to 54 Years | 243 (58.8%) | 108 (27.0%) |
| 55 to 64 Years | 203 (47.8%) | 169 (46.1%) |
| 65 to 74 Years | 166 (68.3%) | 176 (40.6%) |
| 75 Years and over | 103 (49.3%) | 171 (41.2%) |
| Total | 1,412 (49.7%) | 1,325 (40.9%) |
Income Below Poverty Among Married-Couple Families in Yabucoa
The poverty statistics for married-couple families in Yabucoa show that 32.7% or 216 of the total 661 families live below the poverty line. Families with 3 or 4 children have the highest poverty rate of 100.0%, comprising of 34 families. On the other hand, families with 1 or 2 children have the lowest poverty rate of 26.1%, which includes 29 families.
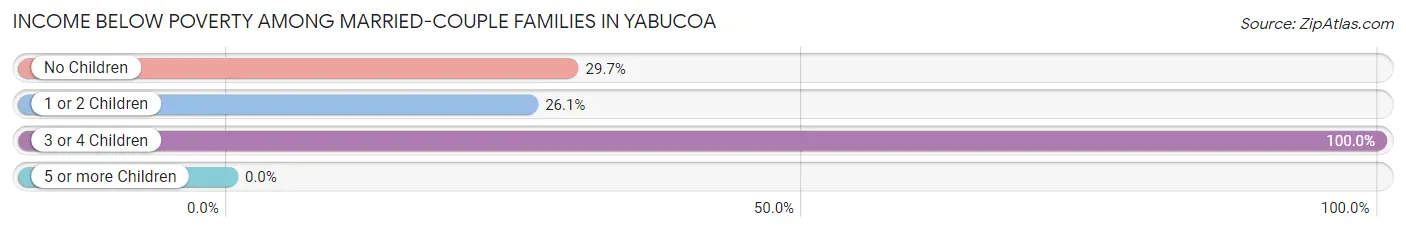
| Children | Above Poverty | Below Poverty |
| No Children | 363 (70.4%) | 153 (29.6%) |
| 1 or 2 Children | 82 (73.9%) | 29 (26.1%) |
| 3 or 4 Children | 0 (0.0%) | 34 (100.0%) |
| 5 or more Children | 0 (0.0%) | 0 (0.0%) |
| Total | 445 (67.3%) | 216 (32.7%) |
Income Below Poverty Among Single-Parent Households in Yabucoa
According to the poverty data in Yabucoa, 60.8% or 101 single-father households and 68.8% or 483 single-mother households are living below the poverty line. Among single-father households, those with 1 or 2 children have the highest poverty rate, with 77 households (67.5%) experiencing poverty. Likewise, among single-mother households, those with 3 or 4 children have the highest poverty rate, with 53 households (100.0%) falling below the poverty line.
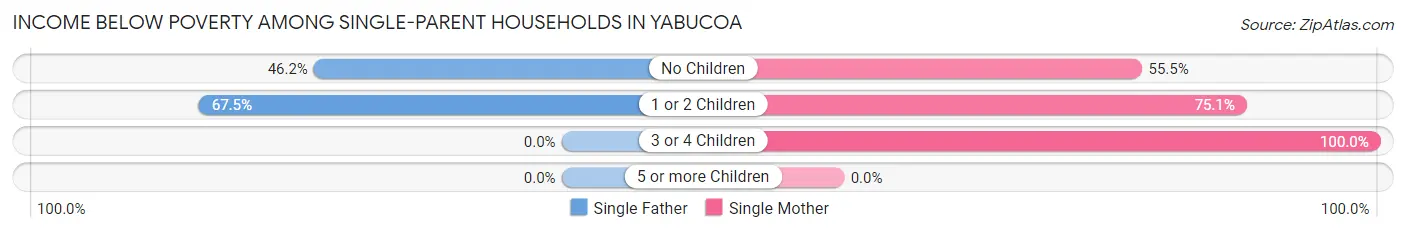
| Children | Single Father | Single Mother |
| No Children | 24 (46.2%) | 162 (55.5%) |
| 1 or 2 Children | 77 (67.5%) | 268 (75.1%) |
| 3 or 4 Children | 0 (0.0%) | 53 (100.0%) |
| 5 or more Children | 0 (0.0%) | 0 (0.0%) |
| Total | 101 (60.8%) | 483 (68.8%) |
Income Below Poverty Among Married-Couple vs Single-Parent Households in Yabucoa
The poverty data for Yabucoa shows that 216 of the married-couple family households (32.7%) and 584 of the single-parent households (67.3%) are living below the poverty level. Within the married-couple family households, those with 3 or 4 children have the highest poverty rate, with 34 households (100.0%) falling below the poverty line. Among the single-parent households, those with 3 or 4 children have the highest poverty rate, with 53 household (100.0%) living below poverty.
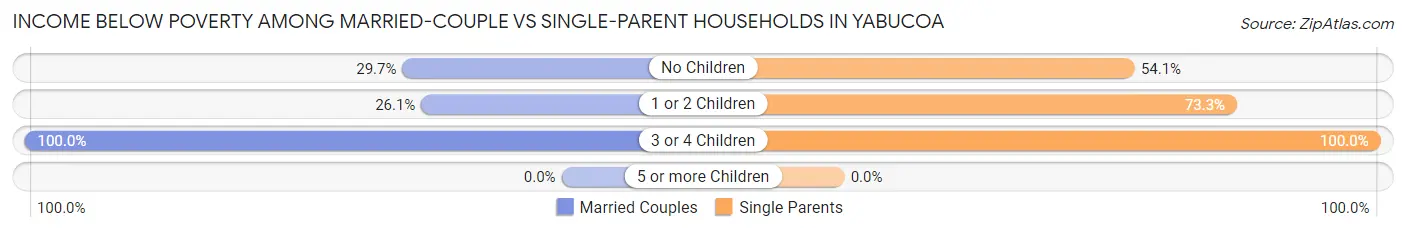
| Children | Married-Couple Families | Single-Parent Households |
| No Children | 153 (29.6%) | 186 (54.1%) |
| 1 or 2 Children | 29 (26.1%) | 345 (73.3%) |
| 3 or 4 Children | 34 (100.0%) | 53 (100.0%) |
| 5 or more Children | 0 (0.0%) | 0 (0.0%) |
| Total | 216 (32.7%) | 584 (67.3%) |
Race in Yabucoa
The most populous races in Yabucoa are Hispanic or Latino (6,072 | 99.8%), Some other Race (2,809 | 46.2%), and Black / African American (2,368 | 38.9%).
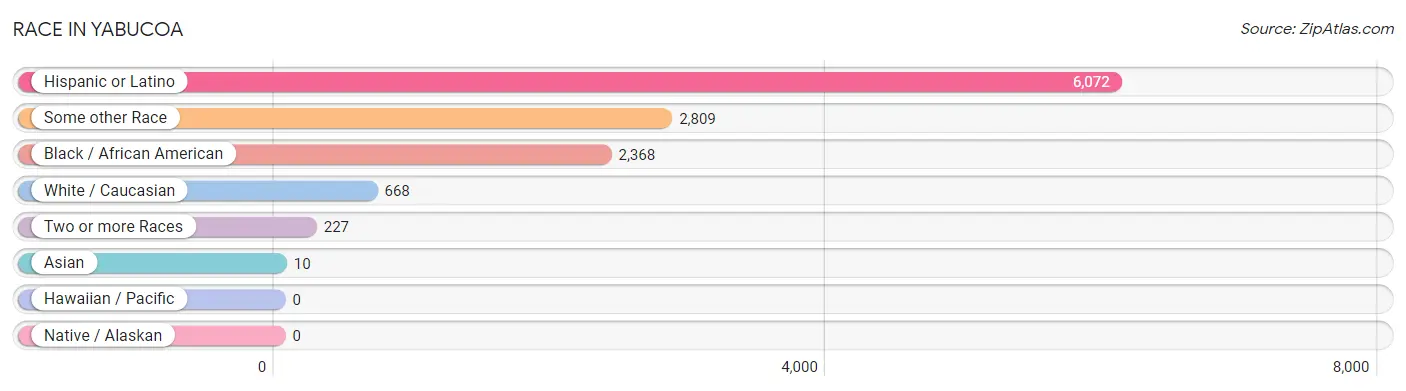
| Race | # Population | % Population |
| Asian | 10 | 0.2% |
| Black / African American | 2,368 | 38.9% |
| Hawaiian / Pacific | 0 | 0.0% |
| Hispanic or Latino | 6,072 | 99.8% |
| Native / Alaskan | 0 | 0.0% |
| White / Caucasian | 668 | 11.0% |
| Two or more Races | 227 | 3.7% |
| Some other Race | 2,809 | 46.2% |
| Total | 6,082 | 100.0% |
Ancestry in Yabucoa
The most populous ancestries reported in Yabucoa are Puerto Rican (5,944 | 97.7%), American (111 | 1.8%), South American (52 | 0.9%), Venezuelan (52 | 0.9%), and Mexican (48 | 0.8%), together accounting for 102.0% of all Yabucoa residents.
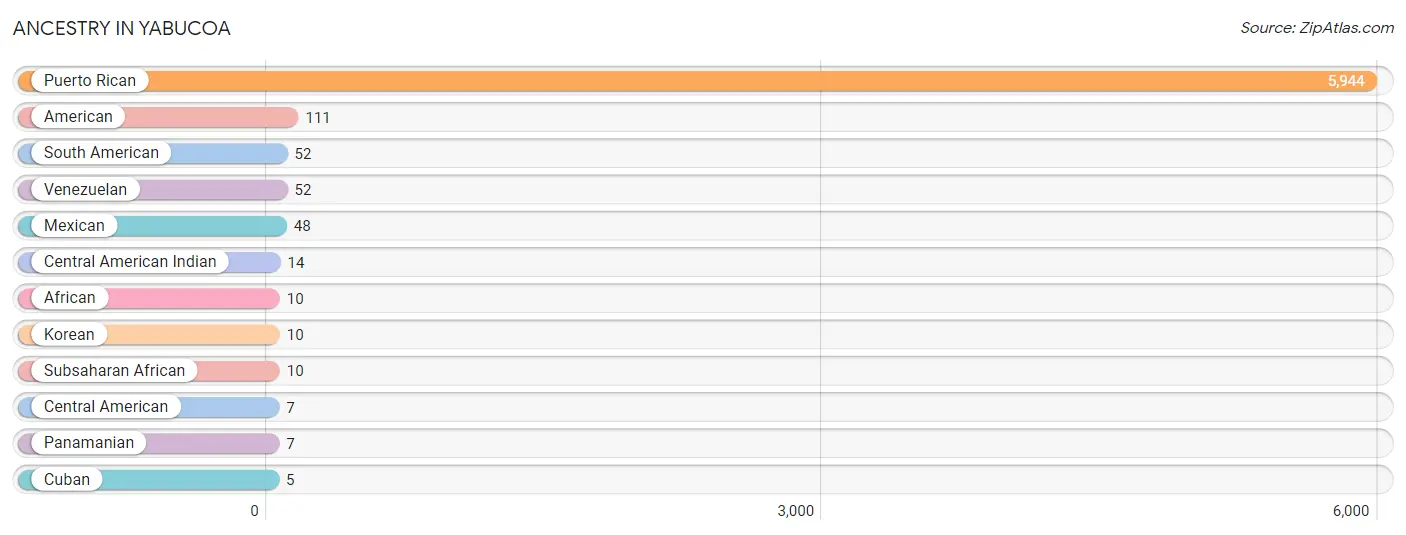
| Ancestry | # Population | % Population |
| African | 10 | 0.2% |
| American | 111 | 1.8% |
| Central American | 7 | 0.1% |
| Central American Indian | 14 | 0.2% |
| Cuban | 5 | 0.1% |
| Korean | 10 | 0.2% |
| Mexican | 48 | 0.8% |
| Panamanian | 7 | 0.1% |
| Puerto Rican | 5,944 | 97.7% |
| South American | 52 | 0.9% |
| Subsaharan African | 10 | 0.2% |
| Venezuelan | 52 | 0.9% | View All 12 Rows |
Immigrants in Yabucoa

| Immigration Origin | # Population | % Population | View All 0 Rows |
Sex and Age in Yabucoa
Sex and Age in Yabucoa
The most populous age groups in Yabucoa are 10 to 14 Years (287 | 10.1%) for men and 65 to 69 Years (297 | 9.2%) for women.
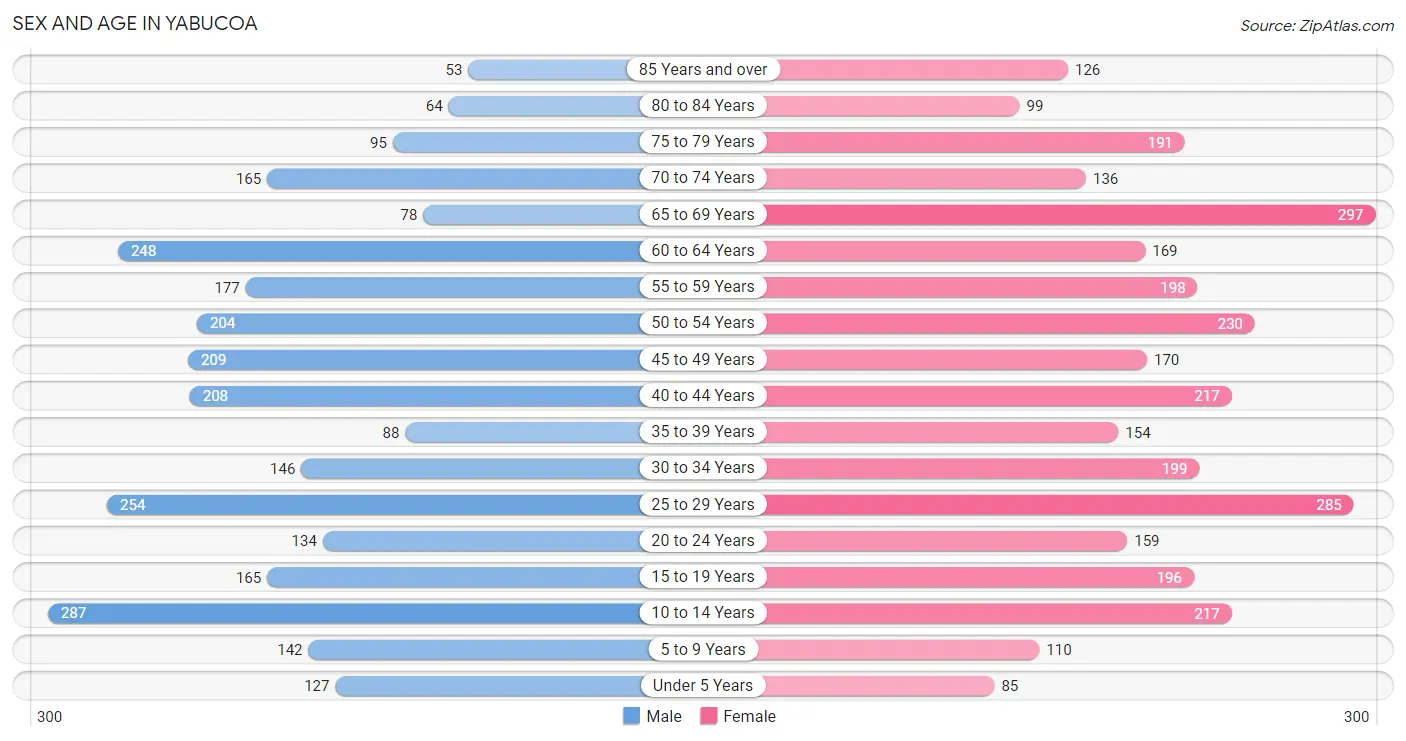
| Age Bracket | Male | Female |
| Under 5 Years | 127 (4.5%) | 85 (2.6%) |
| 5 to 9 Years | 142 (5.0%) | 110 (3.4%) |
| 10 to 14 Years | 287 (10.1%) | 217 (6.7%) |
| 15 to 19 Years | 165 (5.8%) | 196 (6.0%) |
| 20 to 24 Years | 134 (4.7%) | 159 (4.9%) |
| 25 to 29 Years | 254 (8.9%) | 285 (8.8%) |
| 30 to 34 Years | 146 (5.1%) | 199 (6.1%) |
| 35 to 39 Years | 88 (3.1%) | 154 (4.8%) |
| 40 to 44 Years | 208 (7.3%) | 217 (6.7%) |
| 45 to 49 Years | 209 (7.3%) | 170 (5.2%) |
| 50 to 54 Years | 204 (7.2%) | 230 (7.1%) |
| 55 to 59 Years | 177 (6.2%) | 198 (6.1%) |
| 60 to 64 Years | 248 (8.7%) | 169 (5.2%) |
| 65 to 69 Years | 78 (2.7%) | 297 (9.2%) |
| 70 to 74 Years | 165 (5.8%) | 136 (4.2%) |
| 75 to 79 Years | 95 (3.3%) | 191 (5.9%) |
| 80 to 84 Years | 64 (2.2%) | 99 (3.1%) |
| 85 Years and over | 53 (1.9%) | 126 (3.9%) |
| Total | 2,844 (100.0%) | 3,238 (100.0%) |
Families and Households in Yabucoa
Median Family Size in Yabucoa
The median family size in Yabucoa is 3.10 persons per family, with married-couple families (661 | 43.2%) accounting for the largest median family size of 3.15 persons per family. On the other hand, single male/father families (166 | 10.9%) represent the smallest median family size with 2.76 persons per family.
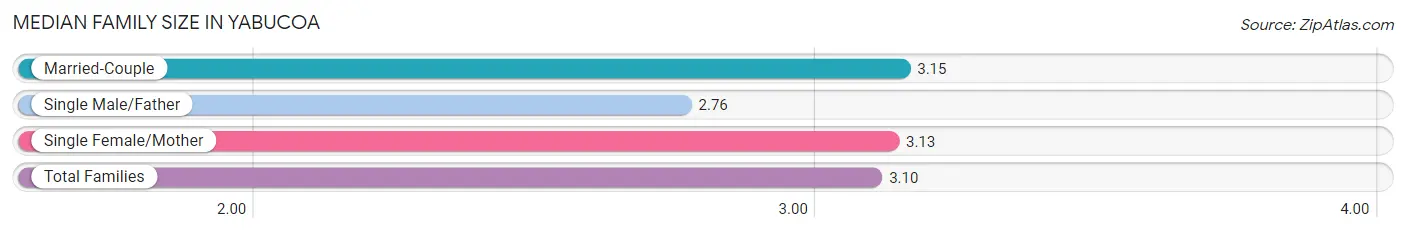
| Family Type | # Families | Family Size |
| Married-Couple | 661 (43.2%) | 3.15 |
| Single Male/Father | 166 (10.9%) | 2.76 |
| Single Female/Mother | 702 (45.9%) | 3.13 |
| Total Families | 1,529 (100.0%) | 3.10 |
Median Household Size in Yabucoa
The median household size in Yabucoa is 2.40 persons per household, with single female/mother households (702 | 27.7%) accounting for the largest median household size of 3.23 persons per household. non-family households (1,007 | 39.7%) represent the smallest median household size with 1.22 persons per household.
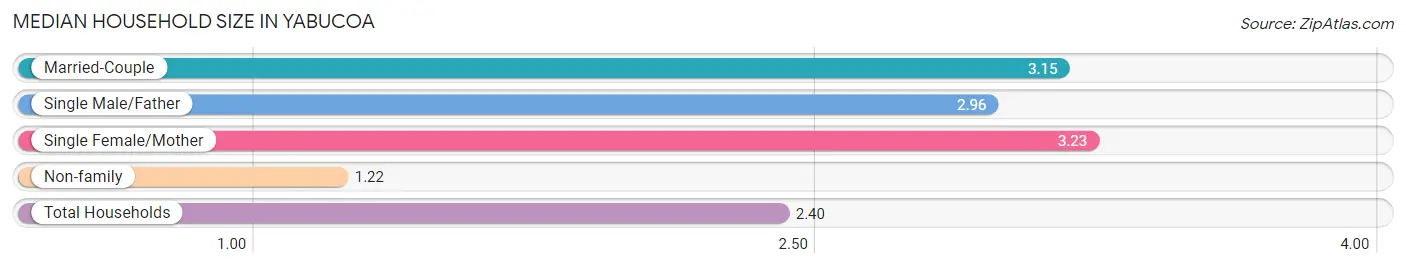
| Household Type | # Households | Household Size |
| Married-Couple | 661 (26.1%) | 3.15 |
| Single Male/Father | 166 (6.6%) | 2.96 |
| Single Female/Mother | 702 (27.7%) | 3.23 |
| Non-family | 1,007 (39.7%) | 1.22 |
| Total Households | 2,536 (100.0%) | 2.40 |
Household Size by Marriage Status in Yabucoa
Out of a total of 2,536 households in Yabucoa, 1,529 (60.3%) are family households, while 1,007 (39.7%) are nonfamily households. The most numerous type of family households are 2-person households, comprising 786, and the most common type of nonfamily households are 1-person households, comprising 789.
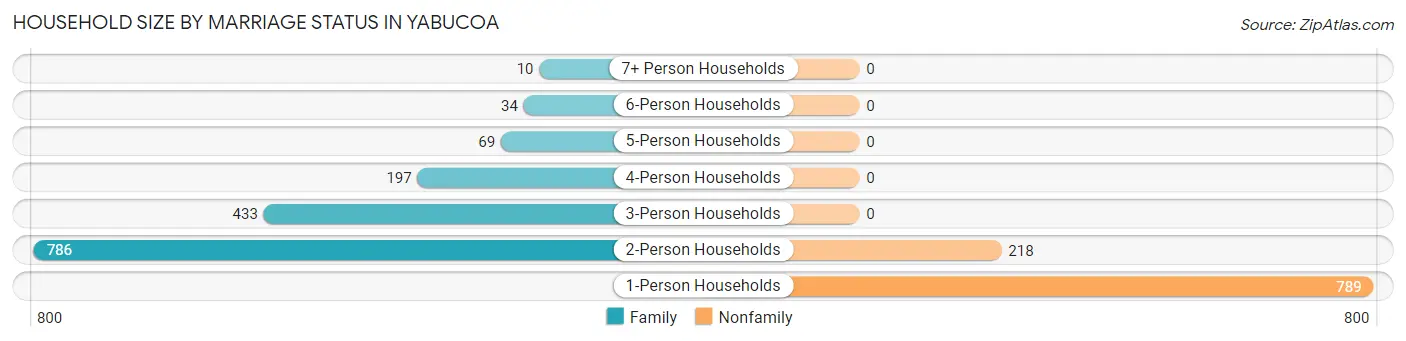
| Household Size | Family Households | Nonfamily Households |
| 1-Person Households | - | 789 (31.1%) |
| 2-Person Households | 786 (31.0%) | 218 (8.6%) |
| 3-Person Households | 433 (17.1%) | 0 (0.0%) |
| 4-Person Households | 197 (7.8%) | 0 (0.0%) |
| 5-Person Households | 69 (2.7%) | 0 (0.0%) |
| 6-Person Households | 34 (1.3%) | 0 (0.0%) |
| 7+ Person Households | 10 (0.4%) | 0 (0.0%) |
| Total | 1,529 (60.3%) | 1,007 (39.7%) |
Female Fertility in Yabucoa
Fertility by Age in Yabucoa
Average fertility rate in Yabucoa is 43.0 births per 1,000 women. Women in the age bracket of 20 to 34 years have the highest fertility rate with 93.0 births per 1,000 women. Women in the age bracket of 20 to 34 years acount for 100.0% of all women with births.
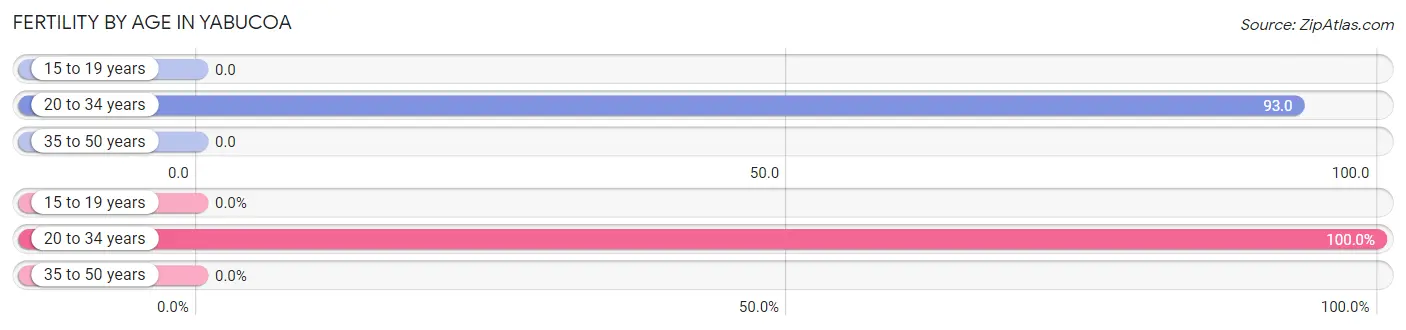
| Age Bracket | Women with Births | Births / 1,000 Women |
| 15 to 19 years | 0 (0.0%) | 0.0 |
| 20 to 34 years | 60 (100.0%) | 93.0 |
| 35 to 50 years | 0 (0.0%) | 0.0 |
| Total | 60 (100.0%) | 43.0 |
Fertility by Age by Marriage Status in Yabucoa
23.3% of women with births (60) in Yabucoa are married. The highest percentage of unmarried women with births falls into 20 to 34 years age bracket with 76.7% of them unmarried at the time of birth, while the lowest percentage of unmarried women with births belong to 20 to 34 years age bracket with 76.7% of them unmarried.
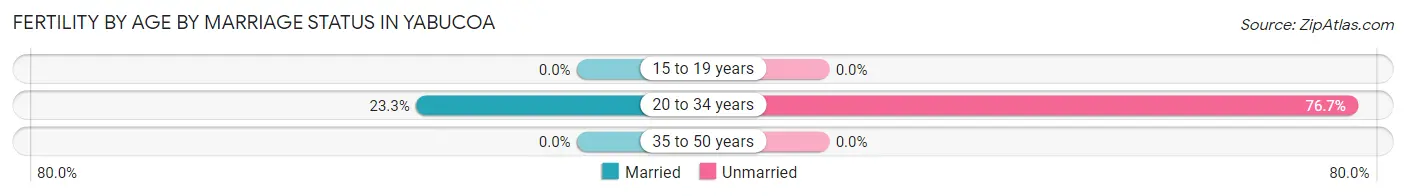
| Age Bracket | Married | Unmarried |
| 15 to 19 years | 0 (0.0%) | 0 (0.0%) |
| 20 to 34 years | 14 (23.3%) | 46 (76.7%) |
| 35 to 50 years | 0 (0.0%) | 0 (0.0%) |
| Total | 14 (23.3%) | 46 (76.7%) |
Fertility by Education in Yabucoa
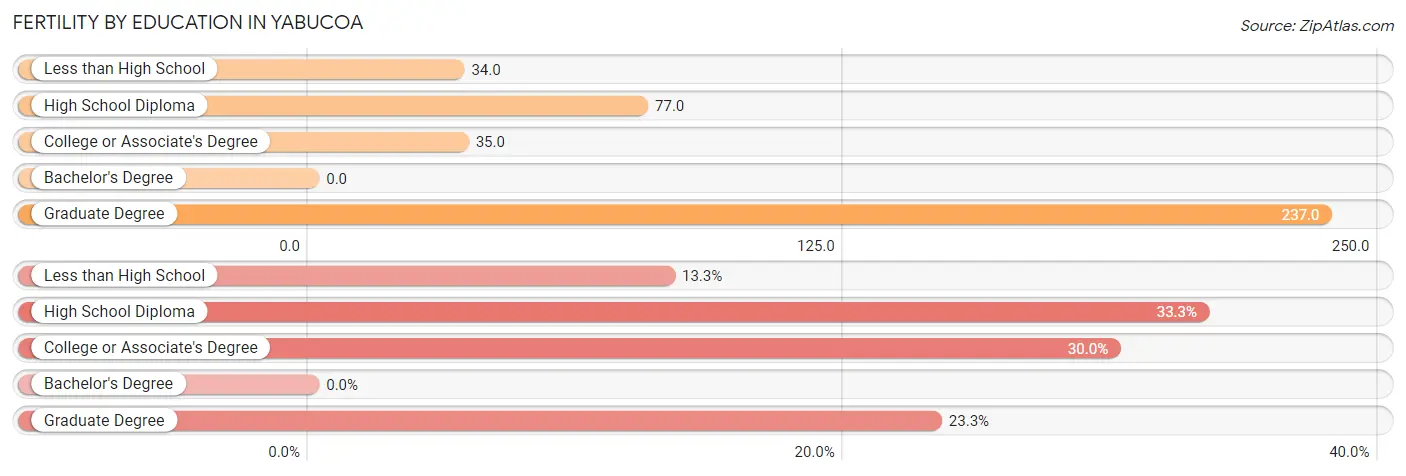
| Educational Attainment | Women with Births | Births / 1,000 Women |
| Less than High School | 8 (13.3%) | 34.0 |
| High School Diploma | 20 (33.3%) | 77.0 |
| College or Associate's Degree | 18 (30.0%) | 35.0 |
| Bachelor's Degree | 0 (0.0%) | 0.0 |
| Graduate Degree | 14 (23.3%) | 237.0 |
| Total | 60 (100.0%) | 43.0 |
Fertility by Education by Marriage Status in Yabucoa
76.7% of women with births in Yabucoa are unmarried. Women with the educational attainment of graduate degree are most likely to be married with 100.0% of them married at childbirth, while women with the educational attainment of less than high school are least likely to be married with 100.0% of them unmarried at childbirth.
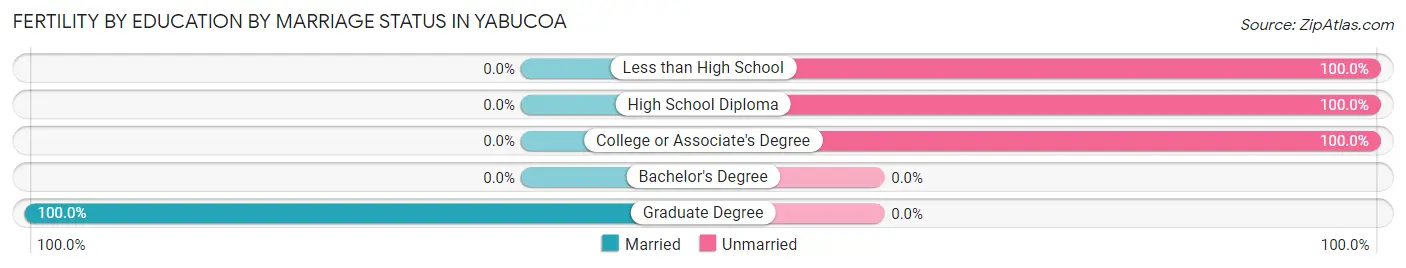
| Educational Attainment | Married | Unmarried |
| Less than High School | 0 (0.0%) | 8 (100.0%) |
| High School Diploma | 0 (0.0%) | 20 (100.0%) |
| College or Associate's Degree | 0 (0.0%) | 18 (100.0%) |
| Bachelor's Degree | 0 (0.0%) | 0 (0.0%) |
| Graduate Degree | 14 (100.0%) | 0 (0.0%) |
| Total | 14 (23.3%) | 46 (76.7%) |
Employment Characteristics in Yabucoa
Employment by Class of Employer in Yabucoa
Among the 1,615 employed individuals in Yabucoa, private company employees (1,101 | 68.2%), state government employees (236 | 14.6%), and self-employed (not incorporated) (115 | 7.1%) make up the most common classes of employment.
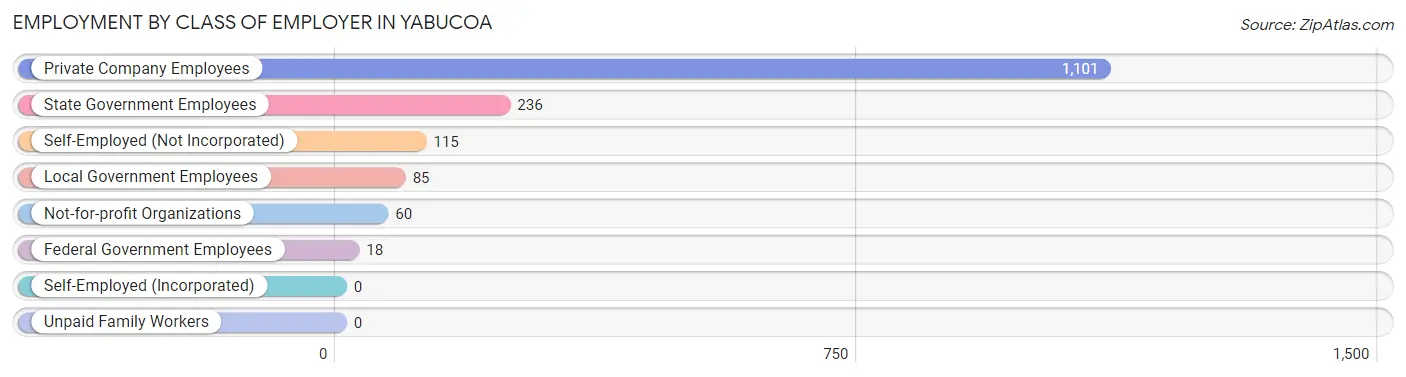
| Employer Class | # Employees | % Employees |
| Private Company Employees | 1,101 | 68.2% |
| Self-Employed (Incorporated) | 0 | 0.0% |
| Self-Employed (Not Incorporated) | 115 | 7.1% |
| Not-for-profit Organizations | 60 | 3.7% |
| Local Government Employees | 85 | 5.3% |
| State Government Employees | 236 | 14.6% |
| Federal Government Employees | 18 | 1.1% |
| Unpaid Family Workers | 0 | 0.0% |
| Total | 1,615 | 100.0% |
Employment Status by Age in Yabucoa
According to the labor force statistics for Yabucoa, out of the total population over 16 years of age (5,021), 38.3% or 1,923 individuals are in the labor force, with 13.1% or 252 of them unemployed. The age group with the highest labor force participation rate is 25 to 29 years, with 80.9% or 436 individuals in the labor force. Within the labor force, the 20 to 24 years age range has the highest percentage of unemployed individuals, with 38.0% or 57 of them being unemployed.
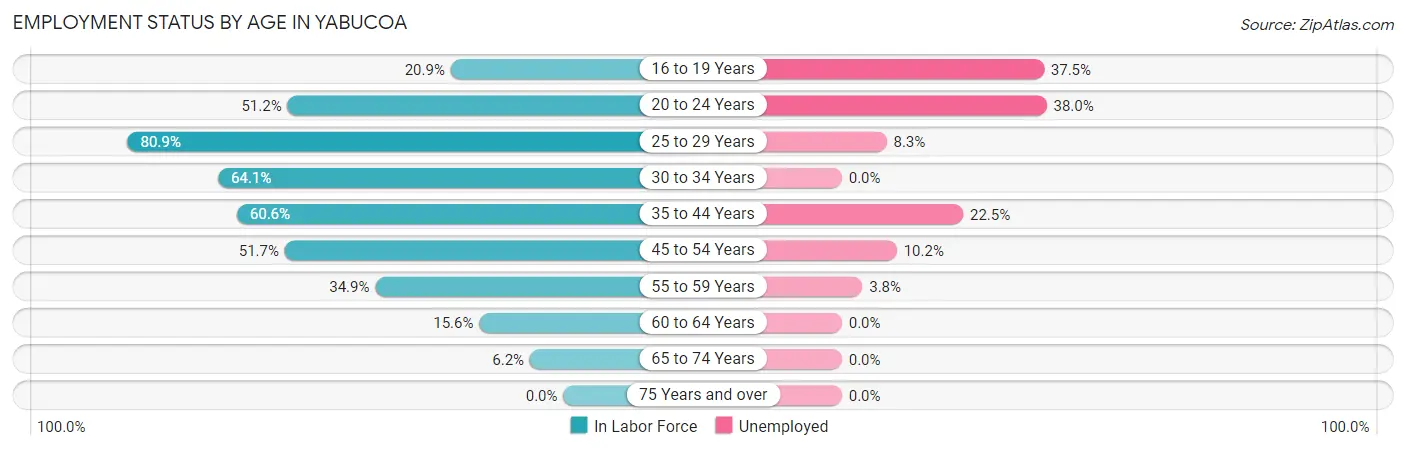
| Age Bracket | In Labor Force | Unemployed |
| 16 to 19 Years | 56 (20.9%) | 21 (37.5%) |
| 20 to 24 Years | 150 (51.2%) | 57 (38.0%) |
| 25 to 29 Years | 436 (80.9%) | 36 (8.3%) |
| 30 to 34 Years | 221 (64.1%) | 0 (0.0%) |
| 35 to 44 Years | 404 (60.6%) | 91 (22.5%) |
| 45 to 54 Years | 420 (51.7%) | 43 (10.2%) |
| 55 to 59 Years | 131 (34.9%) | 5 (3.8%) |
| 60 to 64 Years | 65 (15.6%) | 0 (0.0%) |
| 65 to 74 Years | 42 (6.2%) | 0 (0.0%) |
| 75 Years and over | 0 (0.0%) | 0 (0.0%) |
| Total | 1,923 (38.3%) | 252 (13.1%) |
Employment Status by Educational Attainment in Yabucoa
According to labor force statistics for Yabucoa, 53.1% of individuals (1,676) out of the total population between 25 and 64 years of age (3,156) are in the labor force, with 10.4% or 174 of them being unemployed. The group with the highest labor force participation rate are those with the educational attainment of bachelor's degree or higher, with 79.3% or 579 individuals in the labor force. Within the labor force, individuals with high school diploma education have the highest percentage of unemployment, with 19.3% or 72 of them being unemployed.
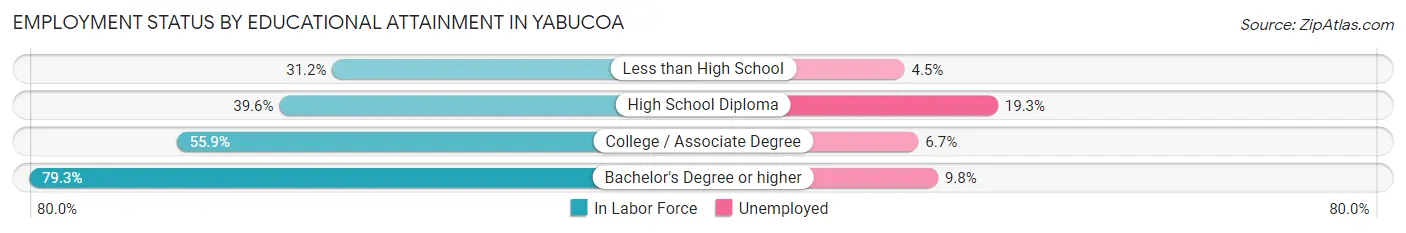
| Educational Attainment | In Labor Force | Unemployed |
| Less than High School | 132 (31.2%) | 19 (4.5%) |
| High School Diploma | 373 (39.6%) | 182 (19.3%) |
| College / Associate Degree | 593 (55.9%) | 71 (6.7%) |
| Bachelor's Degree or higher | 579 (79.3%) | 72 (9.8%) |
| Total | 1,676 (53.1%) | 328 (10.4%) |
Employment Occupations by Sex in Yabucoa
Management, Business, Science and Arts Occupations
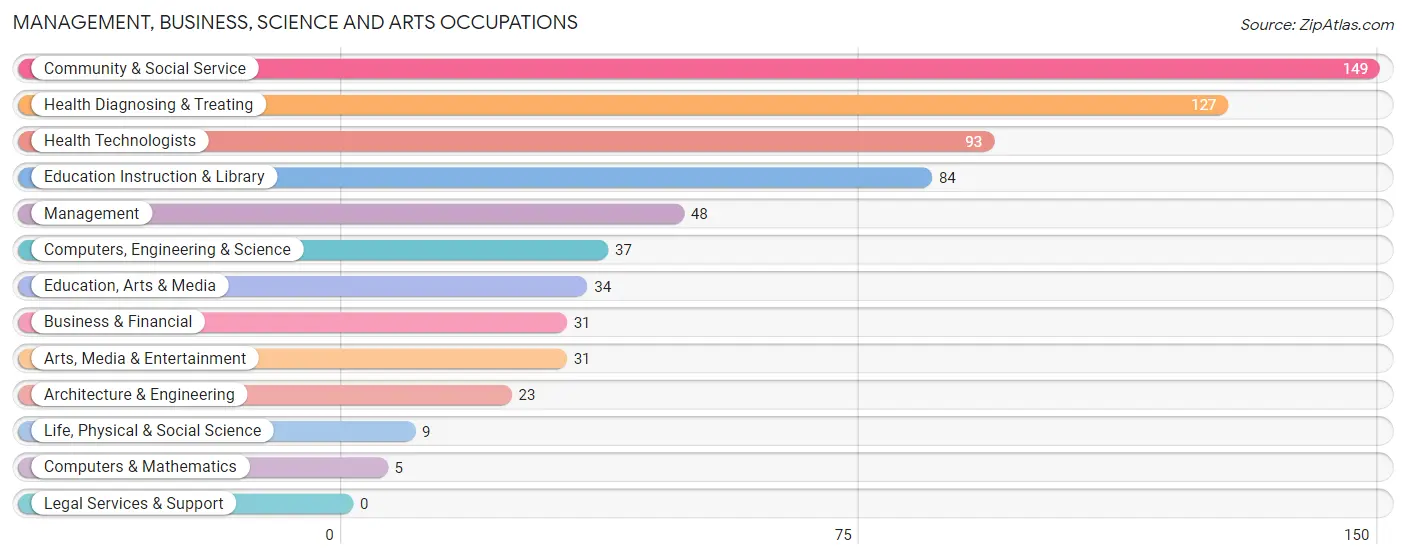
The most common Management, Business, Science and Arts occupations in Yabucoa are Community & Social Service (149 | 8.9%), Health Diagnosing & Treating (127 | 7.6%), Health Technologists (93 | 5.6%), Education Instruction & Library (84 | 5.0%), and Management (48 | 2.9%).
Management, Business, Science and Arts Occupations by Sex
Within the Management, Business, Science and Arts occupations in Yabucoa, the most male-oriented occupations are Computers, Engineering & Science (100.0%), Computers & Mathematics (100.0%), and Architecture & Engineering (100.0%), while the most female-oriented occupations are Education, Arts & Media (100.0%), Education Instruction & Library (88.1%), and Health Diagnosing & Treating (74.8%).
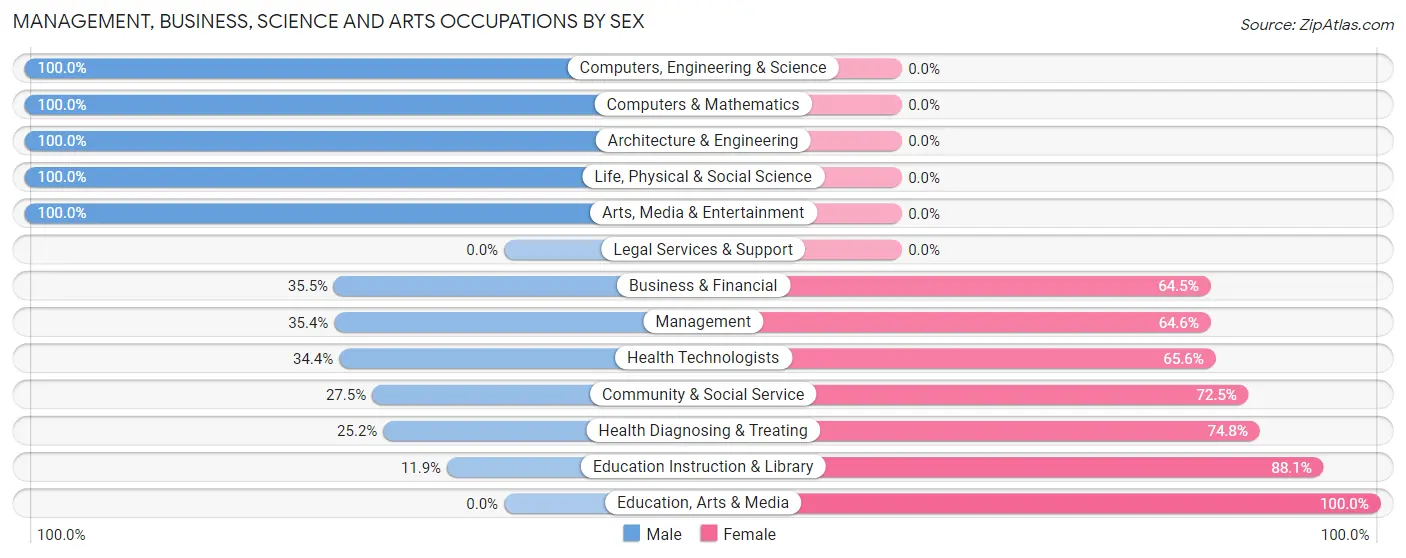
| Occupation | Male | Female |
| Management | 17 (35.4%) | 31 (64.6%) |
| Business & Financial | 11 (35.5%) | 20 (64.5%) |
| Computers, Engineering & Science | 37 (100.0%) | 0 (0.0%) |
| Computers & Mathematics | 5 (100.0%) | 0 (0.0%) |
| Architecture & Engineering | 23 (100.0%) | 0 (0.0%) |
| Life, Physical & Social Science | 9 (100.0%) | 0 (0.0%) |
| Community & Social Service | 41 (27.5%) | 108 (72.5%) |
| Education, Arts & Media | 0 (0.0%) | 34 (100.0%) |
| Legal Services & Support | 0 (0.0%) | 0 (0.0%) |
| Education Instruction & Library | 10 (11.9%) | 74 (88.1%) |
| Arts, Media & Entertainment | 31 (100.0%) | 0 (0.0%) |
| Health Diagnosing & Treating | 32 (25.2%) | 95 (74.8%) |
| Health Technologists | 32 (34.4%) | 61 (65.6%) |
| Total (Category) | 138 (35.2%) | 254 (64.8%) |
| Total (Overall) | 790 (47.2%) | 882 (52.7%) |
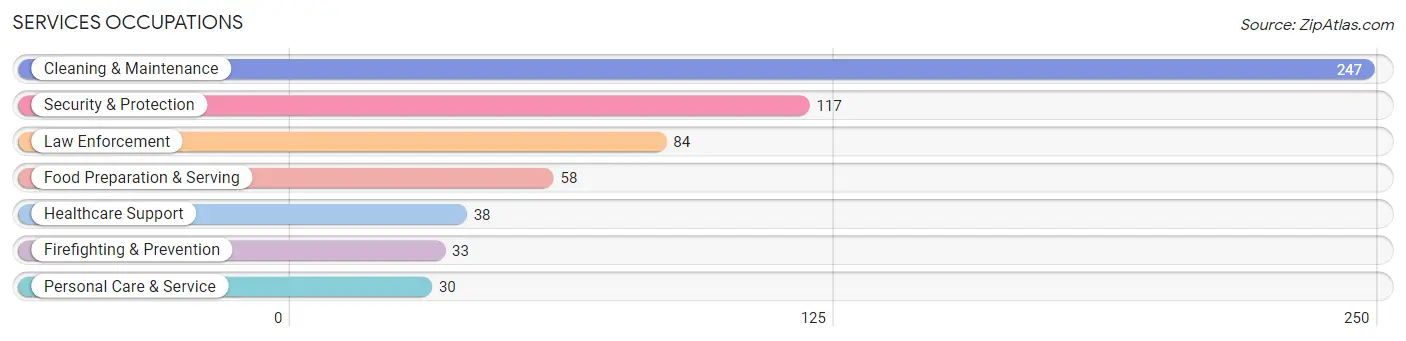
Services Occupations
The most common Services occupations in Yabucoa are Cleaning & Maintenance (247 | 14.8%), Security & Protection (117 | 7.0%), Law Enforcement (84 | 5.0%), Food Preparation & Serving (58 | 3.5%), and Healthcare Support (38 | 2.3%).
Services Occupations by Sex
Within the Services occupations in Yabucoa, the most male-oriented occupations are Law Enforcement (80.9%), Security & Protection (69.2%), and Healthcare Support (57.9%), while the most female-oriented occupations are Food Preparation & Serving (75.9%), Firefighting & Prevention (60.6%), and Personal Care & Service (46.7%).
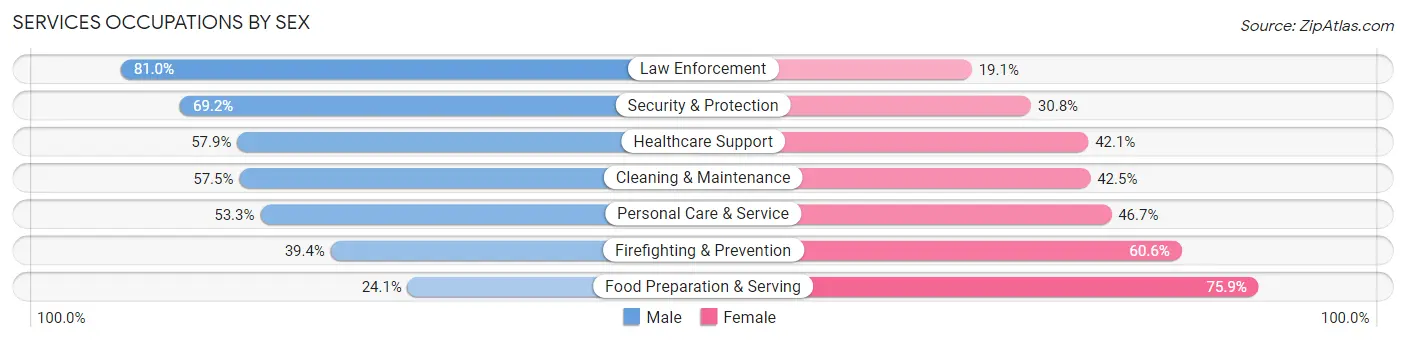
| Occupation | Male | Female |
| Healthcare Support | 22 (57.9%) | 16 (42.1%) |
| Security & Protection | 81 (69.2%) | 36 (30.8%) |
| Firefighting & Prevention | 13 (39.4%) | 20 (60.6%) |
| Law Enforcement | 68 (80.9%) | 16 (19.1%) |
| Food Preparation & Serving | 14 (24.1%) | 44 (75.9%) |
| Cleaning & Maintenance | 142 (57.5%) | 105 (42.5%) |
| Personal Care & Service | 16 (53.3%) | 14 (46.7%) |
| Total (Category) | 275 (56.1%) | 215 (43.9%) |
| Total (Overall) | 790 (47.2%) | 882 (52.7%) |
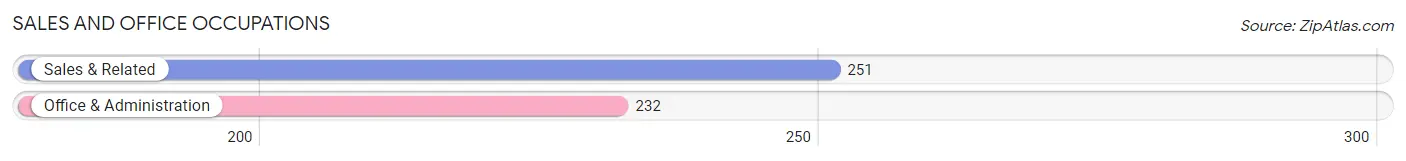
Sales and Office Occupations
The most common Sales and Office occupations in Yabucoa are Sales & Related (251 | 15.0%), and Office & Administration (232 | 13.9%).
Sales and Office Occupations by Sex
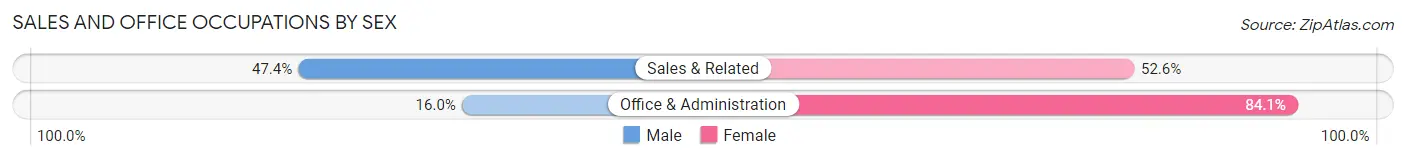
| Occupation | Male | Female |
| Sales & Related | 119 (47.4%) | 132 (52.6%) |
| Office & Administration | 37 (16.0%) | 195 (84.1%) |
| Total (Category) | 156 (32.3%) | 327 (67.7%) |
| Total (Overall) | 790 (47.2%) | 882 (52.7%) |
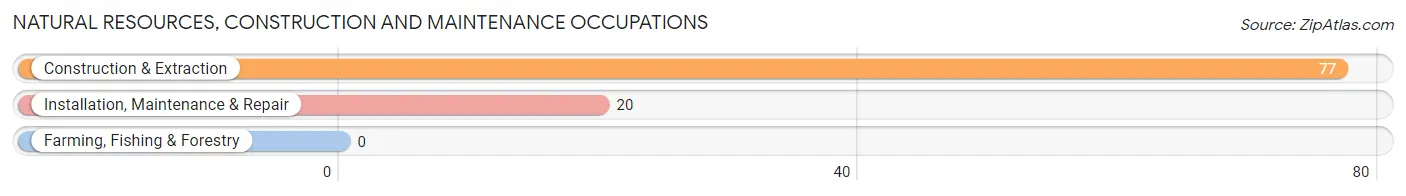
Natural Resources, Construction and Maintenance Occupations
The most common Natural Resources, Construction and Maintenance occupations in Yabucoa are Construction & Extraction (77 | 4.6%), and Installation, Maintenance & Repair (20 | 1.2%).
Natural Resources, Construction and Maintenance Occupations by Sex
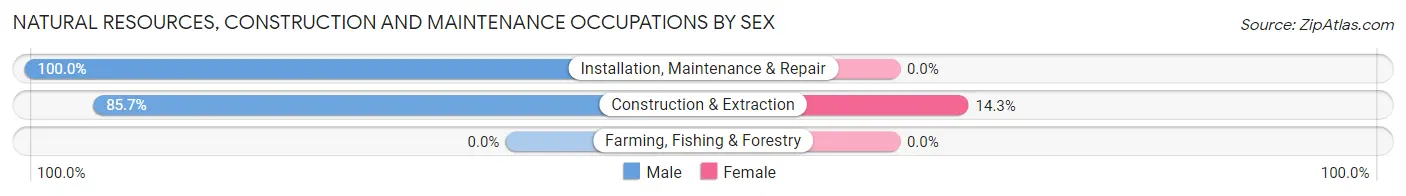
| Occupation | Male | Female |
| Farming, Fishing & Forestry | 0 (0.0%) | 0 (0.0%) |
| Construction & Extraction | 66 (85.7%) | 11 (14.3%) |
| Installation, Maintenance & Repair | 20 (100.0%) | 0 (0.0%) |
| Total (Category) | 86 (88.7%) | 11 (11.3%) |
| Total (Overall) | 790 (47.2%) | 882 (52.7%) |
Production, Transportation and Moving Occupations
The most common Production, Transportation and Moving occupations in Yabucoa are Material Moving (126 | 7.5%), and Production (84 | 5.0%).
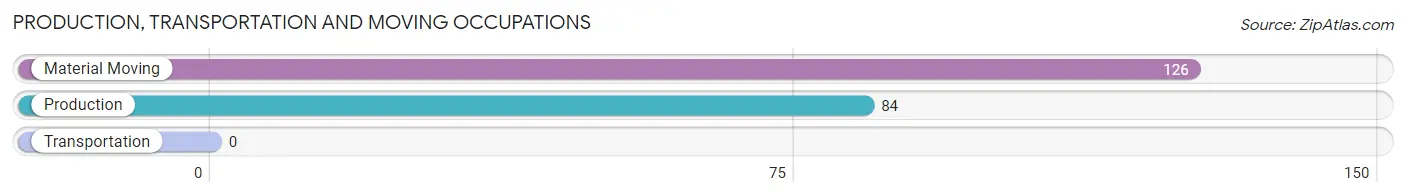
Production, Transportation and Moving Occupations by Sex
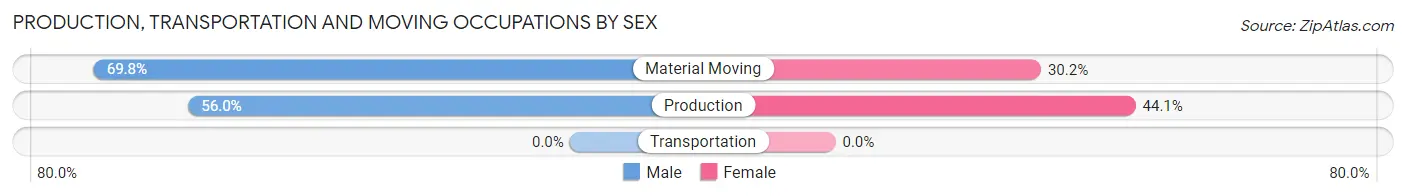
| Occupation | Male | Female |
| Production | 47 (55.9%) | 37 (44.1%) |
| Transportation | 0 (0.0%) | 0 (0.0%) |
| Material Moving | 88 (69.8%) | 38 (30.2%) |
| Total (Category) | 135 (64.3%) | 75 (35.7%) |
| Total (Overall) | 790 (47.2%) | 882 (52.7%) |
Employment Industries by Sex in Yabucoa
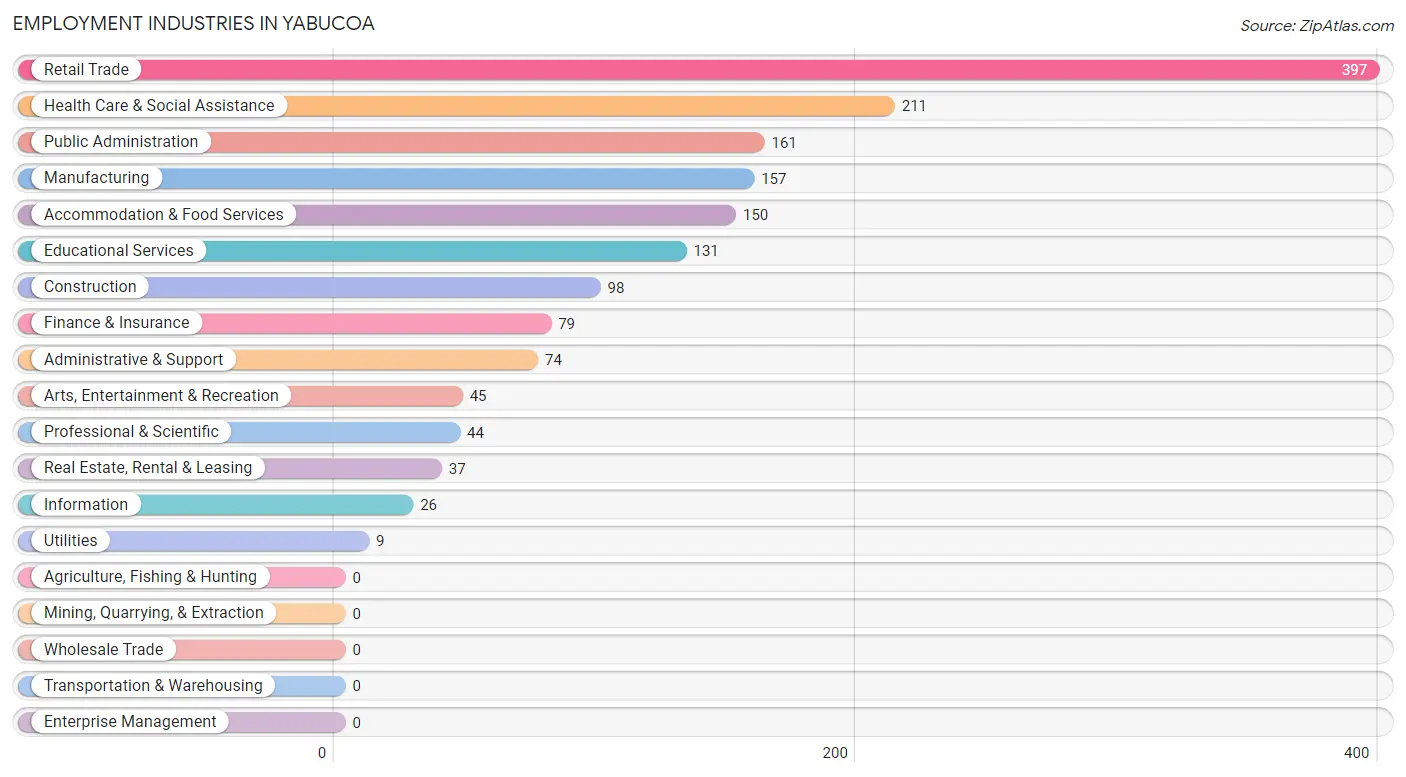
Employment Industries in Yabucoa
The major employment industries in Yabucoa include Retail Trade (397 | 23.7%), Health Care & Social Assistance (211 | 12.6%), Public Administration (161 | 9.6%), Manufacturing (157 | 9.4%), and Accommodation & Food Services (150 | 9.0%).
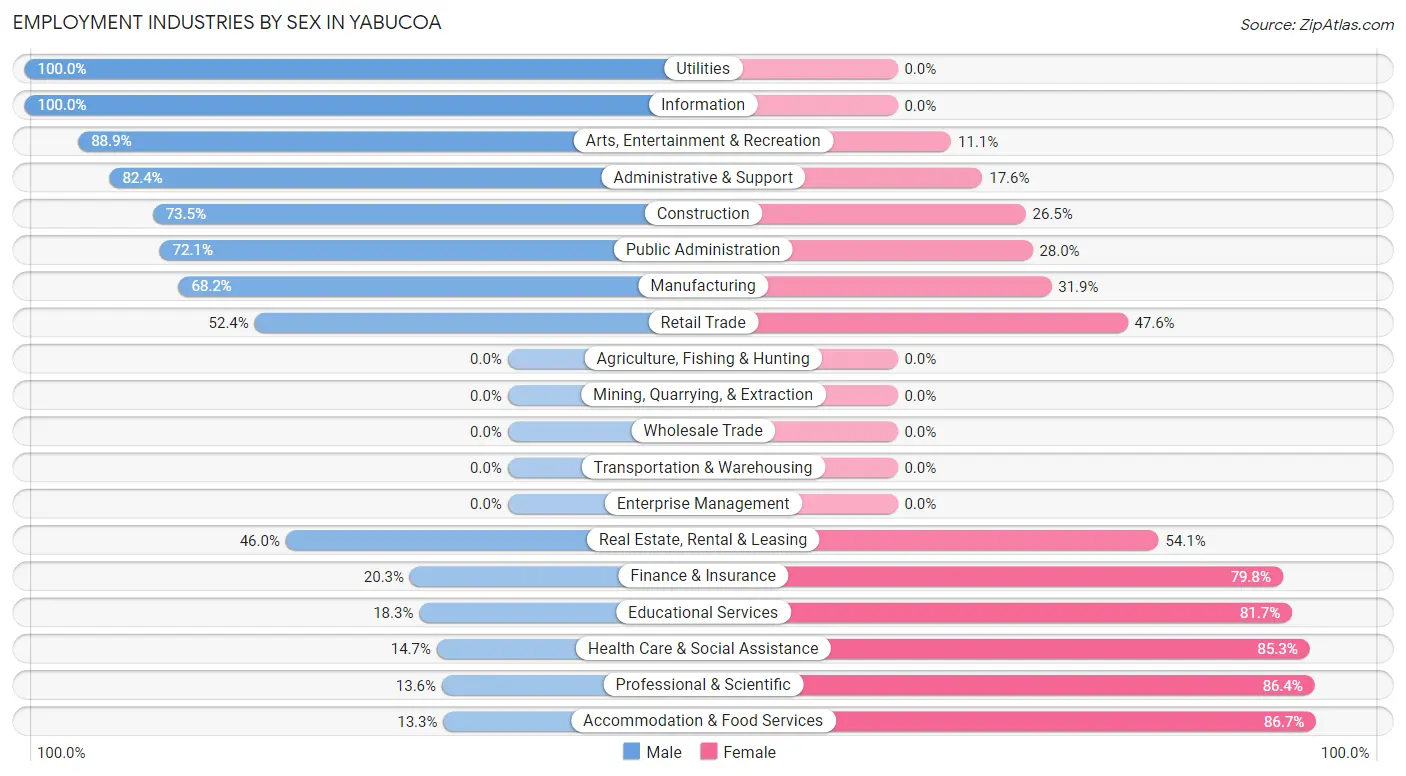
Employment Industries by Sex in Yabucoa
The Yabucoa industries that see more men than women are Utilities (100.0%), Information (100.0%), and Arts, Entertainment & Recreation (88.9%), whereas the industries that tend to have a higher number of women are Accommodation & Food Services (86.7%), Professional & Scientific (86.4%), and Health Care & Social Assistance (85.3%).
| Industry | Male | Female |
| Agriculture, Fishing & Hunting | 0 (0.0%) | 0 (0.0%) |
| Mining, Quarrying, & Extraction | 0 (0.0%) | 0 (0.0%) |
| Construction | 72 (73.5%) | 26 (26.5%) |
| Manufacturing | 107 (68.1%) | 50 (31.9%) |
| Wholesale Trade | 0 (0.0%) | 0 (0.0%) |
| Retail Trade | 208 (52.4%) | 189 (47.6%) |
| Transportation & Warehousing | 0 (0.0%) | 0 (0.0%) |
| Utilities | 9 (100.0%) | 0 (0.0%) |
| Information | 26 (100.0%) | 0 (0.0%) |
| Finance & Insurance | 16 (20.3%) | 63 (79.7%) |
| Real Estate, Rental & Leasing | 17 (46.0%) | 20 (54.0%) |
| Professional & Scientific | 6 (13.6%) | 38 (86.4%) |
| Enterprise Management | 0 (0.0%) | 0 (0.0%) |
| Administrative & Support | 61 (82.4%) | 13 (17.6%) |
| Educational Services | 24 (18.3%) | 107 (81.7%) |
| Health Care & Social Assistance | 31 (14.7%) | 180 (85.3%) |
| Arts, Entertainment & Recreation | 40 (88.9%) | 5 (11.1%) |
| Accommodation & Food Services | 20 (13.3%) | 130 (86.7%) |
| Public Administration | 116 (72.1%) | 45 (28.0%) |
| Total | 790 (47.2%) | 882 (52.7%) |
Education in Yabucoa
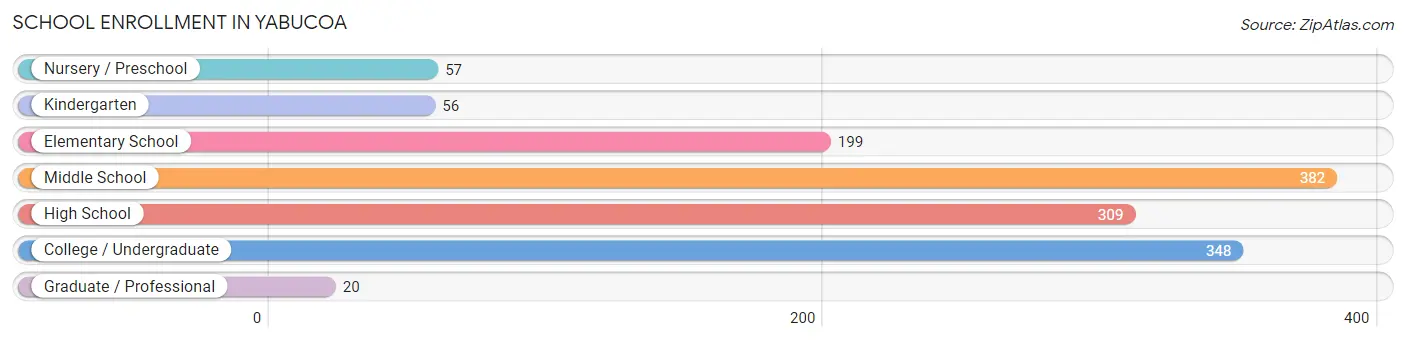
School Enrollment in Yabucoa
The most common levels of schooling among the 1,371 students in Yabucoa are middle school (382 | 27.9%), college / undergraduate (348 | 25.4%), and high school (309 | 22.5%).
| School Level | # Students | % Students |
| Nursery / Preschool | 57 | 4.2% |
| Kindergarten | 56 | 4.1% |
| Elementary School | 199 | 14.5% |
| Middle School | 382 | 27.9% |
| High School | 309 | 22.5% |
| College / Undergraduate | 348 | 25.4% |
| Graduate / Professional | 20 | 1.5% |
| Total | 1,371 | 100.0% |
School Enrollment by Age by Funding Source in Yabucoa
Out of a total of 1,371 students who are enrolled in schools in Yabucoa, 251 (18.3%) attend a private institution, while the remaining 1,120 (81.7%) are enrolled in public schools. The age group of 20 to 24 year olds has the highest likelihood of being enrolled in private schools, with 87 (63.5% in the age bracket) enrolled. Conversely, the age group of 3 to 4 year olds has the lowest likelihood of being enrolled in a private school, with 44 (100.0% in the age bracket) attending a public institution.
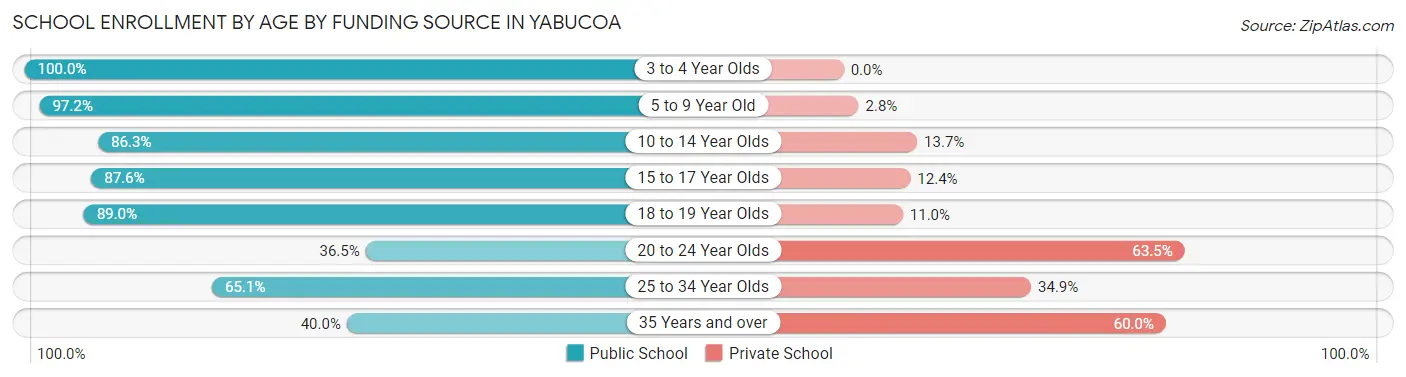
| Age Bracket | Public School | Private School |
| 3 to 4 Year Olds | 44 (100.0%) | 0 (0.0%) |
| 5 to 9 Year Old | 245 (97.2%) | 7 (2.8%) |
| 10 to 14 Year Olds | 435 (86.3%) | 69 (13.7%) |
| 15 to 17 Year Olds | 162 (87.6%) | 23 (12.4%) |
| 18 to 19 Year Olds | 105 (89.0%) | 13 (11.0%) |
| 20 to 24 Year Olds | 50 (36.5%) | 87 (63.5%) |
| 25 to 34 Year Olds | 69 (65.1%) | 37 (34.9%) |
| 35 Years and over | 10 (40.0%) | 15 (60.0%) |
| Total | 1,120 (81.7%) | 251 (18.3%) |
Educational Attainment by Field of Study in Yabucoa
Business (288 | 29.7%), education (242 | 25.0%), science & technology (152 | 15.7%), psychology (60 | 6.2%), and social sciences (58 | 6.0%) are the most common fields of study among 968 individuals in Yabucoa who have obtained a bachelor's degree or higher.
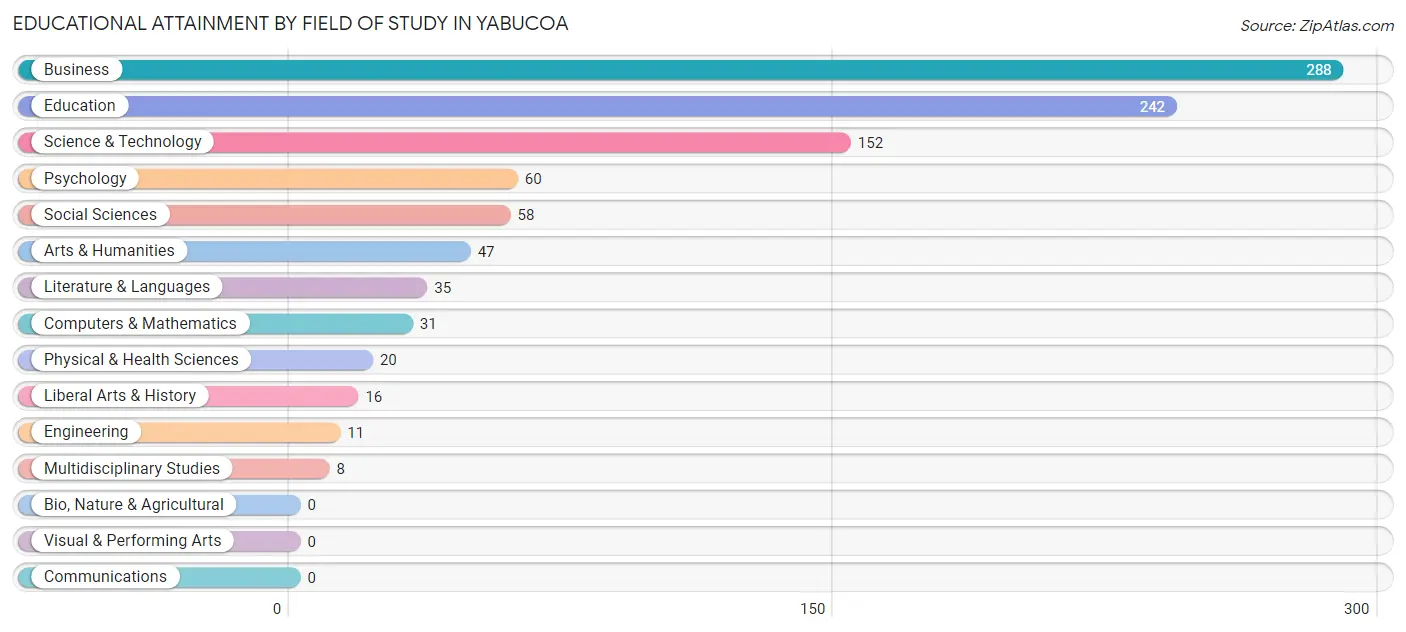
| Field of Study | # Graduates | % Graduates |
| Computers & Mathematics | 31 | 3.2% |
| Bio, Nature & Agricultural | 0 | 0.0% |
| Physical & Health Sciences | 20 | 2.1% |
| Psychology | 60 | 6.2% |
| Social Sciences | 58 | 6.0% |
| Engineering | 11 | 1.1% |
| Multidisciplinary Studies | 8 | 0.8% |
| Science & Technology | 152 | 15.7% |
| Business | 288 | 29.7% |
| Education | 242 | 25.0% |
| Literature & Languages | 35 | 3.6% |
| Liberal Arts & History | 16 | 1.7% |
| Visual & Performing Arts | 0 | 0.0% |
| Communications | 0 | 0.0% |
| Arts & Humanities | 47 | 4.9% |
| Total | 968 | 100.0% |
Transportation & Commute in Yabucoa
Vehicle Availability by Sex in Yabucoa
The most prevalent vehicle ownership categories in Yabucoa are males with 2 vehicles (316, accounting for 41.0%) and females with 2 vehicles (287, making up 37.4%).
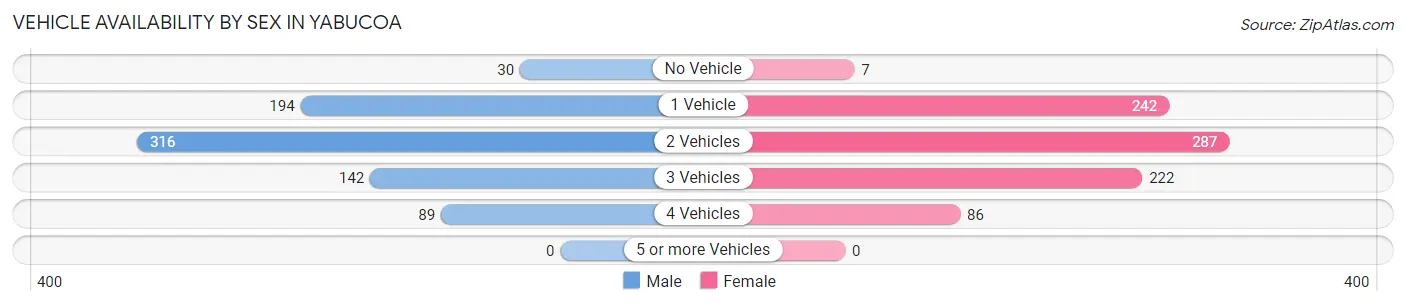
| Vehicles Available | Male | Female |
| No Vehicle | 30 (3.9%) | 7 (0.8%) |
| 1 Vehicle | 194 (25.2%) | 242 (28.7%) |
| 2 Vehicles | 316 (41.0%) | 287 (34.0%) |
| 3 Vehicles | 142 (18.4%) | 222 (26.3%) |
| 4 Vehicles | 89 (11.5%) | 86 (10.2%) |
| 5 or more Vehicles | 0 (0.0%) | 0 (0.0%) |
| Total | 771 (100.0%) | 844 (100.0%) |
Commute Time in Yabucoa
The most frequently occuring commute durations in Yabucoa are 30 to 34 minutes (317 commuters, 19.6%), 5 to 9 minutes (230 commuters, 14.2%), and 10 to 14 minutes (167 commuters, 10.3%).
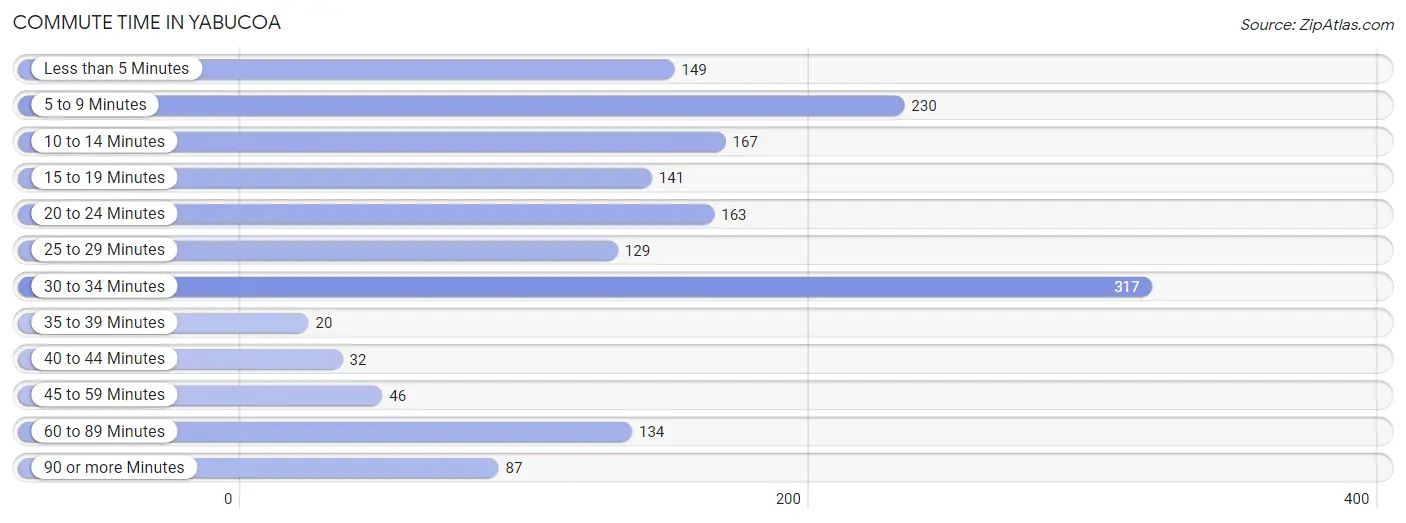
| Commute Time | # Commuters | % Commuters |
| Less than 5 Minutes | 149 | 9.2% |
| 5 to 9 Minutes | 230 | 14.2% |
| 10 to 14 Minutes | 167 | 10.3% |
| 15 to 19 Minutes | 141 | 8.7% |
| 20 to 24 Minutes | 163 | 10.1% |
| 25 to 29 Minutes | 129 | 8.0% |
| 30 to 34 Minutes | 317 | 19.6% |
| 35 to 39 Minutes | 20 | 1.2% |
| 40 to 44 Minutes | 32 | 2.0% |
| 45 to 59 Minutes | 46 | 2.9% |
| 60 to 89 Minutes | 134 | 8.3% |
| 90 or more Minutes | 87 | 5.4% |
Commute Time by Sex in Yabucoa
The most common commute times in Yabucoa are 10 to 14 minutes (141 commuters, 18.3%) for males and 30 to 34 minutes (196 commuters, 23.2%) for females.
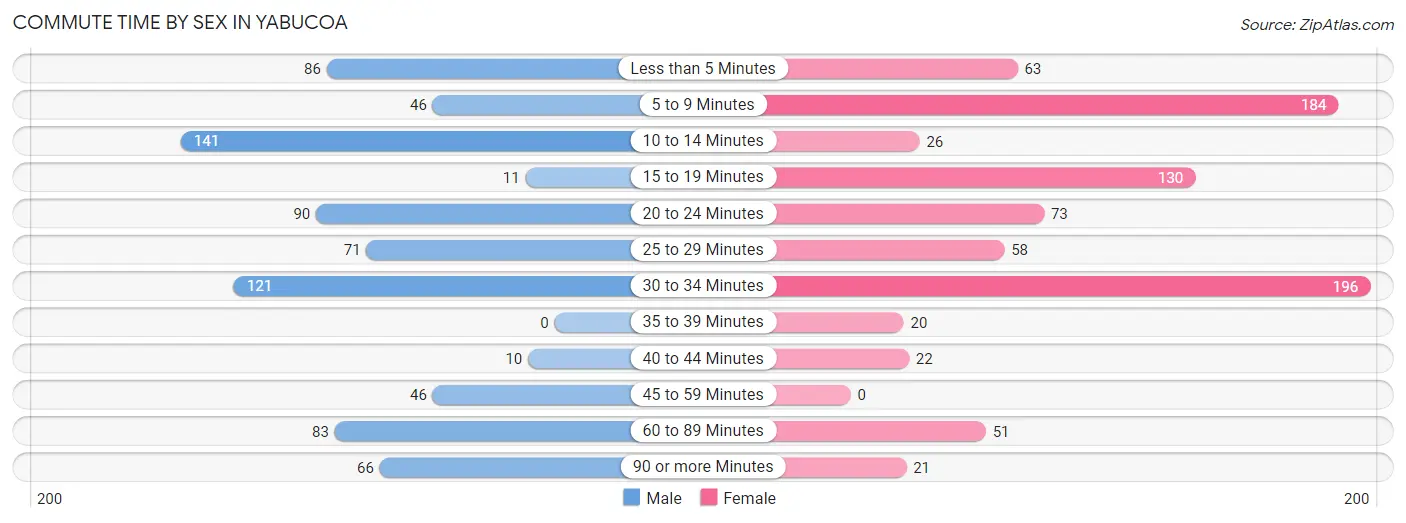
| Commute Time | Male | Female |
| Less than 5 Minutes | 86 (11.2%) | 63 (7.5%) |
| 5 to 9 Minutes | 46 (6.0%) | 184 (21.8%) |
| 10 to 14 Minutes | 141 (18.3%) | 26 (3.1%) |
| 15 to 19 Minutes | 11 (1.4%) | 130 (15.4%) |
| 20 to 24 Minutes | 90 (11.7%) | 73 (8.6%) |
| 25 to 29 Minutes | 71 (9.2%) | 58 (6.9%) |
| 30 to 34 Minutes | 121 (15.7%) | 196 (23.2%) |
| 35 to 39 Minutes | 0 (0.0%) | 20 (2.4%) |
| 40 to 44 Minutes | 10 (1.3%) | 22 (2.6%) |
| 45 to 59 Minutes | 46 (6.0%) | 0 (0.0%) |
| 60 to 89 Minutes | 83 (10.8%) | 51 (6.0%) |
| 90 or more Minutes | 66 (8.6%) | 21 (2.5%) |
Time of Departure to Work by Sex in Yabucoa
The most frequent times of departure to work in Yabucoa are 5:30 AM to 5:59 AM (169, 21.9%) for males and 7:00 AM to 7:29 AM (136, 16.1%) for females.
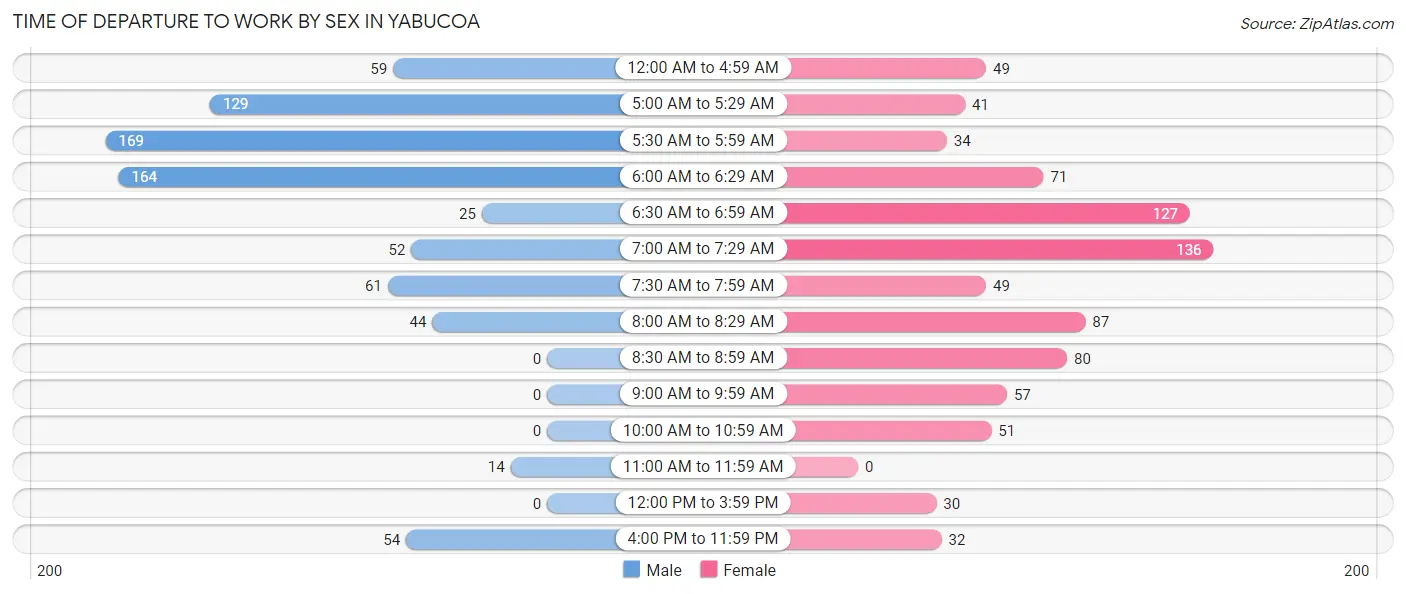
| Time of Departure | Male | Female |
| 12:00 AM to 4:59 AM | 59 (7.6%) | 49 (5.8%) |
| 5:00 AM to 5:29 AM | 129 (16.7%) | 41 (4.9%) |
| 5:30 AM to 5:59 AM | 169 (21.9%) | 34 (4.0%) |
| 6:00 AM to 6:29 AM | 164 (21.3%) | 71 (8.4%) |
| 6:30 AM to 6:59 AM | 25 (3.2%) | 127 (15.0%) |
| 7:00 AM to 7:29 AM | 52 (6.7%) | 136 (16.1%) |
| 7:30 AM to 7:59 AM | 61 (7.9%) | 49 (5.8%) |
| 8:00 AM to 8:29 AM | 44 (5.7%) | 87 (10.3%) |
| 8:30 AM to 8:59 AM | 0 (0.0%) | 80 (9.5%) |
| 9:00 AM to 9:59 AM | 0 (0.0%) | 57 (6.8%) |
| 10:00 AM to 10:59 AM | 0 (0.0%) | 51 (6.0%) |
| 11:00 AM to 11:59 AM | 14 (1.8%) | 0 (0.0%) |
| 12:00 PM to 3:59 PM | 0 (0.0%) | 30 (3.5%) |
| 4:00 PM to 11:59 PM | 54 (7.0%) | 32 (3.8%) |
| Total | 771 (100.0%) | 844 (100.0%) |
Housing Occupancy in Yabucoa
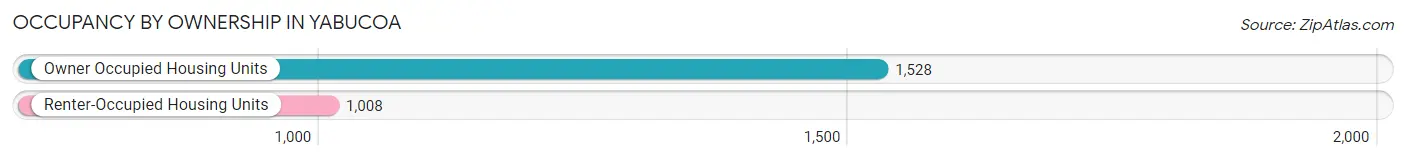
Occupancy by Ownership in Yabucoa
Of the total 2,536 dwellings in Yabucoa, owner-occupied units account for 1,528 (60.3%), while renter-occupied units make up 1,008 (39.8%).
| Occupancy | # Housing Units | % Housing Units |
| Owner Occupied Housing Units | 1,528 | 60.3% |
| Renter-Occupied Housing Units | 1,008 | 39.8% |
| Total Occupied Housing Units | 2,536 | 100.0% |
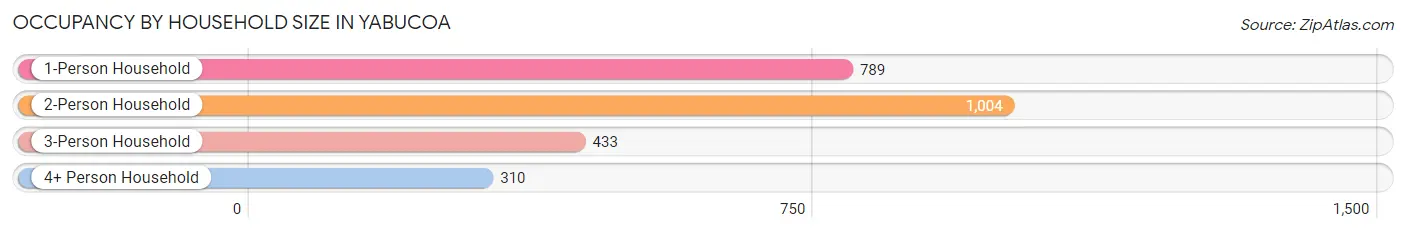
Occupancy by Household Size in Yabucoa
| Household Size | # Housing Units | % Housing Units |
| 1-Person Household | 789 | 31.1% |
| 2-Person Household | 1,004 | 39.6% |
| 3-Person Household | 433 | 17.1% |
| 4+ Person Household | 310 | 12.2% |
| Total Housing Units | 2,536 | 100.0% |
Occupancy by Ownership by Household Size in Yabucoa
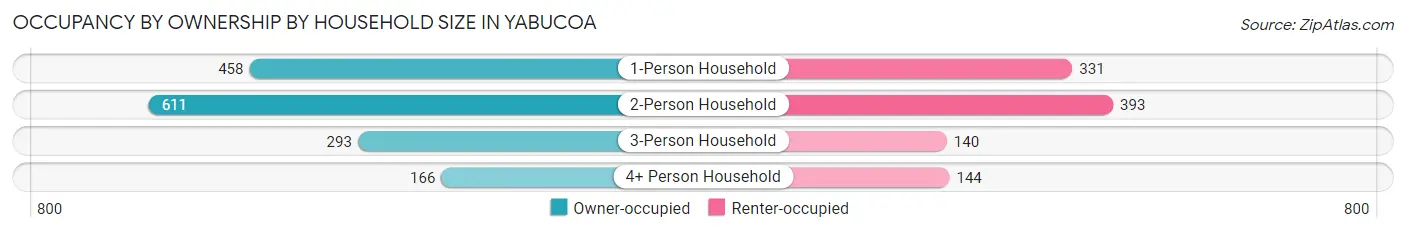
| Household Size | Owner-occupied | Renter-occupied |
| 1-Person Household | 458 (58.1%) | 331 (41.9%) |
| 2-Person Household | 611 (60.9%) | 393 (39.1%) |
| 3-Person Household | 293 (67.7%) | 140 (32.3%) |
| 4+ Person Household | 166 (53.5%) | 144 (46.5%) |
| Total Housing Units | 1,528 (60.3%) | 1,008 (39.8%) |
Occupancy by Educational Attainment in Yabucoa
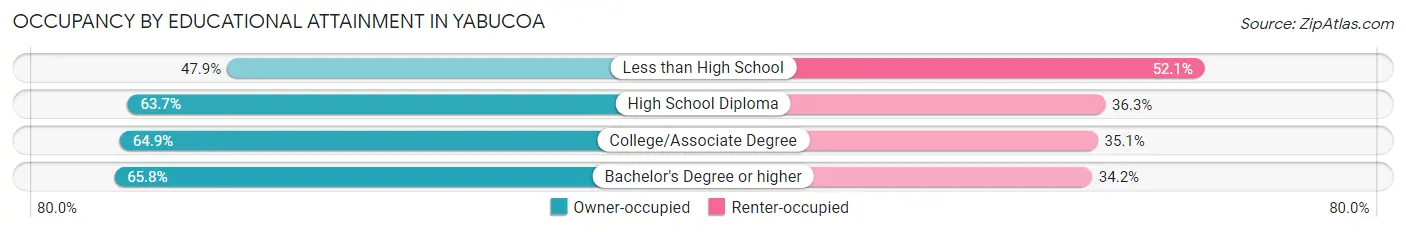
| Household Size | Owner-occupied | Renter-occupied |
| Less than High School | 317 (47.9%) | 345 (52.1%) |
| High School Diploma | 419 (63.7%) | 239 (36.3%) |
| College/Associate Degree | 569 (64.9%) | 308 (35.1%) |
| Bachelor's Degree or higher | 223 (65.8%) | 116 (34.2%) |
Occupancy by Age of Householder in Yabucoa
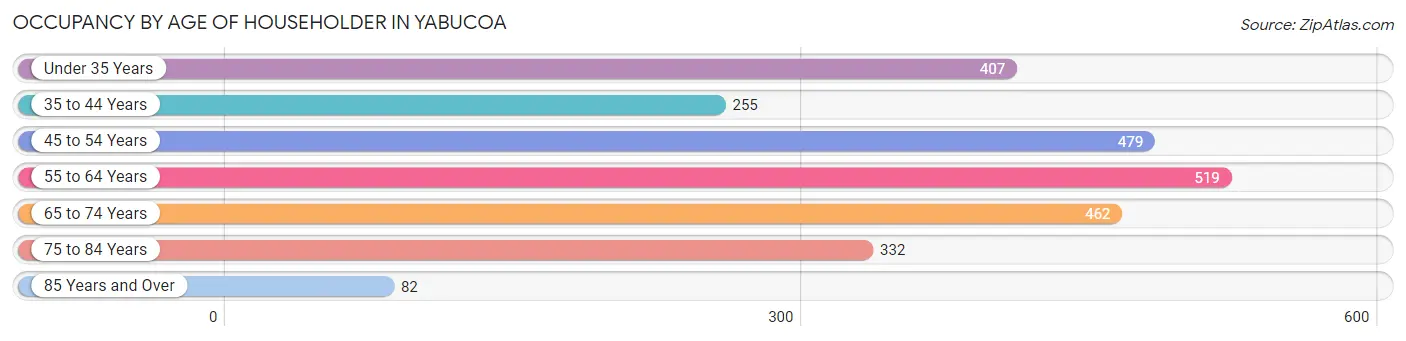
| Age Bracket | # Households | % Households |
| Under 35 Years | 407 | 16.1% |
| 35 to 44 Years | 255 | 10.1% |
| 45 to 54 Years | 479 | 18.9% |
| 55 to 64 Years | 519 | 20.5% |
| 65 to 74 Years | 462 | 18.2% |
| 75 to 84 Years | 332 | 13.1% |
| 85 Years and Over | 82 | 3.2% |
| Total | 2,536 | 100.0% |
Housing Finances in Yabucoa
Median Income by Occupancy in Yabucoa
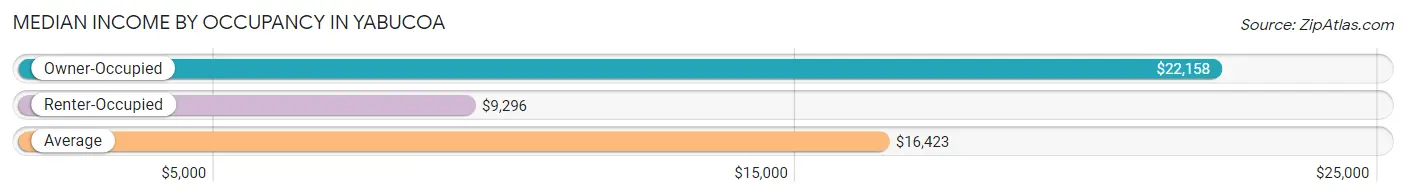
| Occupancy Type | # Households | Median Income |
| Owner-Occupied | 1,528 (60.3%) | $22,158 |
| Renter-Occupied | 1,008 (39.8%) | $9,296 |
| Average | 2,536 (100.0%) | $16,423 |
Occupancy by Householder Income Bracket in Yabucoa
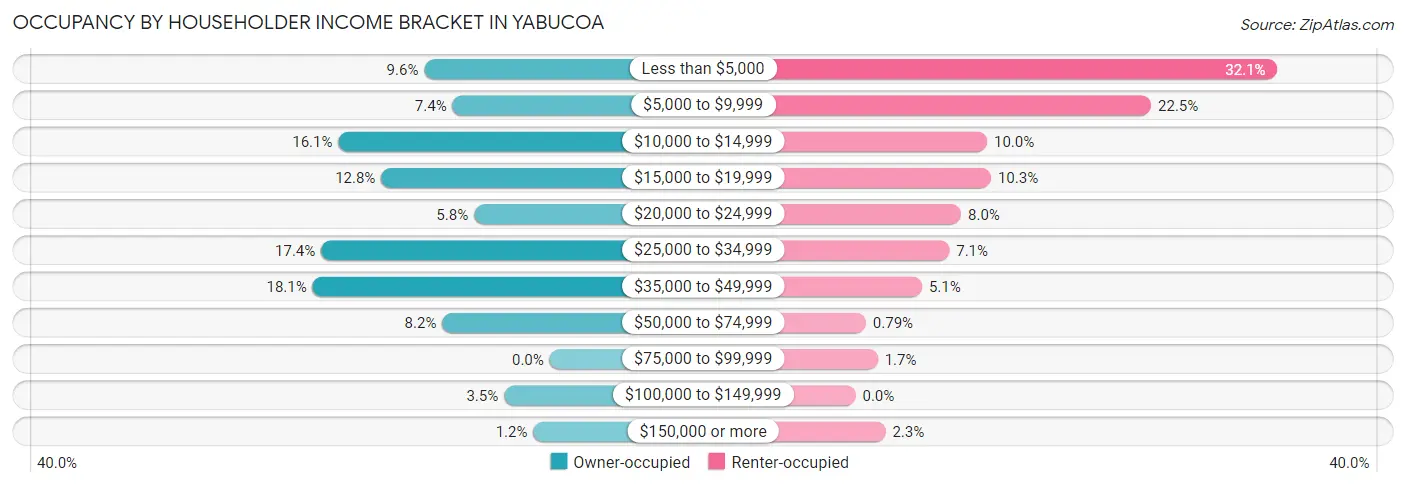
| Income Bracket | Owner-occupied | Renter-occupied |
| Less than $5,000 | 146 (9.6%) | 324 (32.1%) |
| $5,000 to $9,999 | 113 (7.4%) | 227 (22.5%) |
| $10,000 to $14,999 | 246 (16.1%) | 101 (10.0%) |
| $15,000 to $19,999 | 196 (12.8%) | 104 (10.3%) |
| $20,000 to $24,999 | 88 (5.8%) | 81 (8.0%) |
| $25,000 to $34,999 | 266 (17.4%) | 72 (7.1%) |
| $35,000 to $49,999 | 276 (18.1%) | 51 (5.1%) |
| $50,000 to $74,999 | 125 (8.2%) | 8 (0.8%) |
| $75,000 to $99,999 | 0 (0.0%) | 17 (1.7%) |
| $100,000 to $149,999 | 53 (3.5%) | 0 (0.0%) |
| $150,000 or more | 19 (1.2%) | 23 (2.3%) |
| Total | 1,528 (100.0%) | 1,008 (100.0%) |
Monthly Housing Cost Tiers in Yabucoa
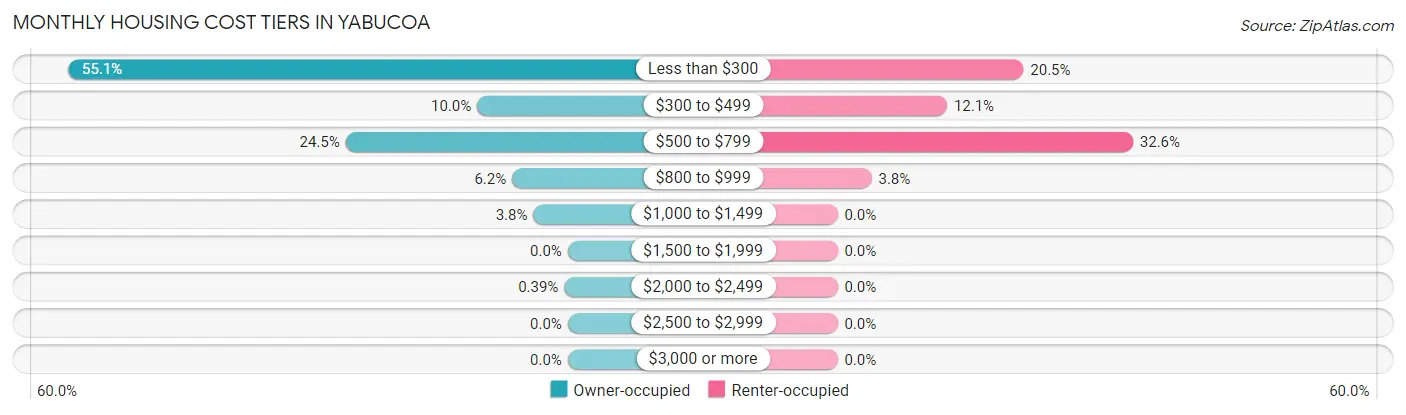
| Monthly Cost | Owner-occupied | Renter-occupied |
| Less than $300 | 842 (55.1%) | 207 (20.5%) |
| $300 to $499 | 153 (10.0%) | 122 (12.1%) |
| $500 to $799 | 375 (24.5%) | 329 (32.6%) |
| $800 to $999 | 94 (6.1%) | 38 (3.8%) |
| $1,000 to $1,499 | 58 (3.8%) | 0 (0.0%) |
| $1,500 to $1,999 | 0 (0.0%) | 0 (0.0%) |
| $2,000 to $2,499 | 6 (0.4%) | 0 (0.0%) |
| $2,500 to $2,999 | 0 (0.0%) | 0 (0.0%) |
| $3,000 or more | 0 (0.0%) | 0 (0.0%) |
| Total | 1,528 (100.0%) | 1,008 (100.0%) |
Physical Housing Characteristics in Yabucoa
Housing Structures in Yabucoa
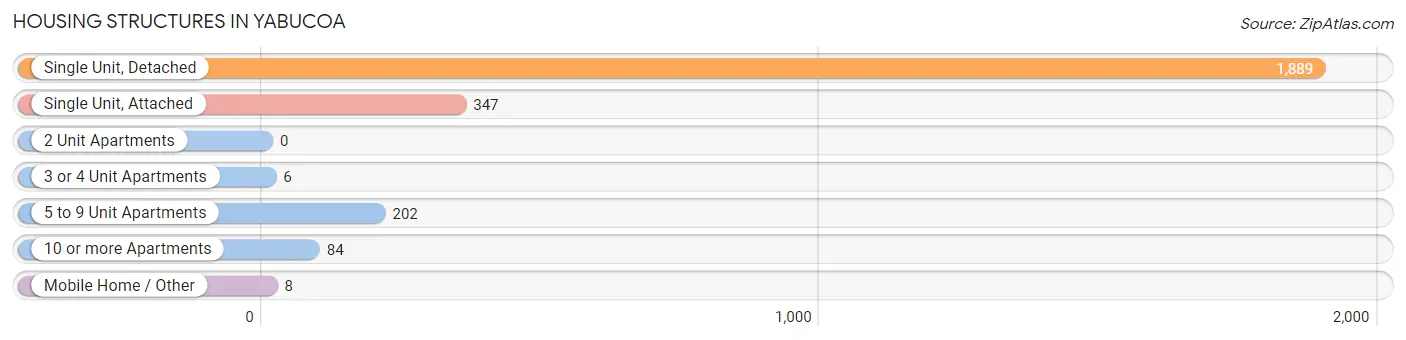
| Structure Type | # Housing Units | % Housing Units |
| Single Unit, Detached | 1,889 | 74.5% |
| Single Unit, Attached | 347 | 13.7% |
| 2 Unit Apartments | 0 | 0.0% |
| 3 or 4 Unit Apartments | 6 | 0.2% |
| 5 to 9 Unit Apartments | 202 | 8.0% |
| 10 or more Apartments | 84 | 3.3% |
| Mobile Home / Other | 8 | 0.3% |
| Total | 2,536 | 100.0% |
Housing Structures by Occupancy in Yabucoa
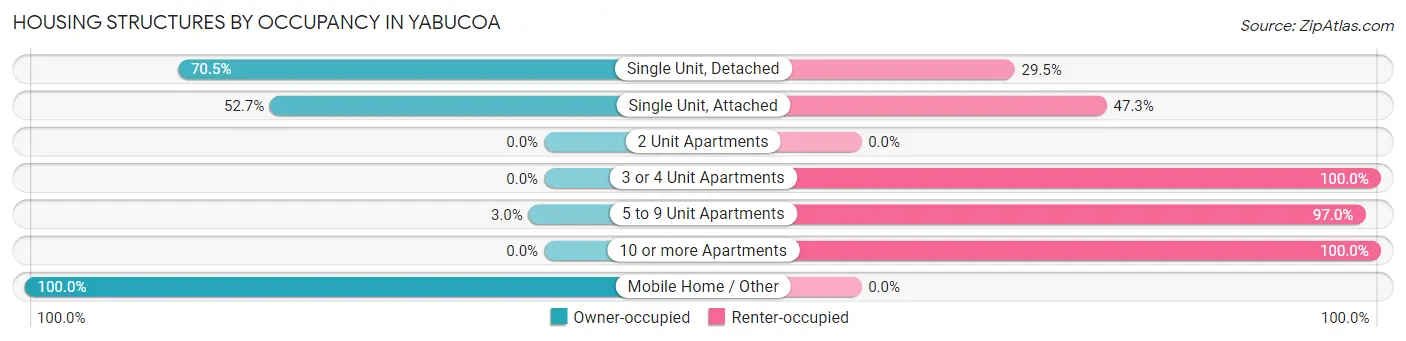
| Structure Type | Owner-occupied | Renter-occupied |
| Single Unit, Detached | 1,331 (70.5%) | 558 (29.5%) |
| Single Unit, Attached | 183 (52.7%) | 164 (47.3%) |
| 2 Unit Apartments | 0 (0.0%) | 0 (0.0%) |
| 3 or 4 Unit Apartments | 0 (0.0%) | 6 (100.0%) |
| 5 to 9 Unit Apartments | 6 (3.0%) | 196 (97.0%) |
| 10 or more Apartments | 0 (0.0%) | 84 (100.0%) |
| Mobile Home / Other | 8 (100.0%) | 0 (0.0%) |
| Total | 1,528 (60.3%) | 1,008 (39.8%) |
Housing Structures by Number of Rooms in Yabucoa
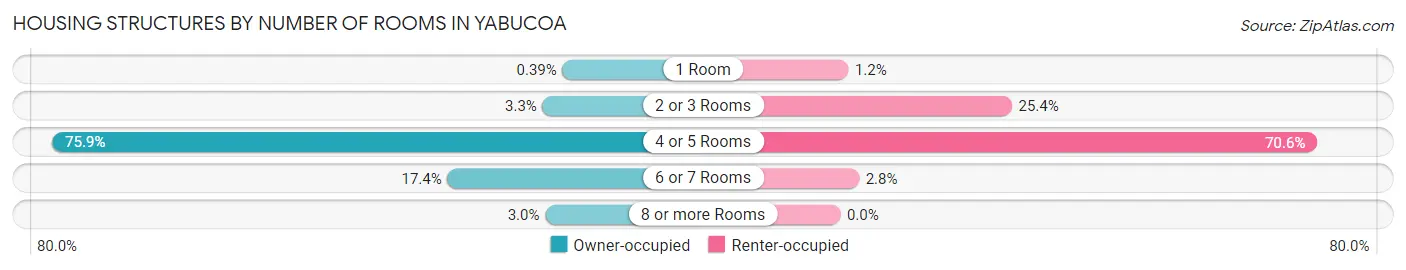
| Number of Rooms | Owner-occupied | Renter-occupied |
| 1 Room | 6 (0.4%) | 12 (1.2%) |
| 2 or 3 Rooms | 51 (3.3%) | 256 (25.4%) |
| 4 or 5 Rooms | 1,160 (75.9%) | 712 (70.6%) |
| 6 or 7 Rooms | 266 (17.4%) | 28 (2.8%) |
| 8 or more Rooms | 45 (2.9%) | 0 (0.0%) |
| Total | 1,528 (100.0%) | 1,008 (100.0%) |
Housing Structure by Heating Type in Yabucoa
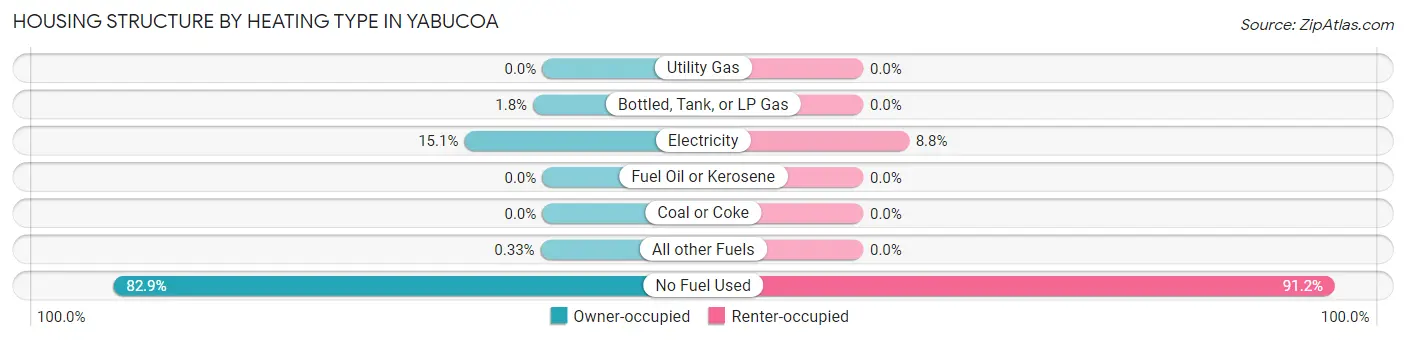
| Heating Type | Owner-occupied | Renter-occupied |
| Utility Gas | 0 (0.0%) | 0 (0.0%) |
| Bottled, Tank, or LP Gas | 27 (1.8%) | 0 (0.0%) |
| Electricity | 230 (15.0%) | 89 (8.8%) |
| Fuel Oil or Kerosene | 0 (0.0%) | 0 (0.0%) |
| Coal or Coke | 0 (0.0%) | 0 (0.0%) |
| All other Fuels | 5 (0.3%) | 0 (0.0%) |
| No Fuel Used | 1,266 (82.9%) | 919 (91.2%) |
| Total | 1,528 (100.0%) | 1,008 (100.0%) |
Household Vehicle Usage in Yabucoa
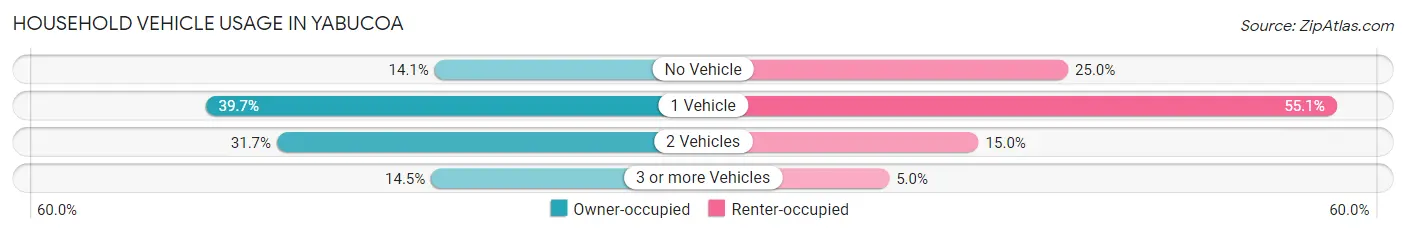
| Vehicles per Household | Owner-occupied | Renter-occupied |
| No Vehicle | 215 (14.1%) | 252 (25.0%) |
| 1 Vehicle | 607 (39.7%) | 555 (55.1%) |
| 2 Vehicles | 485 (31.7%) | 151 (15.0%) |
| 3 or more Vehicles | 221 (14.5%) | 50 (5.0%) |
| Total | 1,528 (100.0%) | 1,008 (100.0%) |
Real Estate & Mortgages in Yabucoa
Real Estate and Mortgage Overview in Yabucoa
| Characteristic | Without Mortgage | With Mortgage |
| Housing Units | 941 | 587 |
| Median Property Value | $89,300 | $103,100 |
| Median Household Income | $20,020 | $19 |
| Monthly Housing Costs | $180 | $0 |
| Real Estate Taxes | $750 | $556 |
Property Value by Mortgage Status in Yabucoa
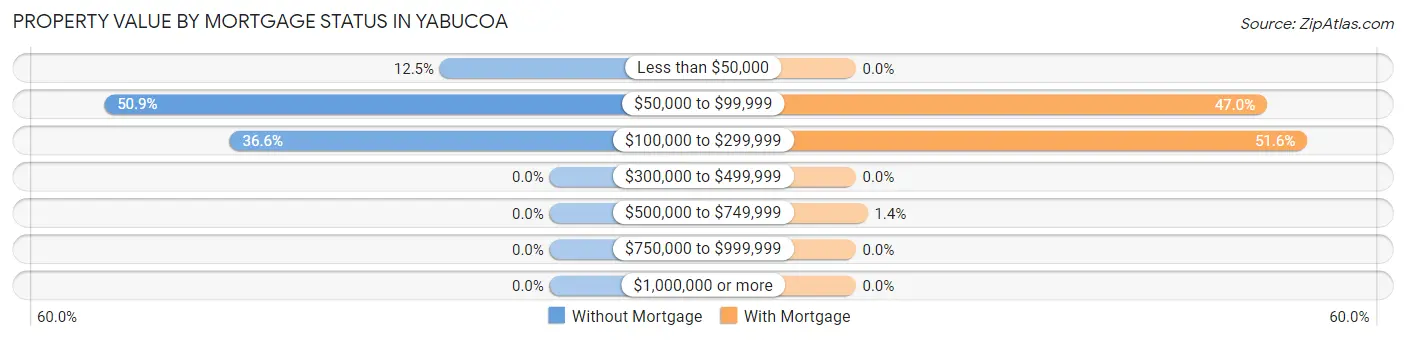
| Property Value | Without Mortgage | With Mortgage |
| Less than $50,000 | 118 (12.5%) | 0 (0.0%) |
| $50,000 to $99,999 | 479 (50.9%) | 276 (47.0%) |
| $100,000 to $299,999 | 344 (36.6%) | 303 (51.6%) |
| $300,000 to $499,999 | 0 (0.0%) | 0 (0.0%) |
| $500,000 to $749,999 | 0 (0.0%) | 8 (1.4%) |
| $750,000 to $999,999 | 0 (0.0%) | 0 (0.0%) |
| $1,000,000 or more | 0 (0.0%) | 0 (0.0%) |
| Total | 941 (100.0%) | 587 (100.0%) |
Household Income by Mortgage Status in Yabucoa
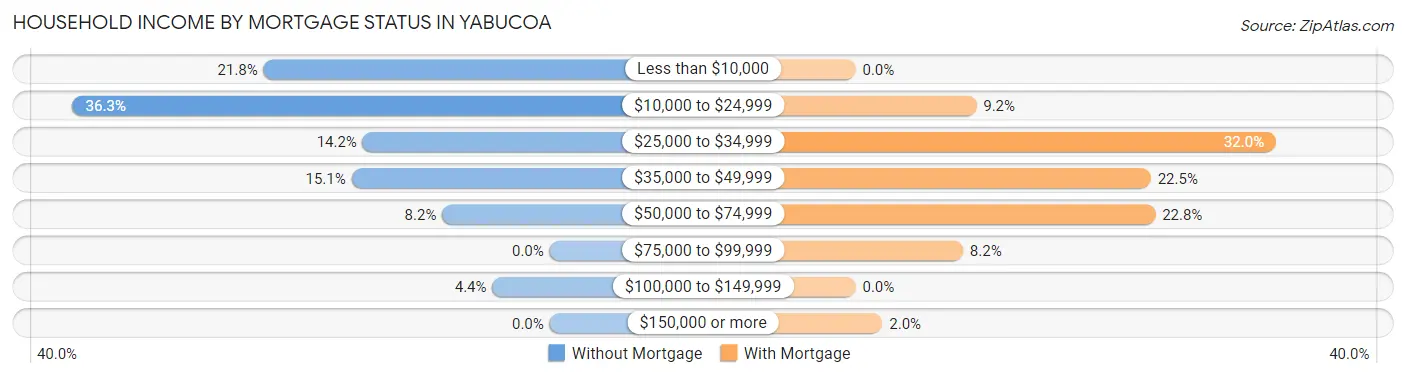
| Household Income | Without Mortgage | With Mortgage |
| Less than $10,000 | 205 (21.8%) | 0 (0.0%) |
| $10,000 to $24,999 | 342 (36.3%) | 54 (9.2%) |
| $25,000 to $34,999 | 134 (14.2%) | 188 (32.0%) |
| $35,000 to $49,999 | 142 (15.1%) | 132 (22.5%) |
| $50,000 to $74,999 | 77 (8.2%) | 134 (22.8%) |
| $75,000 to $99,999 | 0 (0.0%) | 48 (8.2%) |
| $100,000 to $149,999 | 41 (4.4%) | 0 (0.0%) |
| $150,000 or more | 0 (0.0%) | 12 (2.0%) |
| Total | 941 (100.0%) | 587 (100.0%) |
Property Value to Household Income Ratio in Yabucoa
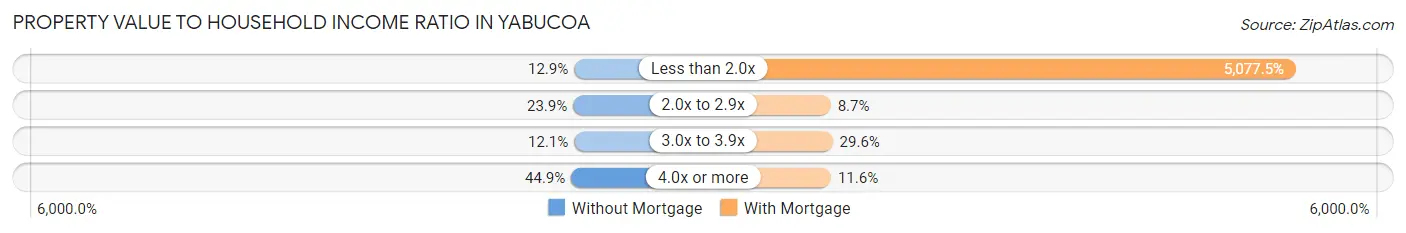
| Value-to-Income Ratio | Without Mortgage | With Mortgage |
| Less than 2.0x | 121 (12.9%) | 29,805 (5,077.5%) |
| 2.0x to 2.9x | 225 (23.9%) | 51 (8.7%) |
| 3.0x to 3.9x | 114 (12.1%) | 174 (29.6%) |
| 4.0x or more | 422 (44.9%) | 68 (11.6%) |
| Total | 941 (100.0%) | 587 (100.0%) |
Real Estate Taxes by Mortgage Status in Yabucoa
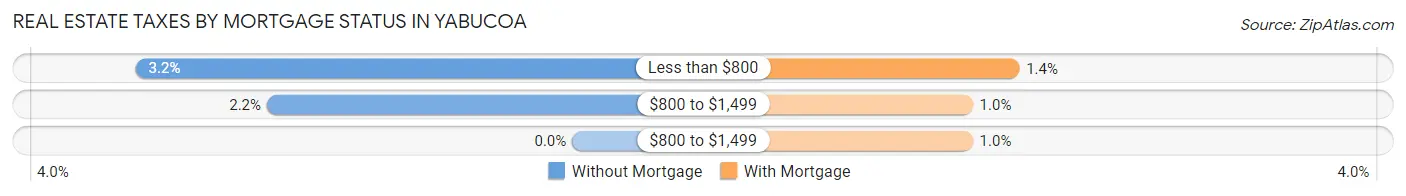
| Property Taxes | Without Mortgage | With Mortgage |
| Less than $800 | 30 (3.2%) | 8 (1.4%) |
| $800 to $1,499 | 21 (2.2%) | 6 (1.0%) |
| $800 to $1,499 | 0 (0.0%) | 6 (1.0%) |
| Total | 941 (100.0%) | 587 (100.0%) |
Health & Disability in Yabucoa
Health Insurance Coverage by Age in Yabucoa
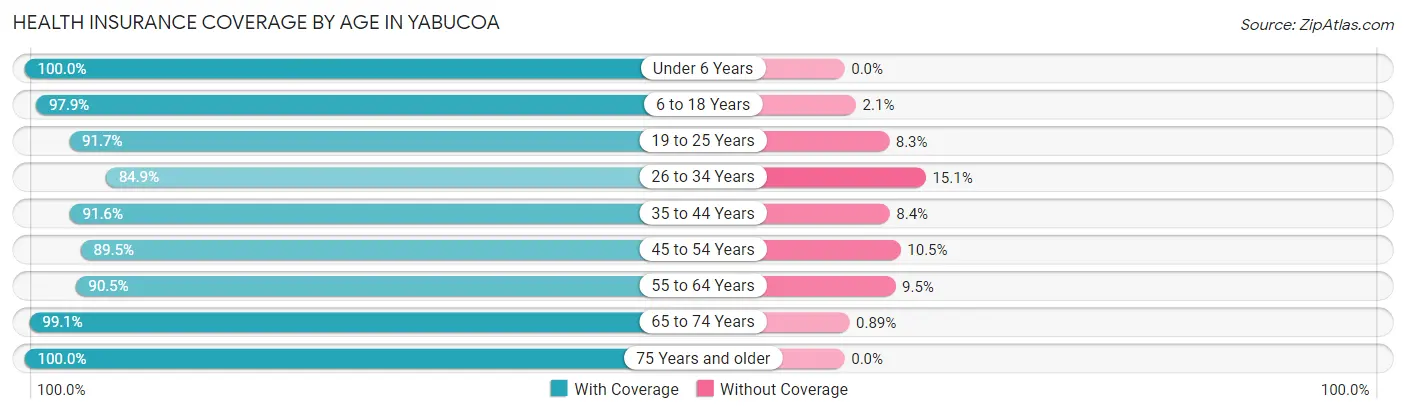
| Age Bracket | With Coverage | Without Coverage |
| Under 6 Years | 281 (100.0%) | 0 (0.0%) |
| 6 to 18 Years | 968 (97.9%) | 21 (2.1%) |
| 19 to 25 Years | 431 (91.7%) | 39 (8.3%) |
| 26 to 34 Years | 650 (84.9%) | 116 (15.1%) |
| 35 to 44 Years | 611 (91.6%) | 56 (8.4%) |
| 45 to 54 Years | 728 (89.5%) | 85 (10.5%) |
| 55 to 64 Years | 717 (90.5%) | 75 (9.5%) |
| 65 to 74 Years | 670 (99.1%) | 6 (0.9%) |
| 75 Years and older | 624 (100.0%) | 0 (0.0%) |
| Total | 5,680 (93.4%) | 398 (6.6%) |
Health Insurance Coverage by Citizenship Status in Yabucoa
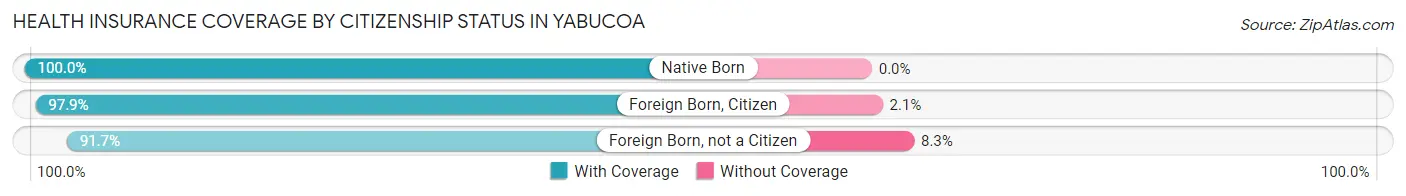
| Citizenship Status | With Coverage | Without Coverage |
| Native Born | 281 (100.0%) | 0 (0.0%) |
| Foreign Born, Citizen | 968 (97.9%) | 21 (2.1%) |
| Foreign Born, not a Citizen | 431 (91.7%) | 39 (8.3%) |
Health Insurance Coverage by Household Income in Yabucoa
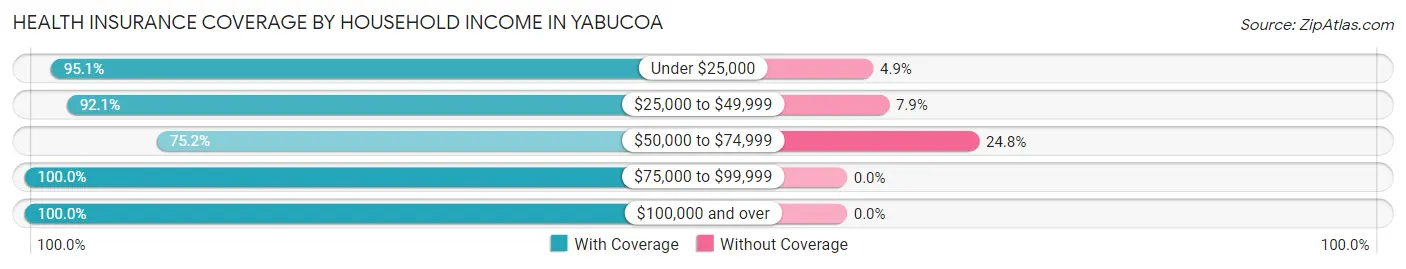
| Household Income | With Coverage | Without Coverage |
| Under $25,000 | 3,239 (95.1%) | 168 (4.9%) |
| $25,000 to $49,999 | 1,726 (92.1%) | 148 (7.9%) |
| $50,000 to $74,999 | 246 (75.2%) | 81 (24.8%) |
| $75,000 to $99,999 | 33 (100.0%) | 0 (0.0%) |
| $100,000 and over | 433 (100.0%) | 0 (0.0%) |
Public vs Private Health Insurance Coverage by Age in Yabucoa
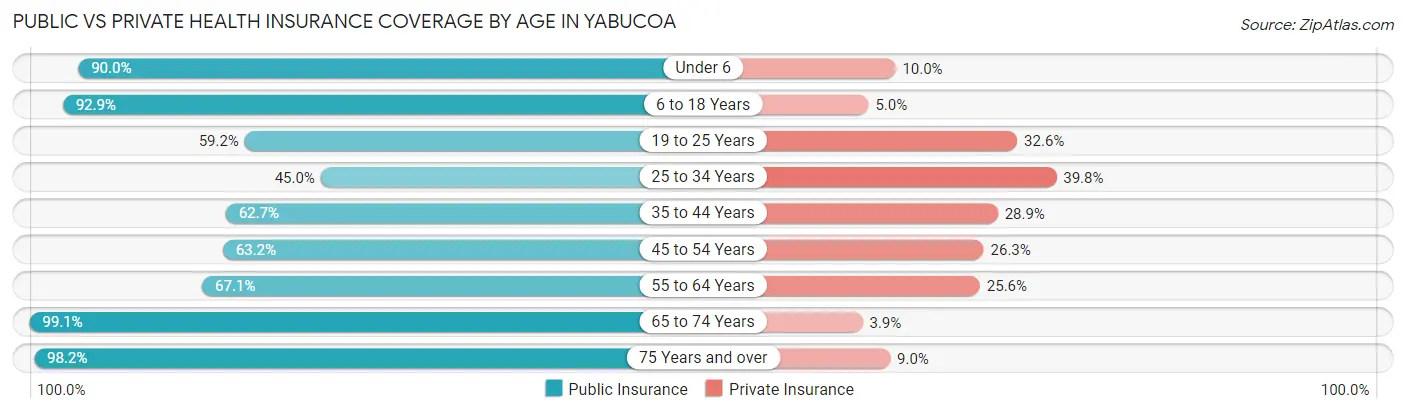
| Age Bracket | Public Insurance | Private Insurance |
| Under 6 | 253 (90.0%) | 28 (10.0%) |
| 6 to 18 Years | 919 (92.9%) | 49 (5.0%) |
| 19 to 25 Years | 278 (59.2%) | 153 (32.6%) |
| 25 to 34 Years | 345 (45.0%) | 305 (39.8%) |
| 35 to 44 Years | 418 (62.7%) | 193 (28.9%) |
| 45 to 54 Years | 514 (63.2%) | 214 (26.3%) |
| 55 to 64 Years | 531 (67.0%) | 203 (25.6%) |
| 65 to 74 Years | 670 (99.1%) | 26 (3.8%) |
| 75 Years and over | 613 (98.2%) | 56 (9.0%) |
| Total | 4,541 (74.7%) | 1,227 (20.2%) |
Disability Status by Sex by Age in Yabucoa
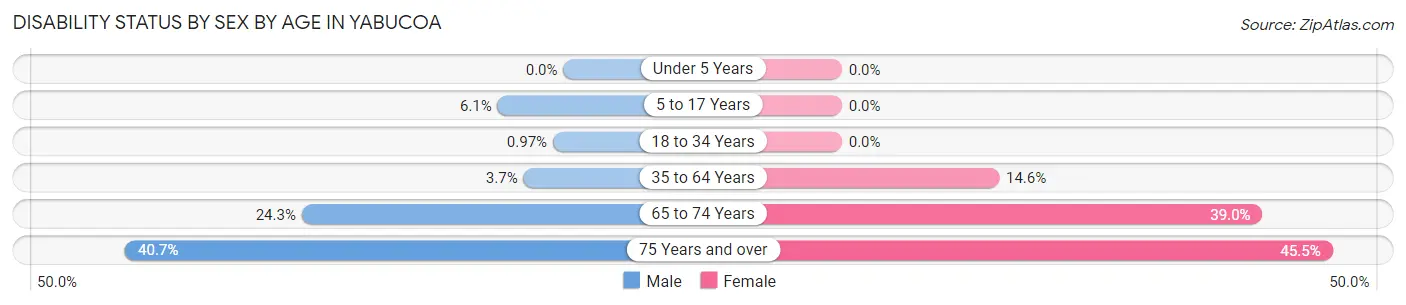
| Age Bracket | Male | Female |
| Under 5 Years | 0 (0.0%) | 0 (0.0%) |
| 5 to 17 Years | 31 (6.1%) | 0 (0.0%) |
| 18 to 34 Years | 6 (1.0%) | 0 (0.0%) |
| 35 to 64 Years | 42 (3.7%) | 166 (14.6%) |
| 65 to 74 Years | 59 (24.3%) | 169 (39.0%) |
| 75 Years and over | 85 (40.7%) | 189 (45.5%) |
Disability Class by Sex by Age in Yabucoa
Disability Class: Hearing Difficulty
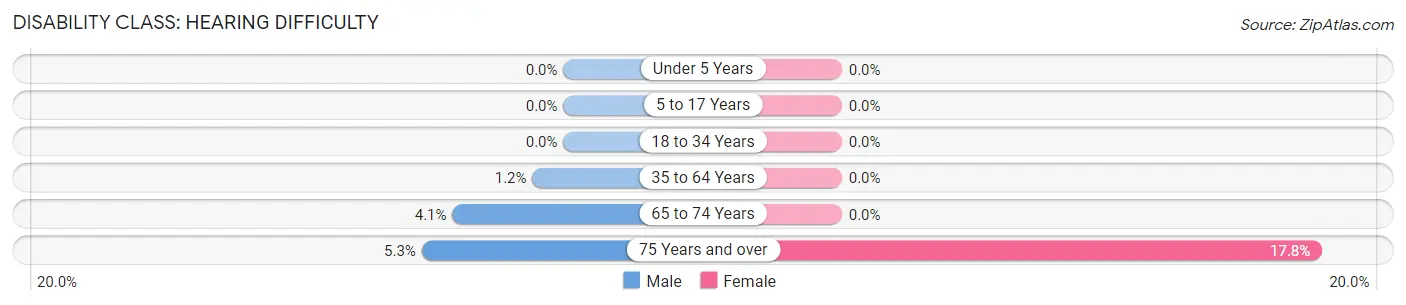
| Age Bracket | Male | Female |
| Under 5 Years | 0 (0.0%) | 0 (0.0%) |
| 5 to 17 Years | 0 (0.0%) | 0 (0.0%) |
| 18 to 34 Years | 0 (0.0%) | 0 (0.0%) |
| 35 to 64 Years | 13 (1.1%) | 0 (0.0%) |
| 65 to 74 Years | 10 (4.1%) | 0 (0.0%) |
| 75 Years and over | 11 (5.3%) | 74 (17.8%) |
Disability Class: Vision Difficulty
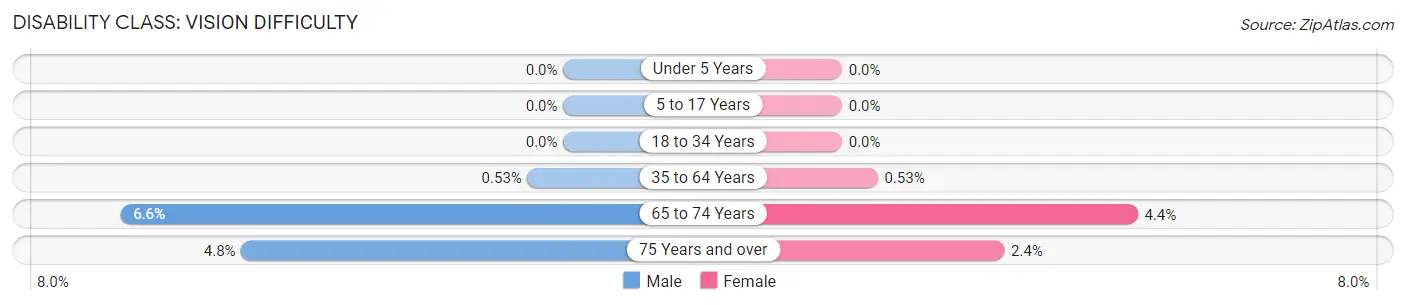
| Age Bracket | Male | Female |
| Under 5 Years | 0 (0.0%) | 0 (0.0%) |
| 5 to 17 Years | 0 (0.0%) | 0 (0.0%) |
| 18 to 34 Years | 0 (0.0%) | 0 (0.0%) |
| 35 to 64 Years | 6 (0.5%) | 6 (0.5%) |
| 65 to 74 Years | 16 (6.6%) | 19 (4.4%) |
| 75 Years and over | 10 (4.8%) | 10 (2.4%) |
Disability Class: Cognitive Difficulty
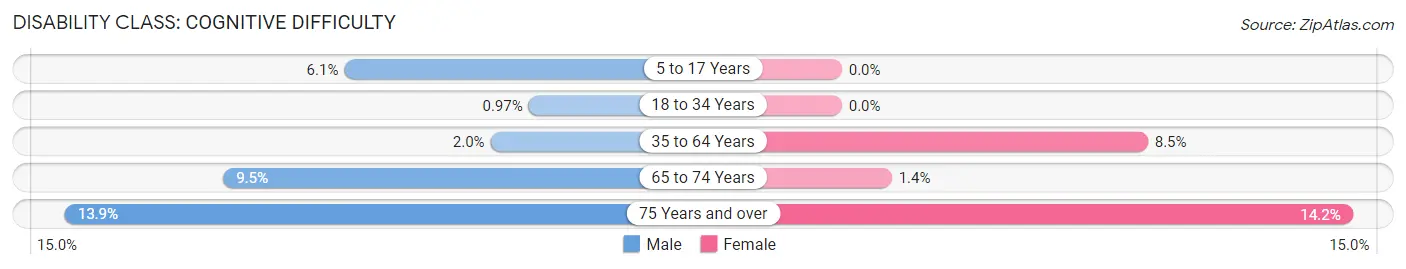
| Age Bracket | Male | Female |
| 5 to 17 Years | 31 (6.1%) | 0 (0.0%) |
| 18 to 34 Years | 6 (1.0%) | 0 (0.0%) |
| 35 to 64 Years | 23 (2.0%) | 97 (8.5%) |
| 65 to 74 Years | 23 (9.5%) | 6 (1.4%) |
| 75 Years and over | 29 (13.9%) | 59 (14.2%) |
Disability Class: Ambulatory Difficulty
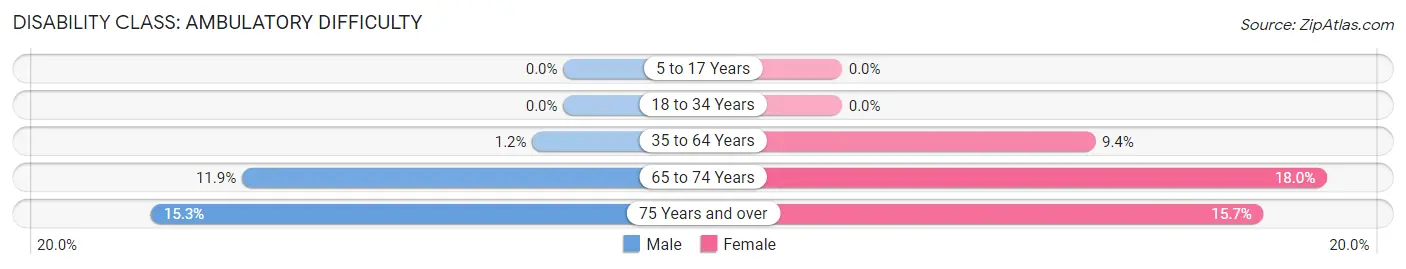
| Age Bracket | Male | Female |
| 5 to 17 Years | 0 (0.0%) | 0 (0.0%) |
| 18 to 34 Years | 0 (0.0%) | 0 (0.0%) |
| 35 to 64 Years | 13 (1.1%) | 107 (9.4%) |
| 65 to 74 Years | 29 (11.9%) | 78 (18.0%) |
| 75 Years and over | 32 (15.3%) | 65 (15.7%) |
Disability Class: Self-Care Difficulty
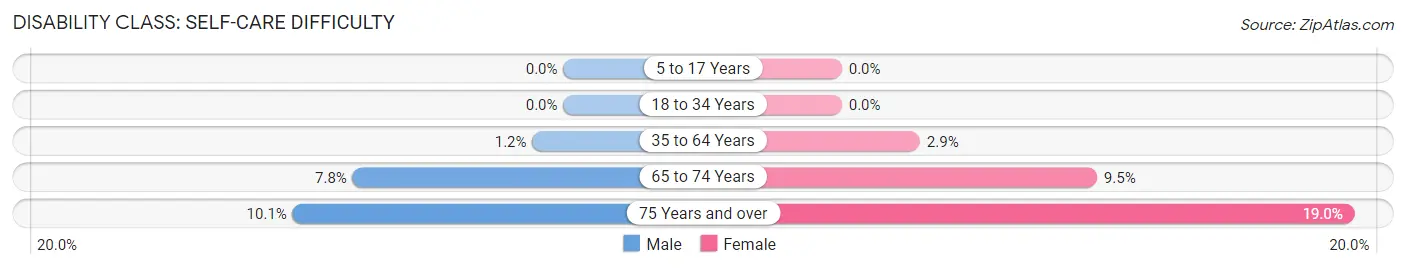
| Age Bracket | Male | Female |
| 5 to 17 Years | 0 (0.0%) | 0 (0.0%) |
| 18 to 34 Years | 0 (0.0%) | 0 (0.0%) |
| 35 to 64 Years | 13 (1.1%) | 33 (2.9%) |
| 65 to 74 Years | 19 (7.8%) | 41 (9.5%) |
| 75 Years and over | 21 (10.1%) | 79 (19.0%) |
Technology Access in Yabucoa
Computing Device Access in Yabucoa
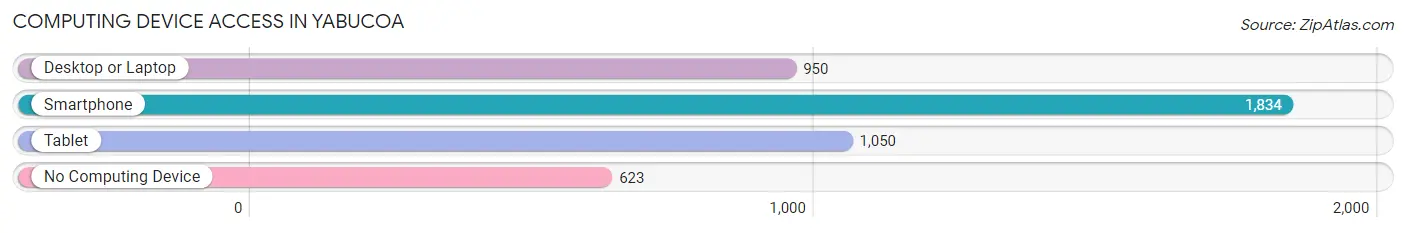
| Device Type | # Households | % Households |
| Desktop or Laptop | 950 | 37.5% |
| Smartphone | 1,834 | 72.3% |
| Tablet | 1,050 | 41.4% |
| No Computing Device | 623 | 24.6% |
| Total | 2,536 | 100.0% |
Internet Access in Yabucoa
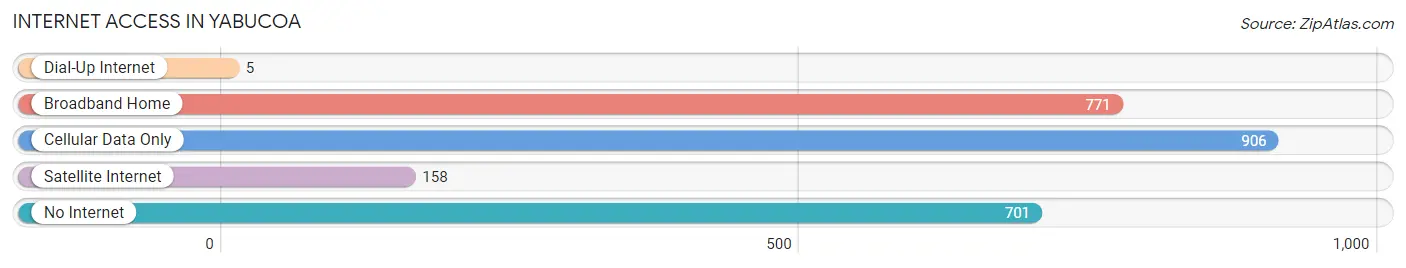
| Internet Type | # Households | % Households |
| Dial-Up Internet | 5 | 0.2% |
| Broadband Home | 771 | 30.4% |
| Cellular Data Only | 906 | 35.7% |
| Satellite Internet | 158 | 6.2% |
| No Internet | 701 | 27.6% |
| Total | 2,536 | 100.0% |
Yabucoa Summary
Yabucoa is a municipality located in the southeastern region of Puerto Rico. It is bordered by the municipalities of Maunabo, Patillas, San Lorenzo, and Las Piedras. Yabucoa is known as the “City of the Sun” due to its location in the Caribbean sunbelt. The municipality has a population of approximately 40,000 people and covers an area of approximately 100 square miles.
History
Yabucoa was founded in 1793 by Don Juan de Aponte. The name Yabucoa is derived from the Taíno word “yabucoa” which means “place of many hills”. The area was originally inhabited by the Taíno people and was later colonized by the Spanish. During the 19th century, Yabucoa was an important port for the export of sugar cane and other agricultural products.
In 1898, Yabucoa was annexed to the United States as part of the Treaty of Paris. During the 20th century, Yabucoa experienced rapid economic growth due to the development of the sugar industry. The municipality also became an important center for the production of rum and other alcoholic beverages.
Geography
Yabucoa is located in the southeastern region of Puerto Rico. It is bordered by the municipalities of Maunabo, Patillas, San Lorenzo, and Las Piedras. The municipality is located in the Caribbean sunbelt and is known for its warm climate and sunny weather. The terrain of Yabucoa is mostly flat with some hills and mountains in the northern part of the municipality. The highest point in Yabucoa is Cerro La Santa, which is located in the northern part of the municipality and has an elevation of 1,000 feet.
Economy
Yabucoa’s economy is largely based on agriculture and tourism. The municipality is known for its production of sugar cane, coffee, and other agricultural products. Yabucoa is also home to several rum distilleries and is an important center for the production of rum and other alcoholic beverages.
Tourism is an important part of the economy in Yabucoa. The municipality is home to several beaches, including Playa de Yabucoa, Playa de Patillas, and Playa de Maunabo. The municipality also has several historical sites, including the ruins of the old sugar mill and the old fort of San Juan de Yabucoa.
Demographics
As of the 2010 census, Yabucoa had a population of 40,000 people. The population is mostly of Puerto Rican descent, with a small minority of African and Taíno descent. The majority of the population is Roman Catholic, with a small minority of other religious denominations. The median household income in Yabucoa is $20,000, which is lower than the national average. The unemployment rate in Yabucoa is also higher than the national average.
Common Questions
What is Per Capita Income in Yabucoa?
Per Capita income in Yabucoa is $11,342.
What is the Median Family Income in Yabucoa?
Median Family Income in Yabucoa is $20,657.
What is the Median Household income in Yabucoa?
Median Household Income in Yabucoa is $16,423.
What is Income or Wage Gap in Yabucoa?
Income or Wage Gap in Yabucoa is 5.6%.
Women in Yabucoa earn 94.4 cents for every dollar earned by a man.
What is Family Income Deficit in Yabucoa?
Family Income Deficit in Yabucoa is $11,883.
Families that are below poverty line in Yabucoa earn $11,883 less on average than the poverty threshold level.
What is Inequality or Gini Index in Yabucoa?
Inequality or Gini Index in Yabucoa is 0.54.
What is the Total Population of Yabucoa?
Total Population of Yabucoa is 6,082.
What is the Total Male Population of Yabucoa?
Total Male Population of Yabucoa is 2,844.
What is the Total Female Population of Yabucoa?
Total Female Population of Yabucoa is 3,238.
What is the Ratio of Males per 100 Females in Yabucoa?
There are 87.83 Males per 100 Females in Yabucoa.
What is the Ratio of Females per 100 Males in Yabucoa?
There are 113.85 Females per 100 Males in Yabucoa.
What is the Median Population Age in Yabucoa?
Median Population Age in Yabucoa is 43.6 Years.
What is the Average Family Size in Yabucoa
Average Family Size in Yabucoa is 3.1 People.
What is the Average Household Size in Yabucoa
Average Household Size in Yabucoa is 2.4 People.
How Large is the Labor Force in Yabucoa?
There are 1,923 People in the Labor Forcein in Yabucoa.
What is the Percentage of People in the Labor Force in Yabucoa?
38.3% of People are in the Labor Force in Yabucoa.
What is the Unemployment Rate in Yabucoa?
Unemployment Rate in Yabucoa is 13.1%.