Penuelas, PR Map & Demographics
Penuelas Overview
$13,321
PER CAPITA INCOME
$30,683
AVG FAMILY INCOME
$26,094
AVG HOUSEHOLD INCOME
17.8%
WAGE / INCOME GAP [ % ]
82.2¢/ $1
WAGE / INCOME GAP [ $ ]
$10,032
FAMILY INCOME DEFICIT
0.49
INEQUALITY / GINI INDEX
5,297
TOTAL POPULATION
2,314
MALE POPULATION
2,983
FEMALE POPULATION
77.57
MALES / 100 FEMALES
128.91
FEMALES / 100 MALES
38.9
MEDIAN AGE
3.7
AVG FAMILY SIZE
3.0
AVG HOUSEHOLD SIZE
1,865
LABOR FORCE [ PEOPLE ]
42.6%
PERCENT IN LABOR FORCE
14.3%
UNEMPLOYMENT RATE
Penuelas Zip Codes
Penuelas Area Codes
Income in Penuelas
Income Overview in Penuelas
Per Capita Income in Penuelas is $13,321, while median incomes of families and households are $30,683 and $26,094 respectively.
| Characteristic | Number | Measure |
| Per Capita Income | 5,297 | $13,321 |
| Median Family Income | 1,239 | $30,683 |
| Mean Family Income | 1,239 | $40,914 |
| Median Household Income | 1,788 | $26,094 |
| Mean Household Income | 1,788 | $35,413 |
| Income Deficit | 1,239 | $10,032 |
| Wage / Income Gap (%) | 5,297 | 17.82% |
| Wage / Income Gap ($) | 5,297 | 82.18¢ per $1 |
| Gini / Inequality Index | 5,297 | 0.49 |
Earnings by Sex in Penuelas
Average Earnings in Penuelas are $20,093, $17,211 for men and $20,943 for women, a difference of 17.8%.
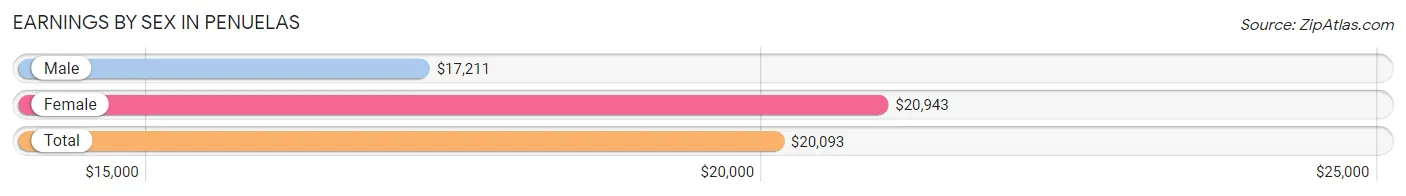
| Sex | Number | Average Earnings |
| Male | 945 (51.1%) | $17,211 |
| Female | 903 (48.9%) | $20,943 |
| Total | 1,848 (100.0%) | $20,093 |
Earnings by Sex by Income Bracket in Penuelas
The most common earnings brackets in Penuelas are $15,000 to $17,499 for men (134 | 14.2%) and $25,000 to $29,999 for women (173 | 19.2%).
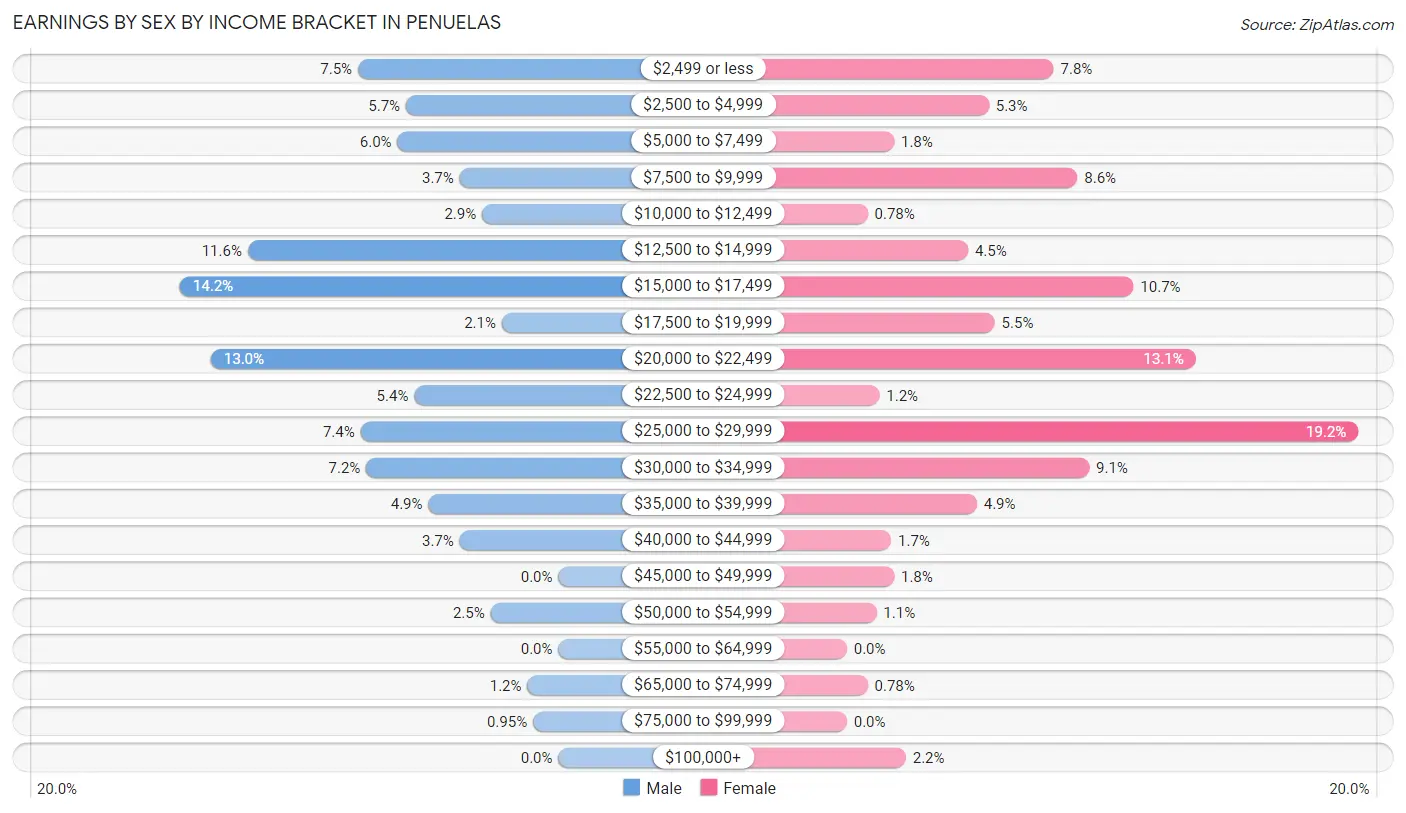
| Income | Male | Female |
| $2,499 or less | 71 (7.5%) | 70 (7.7%) |
| $2,500 to $4,999 | 54 (5.7%) | 48 (5.3%) |
| $5,000 to $7,499 | 57 (6.0%) | 16 (1.8%) |
| $7,500 to $9,999 | 35 (3.7%) | 78 (8.6%) |
| $10,000 to $12,499 | 27 (2.9%) | 7 (0.8%) |
| $12,500 to $14,999 | 110 (11.6%) | 41 (4.5%) |
| $15,000 to $17,499 | 134 (14.2%) | 97 (10.7%) |
| $17,500 to $19,999 | 20 (2.1%) | 50 (5.5%) |
| $20,000 to $22,499 | 123 (13.0%) | 118 (13.1%) |
| $22,500 to $24,999 | 51 (5.4%) | 11 (1.2%) |
| $25,000 to $29,999 | 70 (7.4%) | 173 (19.2%) |
| $30,000 to $34,999 | 68 (7.2%) | 82 (9.1%) |
| $35,000 to $39,999 | 46 (4.9%) | 44 (4.9%) |
| $40,000 to $44,999 | 35 (3.7%) | 15 (1.7%) |
| $45,000 to $49,999 | 0 (0.0%) | 16 (1.8%) |
| $50,000 to $54,999 | 24 (2.5%) | 10 (1.1%) |
| $55,000 to $64,999 | 0 (0.0%) | 0 (0.0%) |
| $65,000 to $74,999 | 11 (1.2%) | 7 (0.8%) |
| $75,000 to $99,999 | 9 (0.9%) | 0 (0.0%) |
| $100,000+ | 0 (0.0%) | 20 (2.2%) |
| Total | 945 (100.0%) | 903 (100.0%) |
Earnings by Sex by Educational Attainment in Penuelas
Average earnings in Penuelas are $20,467 for men and $21,430 for women, a difference of 4.5%. Men with an educational attainment of graduate degree enjoy the highest average annual earnings of $26,538, while those with high school diploma education earn the least with $20,440. Women with an educational attainment of bachelor's degree earn the most with the average annual earnings of $27,668, while those with high school diploma education have the smallest earnings of $14,879.
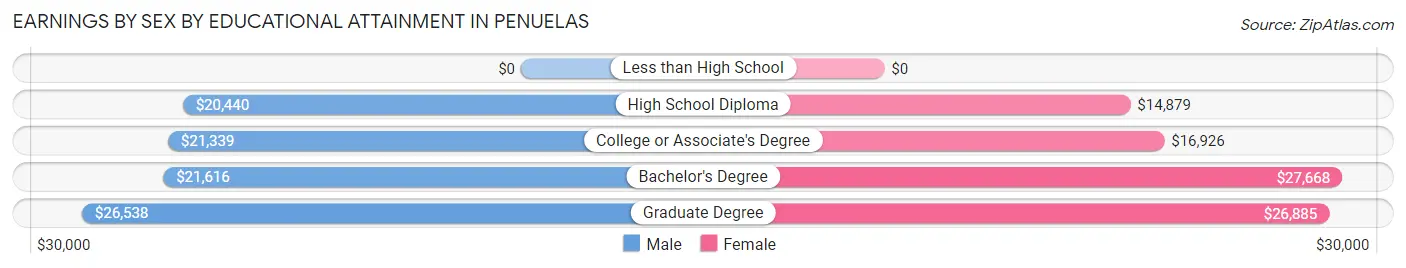
| Educational Attainment | Male Income | Female Income |
| Less than High School | - | - |
| High School Diploma | $20,440 | $14,879 |
| College or Associate's Degree | $21,339 | $16,926 |
| Bachelor's Degree | $21,616 | $27,668 |
| Graduate Degree | $26,538 | $26,885 |
| Total | $20,467 | $21,430 |
Family Income in Penuelas
Family Income Brackets in Penuelas
According to the Penuelas family income data, there are 280 families falling into the $15,000 to $24,999 income range, which is the most common income bracket and makes up 22.6% of all families.
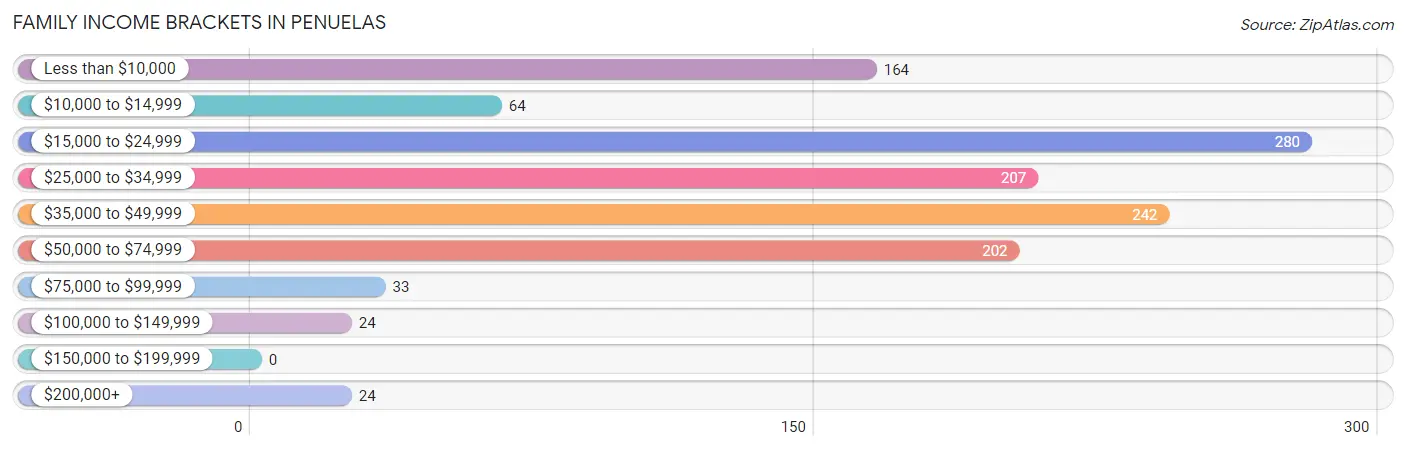
| Income Bracket | # Families | % Families |
| Less than $10,000 | 164 | 13.2% |
| $10,000 to $14,999 | 64 | 5.2% |
| $15,000 to $24,999 | 280 | 22.6% |
| $25,000 to $34,999 | 207 | 16.7% |
| $35,000 to $49,999 | 242 | 19.5% |
| $50,000 to $74,999 | 202 | 16.3% |
| $75,000 to $99,999 | 33 | 2.7% |
| $100,000 to $149,999 | 24 | 1.9% |
| $150,000 to $199,999 | 0 | 0.0% |
| $200,000+ | 24 | 1.9% |
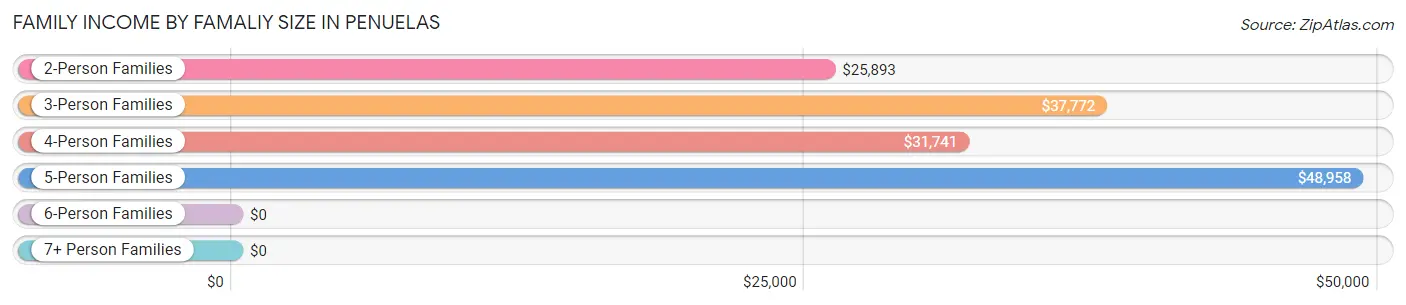
Family Income by Famaliy Size in Penuelas
5-person families (97 | 7.8%) account for the highest median family income in Penuelas with $48,958 per family, while 2-person families (604 | 48.7%) have the highest median income of $12,946 per family member.
| Income Bracket | # Families | Median Income |
| 2-Person Families | 604 (48.7%) | $25,893 |
| 3-Person Families | 297 (24.0%) | $37,772 |
| 4-Person Families | 231 (18.6%) | $31,741 |
| 5-Person Families | 97 (7.8%) | $48,958 |
| 6-Person Families | 10 (0.8%) | $0 |
| 7+ Person Families | 0 (0.0%) | $0 |
| Total | 1,239 (100.0%) | $30,683 |
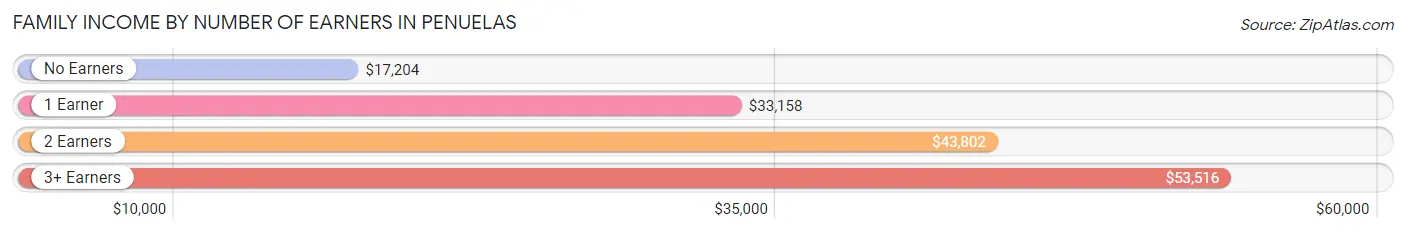
Family Income by Number of Earners in Penuelas
The median family income in Penuelas is $30,683, with families comprising 3+ earners (45) having the highest median family income of $53,516, while families with no earners (421) have the lowest median family income of $17,204, accounting for 3.6% and 34.0% of families, respectively.
| Number of Earners | # Families | Median Income |
| No Earners | 421 (34.0%) | $17,204 |
| 1 Earner | 484 (39.1%) | $33,158 |
| 2 Earners | 289 (23.3%) | $43,802 |
| 3+ Earners | 45 (3.6%) | $53,516 |
| Total | 1,239 (100.0%) | $30,683 |
Household Income in Penuelas
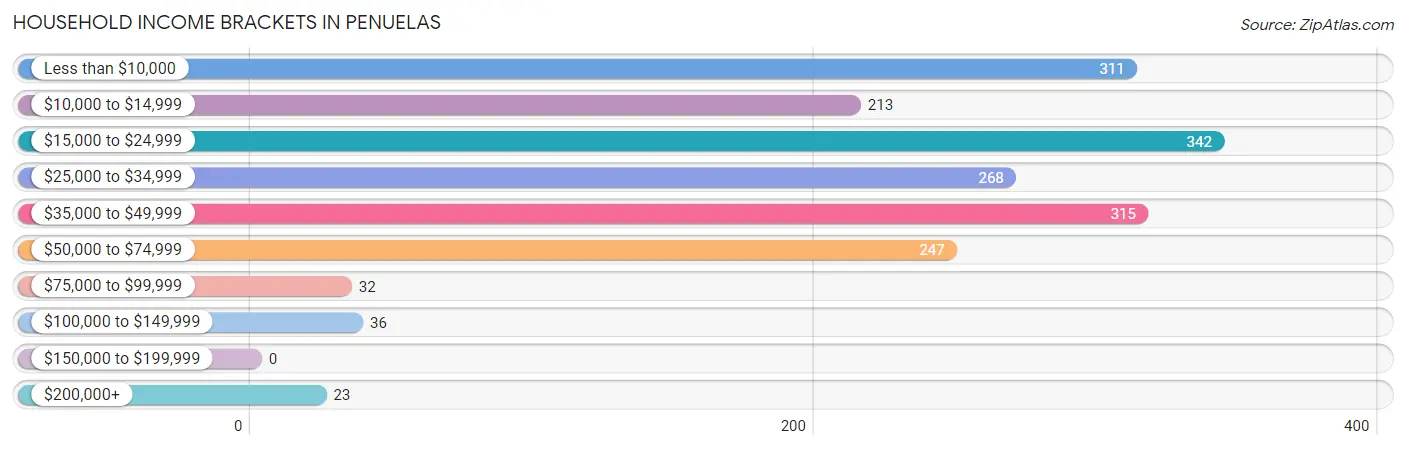
Household Income Brackets in Penuelas
With 342 households falling in the category, the $15,000 to $24,999 income range is the most frequent in Penuelas, accounting for 19.1% of all households.
| Income Bracket | # Households | % Households |
| Less than $10,000 | 311 | 17.4% |
| $10,000 to $14,999 | 213 | 11.9% |
| $15,000 to $24,999 | 342 | 19.1% |
| $25,000 to $34,999 | 268 | 15.0% |
| $35,000 to $49,999 | 315 | 17.6% |
| $50,000 to $74,999 | 247 | 13.8% |
| $75,000 to $99,999 | 32 | 1.8% |
| $100,000 to $149,999 | 36 | 2.0% |
| $150,000 to $199,999 | 0 | 0.0% |
| $200,000+ | 23 | 1.3% |
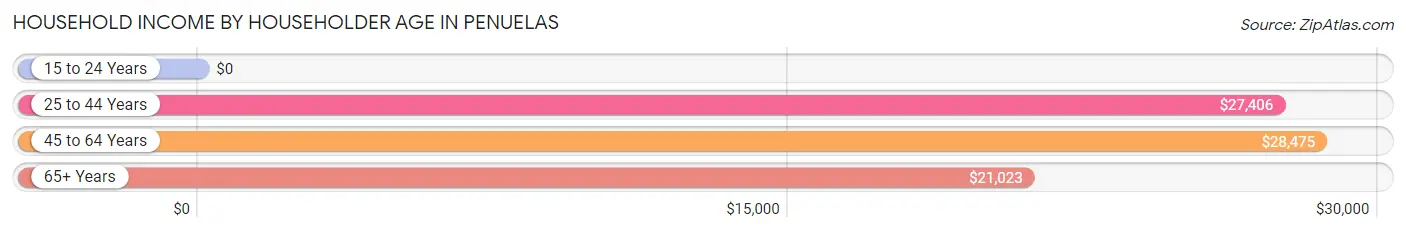
Household Income by Householder Age in Penuelas
The median household income in Penuelas is $26,094, with the highest median household income of $28,475 found in the 45 to 64 years age bracket for the primary householder. A total of 854 households (47.8%) fall into this category. Meanwhile, the 15 to 24 years age bracket for the primary householder has the lowest median household income of $0, with 21 households (1.2%) in this group.
| Income Bracket | # Households | Median Income |
| 15 to 24 Years | 21 (1.2%) | $0 |
| 25 to 44 Years | 425 (23.8%) | $27,406 |
| 45 to 64 Years | 854 (47.8%) | $28,475 |
| 65+ Years | 488 (27.3%) | $21,023 |
| Total | 1,788 (100.0%) | $26,094 |
Poverty in Penuelas
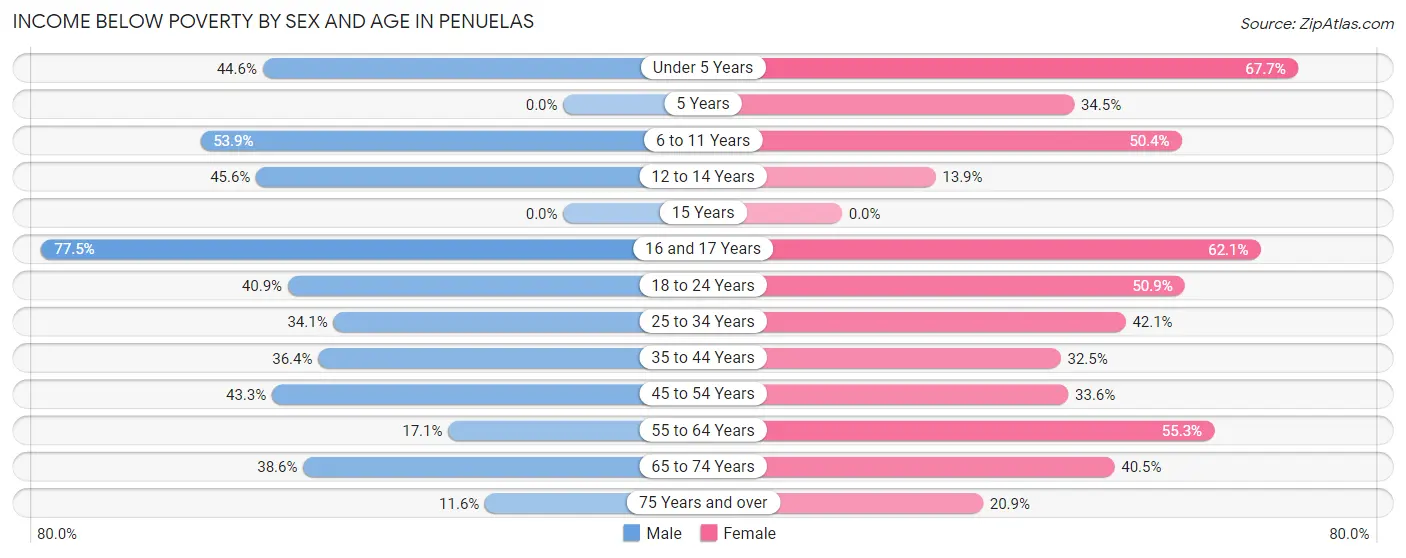
Income Below Poverty by Sex and Age in Penuelas
With 37.8% poverty level for males and 41.8% for females among the residents of Penuelas, 16 and 17 year old males and under 5 year old females are the most vulnerable to poverty, with 62 males (77.5%) and 111 females (67.7%) in their respective age groups living below the poverty level.
| Age Bracket | Male | Female |
| Under 5 Years | 25 (44.6%) | 111 (67.7%) |
| 5 Years | 0 (0.0%) | 10 (34.5%) |
| 6 to 11 Years | 117 (53.9%) | 116 (50.4%) |
| 12 to 14 Years | 52 (45.6%) | 10 (13.9%) |
| 15 Years | 0 (0.0%) | 0 (0.0%) |
| 16 and 17 Years | 62 (77.5%) | 64 (62.1%) |
| 18 to 24 Years | 137 (40.9%) | 203 (50.9%) |
| 25 to 34 Years | 86 (34.1%) | 123 (42.1%) |
| 35 to 44 Years | 111 (36.4%) | 153 (32.5%) |
| 45 to 54 Years | 170 (43.3%) | 160 (33.6%) |
| 55 to 64 Years | 41 (17.1%) | 179 (55.2%) |
| 65 to 74 Years | 56 (38.6%) | 70 (40.5%) |
| 75 Years and over | 18 (11.6%) | 49 (20.9%) |
| Total | 875 (37.8%) | 1,248 (41.8%) |
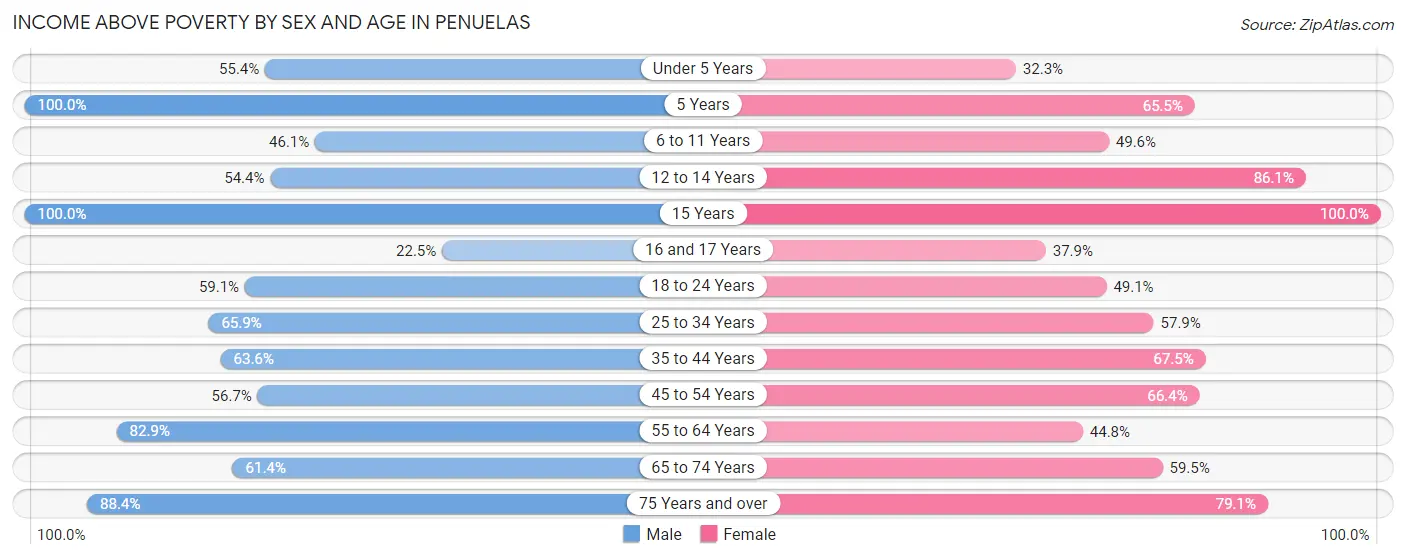
Income Above Poverty by Sex and Age in Penuelas
According to the poverty statistics in Penuelas, males aged 5 years and females aged 15 years are the age groups that are most secure financially, with 100.0% of males and 100.0% of females in these age groups living above the poverty line.
| Age Bracket | Male | Female |
| Under 5 Years | 31 (55.4%) | 53 (32.3%) |
| 5 Years | 17 (100.0%) | 19 (65.5%) |
| 6 to 11 Years | 100 (46.1%) | 114 (49.6%) |
| 12 to 14 Years | 62 (54.4%) | 62 (86.1%) |
| 15 Years | 5 (100.0%) | 15 (100.0%) |
| 16 and 17 Years | 18 (22.5%) | 39 (37.9%) |
| 18 to 24 Years | 198 (59.1%) | 196 (49.1%) |
| 25 to 34 Years | 166 (65.9%) | 169 (57.9%) |
| 35 to 44 Years | 194 (63.6%) | 318 (67.5%) |
| 45 to 54 Years | 223 (56.7%) | 316 (66.4%) |
| 55 to 64 Years | 199 (82.9%) | 145 (44.8%) |
| 65 to 74 Years | 89 (61.4%) | 103 (59.5%) |
| 75 Years and over | 137 (88.4%) | 185 (79.1%) |
| Total | 1,439 (62.2%) | 1,734 (58.2%) |
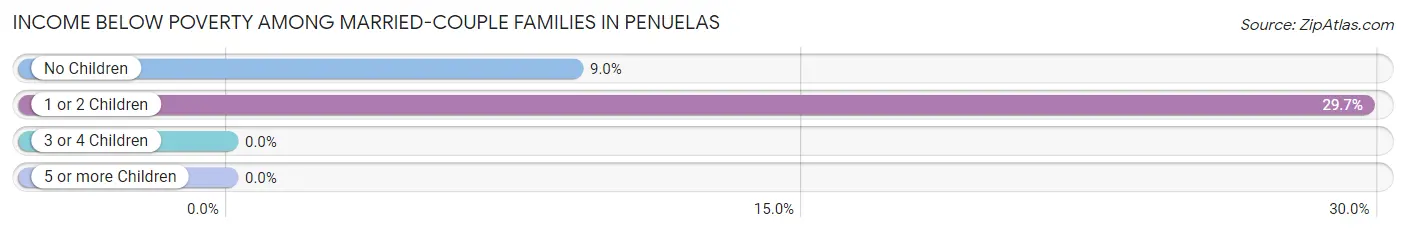
Income Below Poverty Among Married-Couple Families in Penuelas
The poverty statistics for married-couple families in Penuelas show that 14.5% or 77 of the total 532 families live below the poverty line. Families with 1 or 2 children have the highest poverty rate of 29.7%, comprising of 46 families. On the other hand, families with 3 or 4 children have the lowest poverty rate of 0.0%, which includes 0 families.
| Children | Above Poverty | Below Poverty |
| No Children | 313 (91.0%) | 31 (9.0%) |
| 1 or 2 Children | 109 (70.3%) | 46 (29.7%) |
| 3 or 4 Children | 33 (100.0%) | 0 (0.0%) |
| 5 or more Children | 0 (0.0%) | 0 (0.0%) |
| Total | 455 (85.5%) | 77 (14.5%) |
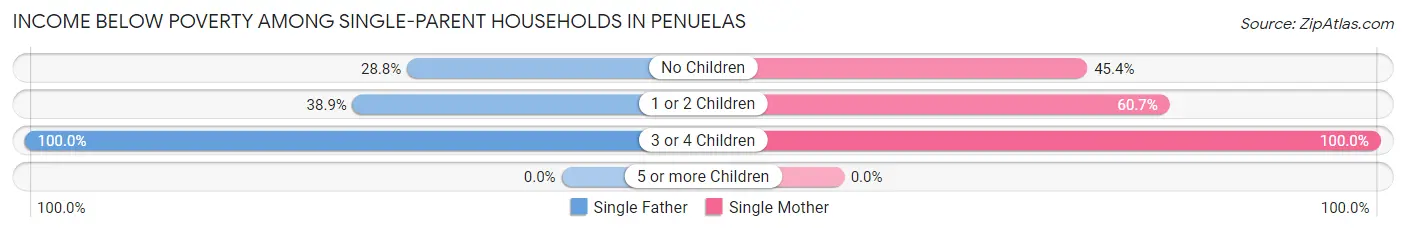
Income Below Poverty Among Single-Parent Households in Penuelas
According to the poverty data in Penuelas, 39.6% or 63 single-father households and 54.4% or 298 single-mother households are living below the poverty line. Among single-father households, those with 3 or 4 children have the highest poverty rate, with 14 households (100.0%) experiencing poverty. Likewise, among single-mother households, those with 3 or 4 children have the highest poverty rate, with 34 households (100.0%) falling below the poverty line.
| Children | Single Father | Single Mother |
| No Children | 21 (28.8%) | 142 (45.4%) |
| 1 or 2 Children | 28 (38.9%) | 122 (60.7%) |
| 3 or 4 Children | 14 (100.0%) | 34 (100.0%) |
| 5 or more Children | 0 (0.0%) | 0 (0.0%) |
| Total | 63 (39.6%) | 298 (54.4%) |
Income Below Poverty Among Married-Couple vs Single-Parent Households in Penuelas
The poverty data for Penuelas shows that 77 of the married-couple family households (14.5%) and 361 of the single-parent households (51.1%) are living below the poverty level. Within the married-couple family households, those with 1 or 2 children have the highest poverty rate, with 46 households (29.7%) falling below the poverty line. Among the single-parent households, those with 3 or 4 children have the highest poverty rate, with 48 household (100.0%) living below poverty.
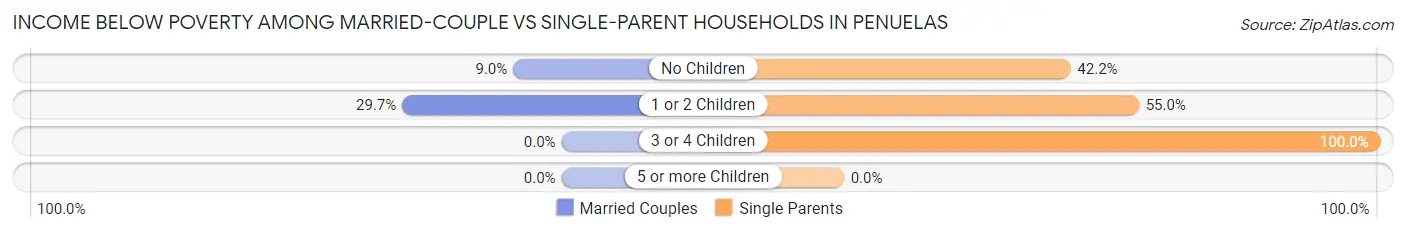
| Children | Married-Couple Families | Single-Parent Households |
| No Children | 31 (9.0%) | 163 (42.2%) |
| 1 or 2 Children | 46 (29.7%) | 150 (54.9%) |
| 3 or 4 Children | 0 (0.0%) | 48 (100.0%) |
| 5 or more Children | 0 (0.0%) | 0 (0.0%) |
| Total | 77 (14.5%) | 361 (51.1%) |
Race in Penuelas
The most populous races in Penuelas are Hispanic or Latino (5,238 | 98.9%), White / Caucasian (4,004 | 75.6%), and Some other Race (825 | 15.6%).
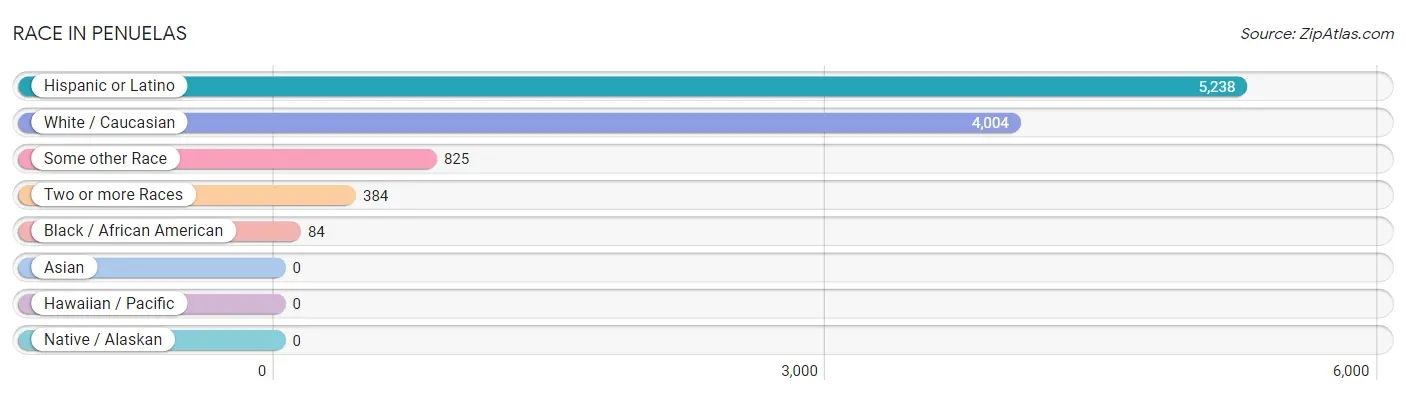
| Race | # Population | % Population |
| Asian | 0 | 0.0% |
| Black / African American | 84 | 1.6% |
| Hawaiian / Pacific | 0 | 0.0% |
| Hispanic or Latino | 5,238 | 98.9% |
| Native / Alaskan | 0 | 0.0% |
| White / Caucasian | 4,004 | 75.6% |
| Two or more Races | 384 | 7.2% |
| Some other Race | 825 | 15.6% |
| Total | 5,297 | 100.0% |
Ancestry in Penuelas
The most populous ancestries reported in Penuelas are Puerto Rican (5,192 | 98.0%), Dominican (30 | 0.6%), American (24 | 0.4%), Mexican (15 | 0.3%), and Central American Indian (5 | 0.1%), together accounting for 99.4% of all Penuelas residents.
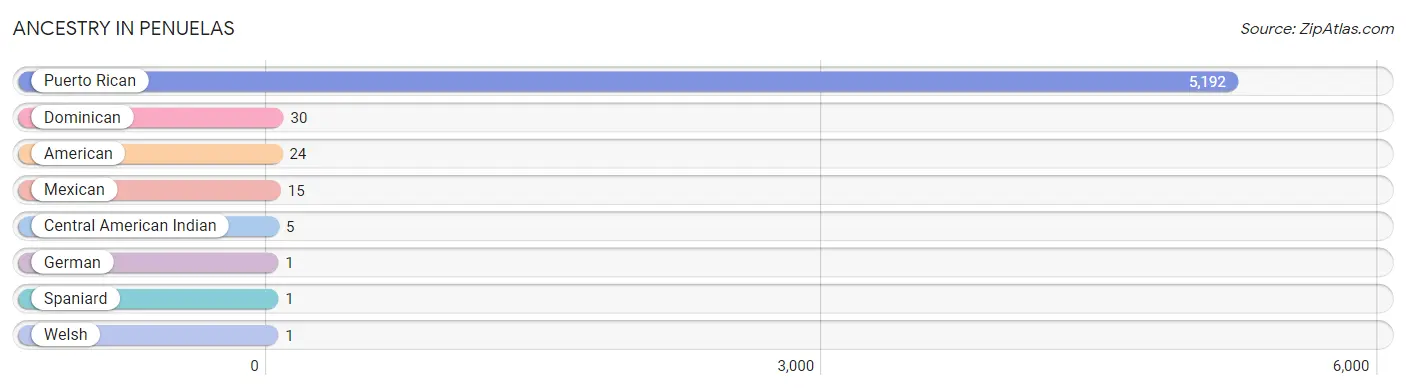
| Ancestry | # Population | % Population |
| American | 24 | 0.4% |
| Central American Indian | 5 | 0.1% |
| Dominican | 30 | 0.6% |
| German | 1 | 0.0% |
| Mexican | 15 | 0.3% |
| Puerto Rican | 5,192 | 98.0% |
| Spaniard | 1 | 0.0% |
| Welsh | 1 | 0.0% | View All 8 Rows |
Immigrants in Penuelas

| Immigration Origin | # Population | % Population | View All 0 Rows |
Sex and Age in Penuelas
Sex and Age in Penuelas
The most populous age groups in Penuelas are 20 to 24 Years (270 | 11.7%) for men and 20 to 24 Years (319 | 10.7%) for women.
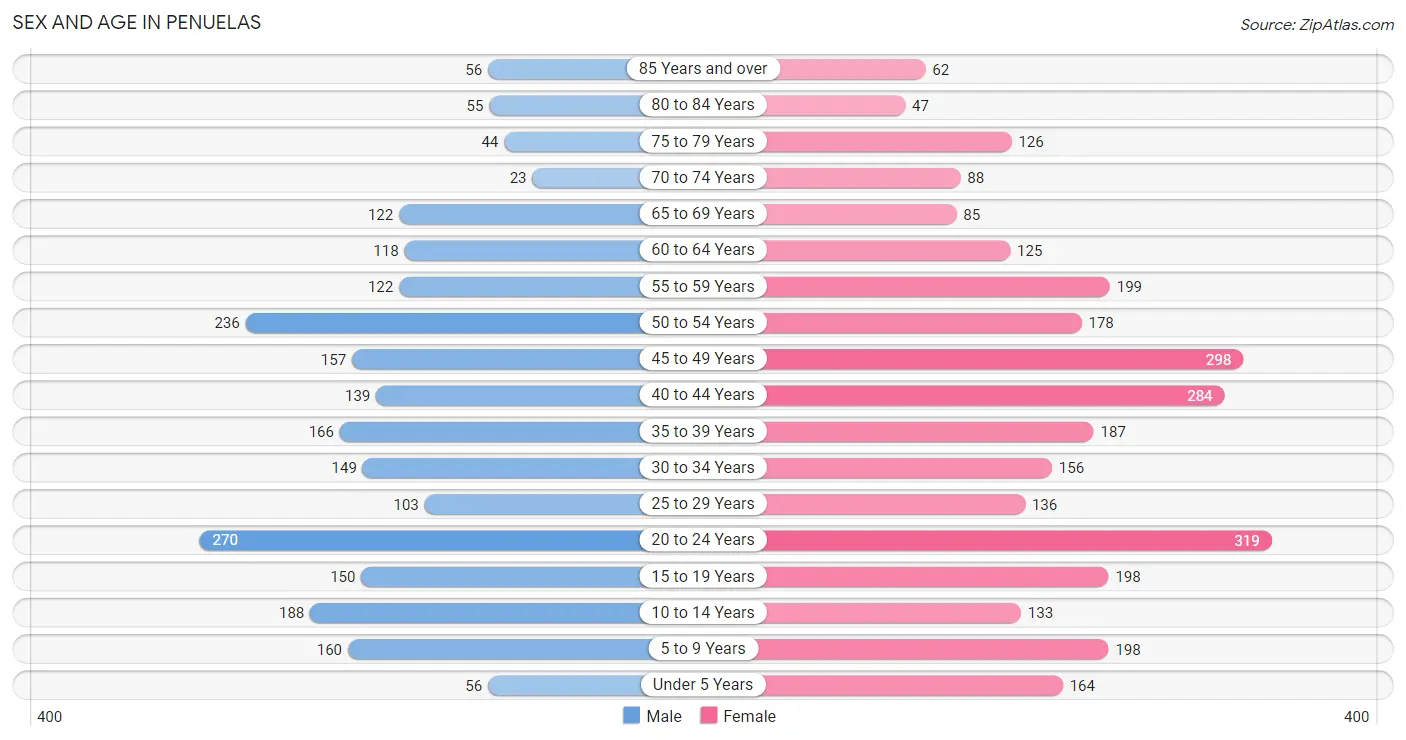
| Age Bracket | Male | Female |
| Under 5 Years | 56 (2.4%) | 164 (5.5%) |
| 5 to 9 Years | 160 (6.9%) | 198 (6.6%) |
| 10 to 14 Years | 188 (8.1%) | 133 (4.5%) |
| 15 to 19 Years | 150 (6.5%) | 198 (6.6%) |
| 20 to 24 Years | 270 (11.7%) | 319 (10.7%) |
| 25 to 29 Years | 103 (4.4%) | 136 (4.6%) |
| 30 to 34 Years | 149 (6.4%) | 156 (5.2%) |
| 35 to 39 Years | 166 (7.2%) | 187 (6.3%) |
| 40 to 44 Years | 139 (6.0%) | 284 (9.5%) |
| 45 to 49 Years | 157 (6.8%) | 298 (10.0%) |
| 50 to 54 Years | 236 (10.2%) | 178 (6.0%) |
| 55 to 59 Years | 122 (5.3%) | 199 (6.7%) |
| 60 to 64 Years | 118 (5.1%) | 125 (4.2%) |
| 65 to 69 Years | 122 (5.3%) | 85 (2.9%) |
| 70 to 74 Years | 23 (1.0%) | 88 (2.9%) |
| 75 to 79 Years | 44 (1.9%) | 126 (4.2%) |
| 80 to 84 Years | 55 (2.4%) | 47 (1.6%) |
| 85 Years and over | 56 (2.4%) | 62 (2.1%) |
| Total | 2,314 (100.0%) | 2,983 (100.0%) |
Families and Households in Penuelas
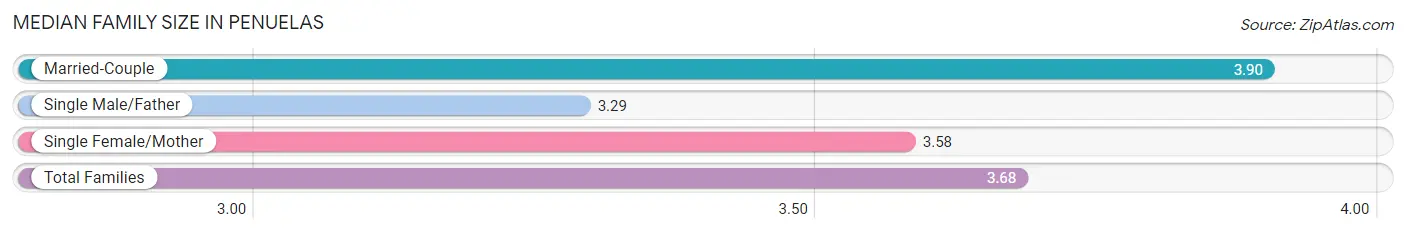
Median Family Size in Penuelas
The median family size in Penuelas is 3.68 persons per family, with married-couple families (532 | 42.9%) accounting for the largest median family size of 3.9 persons per family. On the other hand, single male/father families (159 | 12.8%) represent the smallest median family size with 3.29 persons per family.
| Family Type | # Families | Family Size |
| Married-Couple | 532 (42.9%) | 3.90 |
| Single Male/Father | 159 (12.8%) | 3.29 |
| Single Female/Mother | 548 (44.2%) | 3.58 |
| Total Families | 1,239 (100.0%) | 3.68 |
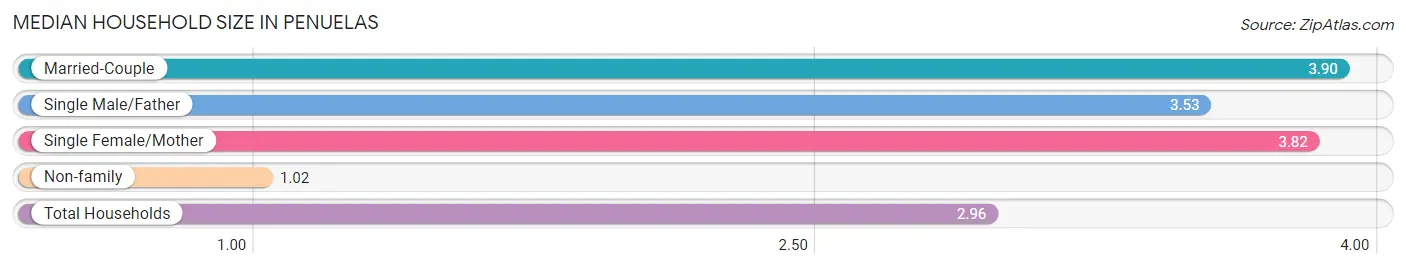
Median Household Size in Penuelas
The median household size in Penuelas is 2.96 persons per household, with married-couple households (532 | 29.7%) accounting for the largest median household size of 3.9 persons per household. non-family households (549 | 30.7%) represent the smallest median household size with 1.02 persons per household.
| Household Type | # Households | Household Size |
| Married-Couple | 532 (29.7%) | 3.90 |
| Single Male/Father | 159 (8.9%) | 3.53 |
| Single Female/Mother | 548 (30.6%) | 3.82 |
| Non-family | 549 (30.7%) | 1.02 |
| Total Households | 1,788 (100.0%) | 2.96 |
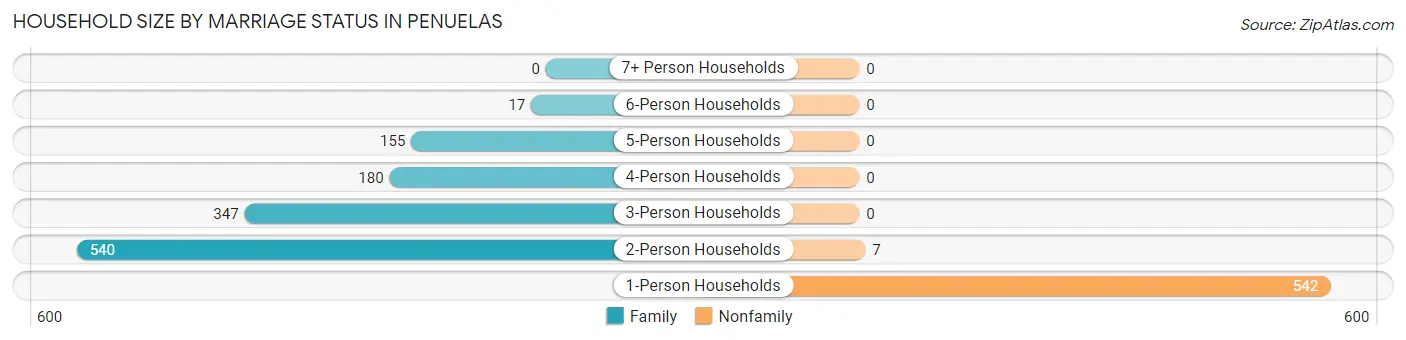
Household Size by Marriage Status in Penuelas
Out of a total of 1,788 households in Penuelas, 1,239 (69.3%) are family households, while 549 (30.7%) are nonfamily households. The most numerous type of family households are 2-person households, comprising 540, and the most common type of nonfamily households are 1-person households, comprising 542.
| Household Size | Family Households | Nonfamily Households |
| 1-Person Households | - | 542 (30.3%) |
| 2-Person Households | 540 (30.2%) | 7 (0.4%) |
| 3-Person Households | 347 (19.4%) | 0 (0.0%) |
| 4-Person Households | 180 (10.1%) | 0 (0.0%) |
| 5-Person Households | 155 (8.7%) | 0 (0.0%) |
| 6-Person Households | 17 (0.9%) | 0 (0.0%) |
| 7+ Person Households | 0 (0.0%) | 0 (0.0%) |
| Total | 1,239 (69.3%) | 549 (30.7%) |
Female Fertility in Penuelas
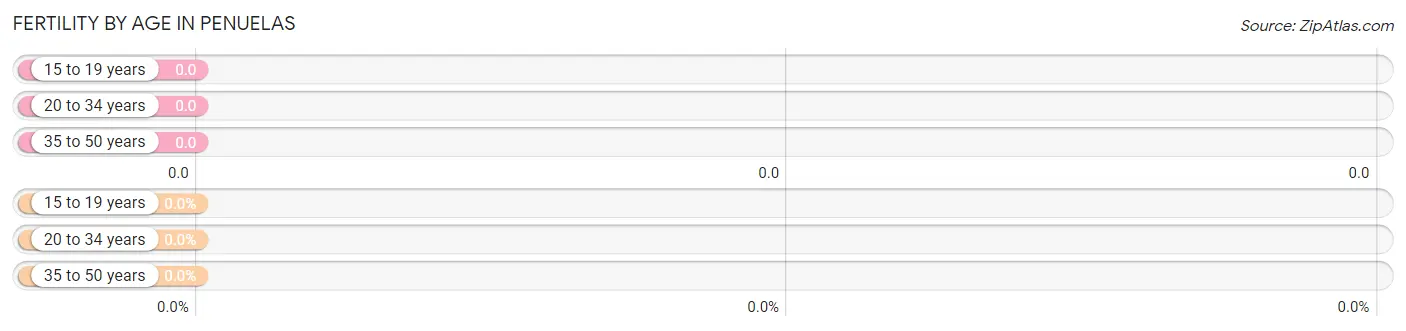
Fertility by Age in Penuelas
| Age Bracket | Women with Births | Births / 1,000 Women |
| 15 to 19 years | 0 (0.0%) | 0.0 |
| 20 to 34 years | 0 (0.0%) | 0.0 |
| 35 to 50 years | 0 (0.0%) | 0.0 |
| Total | 0 (0.0%) | 0.0 |
Fertility by Age by Marriage Status in Penuelas
| Age Bracket | Married | Unmarried |
| 15 to 19 years | 0 (0.0%) | 0 (0.0%) |
| 20 to 34 years | 0 (0.0%) | 0 (0.0%) |
| 35 to 50 years | 0 (0.0%) | 0 (0.0%) |
| Total | 0 (0.0%) | 0 (0.0%) |
Fertility by Education in Penuelas
| Educational Attainment | Women with Births | Births / 1,000 Women |
| Less than High School | 0 (0.0%) | 0.0 |
| High School Diploma | 0 (0.0%) | 0.0 |
| College or Associate's Degree | 0 (0.0%) | 0.0 |
| Bachelor's Degree | 0 (0.0%) | 0.0 |
| Graduate Degree | 0 (0.0%) | 0.0 |
| Total | 0 (0.0%) | 0.0 |
Fertility by Education by Marriage Status in Penuelas
| Educational Attainment | Married | Unmarried |
| Less than High School | 0 (0.0%) | 0 (0.0%) |
| High School Diploma | 0 (0.0%) | 0 (0.0%) |
| College or Associate's Degree | 0 (0.0%) | 0 (0.0%) |
| Bachelor's Degree | 0 (0.0%) | 0 (0.0%) |
| Graduate Degree | 0 (0.0%) | 0 (0.0%) |
| Total | 0 (0.0%) | 0 (0.0%) |
Employment Characteristics in Penuelas
Employment by Class of Employer in Penuelas
Among the 1,602 employed individuals in Penuelas, private company employees (998 | 62.3%), state government employees (213 | 13.3%), and local government employees (172 | 10.7%) make up the most common classes of employment.
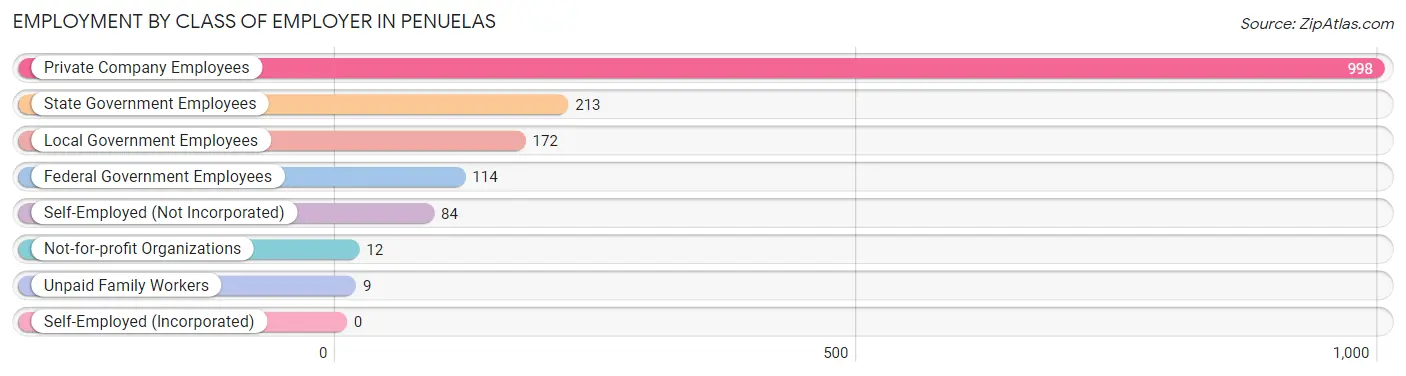
| Employer Class | # Employees | % Employees |
| Private Company Employees | 998 | 62.3% |
| Self-Employed (Incorporated) | 0 | 0.0% |
| Self-Employed (Not Incorporated) | 84 | 5.2% |
| Not-for-profit Organizations | 12 | 0.7% |
| Local Government Employees | 172 | 10.7% |
| State Government Employees | 213 | 13.3% |
| Federal Government Employees | 114 | 7.1% |
| Unpaid Family Workers | 9 | 0.6% |
| Total | 1,602 | 100.0% |
Employment Status by Age in Penuelas
According to the labor force statistics for Penuelas, out of the total population over 16 years of age (4,378), 42.6% or 1,865 individuals are in the labor force, with 14.3% or 267 of them unemployed. The age group with the highest labor force participation rate is 25 to 29 years, with 81.2% or 194 individuals in the labor force. Within the labor force, the 25 to 29 years age range has the highest percentage of unemployed individuals, with 27.8% or 54 of them being unemployed.
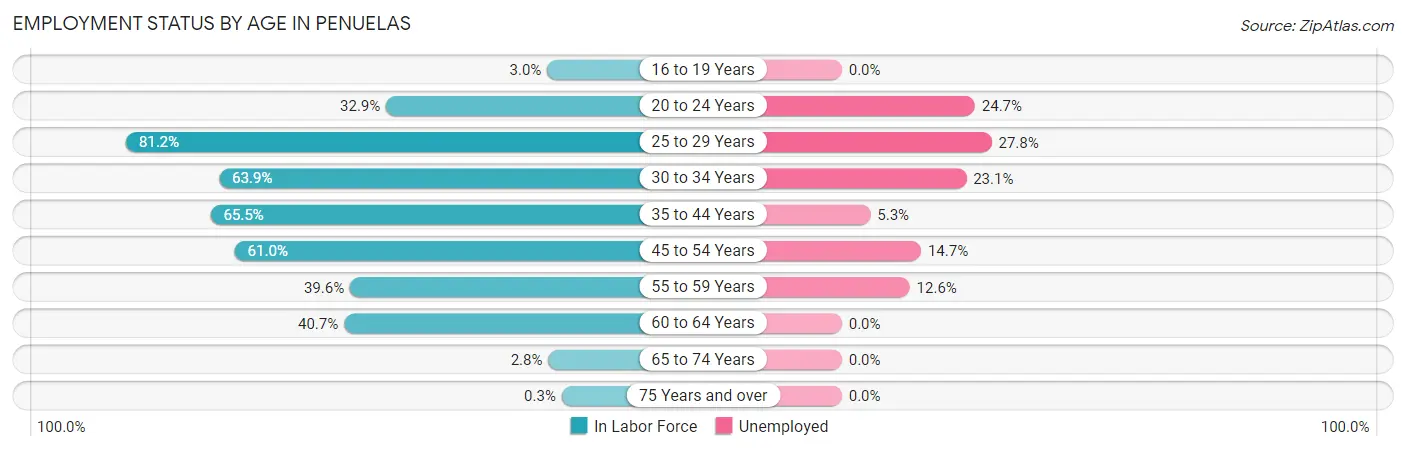
| Age Bracket | In Labor Force | Unemployed |
| 16 to 19 Years | 10 (3.0%) | 0 (0.0%) |
| 20 to 24 Years | 194 (32.9%) | 48 (24.7%) |
| 25 to 29 Years | 194 (81.2%) | 54 (27.8%) |
| 30 to 34 Years | 195 (63.9%) | 45 (23.1%) |
| 35 to 44 Years | 508 (65.5%) | 27 (5.3%) |
| 45 to 54 Years | 530 (61.0%) | 78 (14.7%) |
| 55 to 59 Years | 127 (39.6%) | 16 (12.6%) |
| 60 to 64 Years | 99 (40.7%) | 0 (0.0%) |
| 65 to 74 Years | 9 (2.8%) | 0 (0.0%) |
| 75 Years and over | 1 (0.3%) | 0 (0.0%) |
| Total | 1,865 (42.6%) | 267 (14.3%) |
Employment Status by Educational Attainment in Penuelas
According to labor force statistics for Penuelas, 60.0% of individuals (1,652) out of the total population between 25 and 64 years of age (2,753) are in the labor force, with 13.2% or 218 of them being unemployed. The group with the highest labor force participation rate are those with the educational attainment of bachelor's degree or higher, with 81.5% or 794 individuals in the labor force. Within the labor force, individuals with less than high school education have the highest percentage of unemployment, with 79.2% or 84 of them being unemployed.
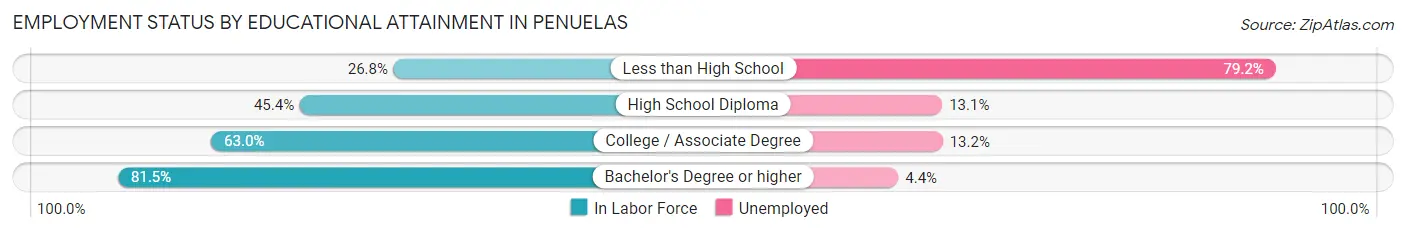
| Educational Attainment | In Labor Force | Unemployed |
| Less than High School | 106 (26.8%) | 314 (79.2%) |
| High School Diploma | 306 (45.4%) | 88 (13.1%) |
| College / Associate Degree | 447 (63.0%) | 94 (13.2%) |
| Bachelor's Degree or higher | 794 (81.5%) | 43 (4.4%) |
| Total | 1,652 (60.0%) | 363 (13.2%) |
Employment Occupations by Sex in Penuelas
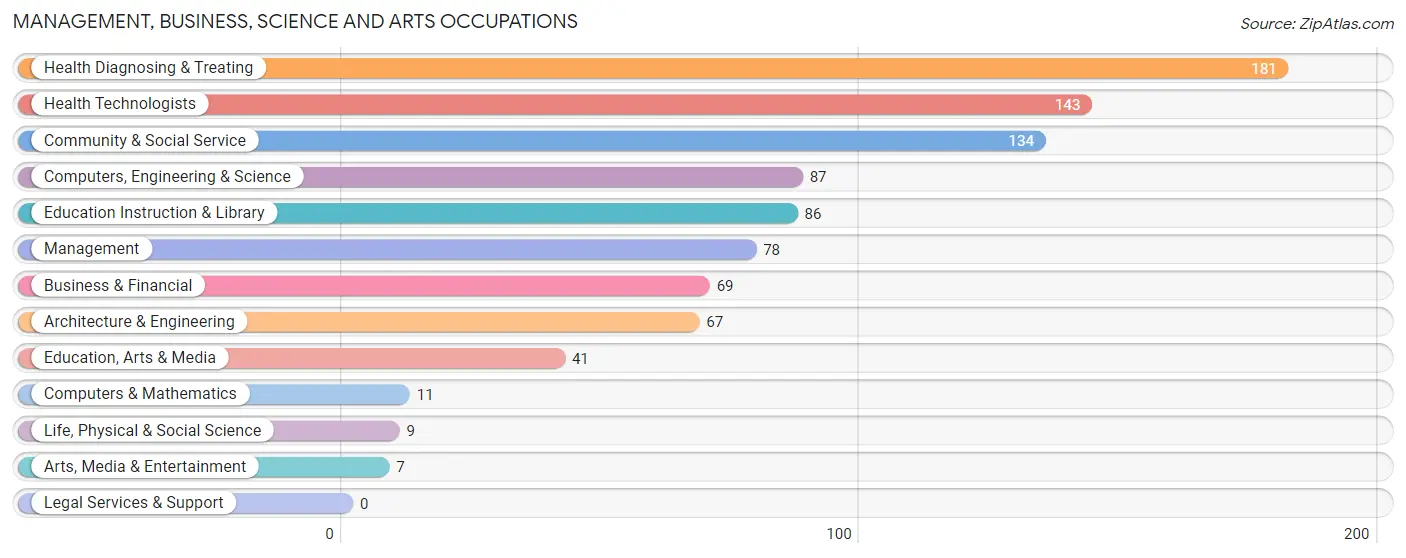
Management, Business, Science and Arts Occupations
The most common Management, Business, Science and Arts occupations in Penuelas are Health Diagnosing & Treating (181 | 11.4%), Health Technologists (143 | 9.0%), Community & Social Service (134 | 8.4%), Computers, Engineering & Science (87 | 5.5%), and Education Instruction & Library (86 | 5.4%).
Management, Business, Science and Arts Occupations by Sex
Within the Management, Business, Science and Arts occupations in Penuelas, the most male-oriented occupations are Computers & Mathematics (100.0%), Architecture & Engineering (100.0%), and Computers, Engineering & Science (89.7%), while the most female-oriented occupations are Life, Physical & Social Science (100.0%), Arts, Media & Entertainment (100.0%), and Health Diagnosing & Treating (100.0%).
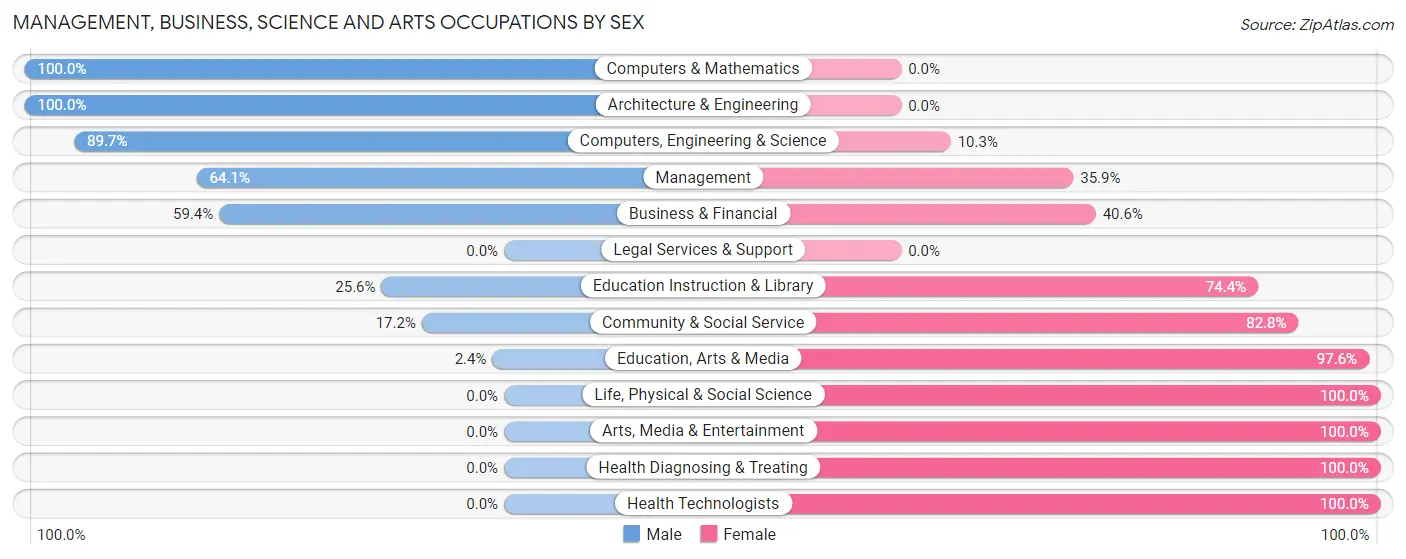
| Occupation | Male | Female |
| Management | 50 (64.1%) | 28 (35.9%) |
| Business & Financial | 41 (59.4%) | 28 (40.6%) |
| Computers, Engineering & Science | 78 (89.7%) | 9 (10.3%) |
| Computers & Mathematics | 11 (100.0%) | 0 (0.0%) |
| Architecture & Engineering | 67 (100.0%) | 0 (0.0%) |
| Life, Physical & Social Science | 0 (0.0%) | 9 (100.0%) |
| Community & Social Service | 23 (17.2%) | 111 (82.8%) |
| Education, Arts & Media | 1 (2.4%) | 40 (97.6%) |
| Legal Services & Support | 0 (0.0%) | 0 (0.0%) |
| Education Instruction & Library | 22 (25.6%) | 64 (74.4%) |
| Arts, Media & Entertainment | 0 (0.0%) | 7 (100.0%) |
| Health Diagnosing & Treating | 0 (0.0%) | 181 (100.0%) |
| Health Technologists | 0 (0.0%) | 143 (100.0%) |
| Total (Category) | 192 (35.0%) | 357 (65.0%) |
| Total (Overall) | 796 (50.1%) | 793 (49.9%) |
Services Occupations
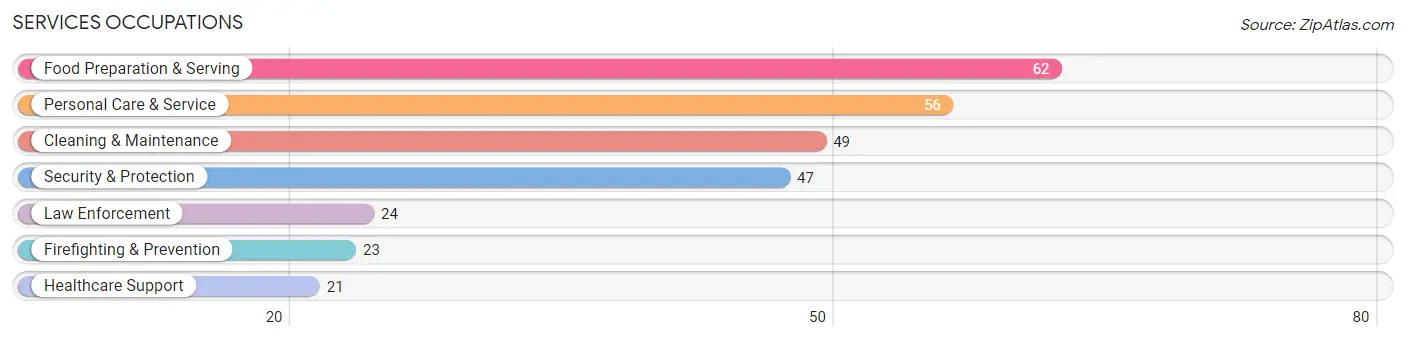
The most common Services occupations in Penuelas are Food Preparation & Serving (62 | 3.9%), Personal Care & Service (56 | 3.5%), Cleaning & Maintenance (49 | 3.1%), Security & Protection (47 | 3.0%), and Law Enforcement (24 | 1.5%).
Services Occupations by Sex
Within the Services occupations in Penuelas, the most male-oriented occupations are Personal Care & Service (100.0%), Cleaning & Maintenance (75.5%), and Law Enforcement (70.8%), while the most female-oriented occupations are Healthcare Support (100.0%), Firefighting & Prevention (73.9%), and Food Preparation & Serving (69.4%).
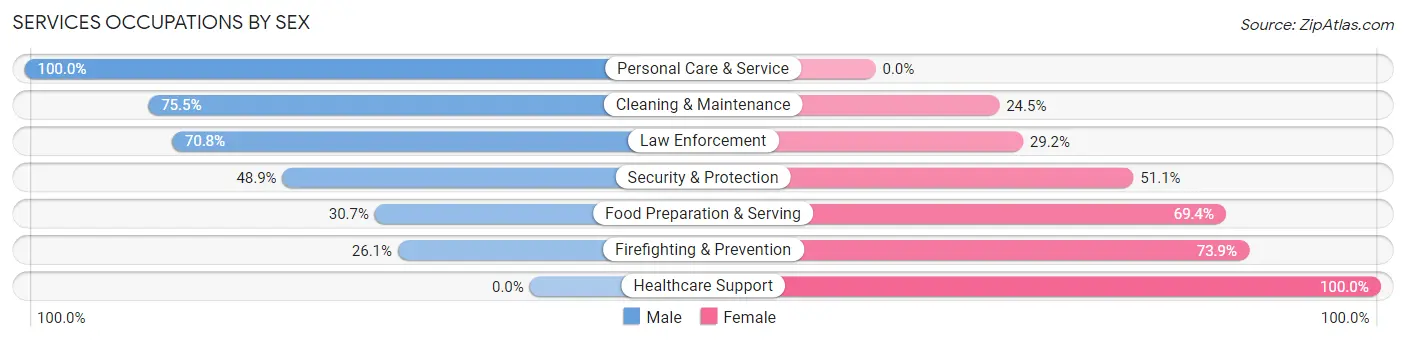
| Occupation | Male | Female |
| Healthcare Support | 0 (0.0%) | 21 (100.0%) |
| Security & Protection | 23 (48.9%) | 24 (51.1%) |
| Firefighting & Prevention | 6 (26.1%) | 17 (73.9%) |
| Law Enforcement | 17 (70.8%) | 7 (29.2%) |
| Food Preparation & Serving | 19 (30.6%) | 43 (69.4%) |
| Cleaning & Maintenance | 37 (75.5%) | 12 (24.5%) |
| Personal Care & Service | 56 (100.0%) | 0 (0.0%) |
| Total (Category) | 135 (57.5%) | 100 (42.5%) |
| Total (Overall) | 796 (50.1%) | 793 (49.9%) |
Sales and Office Occupations
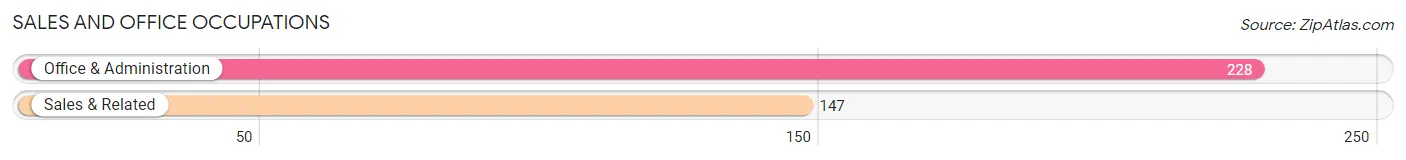
The most common Sales and Office occupations in Penuelas are Office & Administration (228 | 14.3%), and Sales & Related (147 | 9.2%).
Sales and Office Occupations by Sex
| Occupation | Male | Female |
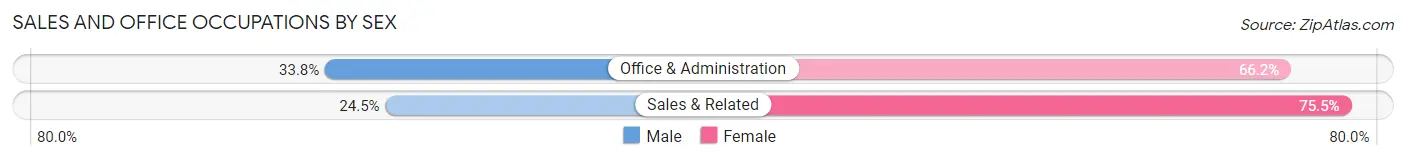
| Sales & Related | 36 (24.5%) | 111 (75.5%) |
| Office & Administration | 77 (33.8%) | 151 (66.2%) |
| Total (Category) | 113 (30.1%) | 262 (69.9%) |
| Total (Overall) | 796 (50.1%) | 793 (49.9%) |
Natural Resources, Construction and Maintenance Occupations
The most common Natural Resources, Construction and Maintenance occupations in Penuelas are Installation, Maintenance & Repair (74 | 4.7%), and Construction & Extraction (66 | 4.2%).
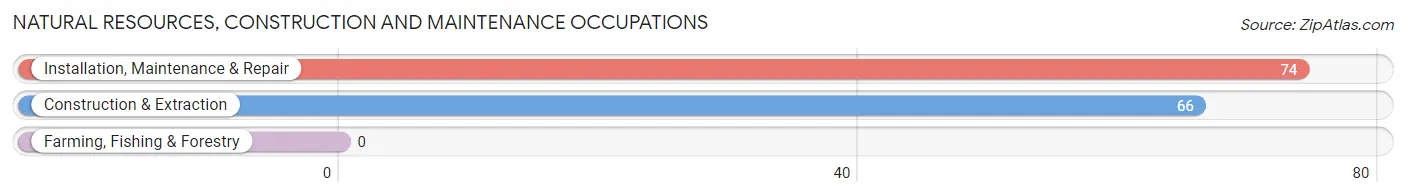
Natural Resources, Construction and Maintenance Occupations by Sex
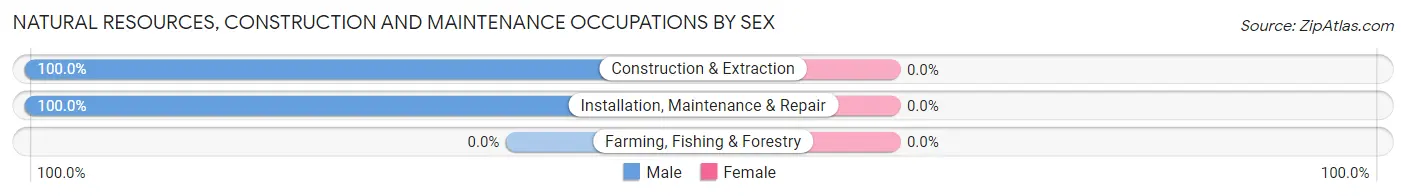
| Occupation | Male | Female |
| Farming, Fishing & Forestry | 0 (0.0%) | 0 (0.0%) |
| Construction & Extraction | 66 (100.0%) | 0 (0.0%) |
| Installation, Maintenance & Repair | 74 (100.0%) | 0 (0.0%) |
| Total (Category) | 140 (100.0%) | 0 (0.0%) |
| Total (Overall) | 796 (50.1%) | 793 (49.9%) |
Production, Transportation and Moving Occupations
The most common Production, Transportation and Moving occupations in Penuelas are Production (125 | 7.9%), Transportation (96 | 6.0%), and Material Moving (69 | 4.3%).
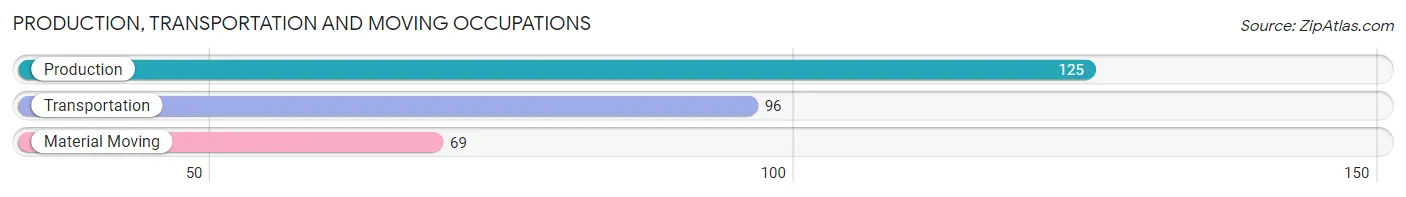
Production, Transportation and Moving Occupations by Sex
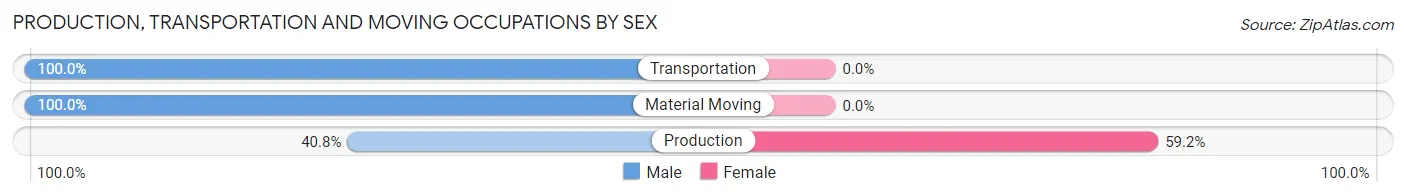
| Occupation | Male | Female |
| Production | 51 (40.8%) | 74 (59.2%) |
| Transportation | 96 (100.0%) | 0 (0.0%) |
| Material Moving | 69 (100.0%) | 0 (0.0%) |
| Total (Category) | 216 (74.5%) | 74 (25.5%) |
| Total (Overall) | 796 (50.1%) | 793 (49.9%) |
Employment Industries by Sex in Penuelas
Employment Industries in Penuelas
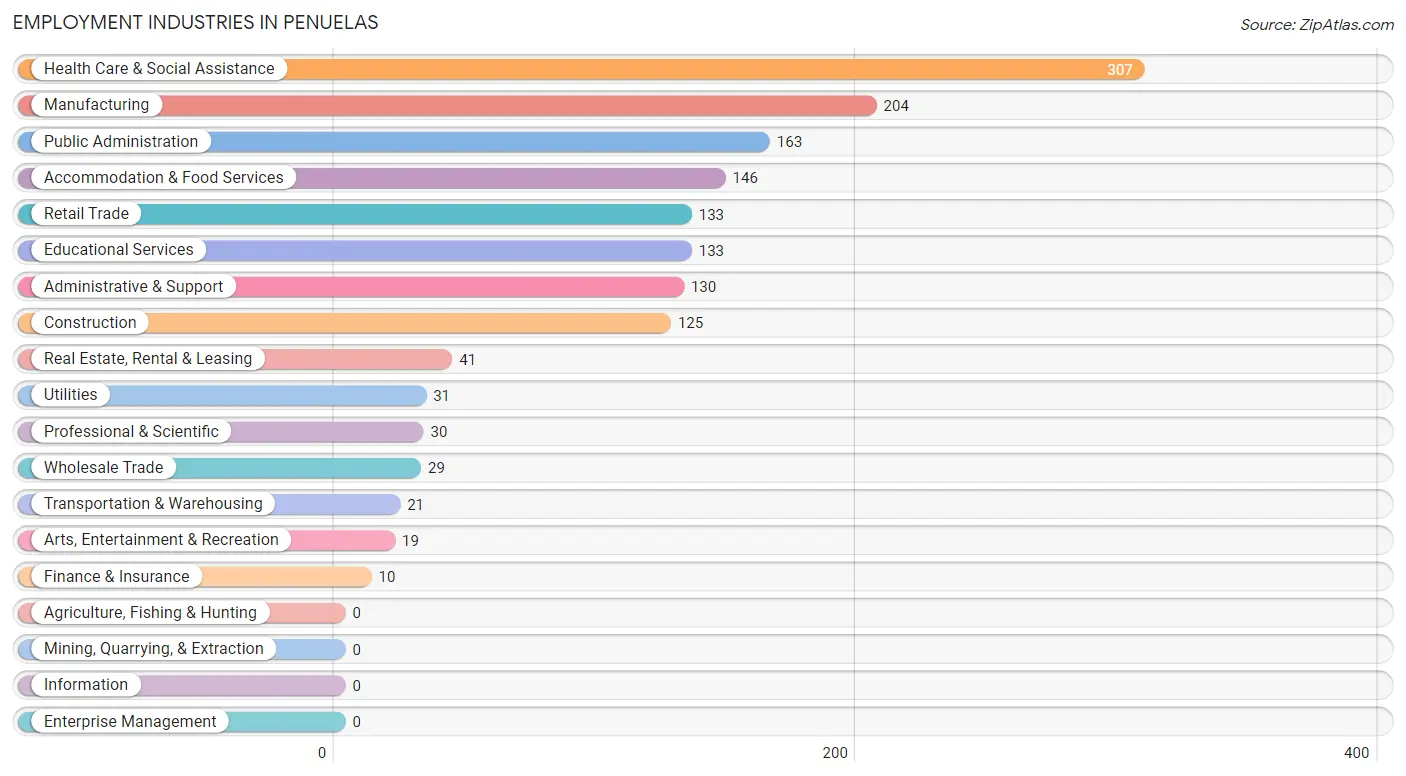
The major employment industries in Penuelas include Health Care & Social Assistance (307 | 19.3%), Manufacturing (204 | 12.8%), Public Administration (163 | 10.3%), Accommodation & Food Services (146 | 9.2%), and Retail Trade (133 | 8.4%).
Employment Industries by Sex in Penuelas
The Penuelas industries that see more men than women are Construction (100.0%), Transportation & Warehousing (100.0%), and Utilities (100.0%), whereas the industries that tend to have a higher number of women are Finance & Insurance (100.0%), Health Care & Social Assistance (92.8%), and Professional & Scientific (80.0%).
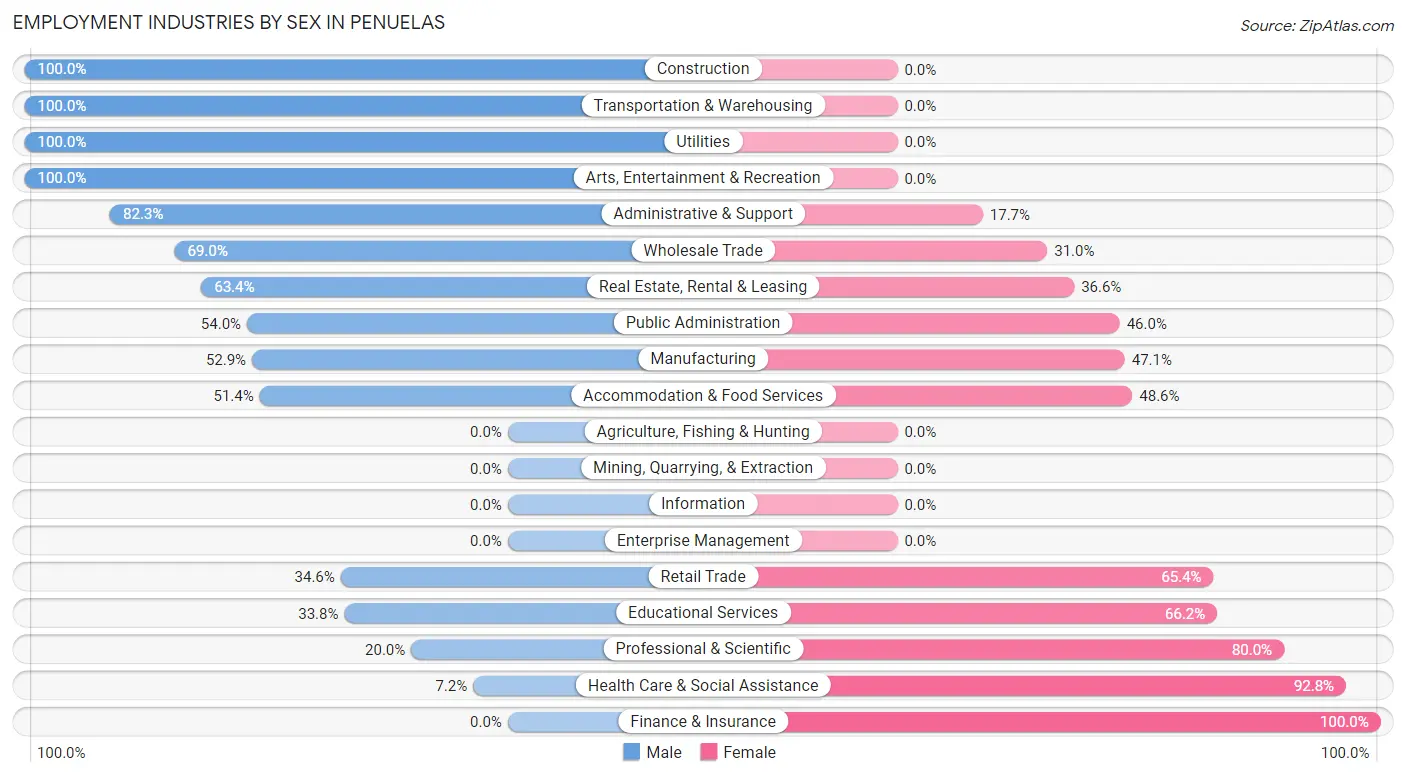
| Industry | Male | Female |
| Agriculture, Fishing & Hunting | 0 (0.0%) | 0 (0.0%) |
| Mining, Quarrying, & Extraction | 0 (0.0%) | 0 (0.0%) |
| Construction | 125 (100.0%) | 0 (0.0%) |
| Manufacturing | 108 (52.9%) | 96 (47.1%) |
| Wholesale Trade | 20 (69.0%) | 9 (31.0%) |
| Retail Trade | 46 (34.6%) | 87 (65.4%) |
| Transportation & Warehousing | 21 (100.0%) | 0 (0.0%) |
| Utilities | 31 (100.0%) | 0 (0.0%) |
| Information | 0 (0.0%) | 0 (0.0%) |
| Finance & Insurance | 0 (0.0%) | 10 (100.0%) |
| Real Estate, Rental & Leasing | 26 (63.4%) | 15 (36.6%) |
| Professional & Scientific | 6 (20.0%) | 24 (80.0%) |
| Enterprise Management | 0 (0.0%) | 0 (0.0%) |
| Administrative & Support | 107 (82.3%) | 23 (17.7%) |
| Educational Services | 45 (33.8%) | 88 (66.2%) |
| Health Care & Social Assistance | 22 (7.2%) | 285 (92.8%) |
| Arts, Entertainment & Recreation | 19 (100.0%) | 0 (0.0%) |
| Accommodation & Food Services | 75 (51.4%) | 71 (48.6%) |
| Public Administration | 88 (54.0%) | 75 (46.0%) |
| Total | 796 (50.1%) | 793 (49.9%) |
Education in Penuelas
School Enrollment in Penuelas
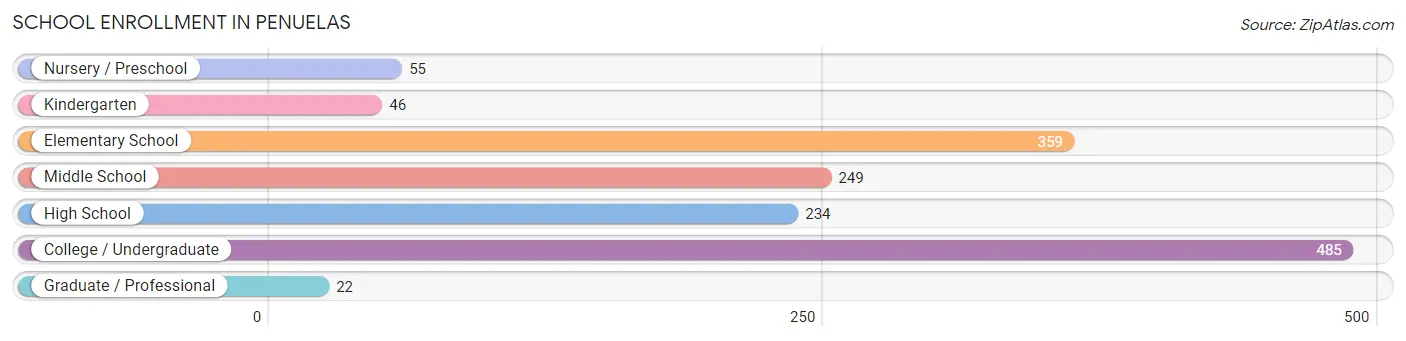
The most common levels of schooling among the 1,450 students in Penuelas are college / undergraduate (485 | 33.5%), elementary school (359 | 24.8%), and middle school (249 | 17.2%).
| School Level | # Students | % Students |
| Nursery / Preschool | 55 | 3.8% |
| Kindergarten | 46 | 3.2% |
| Elementary School | 359 | 24.8% |
| Middle School | 249 | 17.2% |
| High School | 234 | 16.1% |
| College / Undergraduate | 485 | 33.5% |
| Graduate / Professional | 22 | 1.5% |
| Total | 1,450 | 100.0% |
School Enrollment by Age by Funding Source in Penuelas
Out of a total of 1,450 students who are enrolled in schools in Penuelas, 450 (31.0%) attend a private institution, while the remaining 1,000 (69.0%) are enrolled in public schools. The age group of 25 to 34 year olds has the highest likelihood of being enrolled in private schools, with 50 (100.0% in the age bracket) enrolled. Conversely, the age group of 15 to 17 year olds has the lowest likelihood of being enrolled in a private school, with 174 (100.0% in the age bracket) attending a public institution.
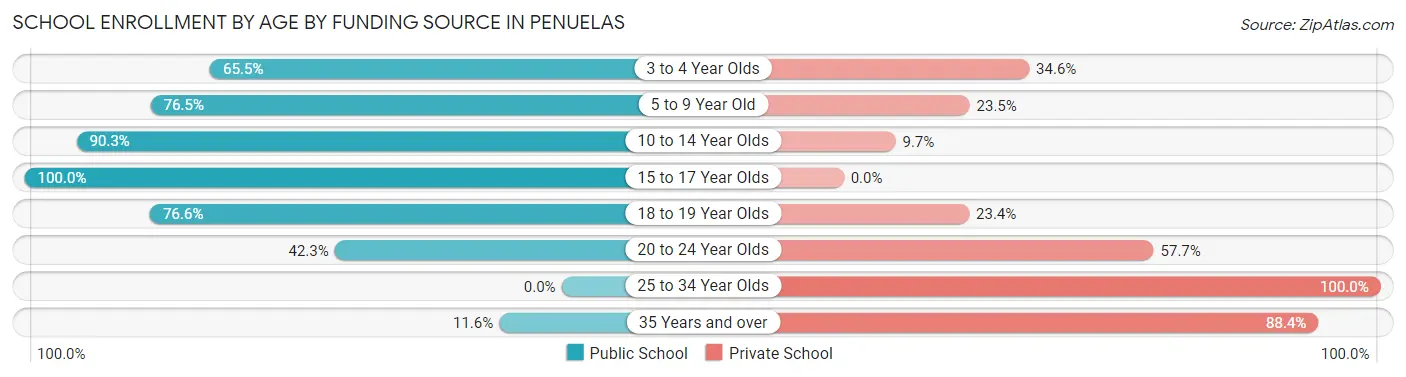
| Age Bracket | Public School | Private School |
| 3 to 4 Year Olds | 36 (65.4%) | 19 (34.5%) |
| 5 to 9 Year Old | 274 (76.5%) | 84 (23.5%) |
| 10 to 14 Year Olds | 262 (90.3%) | 28 (9.7%) |
| 15 to 17 Year Olds | 174 (100.0%) | 0 (0.0%) |
| 18 to 19 Year Olds | 105 (76.6%) | 32 (23.4%) |
| 20 to 24 Year Olds | 145 (42.3%) | 198 (57.7%) |
| 25 to 34 Year Olds | 0 (0.0%) | 50 (100.0%) |
| 35 Years and over | 5 (11.6%) | 38 (88.4%) |
| Total | 1,000 (69.0%) | 450 (31.0%) |
Educational Attainment by Field of Study in Penuelas
Business (283 | 25.5%), science & technology (249 | 22.4%), education (199 | 17.9%), engineering (88 | 7.9%), and arts & humanities (82 | 7.4%) are the most common fields of study among 1,110 individuals in Penuelas who have obtained a bachelor's degree or higher.
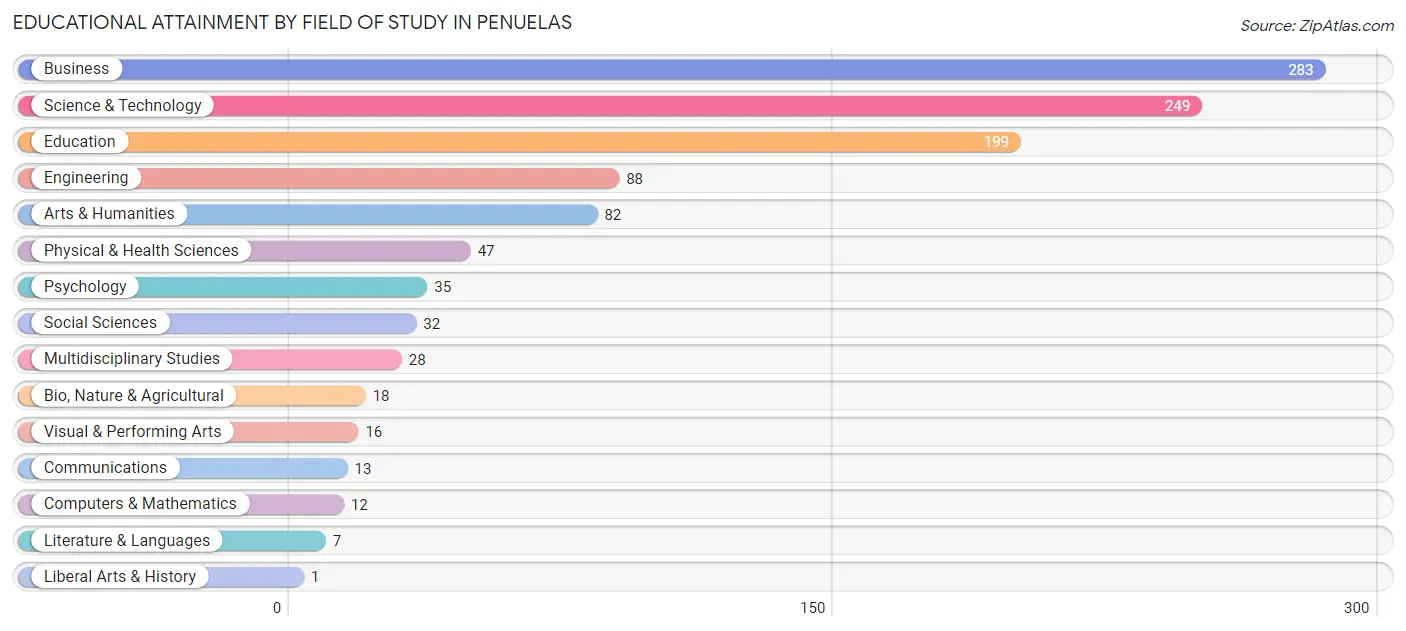
| Field of Study | # Graduates | % Graduates |
| Computers & Mathematics | 12 | 1.1% |
| Bio, Nature & Agricultural | 18 | 1.6% |
| Physical & Health Sciences | 47 | 4.2% |
| Psychology | 35 | 3.2% |
| Social Sciences | 32 | 2.9% |
| Engineering | 88 | 7.9% |
| Multidisciplinary Studies | 28 | 2.5% |
| Science & Technology | 249 | 22.4% |
| Business | 283 | 25.5% |
| Education | 199 | 17.9% |
| Literature & Languages | 7 | 0.6% |
| Liberal Arts & History | 1 | 0.1% |
| Visual & Performing Arts | 16 | 1.4% |
| Communications | 13 | 1.2% |
| Arts & Humanities | 82 | 7.4% |
| Total | 1,110 | 100.0% |
Transportation & Commute in Penuelas
Vehicle Availability by Sex in Penuelas
The most prevalent vehicle ownership categories in Penuelas are males with 2 vehicles (377, accounting for 46.7%) and females with 2 vehicles (336, making up 47.5%).
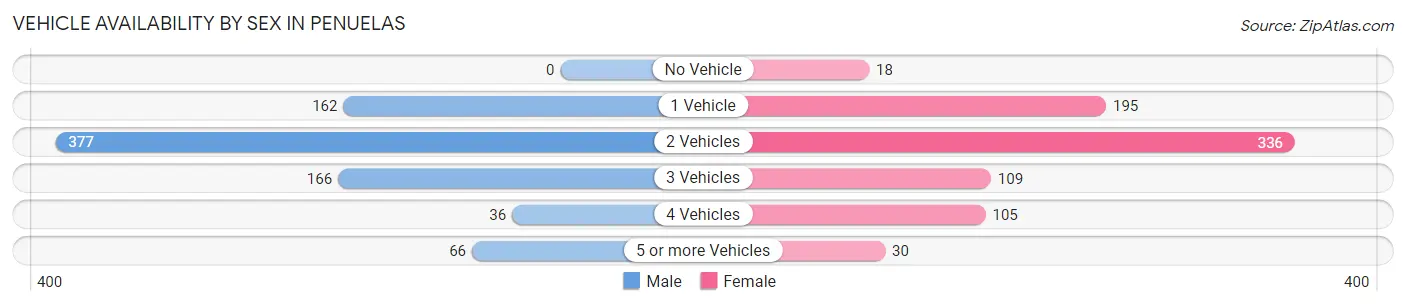
| Vehicles Available | Male | Female |
| No Vehicle | 0 (0.0%) | 18 (2.3%) |
| 1 Vehicle | 162 (20.1%) | 195 (24.6%) |
| 2 Vehicles | 377 (46.7%) | 336 (42.4%) |
| 3 Vehicles | 166 (20.6%) | 109 (13.8%) |
| 4 Vehicles | 36 (4.5%) | 105 (13.2%) |
| 5 or more Vehicles | 66 (8.2%) | 30 (3.8%) |
| Total | 807 (100.0%) | 793 (100.0%) |
Commute Time in Penuelas
The most frequently occuring commute durations in Penuelas are 10 to 14 minutes (351 commuters, 22.3%), 20 to 24 minutes (292 commuters, 18.6%), and 30 to 34 minutes (285 commuters, 18.1%).
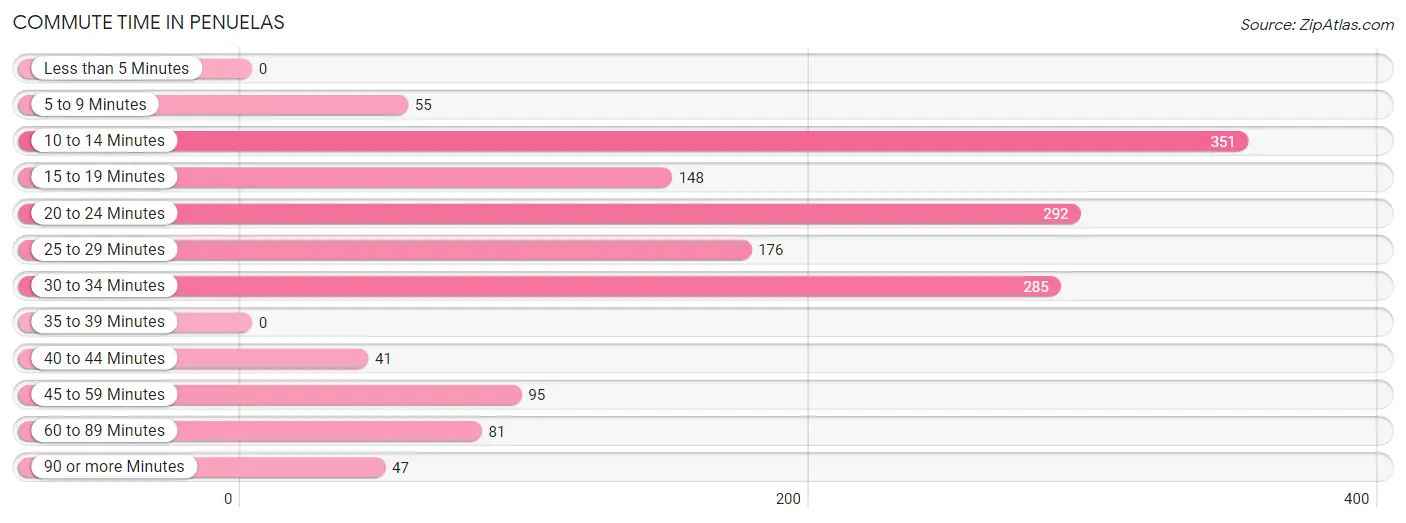
| Commute Time | # Commuters | % Commuters |
| Less than 5 Minutes | 0 | 0.0% |
| 5 to 9 Minutes | 55 | 3.5% |
| 10 to 14 Minutes | 351 | 22.3% |
| 15 to 19 Minutes | 148 | 9.4% |
| 20 to 24 Minutes | 292 | 18.6% |
| 25 to 29 Minutes | 176 | 11.2% |
| 30 to 34 Minutes | 285 | 18.1% |
| 35 to 39 Minutes | 0 | 0.0% |
| 40 to 44 Minutes | 41 | 2.6% |
| 45 to 59 Minutes | 95 | 6.0% |
| 60 to 89 Minutes | 81 | 5.2% |
| 90 or more Minutes | 47 | 3.0% |
Commute Time by Sex in Penuelas
The most common commute times in Penuelas are 10 to 14 minutes (209 commuters, 26.9%) for males and 30 to 34 minutes (233 commuters, 29.4%) for females.
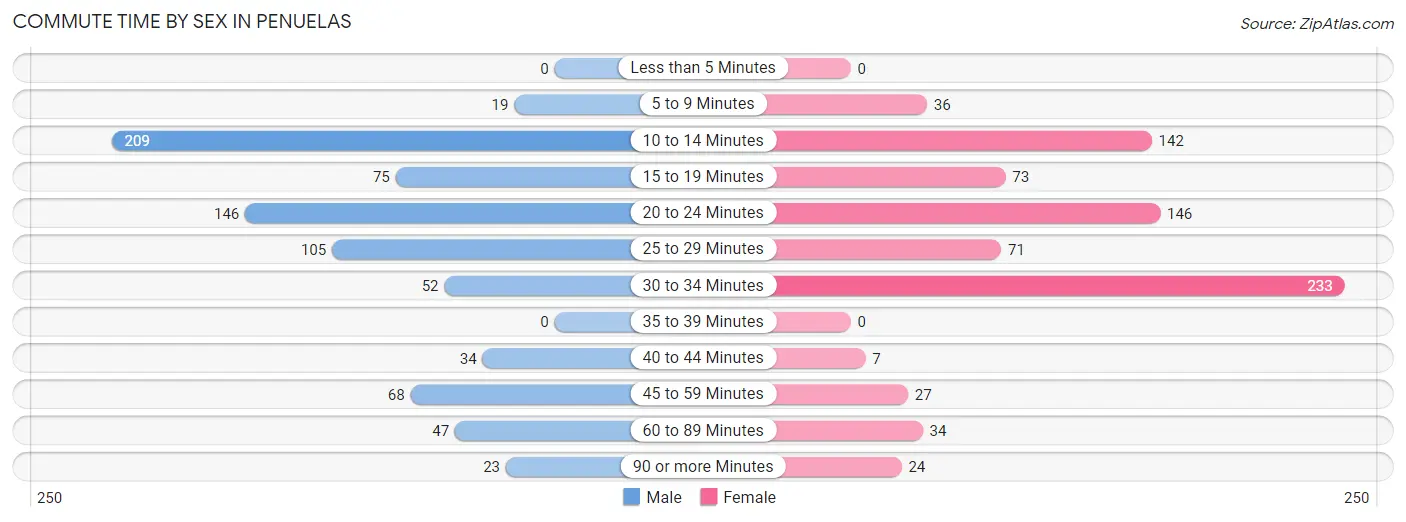
| Commute Time | Male | Female |
| Less than 5 Minutes | 0 (0.0%) | 0 (0.0%) |
| 5 to 9 Minutes | 19 (2.4%) | 36 (4.5%) |
| 10 to 14 Minutes | 209 (26.9%) | 142 (17.9%) |
| 15 to 19 Minutes | 75 (9.6%) | 73 (9.2%) |
| 20 to 24 Minutes | 146 (18.8%) | 146 (18.4%) |
| 25 to 29 Minutes | 105 (13.5%) | 71 (8.9%) |
| 30 to 34 Minutes | 52 (6.7%) | 233 (29.4%) |
| 35 to 39 Minutes | 0 (0.0%) | 0 (0.0%) |
| 40 to 44 Minutes | 34 (4.4%) | 7 (0.9%) |
| 45 to 59 Minutes | 68 (8.7%) | 27 (3.4%) |
| 60 to 89 Minutes | 47 (6.0%) | 34 (4.3%) |
| 90 or more Minutes | 23 (3.0%) | 24 (3.0%) |
Time of Departure to Work by Sex in Penuelas
The most frequent times of departure to work in Penuelas are 7:00 AM to 7:29 AM (258, 33.2%) for males and 7:30 AM to 7:59 AM (213, 26.9%) for females.
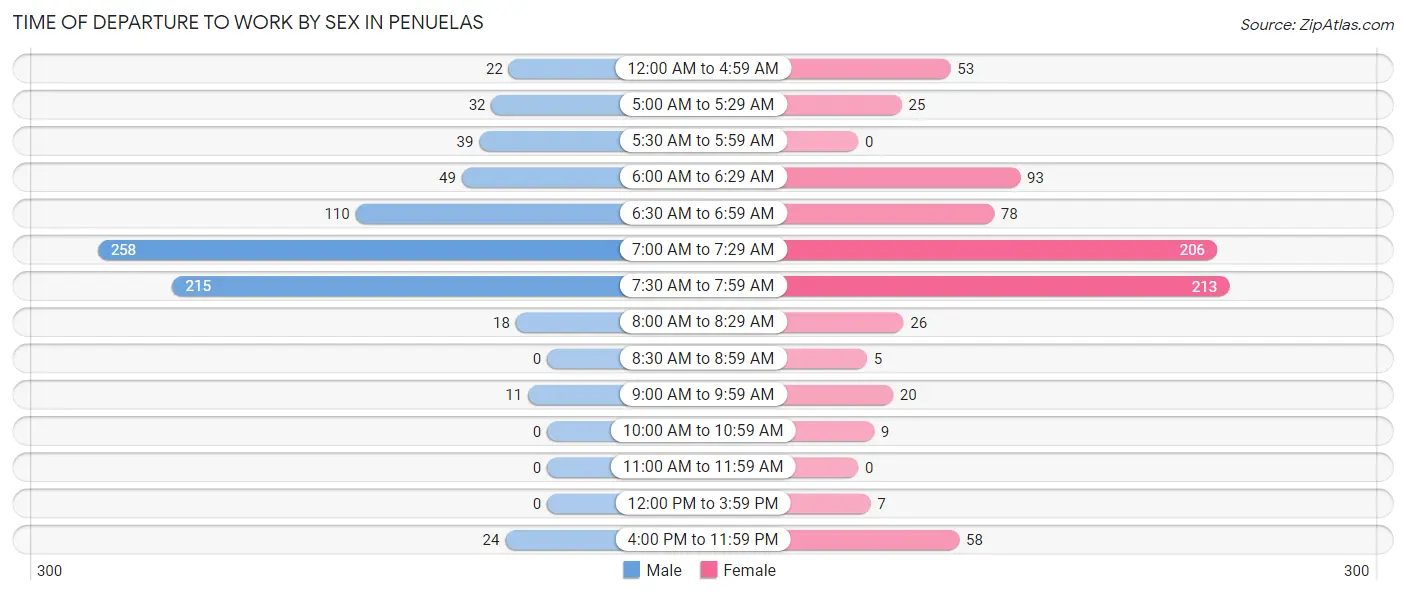
| Time of Departure | Male | Female |
| 12:00 AM to 4:59 AM | 22 (2.8%) | 53 (6.7%) |
| 5:00 AM to 5:29 AM | 32 (4.1%) | 25 (3.2%) |
| 5:30 AM to 5:59 AM | 39 (5.0%) | 0 (0.0%) |
| 6:00 AM to 6:29 AM | 49 (6.3%) | 93 (11.7%) |
| 6:30 AM to 6:59 AM | 110 (14.1%) | 78 (9.8%) |
| 7:00 AM to 7:29 AM | 258 (33.2%) | 206 (26.0%) |
| 7:30 AM to 7:59 AM | 215 (27.6%) | 213 (26.9%) |
| 8:00 AM to 8:29 AM | 18 (2.3%) | 26 (3.3%) |
| 8:30 AM to 8:59 AM | 0 (0.0%) | 5 (0.6%) |
| 9:00 AM to 9:59 AM | 11 (1.4%) | 20 (2.5%) |
| 10:00 AM to 10:59 AM | 0 (0.0%) | 9 (1.1%) |
| 11:00 AM to 11:59 AM | 0 (0.0%) | 0 (0.0%) |
| 12:00 PM to 3:59 PM | 0 (0.0%) | 7 (0.9%) |
| 4:00 PM to 11:59 PM | 24 (3.1%) | 58 (7.3%) |
| Total | 778 (100.0%) | 793 (100.0%) |
Housing Occupancy in Penuelas
Occupancy by Ownership in Penuelas
Of the total 1,788 dwellings in Penuelas, owner-occupied units account for 1,225 (68.5%), while renter-occupied units make up 563 (31.5%).
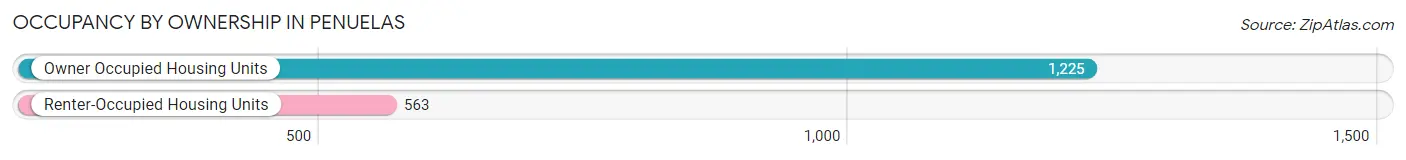
| Occupancy | # Housing Units | % Housing Units |
| Owner Occupied Housing Units | 1,225 | 68.5% |
| Renter-Occupied Housing Units | 563 | 31.5% |
| Total Occupied Housing Units | 1,788 | 100.0% |
Occupancy by Household Size in Penuelas
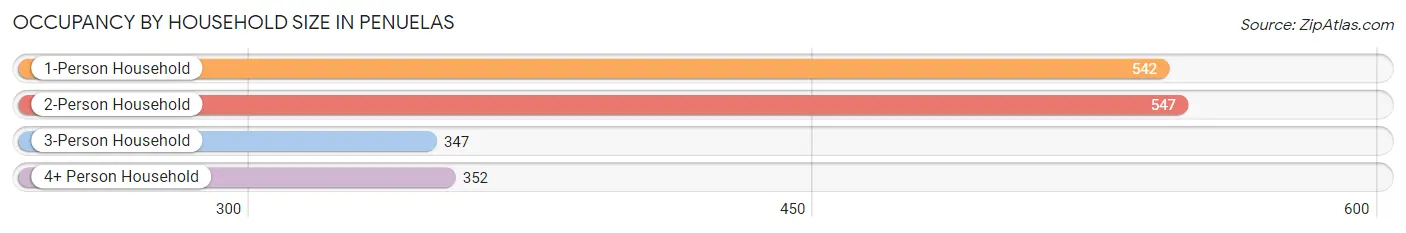
| Household Size | # Housing Units | % Housing Units |
| 1-Person Household | 542 | 30.3% |
| 2-Person Household | 547 | 30.6% |
| 3-Person Household | 347 | 19.4% |
| 4+ Person Household | 352 | 19.7% |
| Total Housing Units | 1,788 | 100.0% |
Occupancy by Ownership by Household Size in Penuelas
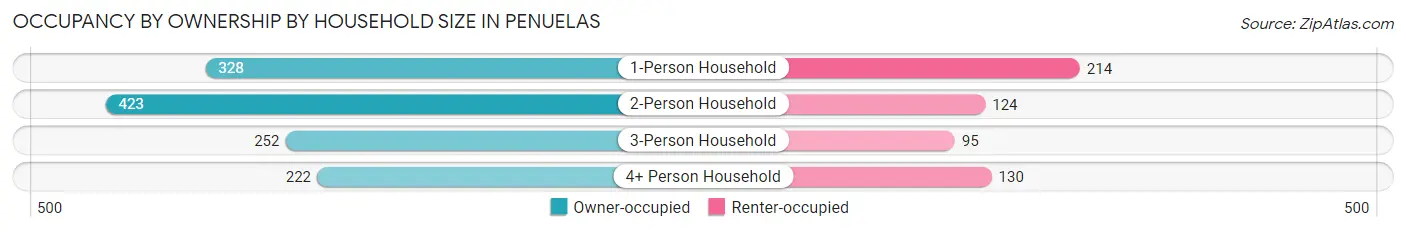
| Household Size | Owner-occupied | Renter-occupied |
| 1-Person Household | 328 (60.5%) | 214 (39.5%) |
| 2-Person Household | 423 (77.3%) | 124 (22.7%) |
| 3-Person Household | 252 (72.6%) | 95 (27.4%) |
| 4+ Person Household | 222 (63.1%) | 130 (36.9%) |
| Total Housing Units | 1,225 (68.5%) | 563 (31.5%) |
Occupancy by Educational Attainment in Penuelas
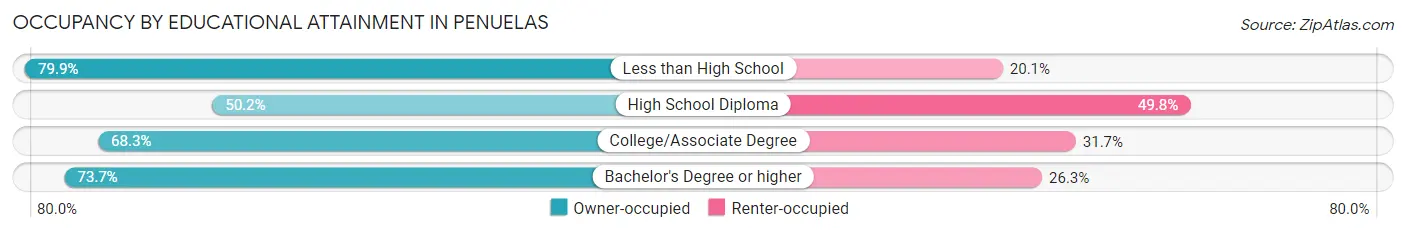
| Household Size | Owner-occupied | Renter-occupied |
| Less than High School | 362 (79.9%) | 91 (20.1%) |
| High School Diploma | 224 (50.2%) | 222 (49.8%) |
| College/Associate Degree | 205 (68.3%) | 95 (31.7%) |
| Bachelor's Degree or higher | 434 (73.7%) | 155 (26.3%) |
Occupancy by Age of Householder in Penuelas
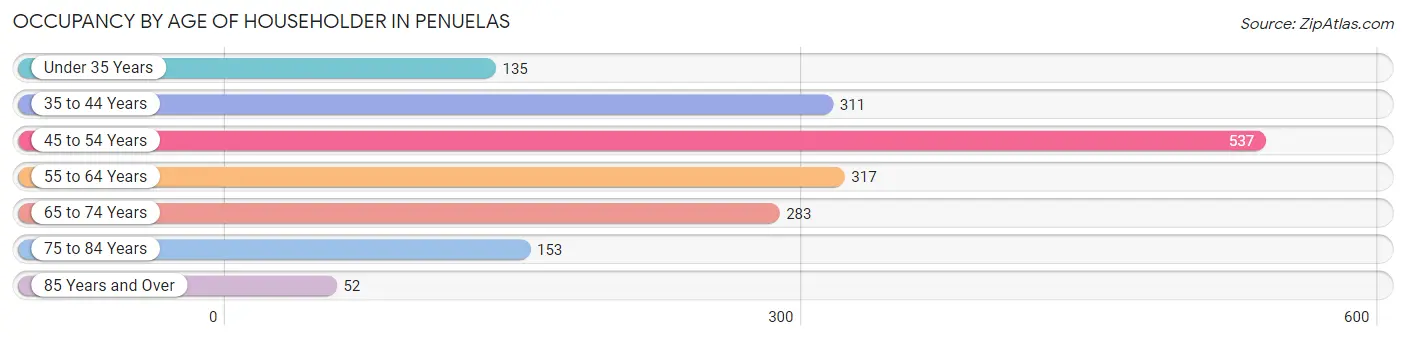
| Age Bracket | # Households | % Households |
| Under 35 Years | 135 | 7.5% |
| 35 to 44 Years | 311 | 17.4% |
| 45 to 54 Years | 537 | 30.0% |
| 55 to 64 Years | 317 | 17.7% |
| 65 to 74 Years | 283 | 15.8% |
| 75 to 84 Years | 153 | 8.6% |
| 85 Years and Over | 52 | 2.9% |
| Total | 1,788 | 100.0% |
Housing Finances in Penuelas
Median Income by Occupancy in Penuelas
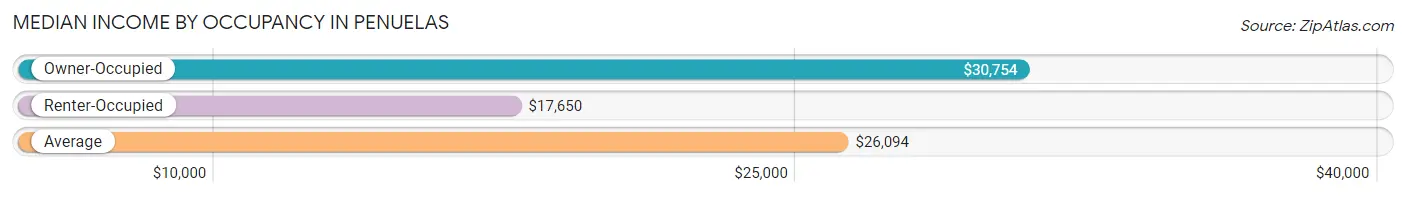
| Occupancy Type | # Households | Median Income |
| Owner-Occupied | 1,225 (68.5%) | $30,754 |
| Renter-Occupied | 563 (31.5%) | $17,650 |
| Average | 1,788 (100.0%) | $26,094 |
Occupancy by Householder Income Bracket in Penuelas
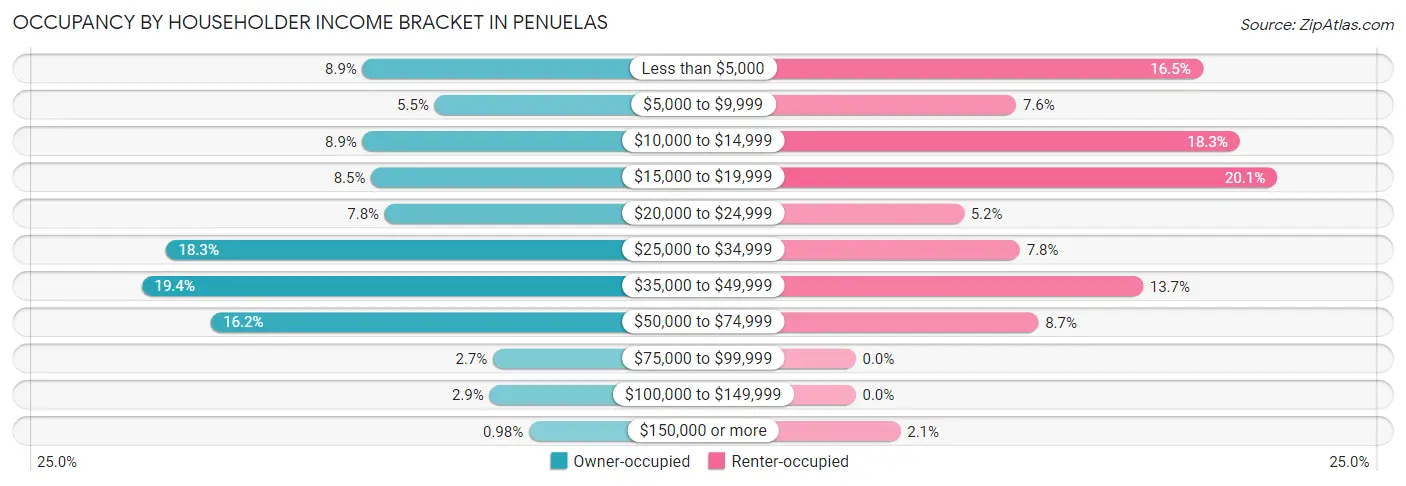
| Income Bracket | Owner-occupied | Renter-occupied |
| Less than $5,000 | 109 (8.9%) | 93 (16.5%) |
| $5,000 to $9,999 | 67 (5.5%) | 43 (7.6%) |
| $10,000 to $14,999 | 109 (8.9%) | 103 (18.3%) |
| $15,000 to $19,999 | 104 (8.5%) | 113 (20.1%) |
| $20,000 to $24,999 | 96 (7.8%) | 29 (5.1%) |
| $25,000 to $34,999 | 224 (18.3%) | 44 (7.8%) |
| $35,000 to $49,999 | 238 (19.4%) | 77 (13.7%) |
| $50,000 to $74,999 | 198 (16.2%) | 49 (8.7%) |
| $75,000 to $99,999 | 33 (2.7%) | 0 (0.0%) |
| $100,000 to $149,999 | 35 (2.9%) | 0 (0.0%) |
| $150,000 or more | 12 (1.0%) | 12 (2.1%) |
| Total | 1,225 (100.0%) | 563 (100.0%) |
Monthly Housing Cost Tiers in Penuelas
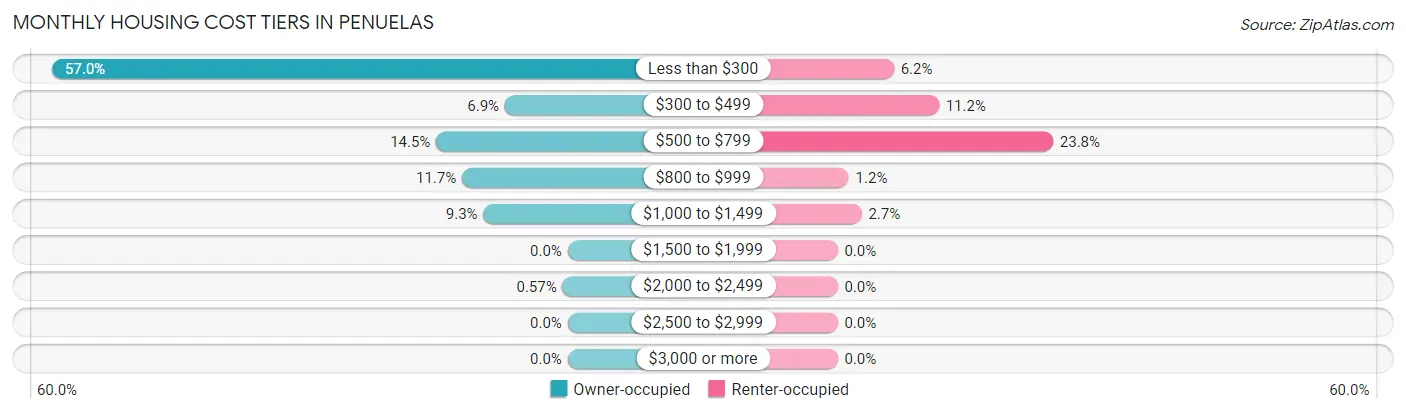
| Monthly Cost | Owner-occupied | Renter-occupied |
| Less than $300 | 698 (57.0%) | 35 (6.2%) |
| $300 to $499 | 85 (6.9%) | 63 (11.2%) |
| $500 to $799 | 178 (14.5%) | 134 (23.8%) |
| $800 to $999 | 143 (11.7%) | 7 (1.2%) |
| $1,000 to $1,499 | 114 (9.3%) | 15 (2.7%) |
| $1,500 to $1,999 | 0 (0.0%) | 0 (0.0%) |
| $2,000 to $2,499 | 7 (0.6%) | 0 (0.0%) |
| $2,500 to $2,999 | 0 (0.0%) | 0 (0.0%) |
| $3,000 or more | 0 (0.0%) | 0 (0.0%) |
| Total | 1,225 (100.0%) | 563 (100.0%) |
Physical Housing Characteristics in Penuelas
Housing Structures in Penuelas
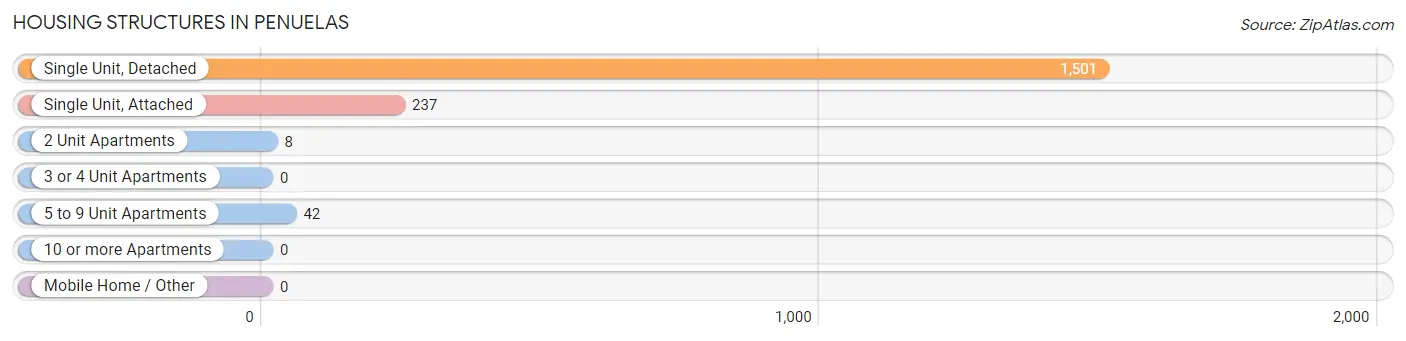
| Structure Type | # Housing Units | % Housing Units |
| Single Unit, Detached | 1,501 | 84.0% |
| Single Unit, Attached | 237 | 13.3% |
| 2 Unit Apartments | 8 | 0.4% |
| 3 or 4 Unit Apartments | 0 | 0.0% |
| 5 to 9 Unit Apartments | 42 | 2.4% |
| 10 or more Apartments | 0 | 0.0% |
| Mobile Home / Other | 0 | 0.0% |
| Total | 1,788 | 100.0% |
Housing Structures by Occupancy in Penuelas
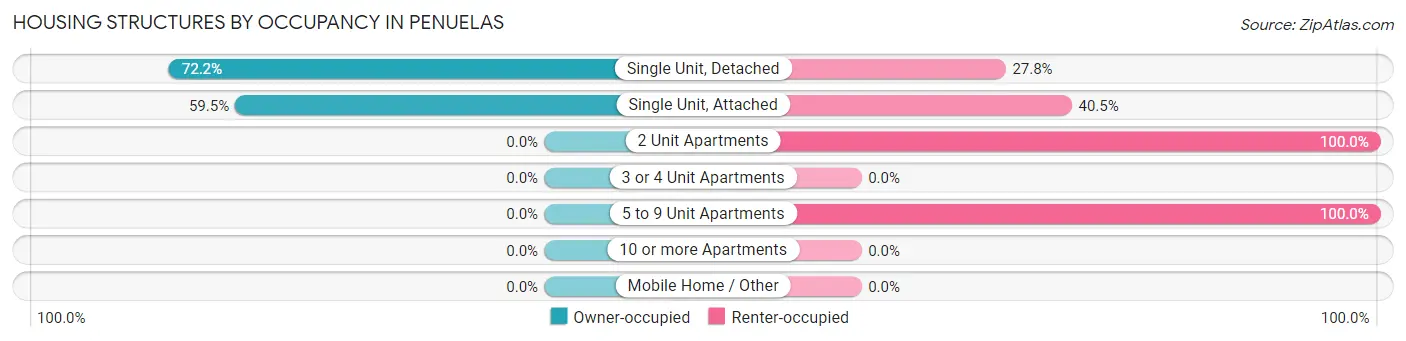
| Structure Type | Owner-occupied | Renter-occupied |
| Single Unit, Detached | 1,084 (72.2%) | 417 (27.8%) |
| Single Unit, Attached | 141 (59.5%) | 96 (40.5%) |
| 2 Unit Apartments | 0 (0.0%) | 8 (100.0%) |
| 3 or 4 Unit Apartments | 0 (0.0%) | 0 (0.0%) |
| 5 to 9 Unit Apartments | 0 (0.0%) | 42 (100.0%) |
| 10 or more Apartments | 0 (0.0%) | 0 (0.0%) |
| Mobile Home / Other | 0 (0.0%) | 0 (0.0%) |
| Total | 1,225 (68.5%) | 563 (31.5%) |
Housing Structures by Number of Rooms in Penuelas
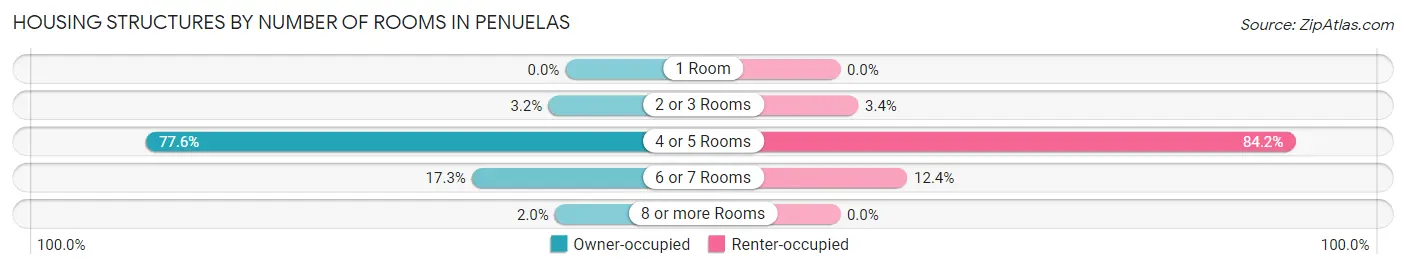
| Number of Rooms | Owner-occupied | Renter-occupied |
| 1 Room | 0 (0.0%) | 0 (0.0%) |
| 2 or 3 Rooms | 39 (3.2%) | 19 (3.4%) |
| 4 or 5 Rooms | 950 (77.5%) | 474 (84.2%) |
| 6 or 7 Rooms | 212 (17.3%) | 70 (12.4%) |
| 8 or more Rooms | 24 (2.0%) | 0 (0.0%) |
| Total | 1,225 (100.0%) | 563 (100.0%) |
Housing Structure by Heating Type in Penuelas
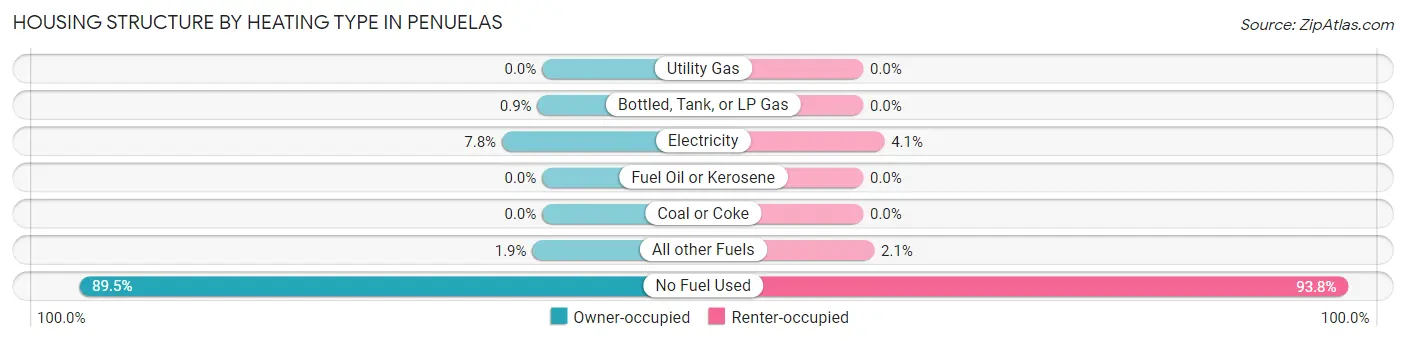
| Heating Type | Owner-occupied | Renter-occupied |
| Utility Gas | 0 (0.0%) | 0 (0.0%) |
| Bottled, Tank, or LP Gas | 11 (0.9%) | 0 (0.0%) |
| Electricity | 95 (7.8%) | 23 (4.1%) |
| Fuel Oil or Kerosene | 0 (0.0%) | 0 (0.0%) |
| Coal or Coke | 0 (0.0%) | 0 (0.0%) |
| All other Fuels | 23 (1.9%) | 12 (2.1%) |
| No Fuel Used | 1,096 (89.5%) | 528 (93.8%) |
| Total | 1,225 (100.0%) | 563 (100.0%) |
Household Vehicle Usage in Penuelas
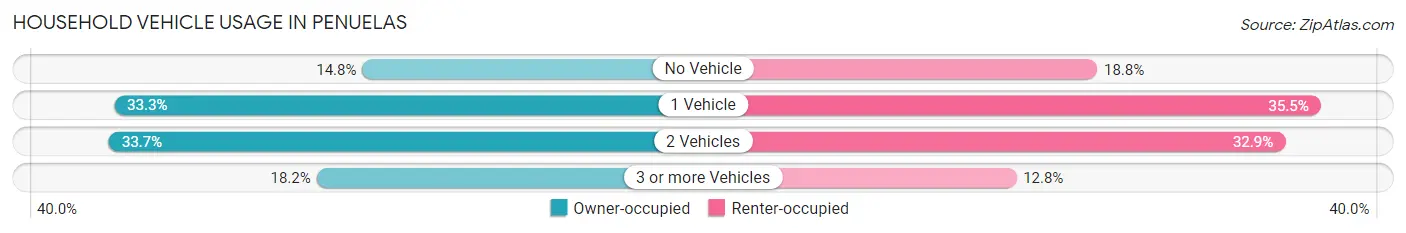
| Vehicles per Household | Owner-occupied | Renter-occupied |
| No Vehicle | 181 (14.8%) | 106 (18.8%) |
| 1 Vehicle | 408 (33.3%) | 200 (35.5%) |
| 2 Vehicles | 413 (33.7%) | 185 (32.9%) |
| 3 or more Vehicles | 223 (18.2%) | 72 (12.8%) |
| Total | 1,225 (100.0%) | 563 (100.0%) |
Real Estate & Mortgages in Penuelas
Real Estate and Mortgage Overview in Penuelas
| Characteristic | Without Mortgage | With Mortgage |
| Housing Units | 740 | 485 |
| Median Property Value | $70,700 | $119,500 |
| Median Household Income | $20,852 | $12 |
| Monthly Housing Costs | $160 | $0 |
| Real Estate Taxes | - | - |
Property Value by Mortgage Status in Penuelas
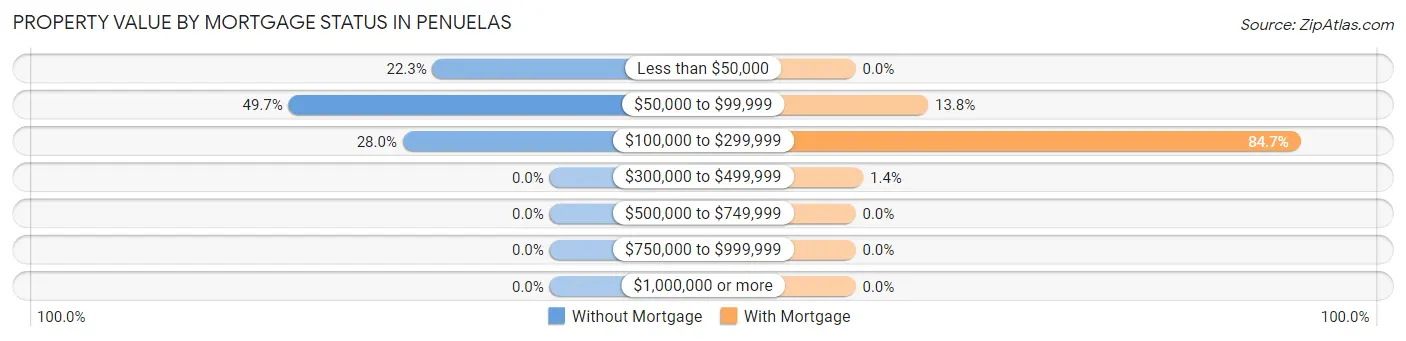
| Property Value | Without Mortgage | With Mortgage |
| Less than $50,000 | 165 (22.3%) | 0 (0.0%) |
| $50,000 to $99,999 | 368 (49.7%) | 67 (13.8%) |
| $100,000 to $299,999 | 207 (28.0%) | 411 (84.7%) |
| $300,000 to $499,999 | 0 (0.0%) | 7 (1.4%) |
| $500,000 to $749,999 | 0 (0.0%) | 0 (0.0%) |
| $750,000 to $999,999 | 0 (0.0%) | 0 (0.0%) |
| $1,000,000 or more | 0 (0.0%) | 0 (0.0%) |
| Total | 740 (100.0%) | 485 (100.0%) |
Household Income by Mortgage Status in Penuelas
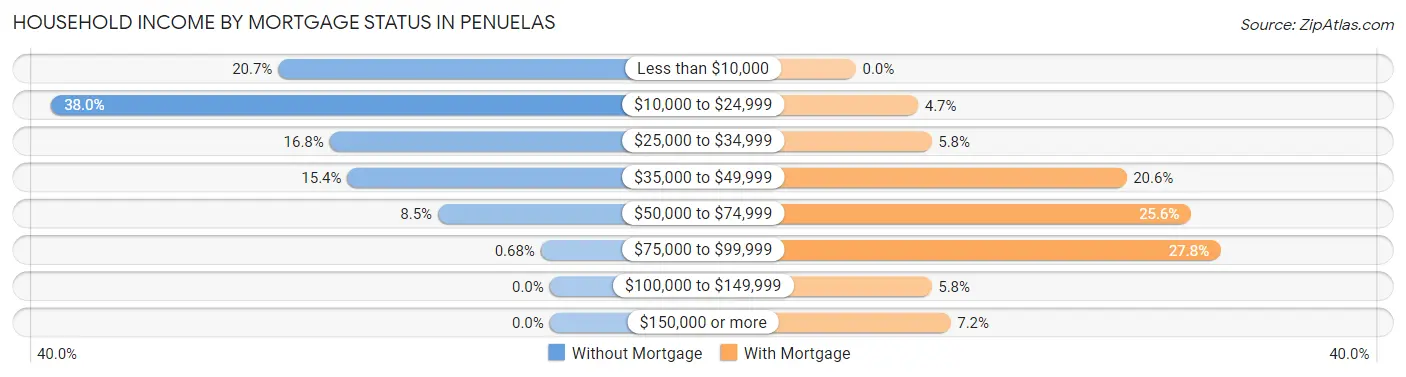
| Household Income | Without Mortgage | With Mortgage |
| Less than $10,000 | 153 (20.7%) | 0 (0.0%) |
| $10,000 to $24,999 | 281 (38.0%) | 23 (4.7%) |
| $25,000 to $34,999 | 124 (16.8%) | 28 (5.8%) |
| $35,000 to $49,999 | 114 (15.4%) | 100 (20.6%) |
| $50,000 to $74,999 | 63 (8.5%) | 124 (25.6%) |
| $75,000 to $99,999 | 5 (0.7%) | 135 (27.8%) |
| $100,000 to $149,999 | 0 (0.0%) | 28 (5.8%) |
| $150,000 or more | 0 (0.0%) | 35 (7.2%) |
| Total | 740 (100.0%) | 485 (100.0%) |
Property Value to Household Income Ratio in Penuelas
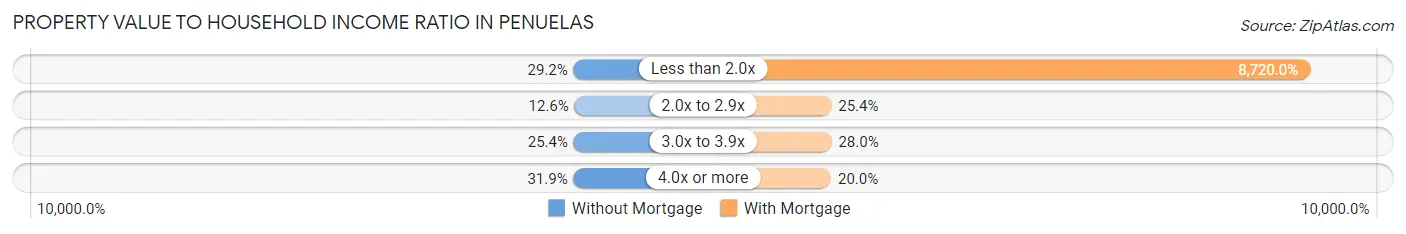
| Value-to-Income Ratio | Without Mortgage | With Mortgage |
| Less than 2.0x | 216 (29.2%) | 42,292 (8,720.0%) |
| 2.0x to 2.9x | 93 (12.6%) | 123 (25.4%) |
| 3.0x to 3.9x | 188 (25.4%) | 136 (28.0%) |
| 4.0x or more | 236 (31.9%) | 97 (20.0%) |
| Total | 740 (100.0%) | 485 (100.0%) |
Real Estate Taxes by Mortgage Status in Penuelas
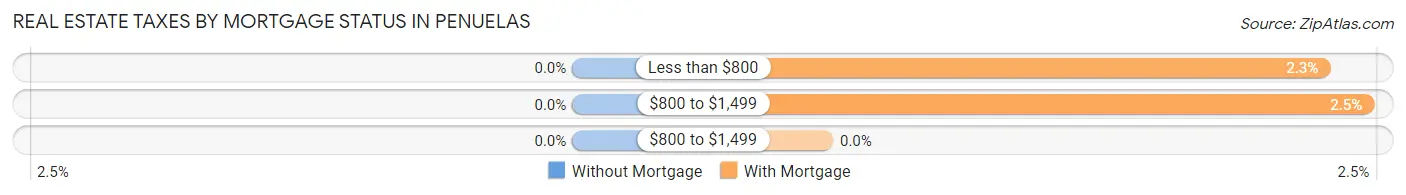
| Property Taxes | Without Mortgage | With Mortgage |
| Less than $800 | 0 (0.0%) | 11 (2.3%) |
| $800 to $1,499 | 0 (0.0%) | 12 (2.5%) |
| $800 to $1,499 | 0 (0.0%) | 0 (0.0%) |
| Total | 740 (100.0%) | 485 (100.0%) |
Health & Disability in Penuelas
Health Insurance Coverage by Age in Penuelas
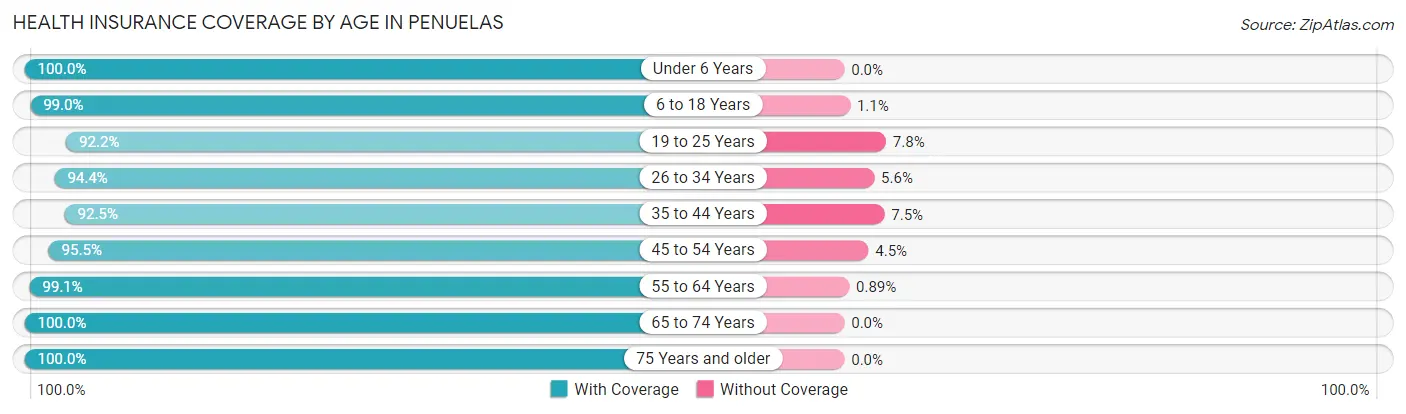
| Age Bracket | With Coverage | Without Coverage |
| Under 6 Years | 266 (100.0%) | 0 (0.0%) |
| 6 to 18 Years | 852 (99.0%) | 9 (1.1%) |
| 19 to 25 Years | 713 (92.2%) | 60 (7.8%) |
| 26 to 34 Years | 441 (94.4%) | 26 (5.6%) |
| 35 to 44 Years | 718 (92.5%) | 58 (7.5%) |
| 45 to 54 Years | 830 (95.5%) | 39 (4.5%) |
| 55 to 64 Years | 559 (99.1%) | 5 (0.9%) |
| 65 to 74 Years | 318 (100.0%) | 0 (0.0%) |
| 75 Years and older | 389 (100.0%) | 0 (0.0%) |
| Total | 5,086 (96.3%) | 197 (3.7%) |
Health Insurance Coverage by Citizenship Status in Penuelas
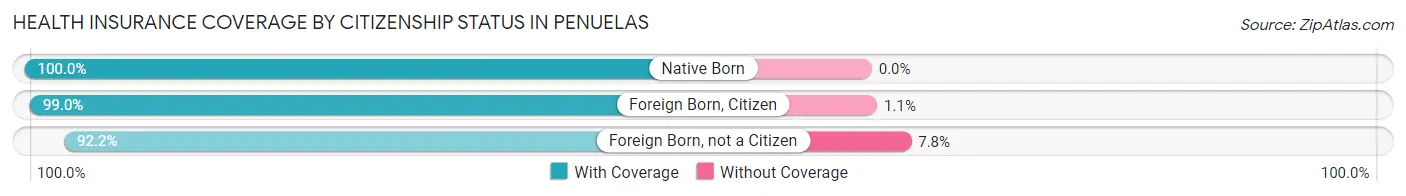
| Citizenship Status | With Coverage | Without Coverage |
| Native Born | 266 (100.0%) | 0 (0.0%) |
| Foreign Born, Citizen | 852 (99.0%) | 9 (1.1%) |
| Foreign Born, not a Citizen | 713 (92.2%) | 60 (7.8%) |
Health Insurance Coverage by Household Income in Penuelas
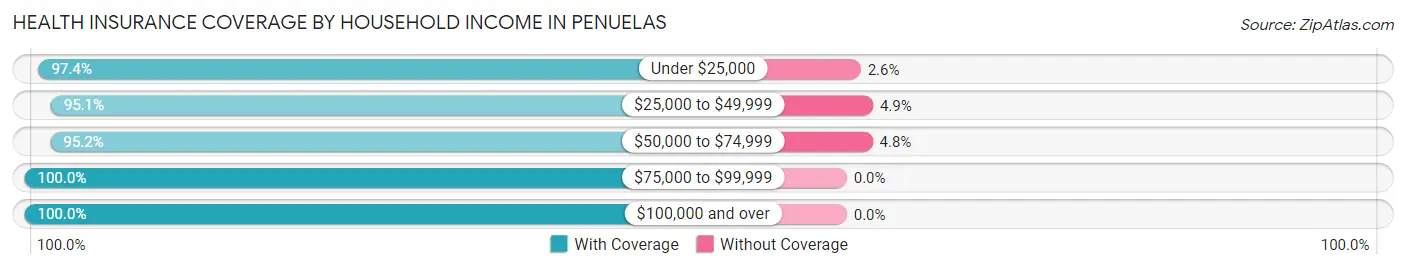
| Household Income | With Coverage | Without Coverage |
| Under $25,000 | 1,976 (97.4%) | 53 (2.6%) |
| $25,000 to $49,999 | 1,764 (95.1%) | 91 (4.9%) |
| $50,000 to $74,999 | 1,041 (95.2%) | 53 (4.8%) |
| $75,000 to $99,999 | 114 (100.0%) | 0 (0.0%) |
| $100,000 and over | 188 (100.0%) | 0 (0.0%) |
Public vs Private Health Insurance Coverage by Age in Penuelas
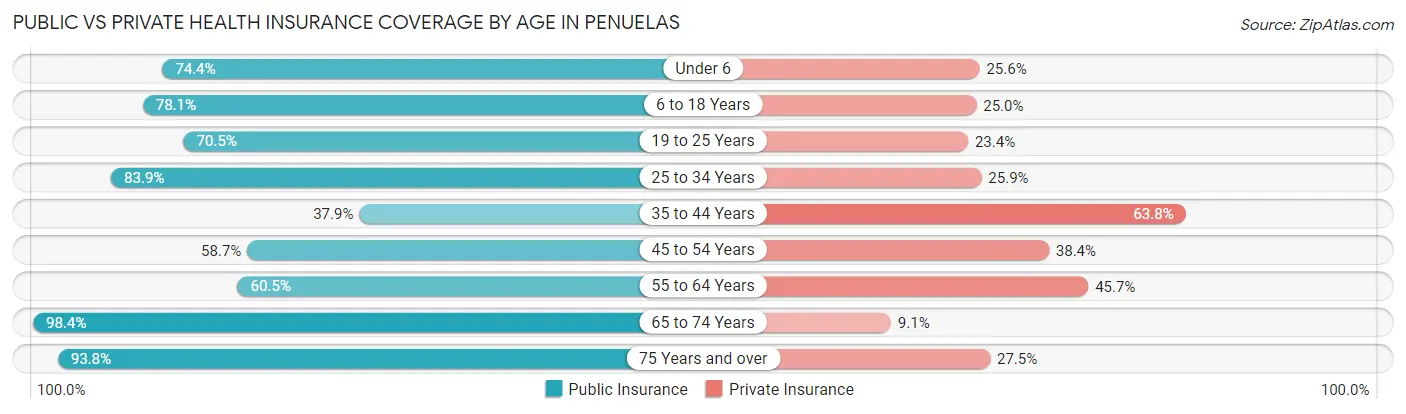
| Age Bracket | Public Insurance | Private Insurance |
| Under 6 | 198 (74.4%) | 68 (25.6%) |
| 6 to 18 Years | 672 (78.0%) | 215 (25.0%) |
| 19 to 25 Years | 545 (70.5%) | 181 (23.4%) |
| 25 to 34 Years | 392 (83.9%) | 121 (25.9%) |
| 35 to 44 Years | 294 (37.9%) | 495 (63.8%) |
| 45 to 54 Years | 510 (58.7%) | 334 (38.4%) |
| 55 to 64 Years | 341 (60.5%) | 258 (45.7%) |
| 65 to 74 Years | 313 (98.4%) | 29 (9.1%) |
| 75 Years and over | 365 (93.8%) | 107 (27.5%) |
| Total | 3,630 (68.7%) | 1,808 (34.2%) |
Disability Status by Sex by Age in Penuelas
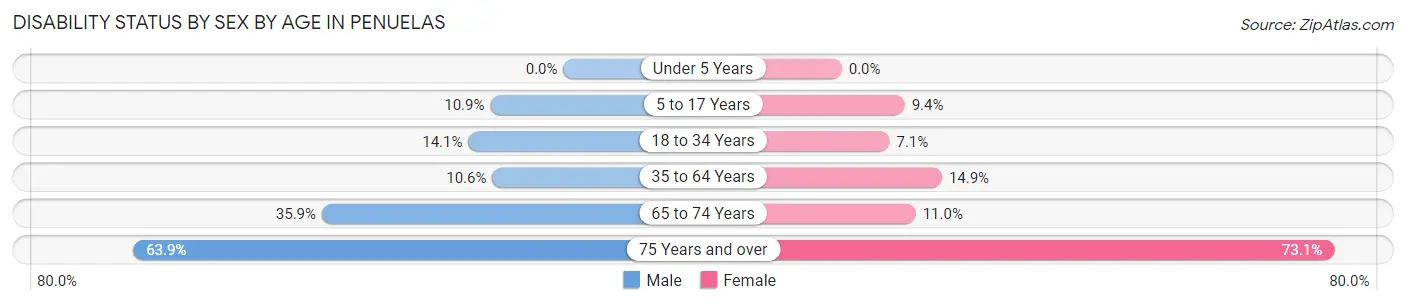
| Age Bracket | Male | Female |
| Under 5 Years | 0 (0.0%) | 0 (0.0%) |
| 5 to 17 Years | 47 (10.8%) | 42 (9.3%) |
| 18 to 34 Years | 81 (14.1%) | 49 (7.1%) |
| 35 to 64 Years | 99 (10.5%) | 189 (14.9%) |
| 65 to 74 Years | 52 (35.9%) | 19 (11.0%) |
| 75 Years and over | 99 (63.9%) | 171 (73.1%) |
Disability Class by Sex by Age in Penuelas
Disability Class: Hearing Difficulty
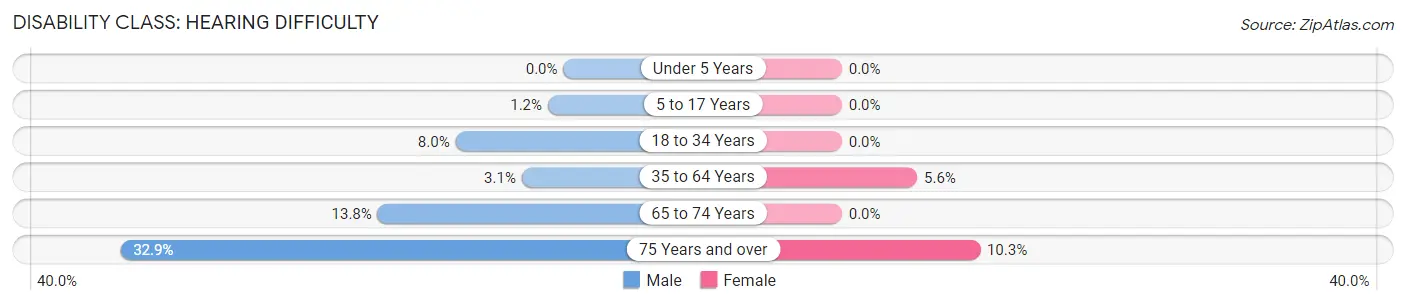
| Age Bracket | Male | Female |
| Under 5 Years | 0 (0.0%) | 0 (0.0%) |
| 5 to 17 Years | 5 (1.1%) | 0 (0.0%) |
| 18 to 34 Years | 46 (8.0%) | 0 (0.0%) |
| 35 to 64 Years | 29 (3.1%) | 71 (5.6%) |
| 65 to 74 Years | 20 (13.8%) | 0 (0.0%) |
| 75 Years and over | 51 (32.9%) | 24 (10.3%) |
Disability Class: Vision Difficulty
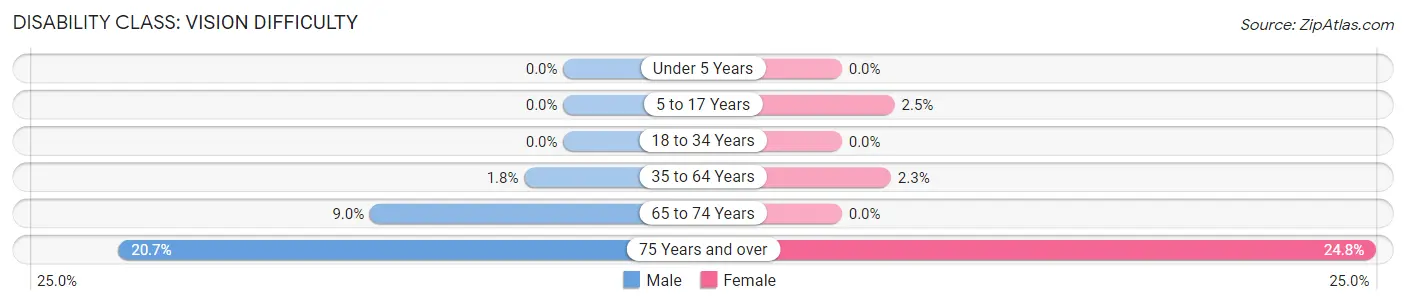
| Age Bracket | Male | Female |
| Under 5 Years | 0 (0.0%) | 0 (0.0%) |
| 5 to 17 Years | 0 (0.0%) | 11 (2.5%) |
| 18 to 34 Years | 0 (0.0%) | 0 (0.0%) |
| 35 to 64 Years | 17 (1.8%) | 29 (2.3%) |
| 65 to 74 Years | 13 (9.0%) | 0 (0.0%) |
| 75 Years and over | 32 (20.6%) | 58 (24.8%) |
Disability Class: Cognitive Difficulty
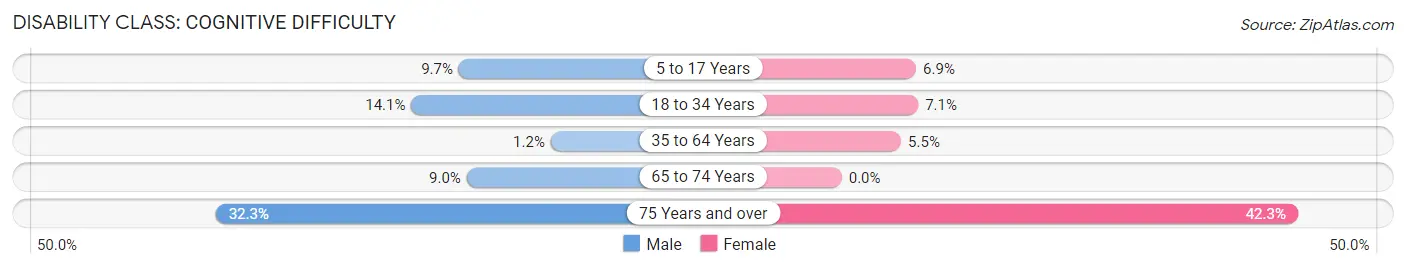
| Age Bracket | Male | Female |
| 5 to 17 Years | 42 (9.7%) | 31 (6.9%) |
| 18 to 34 Years | 81 (14.1%) | 49 (7.1%) |
| 35 to 64 Years | 11 (1.2%) | 70 (5.5%) |
| 65 to 74 Years | 13 (9.0%) | 0 (0.0%) |
| 75 Years and over | 50 (32.3%) | 99 (42.3%) |
Disability Class: Ambulatory Difficulty
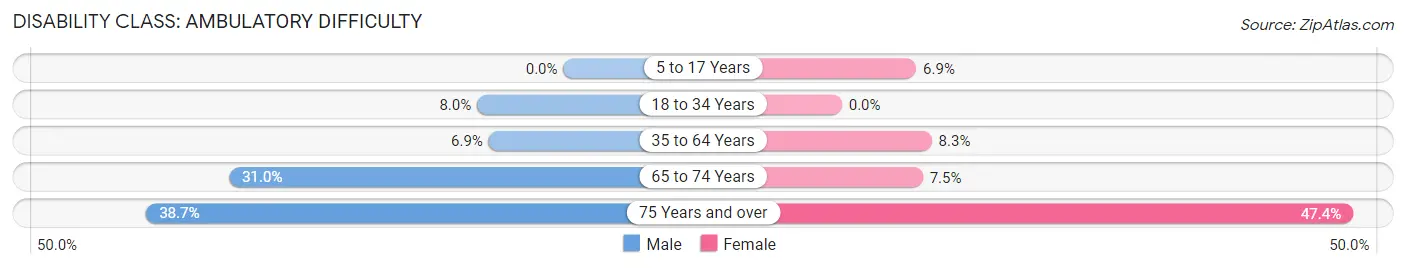
| Age Bracket | Male | Female |
| 5 to 17 Years | 0 (0.0%) | 31 (6.9%) |
| 18 to 34 Years | 46 (8.0%) | 0 (0.0%) |
| 35 to 64 Years | 65 (6.9%) | 106 (8.3%) |
| 65 to 74 Years | 45 (31.0%) | 13 (7.5%) |
| 75 Years and over | 60 (38.7%) | 111 (47.4%) |
Disability Class: Self-Care Difficulty
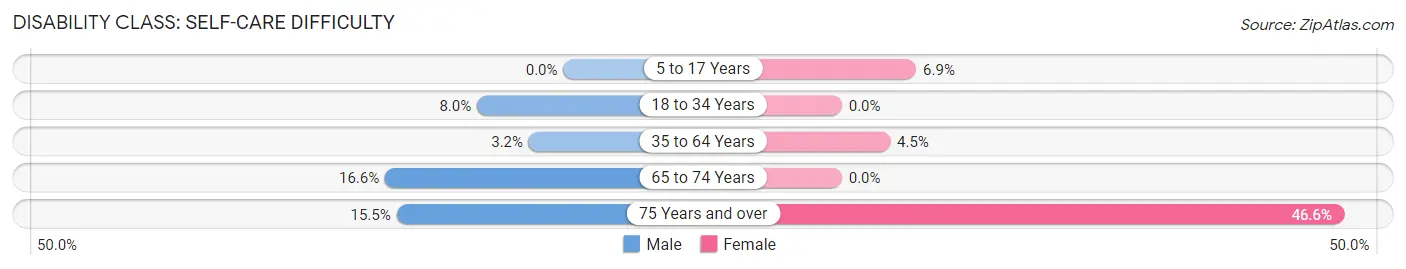
| Age Bracket | Male | Female |
| 5 to 17 Years | 0 (0.0%) | 31 (6.9%) |
| 18 to 34 Years | 46 (8.0%) | 0 (0.0%) |
| 35 to 64 Years | 30 (3.2%) | 57 (4.5%) |
| 65 to 74 Years | 24 (16.6%) | 0 (0.0%) |
| 75 Years and over | 24 (15.5%) | 109 (46.6%) |
Technology Access in Penuelas
Computing Device Access in Penuelas
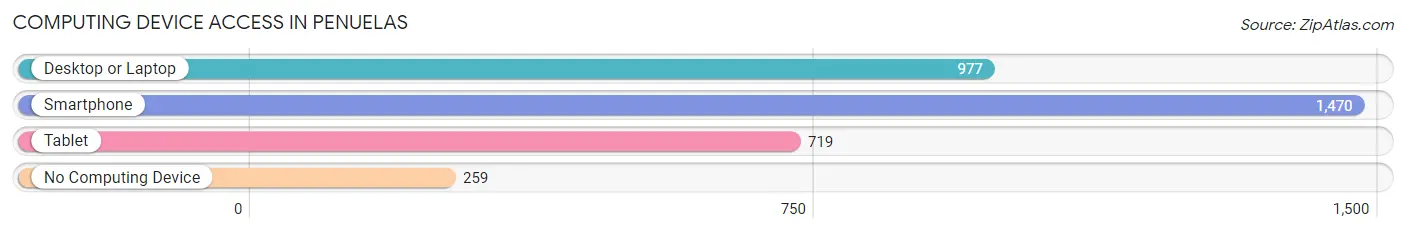
| Device Type | # Households | % Households |
| Desktop or Laptop | 977 | 54.6% |
| Smartphone | 1,470 | 82.2% |
| Tablet | 719 | 40.2% |
| No Computing Device | 259 | 14.5% |
| Total | 1,788 | 100.0% |
Internet Access in Penuelas
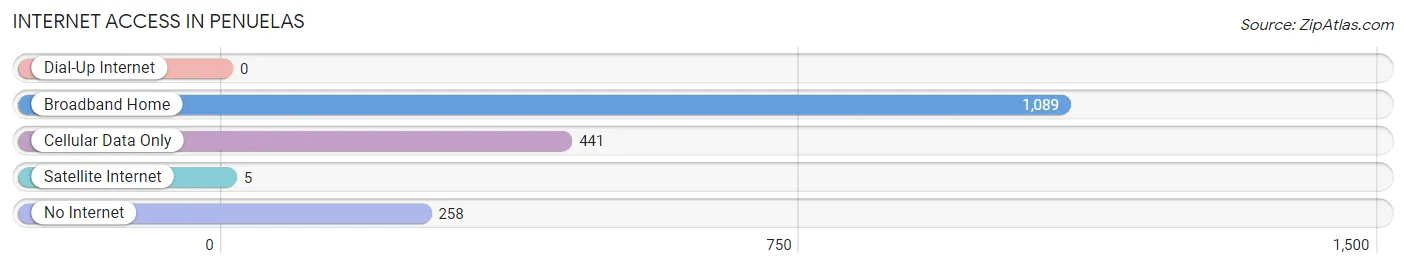
| Internet Type | # Households | % Households |
| Dial-Up Internet | 0 | 0.0% |
| Broadband Home | 1,089 | 60.9% |
| Cellular Data Only | 441 | 24.7% |
| Satellite Internet | 5 | 0.3% |
| No Internet | 258 | 14.4% |
| Total | 1,788 | 100.0% |
Penuelas Summary
History
Penuelas, Puerto Rico is a small municipality located in the southwestern region of the island. It is bordered by the municipalities of Guayanilla, Ponce, and Juana Diaz. The town was founded in 1815 by Don Juan de Penuelas, a Spanish soldier who was stationed in the area. The town was originally called San Juan de Penuelas, but the name was later changed to Penuelas.
Penuelas has a rich history that dates back to the 16th century. The area was originally inhabited by the Taino Indians, who were the first inhabitants of Puerto Rico. The Taino Indians were eventually displaced by the Spanish, who began to settle the area in the early 1500s. The Spanish brought with them their culture, language, and religion, which still remain in Penuelas today.
In the late 1700s, Penuelas was a thriving agricultural community. The town was known for its production of sugar cane, coffee, and tobacco. During this time, the town also became a center for trade and commerce.
In the 19th century, Penuelas experienced a period of economic growth and development. The town was home to several factories, including a sugar mill, a tobacco factory, and a coffee mill. The town also had a thriving port, which was used to export goods to other parts of the island and to the mainland.
In the 20th century, Penuelas experienced a period of decline. The town’s economy was heavily impacted by the Great Depression and World War II. The town’s population decreased significantly during this time, and many of the factories and businesses closed.
In the late 20th century, Penuelas began to experience a period of economic revitalization. The town’s economy was bolstered by the construction of a new port and the development of tourism. Today, Penuelas is a vibrant and thriving community.
Geography
Penuelas is located in the southwestern region of Puerto Rico. The town is bordered by the municipalities of Guayanilla, Ponce, and Juana Diaz. The town is situated on the Caribbean Sea and is surrounded by lush tropical forests.
The town is divided into two main sections: the urban area and the rural area. The urban area is located in the center of the town and is home to most of the town’s businesses and government buildings. The rural area is located on the outskirts of the town and is home to most of the town’s agricultural land.
The town is located in a tropical climate, with temperatures ranging from the mid-70s to the mid-90s. The town receives an average of 60 inches of rain per year.
Economy
Penuelas’ economy is largely based on agriculture and tourism. The town is home to several large farms, which produce a variety of crops, including sugar cane, coffee, and tobacco. The town also has a thriving fishing industry, which provides fresh seafood to the local restaurants and markets.
The town is also home to several small businesses, including restaurants, shops, and hotels. The town’s port is also an important part of the local economy, as it is used to export goods to other parts of the island and to the mainland.
Demographics
As of the 2010 census, Penuelas had a population of 11,845. The town’s population is largely of Hispanic descent, with a small percentage of African-American and other ethnicities. The town’s population is also largely Catholic, with a small percentage of other religious affiliations.
The town’s median household income is $17,845, which is lower than the national average. The town’s poverty rate is also higher than the national average, with 28.3% of the population living below the poverty line.
Conclusion
Penuelas, Puerto Rico is a small municipality located in the southwestern region of the island. The town has a rich history that dates back to the 16th century and is home to a vibrant and thriving community. The town’s economy is largely based on agriculture and tourism, and the town’s population is largely of Hispanic descent. Penuelas is a vibrant and thriving community that is an important part of Puerto Rico’s history and culture.
Common Questions
What is Per Capita Income in Penuelas?
Per Capita income in Penuelas is $13,321.
What is the Median Family Income in Penuelas?
Median Family Income in Penuelas is $30,683.
What is the Median Household income in Penuelas?
Median Household Income in Penuelas is $26,094.
What is Income or Wage Gap in Penuelas?
Income or Wage Gap in Penuelas is 17.8%.
Women in Penuelas earn 82.2 cents for every dollar earned by a man.
What is Family Income Deficit in Penuelas?
Family Income Deficit in Penuelas is $10,032.
Families that are below poverty line in Penuelas earn $10,032 less on average than the poverty threshold level.
What is Inequality or Gini Index in Penuelas?
Inequality or Gini Index in Penuelas is 0.49.
What is the Total Population of Penuelas?
Total Population of Penuelas is 5,297.
What is the Total Male Population of Penuelas?
Total Male Population of Penuelas is 2,314.
What is the Total Female Population of Penuelas?
Total Female Population of Penuelas is 2,983.
What is the Ratio of Males per 100 Females in Penuelas?
There are 77.57 Males per 100 Females in Penuelas.
What is the Ratio of Females per 100 Males in Penuelas?
There are 128.91 Females per 100 Males in Penuelas.
What is the Median Population Age in Penuelas?
Median Population Age in Penuelas is 38.9 Years.
What is the Average Family Size in Penuelas
Average Family Size in Penuelas is 3.7 People.
What is the Average Household Size in Penuelas
Average Household Size in Penuelas is 3.0 People.
How Large is the Labor Force in Penuelas?
There are 1,865 People in the Labor Forcein in Penuelas.
What is the Percentage of People in the Labor Force in Penuelas?
42.6% of People are in the Labor Force in Penuelas.
What is the Unemployment Rate in Penuelas?
Unemployment Rate in Penuelas is 14.3%.