Corcovado, PR Map & Demographics
Corcovado Map
Corcovado Overview
$9,391
PER CAPITA INCOME
$24,015
AVG FAMILY INCOME
$22,614
AVG HOUSEHOLD INCOME
0.34
INEQUALITY / GINI INDEX
1,305
TOTAL POPULATION
707
MALE POPULATION
598
FEMALE POPULATION
118.23
MALES / 100 FEMALES
84.58
FEMALES / 100 MALES
46.2
MEDIAN AGE
3.6
AVG FAMILY SIZE
3.5
AVG HOUSEHOLD SIZE
286
LABOR FORCE [ PEOPLE ]
27.4%
PERCENT IN LABOR FORCE
Income in Corcovado
Income Overview in Corcovado
Per Capita Income in Corcovado is $9,391, while median incomes of families and households are $24,015 and $22,614 respectively.
| Characteristic | Number | Measure |
| Per Capita Income | 1,305 | $9,391 |
| Median Family Income | 338 | $24,015 |
| Mean Family Income | 338 | $28,576 |
| Median Household Income | 375 | $22,614 |
| Mean Household Income | 375 | $29,065 |
| Income Deficit | 338 | $0 |
| Wage / Income Gap (%) | 1,305 | 0.00% |
| Wage / Income Gap ($) | 1,305 | 100.00¢ per $1 |
| Gini / Inequality Index | 1,305 | 0.34 |
Earnings by Sex in Corcovado
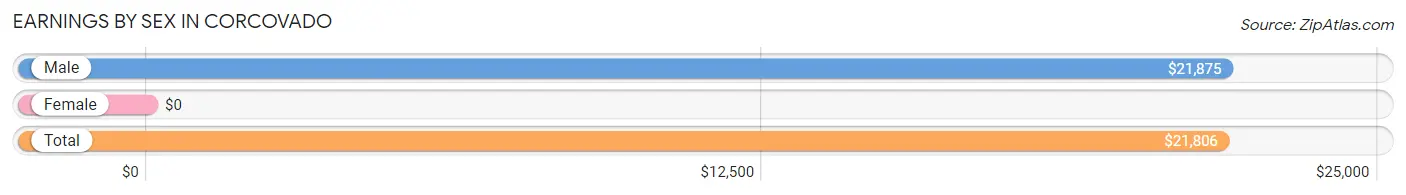
| Sex | Number | Average Earnings |
| Male | 217 (75.9%) | $21,875 |
| Female | 69 (24.1%) | $0 |
| Total | 286 (100.0%) | $21,806 |
Earnings by Sex by Income Bracket in Corcovado
The most common earnings brackets in Corcovado are $20,000 to $22,499 for men (54 | 24.9%) and $7,500 to $9,999 for women (36 | 52.2%).
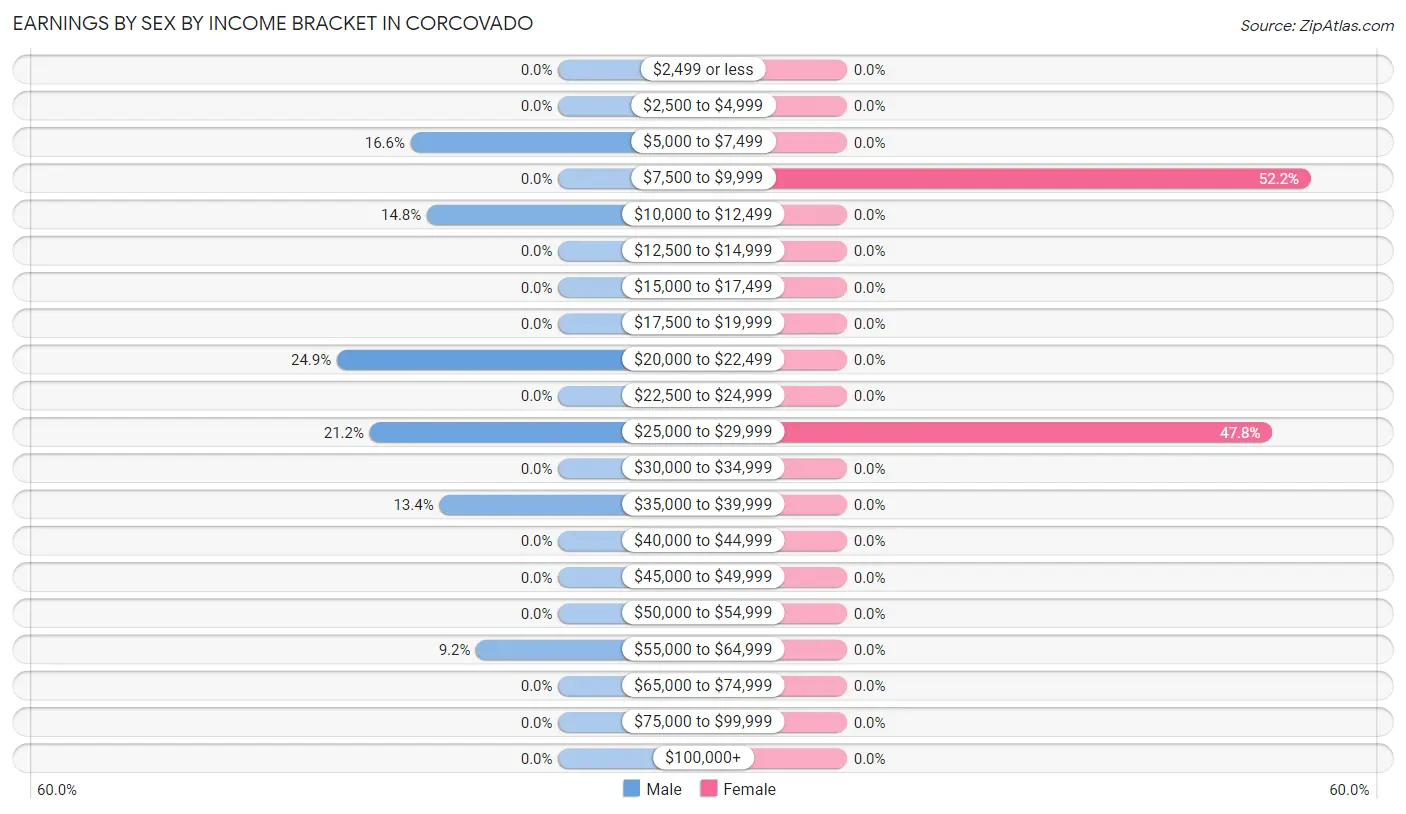
| Income | Male | Female |
| $2,499 or less | 0 (0.0%) | 0 (0.0%) |
| $2,500 to $4,999 | 0 (0.0%) | 0 (0.0%) |
| $5,000 to $7,499 | 36 (16.6%) | 0 (0.0%) |
| $7,500 to $9,999 | 0 (0.0%) | 36 (52.2%) |
| $10,000 to $12,499 | 32 (14.7%) | 0 (0.0%) |
| $12,500 to $14,999 | 0 (0.0%) | 0 (0.0%) |
| $15,000 to $17,499 | 0 (0.0%) | 0 (0.0%) |
| $17,500 to $19,999 | 0 (0.0%) | 0 (0.0%) |
| $20,000 to $22,499 | 54 (24.9%) | 0 (0.0%) |
| $22,500 to $24,999 | 0 (0.0%) | 0 (0.0%) |
| $25,000 to $29,999 | 46 (21.2%) | 33 (47.8%) |
| $30,000 to $34,999 | 0 (0.0%) | 0 (0.0%) |
| $35,000 to $39,999 | 29 (13.4%) | 0 (0.0%) |
| $40,000 to $44,999 | 0 (0.0%) | 0 (0.0%) |
| $45,000 to $49,999 | 0 (0.0%) | 0 (0.0%) |
| $50,000 to $54,999 | 0 (0.0%) | 0 (0.0%) |
| $55,000 to $64,999 | 20 (9.2%) | 0 (0.0%) |
| $65,000 to $74,999 | 0 (0.0%) | 0 (0.0%) |
| $75,000 to $99,999 | 0 (0.0%) | 0 (0.0%) |
| $100,000+ | 0 (0.0%) | 0 (0.0%) |
| Total | 217 (100.0%) | 69 (100.0%) |
Earnings by Sex by Educational Attainment in Corcovado
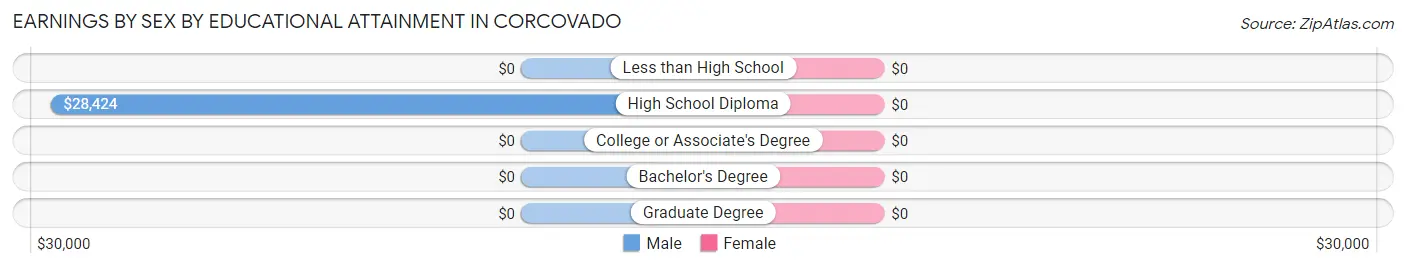
| Educational Attainment | Male Income | Female Income |
| Less than High School | - | - |
| High School Diploma | $28,424 | $0 |
| College or Associate's Degree | - | - |
| Bachelor's Degree | - | - |
| Graduate Degree | - | - |
| Total | $27,745 | $0 |
Family Income in Corcovado
Family Income Brackets in Corcovado
According to the Corcovado family income data, there are 94 families falling into the $15,000 to $24,999 income range, which is the most common income bracket and makes up 27.8% of all families.
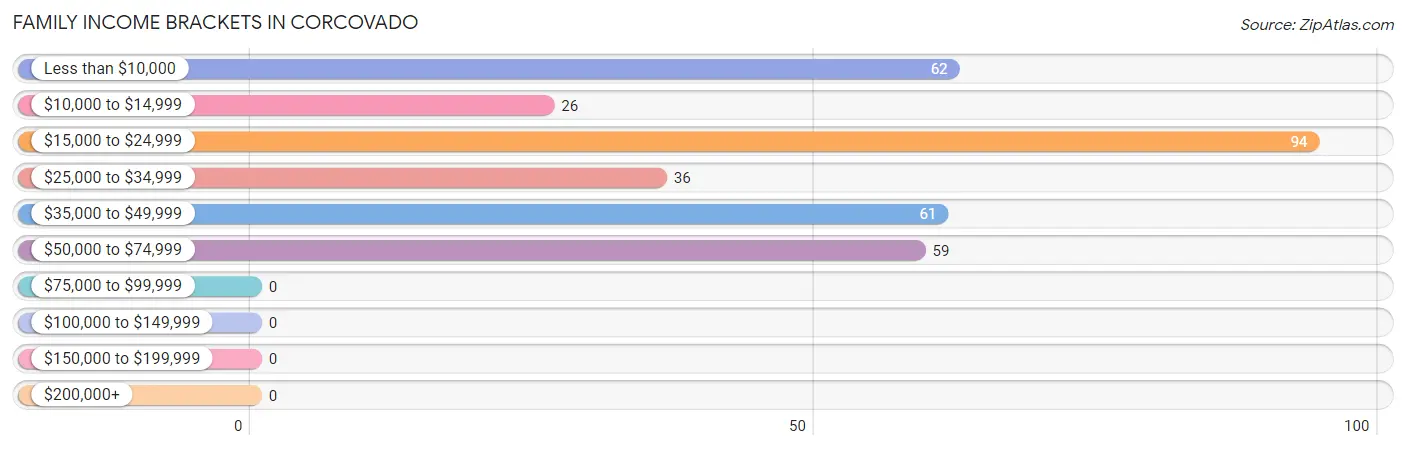
| Income Bracket | # Families | % Families |
| Less than $10,000 | 62 | 18.3% |
| $10,000 to $14,999 | 26 | 7.7% |
| $15,000 to $24,999 | 94 | 27.8% |
| $25,000 to $34,999 | 36 | 10.7% |
| $35,000 to $49,999 | 61 | 18.0% |
| $50,000 to $74,999 | 59 | 17.5% |
| $75,000 to $99,999 | 0 | 0.0% |
| $100,000 to $149,999 | 0 | 0.0% |
| $150,000 to $199,999 | 0 | 0.0% |
| $200,000+ | 0 | 0.0% |
Family Income by Famaliy Size in Corcovado
4-person families (92 | 27.2%) account for the highest median family income in Corcovado with $31,389 per family, while 4-person families (92 | 27.2%) have the highest median income of $7,847 per family member.
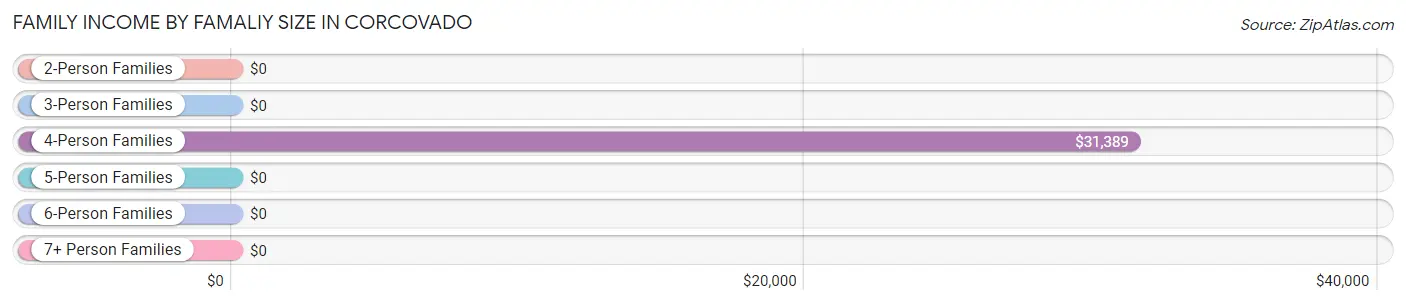
| Income Bracket | # Families | Median Income |
| 2-Person Families | 137 (40.5%) | $0 |
| 3-Person Families | 47 (13.9%) | $0 |
| 4-Person Families | 92 (27.2%) | $31,389 |
| 5-Person Families | 62 (18.3%) | $0 |
| 6-Person Families | 0 (0.0%) | $0 |
| 7+ Person Families | 0 (0.0%) | $0 |
| Total | 338 (100.0%) | $24,015 |
Family Income by Number of Earners in Corcovado
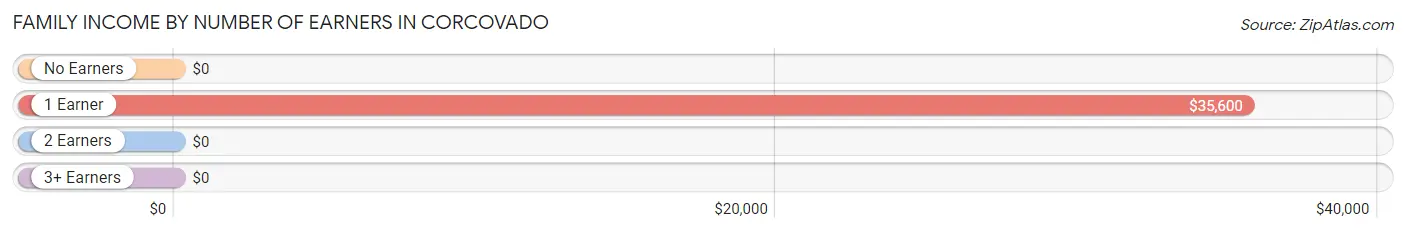
| Number of Earners | # Families | Median Income |
| No Earners | 143 (42.3%) | $0 |
| 1 Earner | 130 (38.5%) | $35,600 |
| 2 Earners | 65 (19.2%) | $0 |
| 3+ Earners | 0 (0.0%) | $0 |
| Total | 338 (100.0%) | $24,015 |
Household Income in Corcovado
Household Income Brackets in Corcovado
With 166 households falling in the category, the $15,000 to $24,999 income range is the most frequent in Corcovado, accounting for 44.3% of all households.
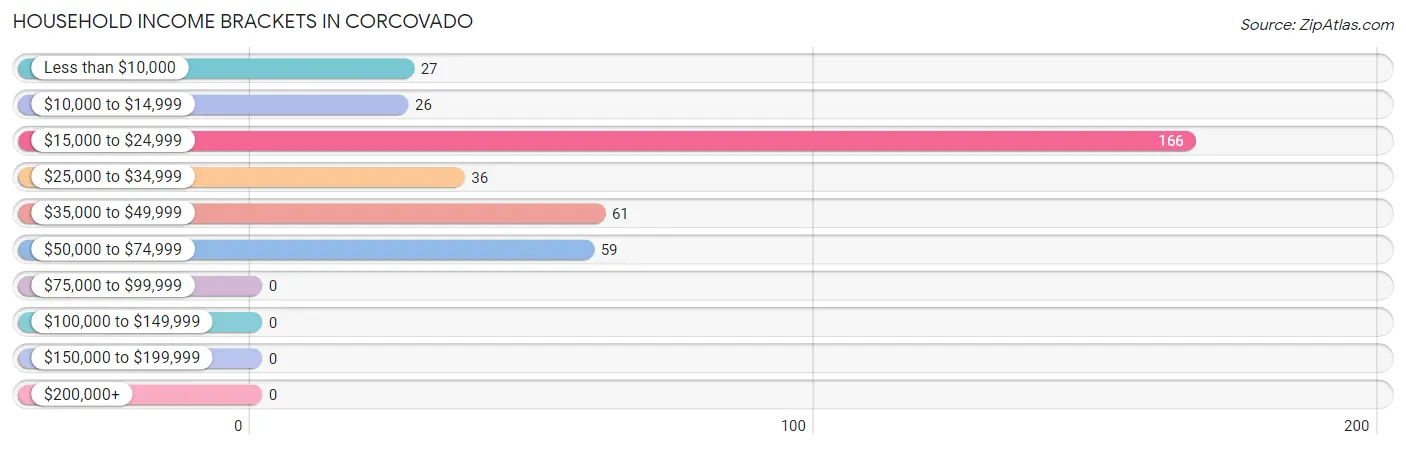
| Income Bracket | # Households | % Households |
| Less than $10,000 | 27 | 7.2% |
| $10,000 to $14,999 | 26 | 6.9% |
| $15,000 to $24,999 | 166 | 44.3% |
| $25,000 to $34,999 | 36 | 9.6% |
| $35,000 to $49,999 | 61 | 16.3% |
| $50,000 to $74,999 | 59 | 15.7% |
| $75,000 to $99,999 | 0 | 0.0% |
| $100,000 to $149,999 | 0 | 0.0% |
| $150,000 to $199,999 | 0 | 0.0% |
| $200,000+ | 0 | 0.0% |
Household Income by Householder Age in Corcovado
The median household income in Corcovado is $22,614, with the highest median household income of $20,847 found in the 65+ years age bracket for the primary householder. A total of 91 households (24.3%) fall into this category.
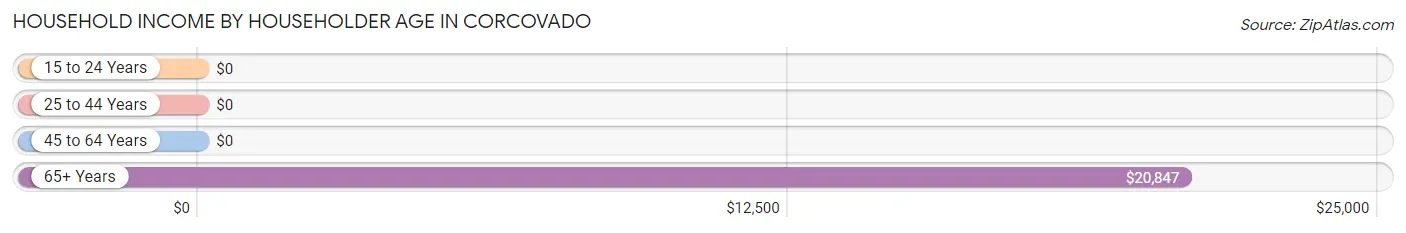
| Income Bracket | # Households | Median Income |
| 15 to 24 Years | 0 (0.0%) | $0 |
| 25 to 44 Years | 118 (31.5%) | $0 |
| 45 to 64 Years | 166 (44.3%) | $0 |
| 65+ Years | 91 (24.3%) | $20,847 |
| Total | 375 (100.0%) | $22,614 |
Poverty in Corcovado
Income Below Poverty by Sex and Age in Corcovado
With 53.3% poverty level for males and 50.2% for females among the residents of Corcovado, 6 to 11 year old males and 55 to 64 year old females are the most vulnerable to poverty, with 75 males (100.0%) and 128 females (79.5%) in their respective age groups living below the poverty level.
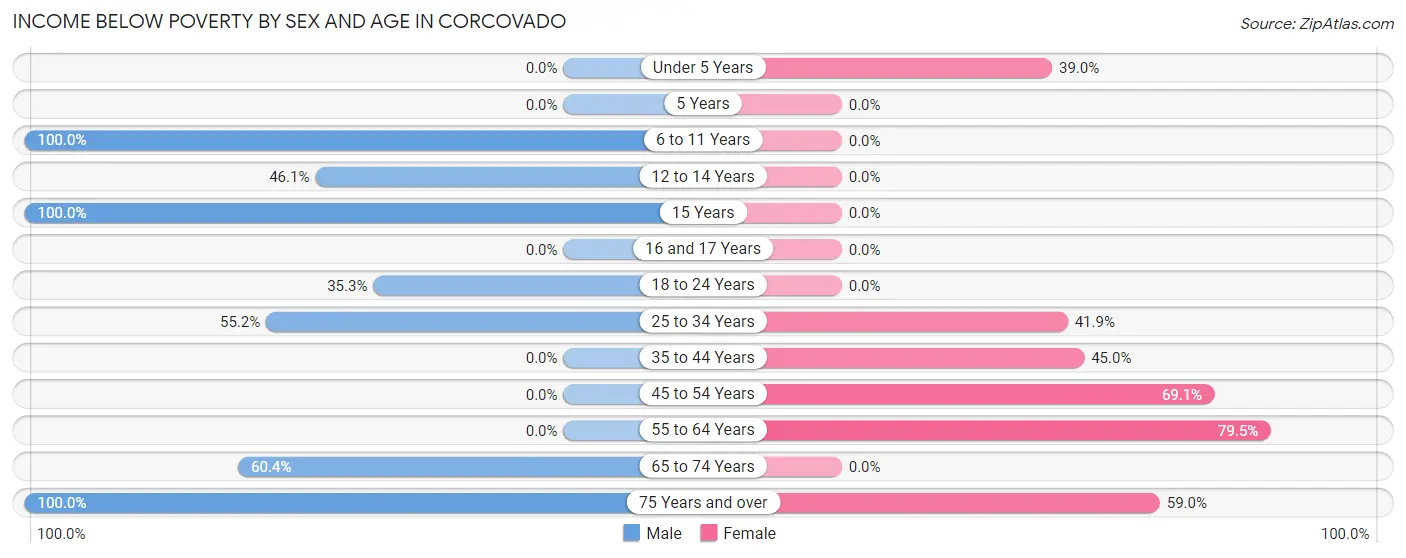
| Age Bracket | Male | Female |
| Under 5 Years | 0 (0.0%) | 16 (39.0%) |
| 5 Years | 0 (0.0%) | 0 (0.0%) |
| 6 to 11 Years | 75 (100.0%) | 0 (0.0%) |
| 12 to 14 Years | 35 (46.1%) | 0 (0.0%) |
| 15 Years | 34 (100.0%) | 0 (0.0%) |
| 16 and 17 Years | 0 (0.0%) | 0 (0.0%) |
| 18 to 24 Years | 36 (35.3%) | 0 (0.0%) |
| 25 to 34 Years | 32 (55.2%) | 26 (41.9%) |
| 35 to 44 Years | 0 (0.0%) | 27 (45.0%) |
| 45 to 54 Years | 0 (0.0%) | 67 (69.1%) |
| 55 to 64 Years | 0 (0.0%) | 128 (79.5%) |
| 65 to 74 Years | 32 (60.4%) | 0 (0.0%) |
| 75 Years and over | 133 (100.0%) | 36 (59.0%) |
| Total | 377 (53.3%) | 300 (50.2%) |
Income Above Poverty by Sex and Age in Corcovado
According to the poverty statistics in Corcovado, males aged 35 to 44 years and females aged 5 years are the age groups that are most secure financially, with 100.0% of males and 100.0% of females in these age groups living above the poverty line.
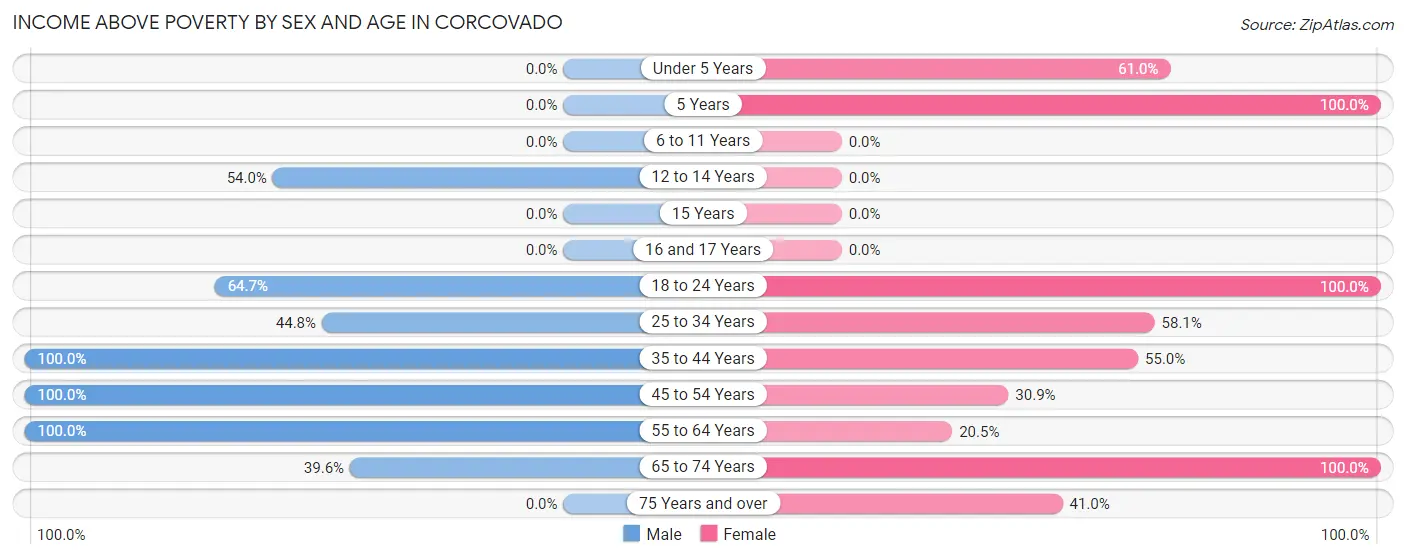
| Age Bracket | Male | Female |
| Under 5 Years | 0 (0.0%) | 25 (61.0%) |
| 5 Years | 0 (0.0%) | 37 (100.0%) |
| 6 to 11 Years | 0 (0.0%) | 0 (0.0%) |
| 12 to 14 Years | 41 (53.9%) | 0 (0.0%) |
| 15 Years | 0 (0.0%) | 0 (0.0%) |
| 16 and 17 Years | 0 (0.0%) | 0 (0.0%) |
| 18 to 24 Years | 66 (64.7%) | 31 (100.0%) |
| 25 to 34 Years | 26 (44.8%) | 36 (58.1%) |
| 35 to 44 Years | 57 (100.0%) | 33 (55.0%) |
| 45 to 54 Years | 66 (100.0%) | 30 (30.9%) |
| 55 to 64 Years | 53 (100.0%) | 33 (20.5%) |
| 65 to 74 Years | 21 (39.6%) | 48 (100.0%) |
| 75 Years and over | 0 (0.0%) | 25 (41.0%) |
| Total | 330 (46.7%) | 298 (49.8%) |
Income Below Poverty Among Married-Couple Families in Corcovado
The poverty statistics for married-couple families in Corcovado show that 39.9% or 87 of the total 218 families live below the poverty line. Families with no children have the highest poverty rate of 48.0%, comprising of 61 families. On the other hand, families with 1 or 2 children have the lowest poverty rate of 28.6%, which includes 26 families.
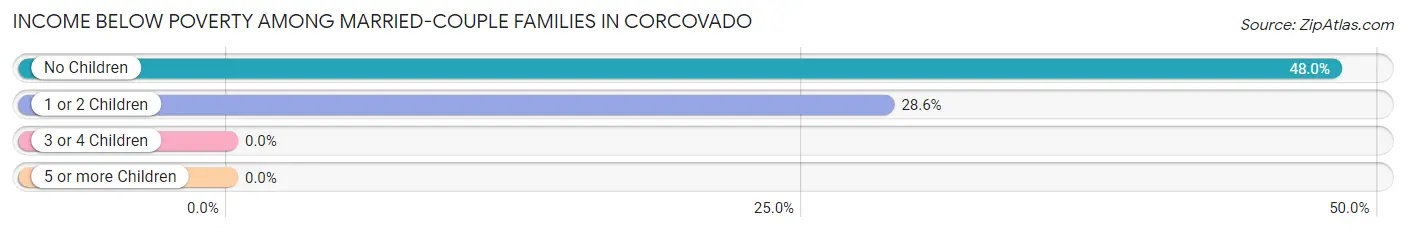
| Children | Above Poverty | Below Poverty |
| No Children | 66 (52.0%) | 61 (48.0%) |
| 1 or 2 Children | 65 (71.4%) | 26 (28.6%) |
| 3 or 4 Children | 0 (0.0%) | 0 (0.0%) |
| 5 or more Children | 0 (0.0%) | 0 (0.0%) |
| Total | 131 (60.1%) | 87 (39.9%) |
Income Below Poverty Among Single-Parent Households in Corcovado
According to the poverty data in Corcovado, 100.0% or 35 single-father households and 70.6% or 60 single-mother households are living below the poverty line. Among single-father households, those with 1 or 2 children have the highest poverty rate, with 35 households (100.0%) experiencing poverty. Likewise, among single-mother households, those with 1 or 2 children have the highest poverty rate, with 60 households (100.0%) falling below the poverty line.
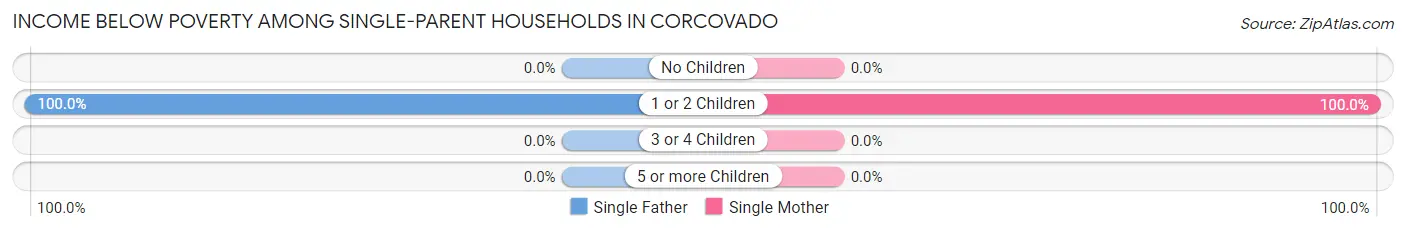
| Children | Single Father | Single Mother |
| No Children | 0 (0.0%) | 0 (0.0%) |
| 1 or 2 Children | 35 (100.0%) | 60 (100.0%) |
| 3 or 4 Children | 0 (0.0%) | 0 (0.0%) |
| 5 or more Children | 0 (0.0%) | 0 (0.0%) |
| Total | 35 (100.0%) | 60 (70.6%) |
Income Below Poverty Among Married-Couple vs Single-Parent Households in Corcovado
The poverty data for Corcovado shows that 87 of the married-couple family households (39.9%) and 95 of the single-parent households (79.2%) are living below the poverty level. Within the married-couple family households, those with no children have the highest poverty rate, with 61 households (48.0%) falling below the poverty line. Among the single-parent households, those with 1 or 2 children have the highest poverty rate, with 95 household (100.0%) living below poverty.
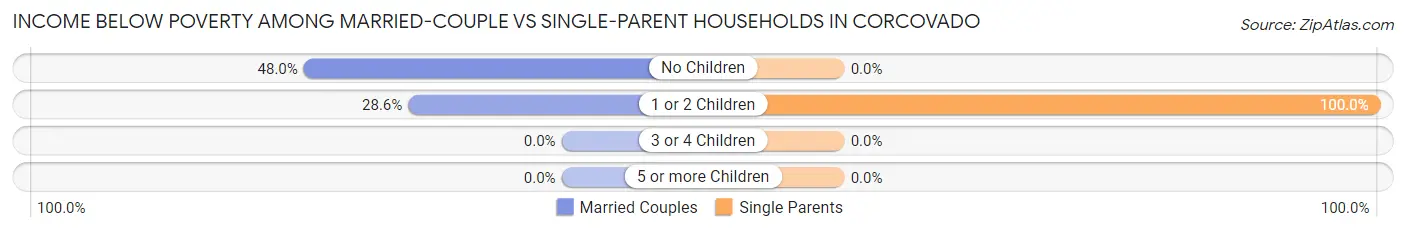
| Children | Married-Couple Families | Single-Parent Households |
| No Children | 61 (48.0%) | 0 (0.0%) |
| 1 or 2 Children | 26 (28.6%) | 95 (100.0%) |
| 3 or 4 Children | 0 (0.0%) | 0 (0.0%) |
| 5 or more Children | 0 (0.0%) | 0 (0.0%) |
| Total | 87 (39.9%) | 95 (79.2%) |
Race in Corcovado
The most populous races in Corcovado are Hispanic or Latino (1,305 | 100.0%), White / Caucasian (982 | 75.2%), and Some other Race (251 | 19.2%).
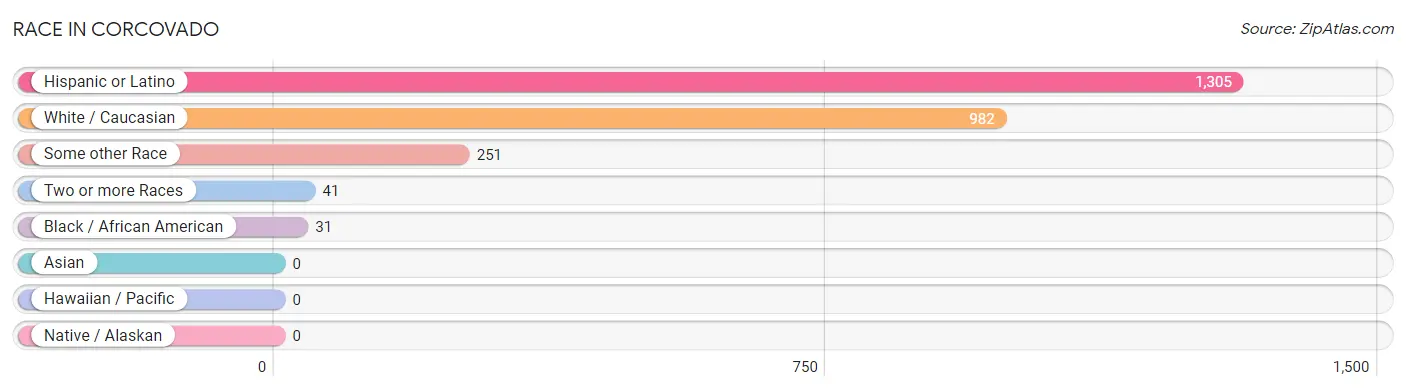
| Race | # Population | % Population |
| Asian | 0 | 0.0% |
| Black / African American | 31 | 2.4% |
| Hawaiian / Pacific | 0 | 0.0% |
| Hispanic or Latino | 1,305 | 100.0% |
| Native / Alaskan | 0 | 0.0% |
| White / Caucasian | 982 | 75.2% |
| Two or more Races | 41 | 3.1% |
| Some other Race | 251 | 19.2% |
| Total | 1,305 | 100.0% |
Ancestry in Corcovado
The most populous ancestries reported in Corcovado are , and Puerto Rican (1,305 | 100.0%), together accounting for 100.0% of all Corcovado residents.

| Ancestry | # Population | % Population |
| Puerto Rican | 1,305 | 100.0% | View All 1 Rows |
Immigrants in Corcovado

| Immigration Origin | # Population | % Population | View All 0 Rows |
Sex and Age in Corcovado
Sex and Age in Corcovado
The most populous age groups in Corcovado are 80 to 84 Years (102 | 14.4%) for men and 60 to 64 Years (131 | 21.9%) for women.
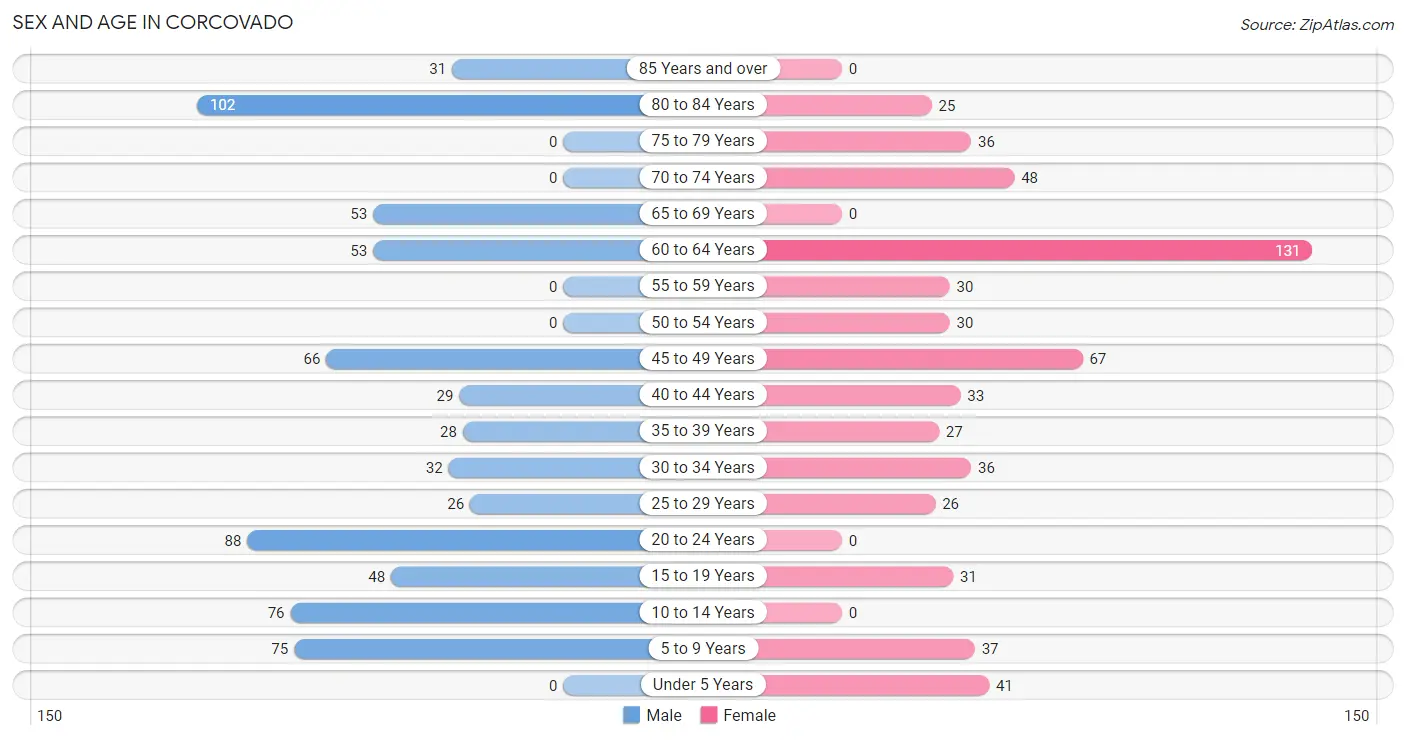
| Age Bracket | Male | Female |
| Under 5 Years | 0 (0.0%) | 41 (6.9%) |
| 5 to 9 Years | 75 (10.6%) | 37 (6.2%) |
| 10 to 14 Years | 76 (10.7%) | 0 (0.0%) |
| 15 to 19 Years | 48 (6.8%) | 31 (5.2%) |
| 20 to 24 Years | 88 (12.4%) | 0 (0.0%) |
| 25 to 29 Years | 26 (3.7%) | 26 (4.3%) |
| 30 to 34 Years | 32 (4.5%) | 36 (6.0%) |
| 35 to 39 Years | 28 (4.0%) | 27 (4.5%) |
| 40 to 44 Years | 29 (4.1%) | 33 (5.5%) |
| 45 to 49 Years | 66 (9.3%) | 67 (11.2%) |
| 50 to 54 Years | 0 (0.0%) | 30 (5.0%) |
| 55 to 59 Years | 0 (0.0%) | 30 (5.0%) |
| 60 to 64 Years | 53 (7.5%) | 131 (21.9%) |
| 65 to 69 Years | 53 (7.5%) | 0 (0.0%) |
| 70 to 74 Years | 0 (0.0%) | 48 (8.0%) |
| 75 to 79 Years | 0 (0.0%) | 36 (6.0%) |
| 80 to 84 Years | 102 (14.4%) | 25 (4.2%) |
| 85 Years and over | 31 (4.4%) | 0 (0.0%) |
| Total | 707 (100.0%) | 598 (100.0%) |
Families and Households in Corcovado
Median Family Size in Corcovado
The median family size in Corcovado is 3.61 persons per family, with single female/mother families (85 | 25.2%) accounting for the largest median family size of 4.52 persons per family. On the other hand, single male/father families (35 | 10.4%) represent the smallest median family size with 1.97 persons per family.
| Family Type | # Families | Family Size |
| Married-Couple | 218 (64.5%) | 3.52 |
| Single Male/Father | 35 (10.4%) | 1.97 |
| Single Female/Mother | 85 (25.2%) | 4.52 |
| Total Families | 338 (100.0%) | 3.61 |
Median Household Size in Corcovado
| Household Type | # Households | Household Size |
| Married-Couple | 218 (58.1%) | 3.52 |
| Single Male/Father | 35 (9.3%) | 3.34 |
| Single Female/Mother | 85 (22.7%) | 4.52 |
| Non-family | 37 (9.9%) | - |
| Total Households | 375 (100.0%) | 3.48 |
Household Size by Marriage Status in Corcovado
Out of a total of 375 households in Corcovado, 338 (90.1%) are family households, while 37 (9.9%) are nonfamily households. The most numerous type of family households are 2-person households, comprising 102, and the most common type of nonfamily households are 1-person households, comprising 37.
| Household Size | Family Households | Nonfamily Households |
| 1-Person Households | - | 37 (9.9%) |
| 2-Person Households | 102 (27.2%) | 0 (0.0%) |
| 3-Person Households | 82 (21.9%) | 0 (0.0%) |
| 4-Person Households | 92 (24.5%) | 0 (0.0%) |
| 5-Person Households | 62 (16.5%) | 0 (0.0%) |
| 6-Person Households | 0 (0.0%) | 0 (0.0%) |
| 7+ Person Households | 0 (0.0%) | 0 (0.0%) |
| Total | 338 (90.1%) | 37 (9.9%) |
Female Fertility in Corcovado
Fertility by Age in Corcovado
| Age Bracket | Women with Births | Births / 1,000 Women |
| 15 to 19 years | 0 (0.0%) | 0.0 |
| 20 to 34 years | 0 (0.0%) | 0.0 |
| 35 to 50 years | 0 (0.0%) | 0.0 |
| Total | 0 (0.0%) | 0.0 |
Fertility by Age by Marriage Status in Corcovado
| Age Bracket | Married | Unmarried |
| 15 to 19 years | 0 (0.0%) | 0 (0.0%) |
| 20 to 34 years | 0 (0.0%) | 0 (0.0%) |
| 35 to 50 years | 0 (0.0%) | 0 (0.0%) |
| Total | 0 (0.0%) | 0 (0.0%) |
Fertility by Education in Corcovado
| Educational Attainment | Women with Births | Births / 1,000 Women |
| Less than High School | 0 (0.0%) | 0.0 |
| High School Diploma | 0 (0.0%) | 0.0 |
| College or Associate's Degree | 0 (0.0%) | 0.0 |
| Bachelor's Degree | 0 (0.0%) | 0.0 |
| Graduate Degree | 0 (0.0%) | 0.0 |
| Total | 0 (0.0%) | 0.0 |
Fertility by Education by Marriage Status in Corcovado
| Educational Attainment | Married | Unmarried |
| Less than High School | 0 (0.0%) | 0 (0.0%) |
| High School Diploma | 0 (0.0%) | 0 (0.0%) |
| College or Associate's Degree | 0 (0.0%) | 0 (0.0%) |
| Bachelor's Degree | 0 (0.0%) | 0 (0.0%) |
| Graduate Degree | 0 (0.0%) | 0 (0.0%) |
| Total | 0 (0.0%) | 0 (0.0%) |
Employment Characteristics in Corcovado
Employment by Class of Employer in Corcovado
Among the 286 employed individuals in Corcovado, private company employees (229 | 80.1%), and state government employees (57 | 19.9%) make up the most common classes of employment.
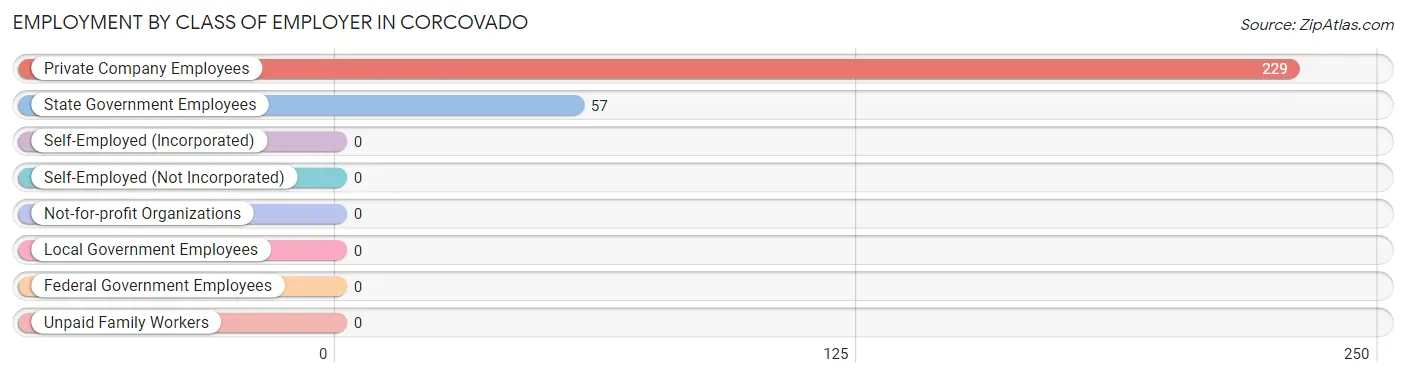
| Employer Class | # Employees | % Employees |
| Private Company Employees | 229 | 80.1% |
| Self-Employed (Incorporated) | 0 | 0.0% |
| Self-Employed (Not Incorporated) | 0 | 0.0% |
| Not-for-profit Organizations | 0 | 0.0% |
| Local Government Employees | 0 | 0.0% |
| State Government Employees | 57 | 19.9% |
| Federal Government Employees | 0 | 0.0% |
| Unpaid Family Workers | 0 | 0.0% |
| Total | 286 | 100.0% |
Employment Status by Age in Corcovado
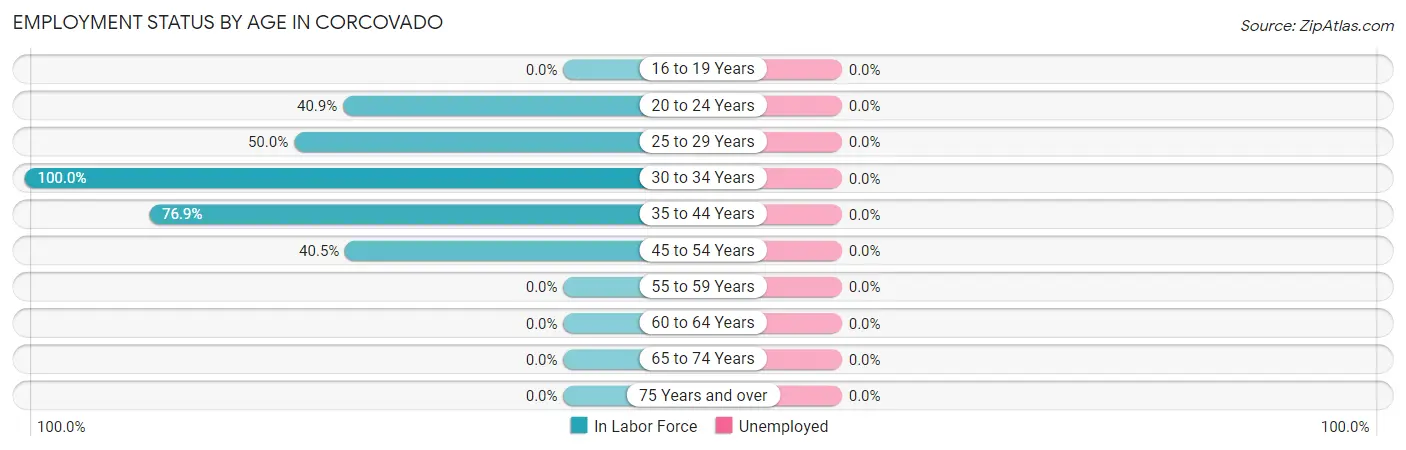
| Age Bracket | In Labor Force | Unemployed |
| 16 to 19 Years | 0 (0.0%) | 0 (0.0%) |
| 20 to 24 Years | 36 (40.9%) | 0 (0.0%) |
| 25 to 29 Years | 26 (50.0%) | 0 (0.0%) |
| 30 to 34 Years | 68 (100.0%) | 0 (0.0%) |
| 35 to 44 Years | 90 (76.9%) | 0 (0.0%) |
| 45 to 54 Years | 66 (40.5%) | 0 (0.0%) |
| 55 to 59 Years | 0 (0.0%) | 0 (0.0%) |
| 60 to 64 Years | 0 (0.0%) | 0 (0.0%) |
| 65 to 74 Years | 0 (0.0%) | 0 (0.0%) |
| 75 Years and over | 0 (0.0%) | 0 (0.0%) |
| Total | 286 (27.4%) | 0 (0.0%) |
Employment Status by Educational Attainment in Corcovado
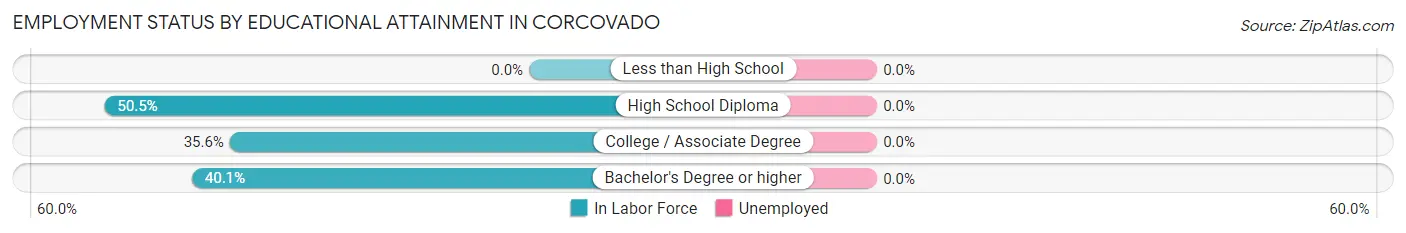
| Educational Attainment | In Labor Force | Unemployed |
| Less than High School | 0 (0.0%) | 0 (0.0%) |
| High School Diploma | 98 (50.5%) | 0 (0.0%) |
| College / Associate Degree | 26 (35.6%) | 0 (0.0%) |
| Bachelor's Degree or higher | 126 (40.1%) | 0 (0.0%) |
| Total | 250 (40.7%) | 0 (0.0%) |
Employment Occupations by Sex in Corcovado
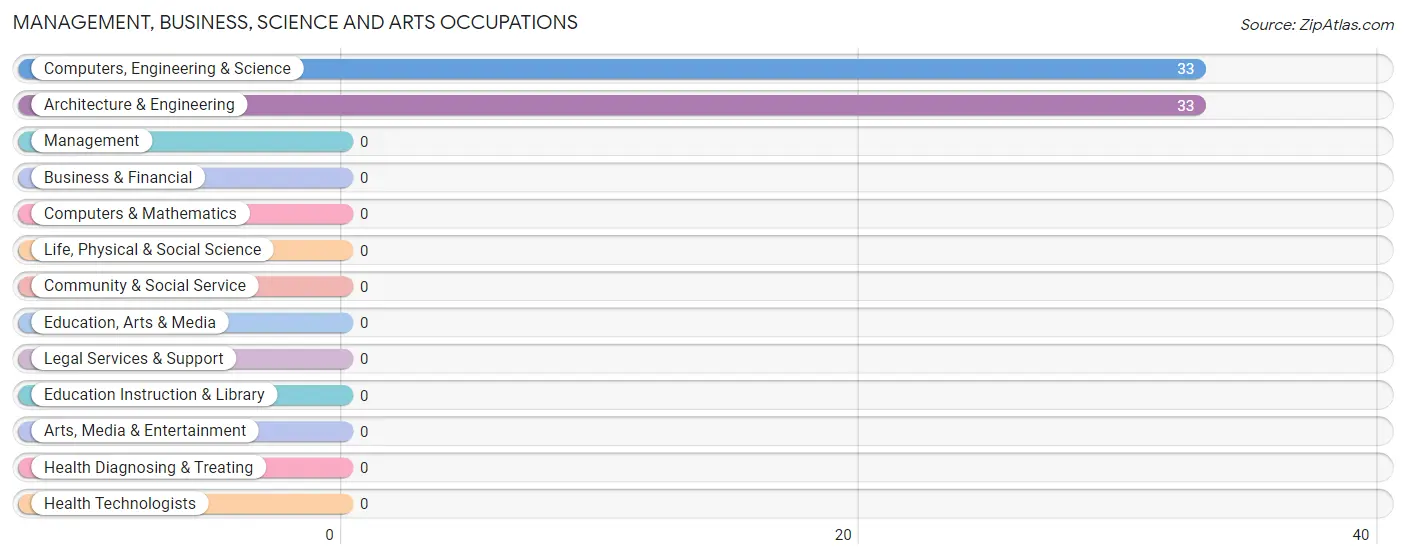
Management, Business, Science and Arts Occupations
The most common Management, Business, Science and Arts occupations in Corcovado are Computers, Engineering & Science (33 | 11.5%), and Architecture & Engineering (33 | 11.5%).
Management, Business, Science and Arts Occupations by Sex
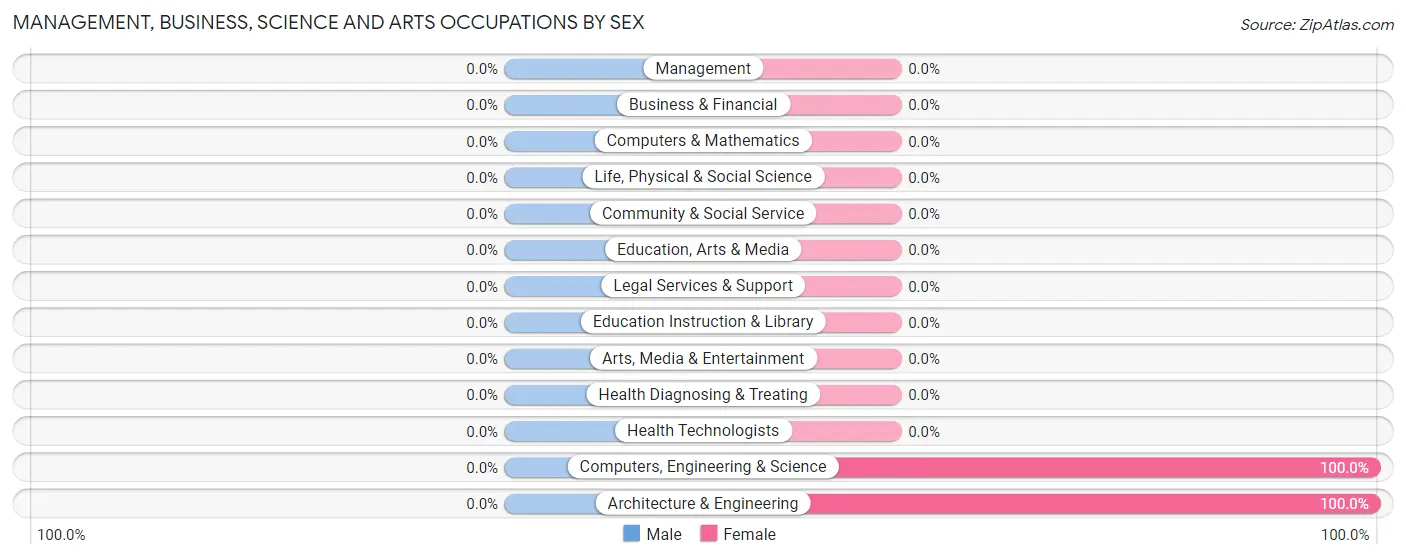
| Occupation | Male | Female |
| Management | 0 (0.0%) | 0 (0.0%) |
| Business & Financial | 0 (0.0%) | 0 (0.0%) |
| Computers, Engineering & Science | 0 (0.0%) | 33 (100.0%) |
| Computers & Mathematics | 0 (0.0%) | 0 (0.0%) |
| Architecture & Engineering | 0 (0.0%) | 33 (100.0%) |
| Life, Physical & Social Science | 0 (0.0%) | 0 (0.0%) |
| Community & Social Service | 0 (0.0%) | 0 (0.0%) |
| Education, Arts & Media | 0 (0.0%) | 0 (0.0%) |
| Legal Services & Support | 0 (0.0%) | 0 (0.0%) |
| Education Instruction & Library | 0 (0.0%) | 0 (0.0%) |
| Arts, Media & Entertainment | 0 (0.0%) | 0 (0.0%) |
| Health Diagnosing & Treating | 0 (0.0%) | 0 (0.0%) |
| Health Technologists | 0 (0.0%) | 0 (0.0%) |
| Total (Category) | 0 (0.0%) | 33 (100.0%) |
| Total (Overall) | 217 (75.9%) | 69 (24.1%) |
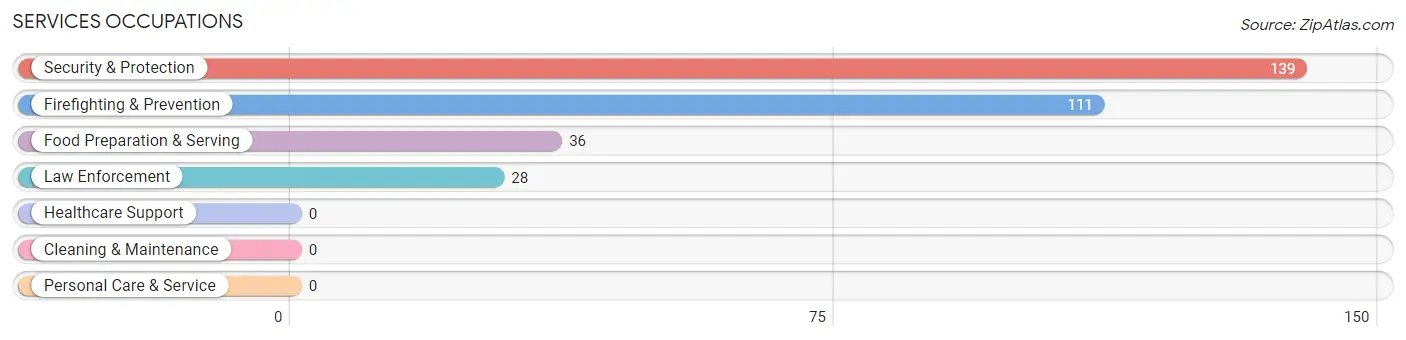
Services Occupations
The most common Services occupations in Corcovado are Security & Protection (139 | 48.6%), Firefighting & Prevention (111 | 38.8%), Food Preparation & Serving (36 | 12.6%), and Law Enforcement (28 | 9.8%).
Services Occupations by Sex
Within the Services occupations in Corcovado, the most male-oriented occupations are Law Enforcement (100.0%), Food Preparation & Serving (100.0%), and Security & Protection (74.1%), while the most female-oriented occupations are Firefighting & Prevention (32.4%), and Security & Protection (25.9%).
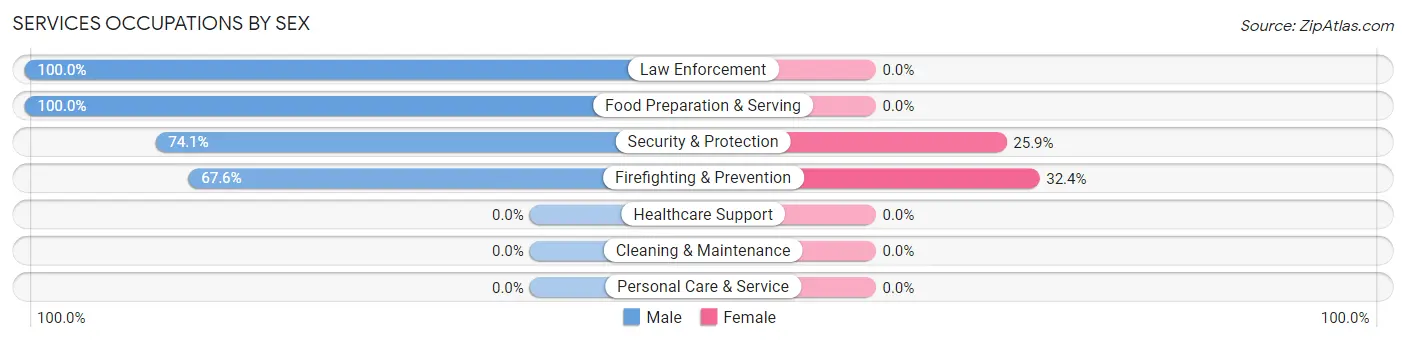
| Occupation | Male | Female |
| Healthcare Support | 0 (0.0%) | 0 (0.0%) |
| Security & Protection | 103 (74.1%) | 36 (25.9%) |
| Firefighting & Prevention | 75 (67.6%) | 36 (32.4%) |
| Law Enforcement | 28 (100.0%) | 0 (0.0%) |
| Food Preparation & Serving | 36 (100.0%) | 0 (0.0%) |
| Cleaning & Maintenance | 0 (0.0%) | 0 (0.0%) |
| Personal Care & Service | 0 (0.0%) | 0 (0.0%) |
| Total (Category) | 139 (79.4%) | 36 (20.6%) |
| Total (Overall) | 217 (75.9%) | 69 (24.1%) |
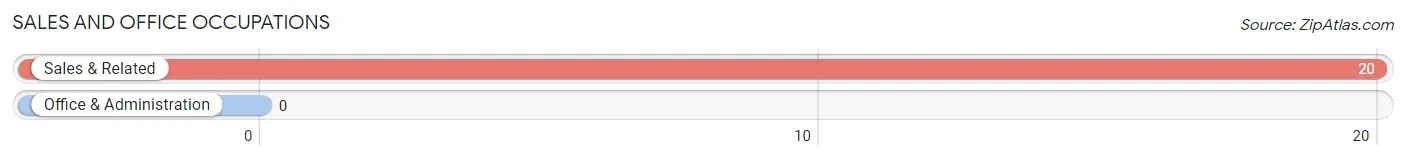
Sales and Office Occupations
The most common Sales and Office occupations in Corcovado are , and Sales & Related (20 | 7.0%).
Sales and Office Occupations by Sex
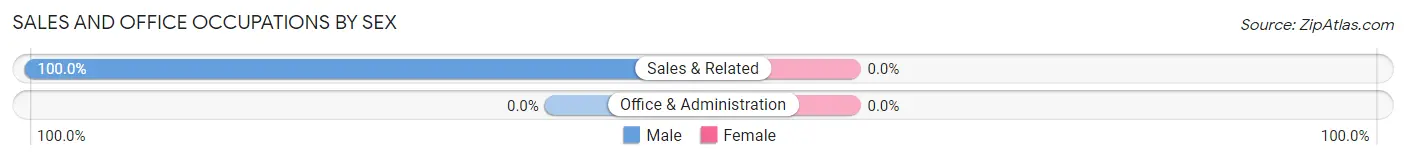
| Occupation | Male | Female |
| Sales & Related | 20 (100.0%) | 0 (0.0%) |
| Office & Administration | 0 (0.0%) | 0 (0.0%) |
| Total (Category) | 20 (100.0%) | 0 (0.0%) |
| Total (Overall) | 217 (75.9%) | 69 (24.1%) |
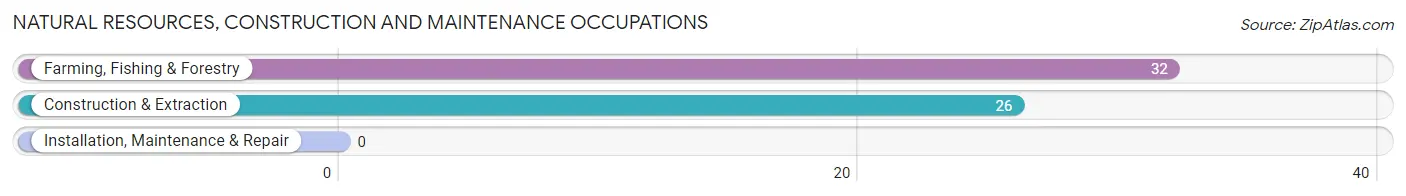
Natural Resources, Construction and Maintenance Occupations
The most common Natural Resources, Construction and Maintenance occupations in Corcovado are Farming, Fishing & Forestry (32 | 11.2%), and Construction & Extraction (26 | 9.1%).
Natural Resources, Construction and Maintenance Occupations by Sex
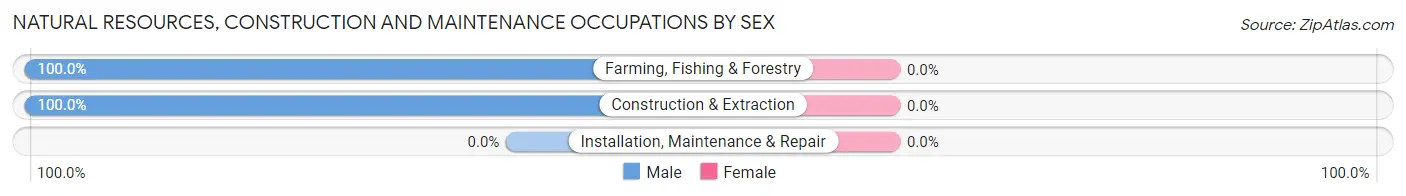
| Occupation | Male | Female |
| Farming, Fishing & Forestry | 32 (100.0%) | 0 (0.0%) |
| Construction & Extraction | 26 (100.0%) | 0 (0.0%) |
| Installation, Maintenance & Repair | 0 (0.0%) | 0 (0.0%) |
| Total (Category) | 58 (100.0%) | 0 (0.0%) |
| Total (Overall) | 217 (75.9%) | 69 (24.1%) |
Production, Transportation and Moving Occupations
Production, Transportation and Moving Occupations by Sex
| Occupation | Male | Female |
| Production | 0 (0.0%) | 0 (0.0%) |
| Transportation | 0 (0.0%) | 0 (0.0%) |
| Material Moving | 0 (0.0%) | 0 (0.0%) |
| Total (Category) | 0 (0.0%) | 0 (0.0%) |
| Total (Overall) | 217 (75.9%) | 69 (24.1%) |
Employment Industries by Sex in Corcovado
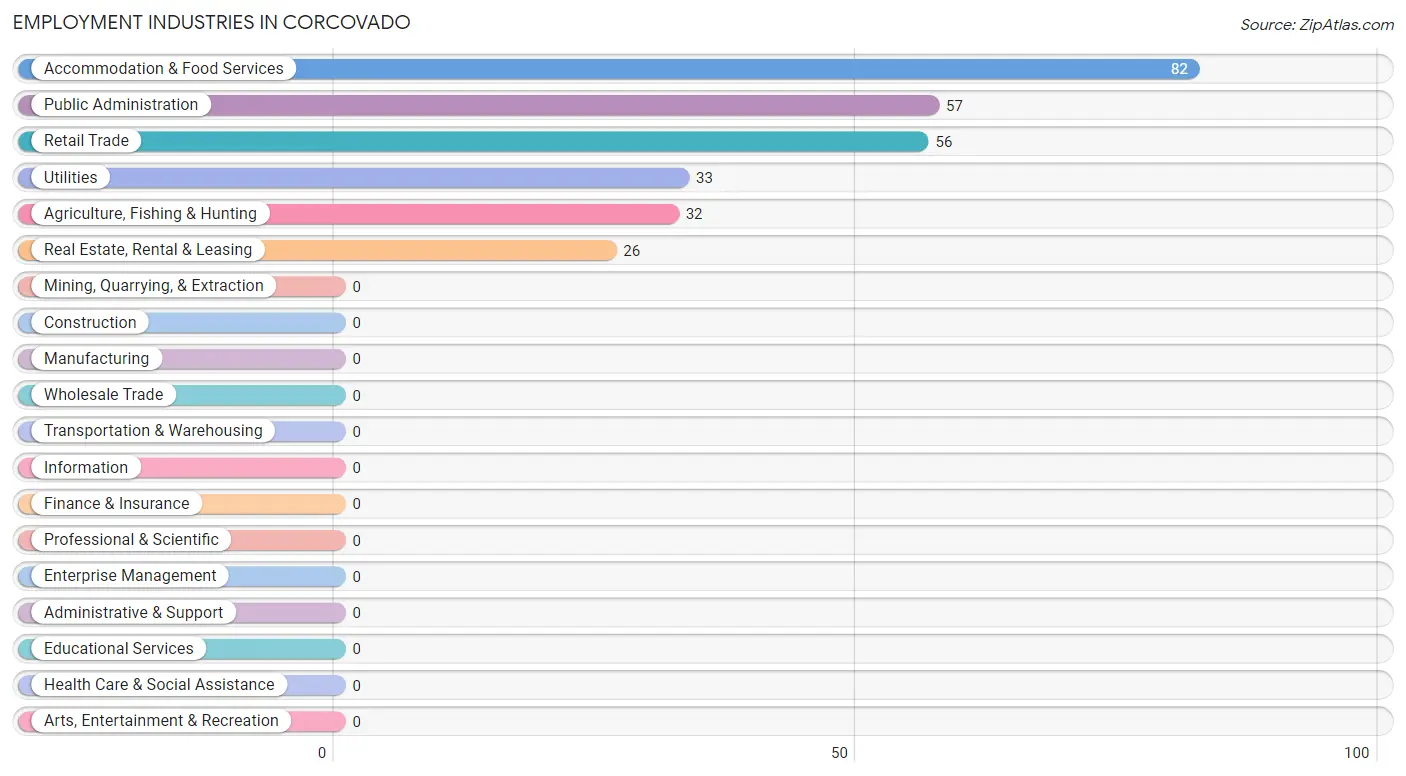
Employment Industries in Corcovado
The major employment industries in Corcovado include Accommodation & Food Services (82 | 28.7%), Public Administration (57 | 19.9%), Retail Trade (56 | 19.6%), Utilities (33 | 11.5%), and Agriculture, Fishing & Hunting (32 | 11.2%).
Employment Industries by Sex in Corcovado
The Corcovado industries that see more men than women are Agriculture, Fishing & Hunting (100.0%), Real Estate, Rental & Leasing (100.0%), and Accommodation & Food Services (100.0%), whereas the industries that tend to have a higher number of women are Utilities (100.0%), and Retail Trade (64.3%).
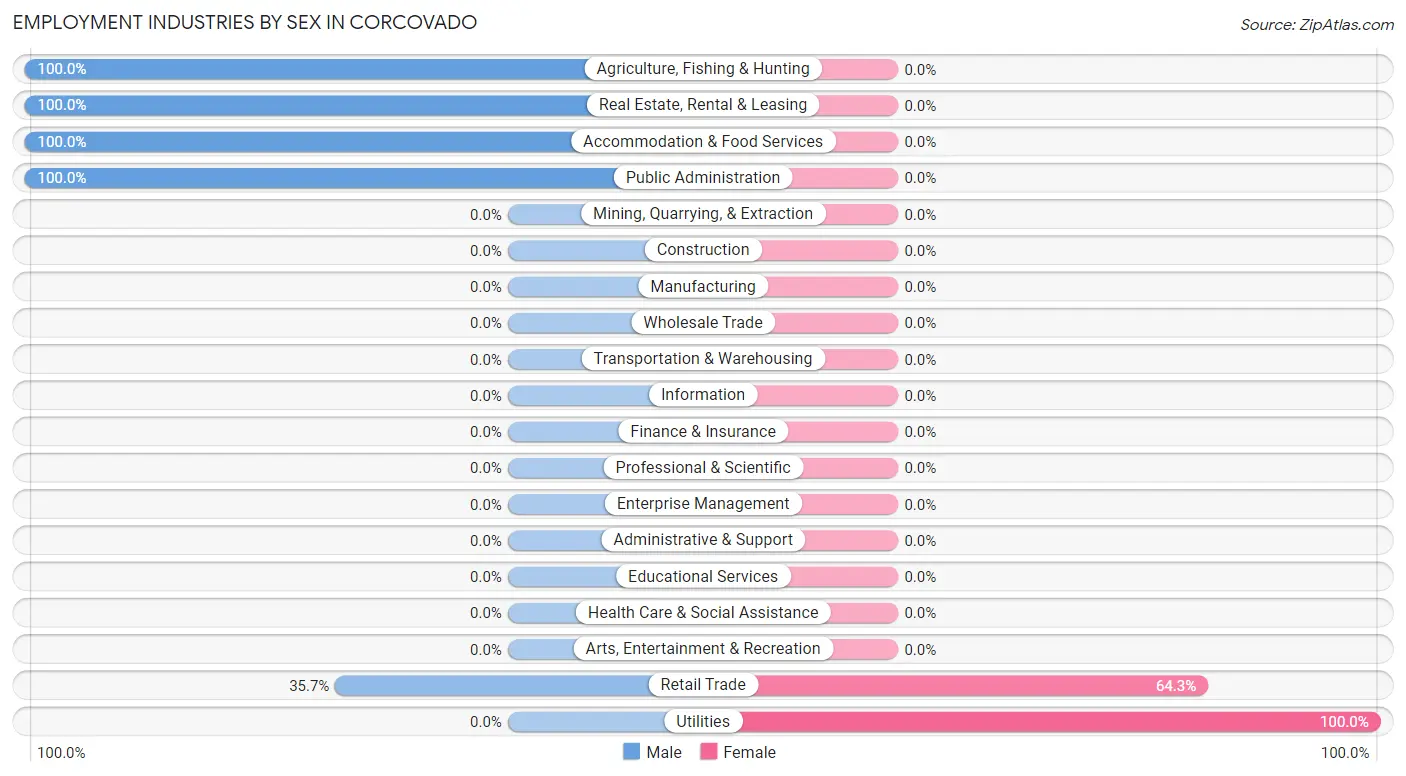
| Industry | Male | Female |
| Agriculture, Fishing & Hunting | 32 (100.0%) | 0 (0.0%) |
| Mining, Quarrying, & Extraction | 0 (0.0%) | 0 (0.0%) |
| Construction | 0 (0.0%) | 0 (0.0%) |
| Manufacturing | 0 (0.0%) | 0 (0.0%) |
| Wholesale Trade | 0 (0.0%) | 0 (0.0%) |
| Retail Trade | 20 (35.7%) | 36 (64.3%) |
| Transportation & Warehousing | 0 (0.0%) | 0 (0.0%) |
| Utilities | 0 (0.0%) | 33 (100.0%) |
| Information | 0 (0.0%) | 0 (0.0%) |
| Finance & Insurance | 0 (0.0%) | 0 (0.0%) |
| Real Estate, Rental & Leasing | 26 (100.0%) | 0 (0.0%) |
| Professional & Scientific | 0 (0.0%) | 0 (0.0%) |
| Enterprise Management | 0 (0.0%) | 0 (0.0%) |
| Administrative & Support | 0 (0.0%) | 0 (0.0%) |
| Educational Services | 0 (0.0%) | 0 (0.0%) |
| Health Care & Social Assistance | 0 (0.0%) | 0 (0.0%) |
| Arts, Entertainment & Recreation | 0 (0.0%) | 0 (0.0%) |
| Accommodation & Food Services | 82 (100.0%) | 0 (0.0%) |
| Public Administration | 57 (100.0%) | 0 (0.0%) |
| Total | 217 (75.9%) | 69 (24.1%) |
Education in Corcovado
School Enrollment in Corcovado
The most common levels of schooling among the 363 students in Corcovado are college / undergraduate (125 | 34.4%), elementary school (75 | 20.7%), and high school (75 | 20.7%).
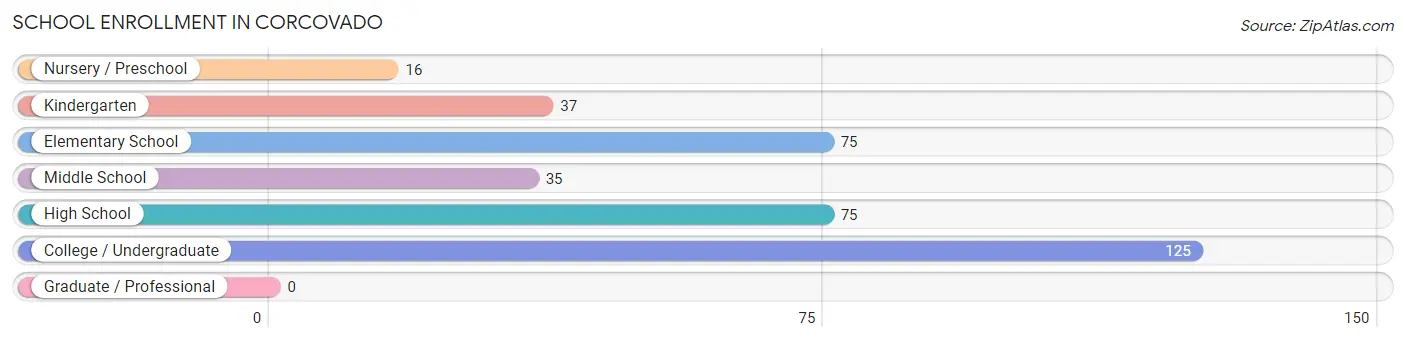
| School Level | # Students | % Students |
| Nursery / Preschool | 16 | 4.4% |
| Kindergarten | 37 | 10.2% |
| Elementary School | 75 | 20.7% |
| Middle School | 35 | 9.6% |
| High School | 75 | 20.7% |
| College / Undergraduate | 125 | 34.4% |
| Graduate / Professional | 0 | 0.0% |
| Total | 363 | 100.0% |
School Enrollment by Age by Funding Source in Corcovado
Out of a total of 363 students who are enrolled in schools in Corcovado, 28 (7.7%) attend a private institution, while the remaining 335 (92.3%) are enrolled in public schools. The age group of 35 years and over has the highest likelihood of being enrolled in private schools, with 28 (100.0% in the age bracket) enrolled. Conversely, the age group of 3 to 4 year olds has the lowest likelihood of being enrolled in a private school, with 16 (100.0% in the age bracket) attending a public institution.
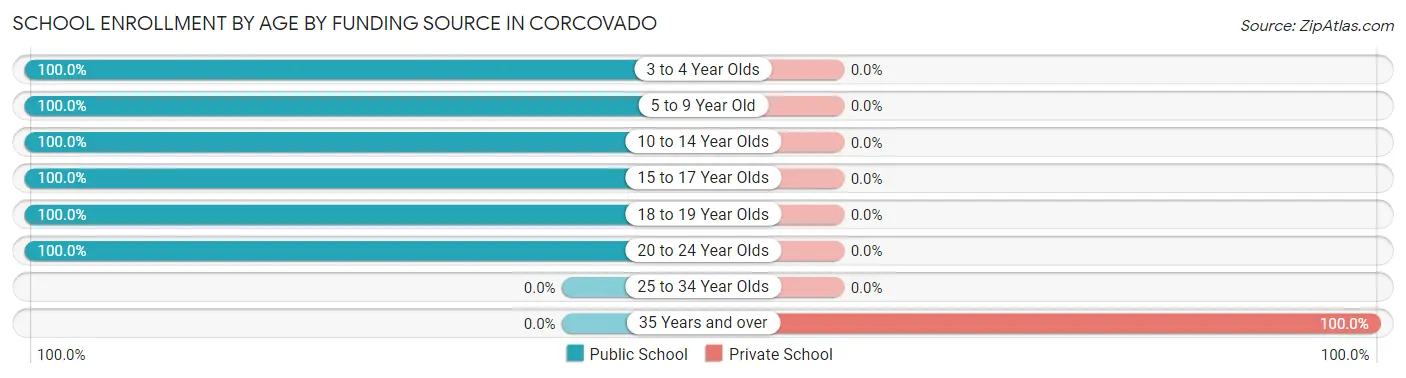
| Age Bracket | Public School | Private School |
| 3 to 4 Year Olds | 16 (100.0%) | 0 (0.0%) |
| 5 to 9 Year Old | 112 (100.0%) | 0 (0.0%) |
| 10 to 14 Year Olds | 76 (100.0%) | 0 (0.0%) |
| 15 to 17 Year Olds | 34 (100.0%) | 0 (0.0%) |
| 18 to 19 Year Olds | 45 (100.0%) | 0 (0.0%) |
| 20 to 24 Year Olds | 52 (100.0%) | 0 (0.0%) |
| 25 to 34 Year Olds | 0 (0.0%) | 0 (0.0%) |
| 35 Years and over | 0 (0.0%) | 28 (100.0%) |
| Total | 335 (92.3%) | 28 (7.7%) |
Educational Attainment by Field of Study in Corcovado
Education (98 | 31.2%), business (97 | 30.9%), arts & humanities (93 | 29.6%), and science & technology (26 | 8.3%) are the most common fields of study among 314 individuals in Corcovado who have obtained a bachelor's degree or higher.
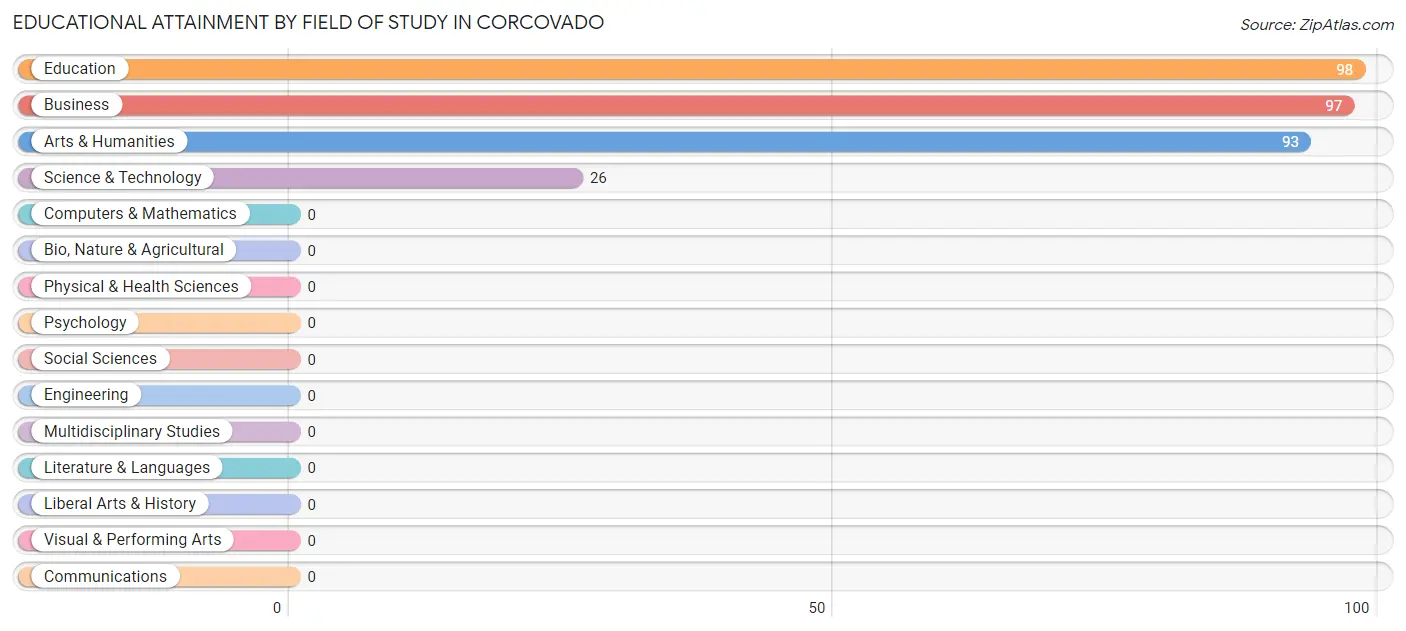
| Field of Study | # Graduates | % Graduates |
| Computers & Mathematics | 0 | 0.0% |
| Bio, Nature & Agricultural | 0 | 0.0% |
| Physical & Health Sciences | 0 | 0.0% |
| Psychology | 0 | 0.0% |
| Social Sciences | 0 | 0.0% |
| Engineering | 0 | 0.0% |
| Multidisciplinary Studies | 0 | 0.0% |
| Science & Technology | 26 | 8.3% |
| Business | 97 | 30.9% |
| Education | 98 | 31.2% |
| Literature & Languages | 0 | 0.0% |
| Liberal Arts & History | 0 | 0.0% |
| Visual & Performing Arts | 0 | 0.0% |
| Communications | 0 | 0.0% |
| Arts & Humanities | 93 | 29.6% |
| Total | 314 | 100.0% |
Transportation & Commute in Corcovado
Vehicle Availability by Sex in Corcovado
The most prevalent vehicle ownership categories in Corcovado are males with 2 vehicles (107, accounting for 49.3%) and females with 2 vehicles (69, making up 155.1%).
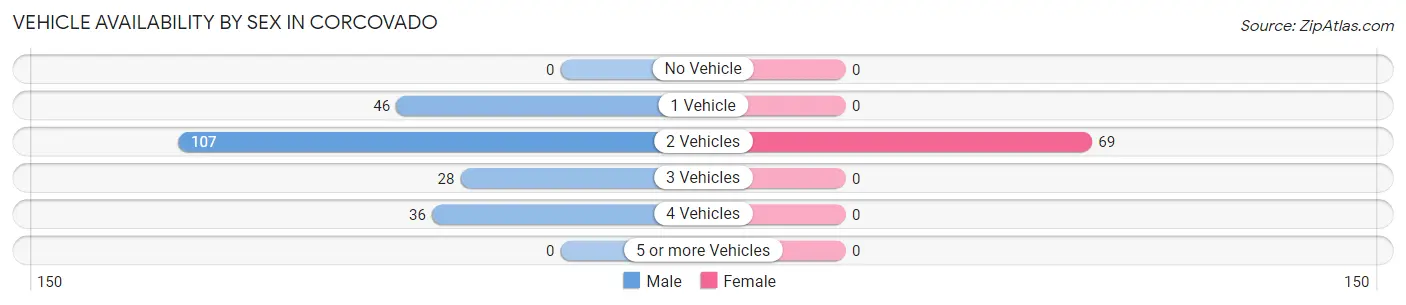
| Vehicles Available | Male | Female |
| No Vehicle | 0 (0.0%) | 0 (0.0%) |
| 1 Vehicle | 46 (21.2%) | 0 (0.0%) |
| 2 Vehicles | 107 (49.3%) | 69 (100.0%) |
| 3 Vehicles | 28 (12.9%) | 0 (0.0%) |
| 4 Vehicles | 36 (16.6%) | 0 (0.0%) |
| 5 or more Vehicles | 0 (0.0%) | 0 (0.0%) |
| Total | 217 (100.0%) | 69 (100.0%) |
Commute Time in Corcovado
The most frequently occuring commute durations in Corcovado are 10 to 14 minutes (88 commuters, 30.8%), 25 to 29 minutes (62 commuters, 21.7%), and 20 to 24 minutes (46 commuters, 16.1%).
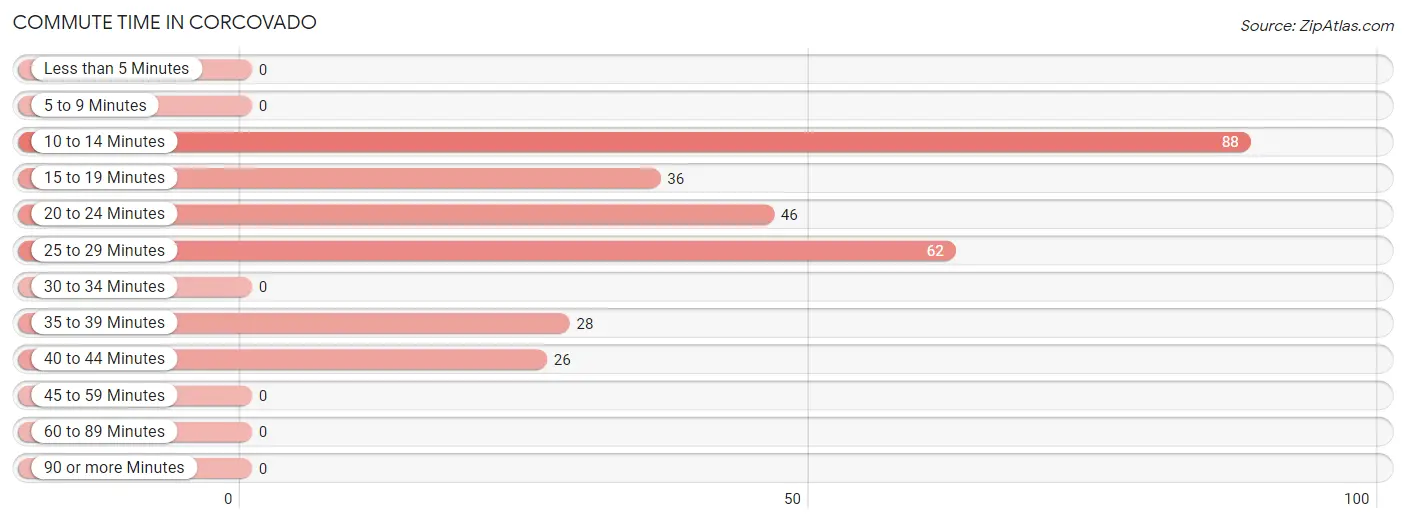
| Commute Time | # Commuters | % Commuters |
| Less than 5 Minutes | 0 | 0.0% |
| 5 to 9 Minutes | 0 | 0.0% |
| 10 to 14 Minutes | 88 | 30.8% |
| 15 to 19 Minutes | 36 | 12.6% |
| 20 to 24 Minutes | 46 | 16.1% |
| 25 to 29 Minutes | 62 | 21.7% |
| 30 to 34 Minutes | 0 | 0.0% |
| 35 to 39 Minutes | 28 | 9.8% |
| 40 to 44 Minutes | 26 | 9.1% |
| 45 to 59 Minutes | 0 | 0.0% |
| 60 to 89 Minutes | 0 | 0.0% |
| 90 or more Minutes | 0 | 0.0% |
Commute Time by Sex in Corcovado
The most common commute times in Corcovado are 10 to 14 minutes (88 commuters, 40.6%) for males and 15 to 19 minutes (36 commuters, 52.2%) for females.
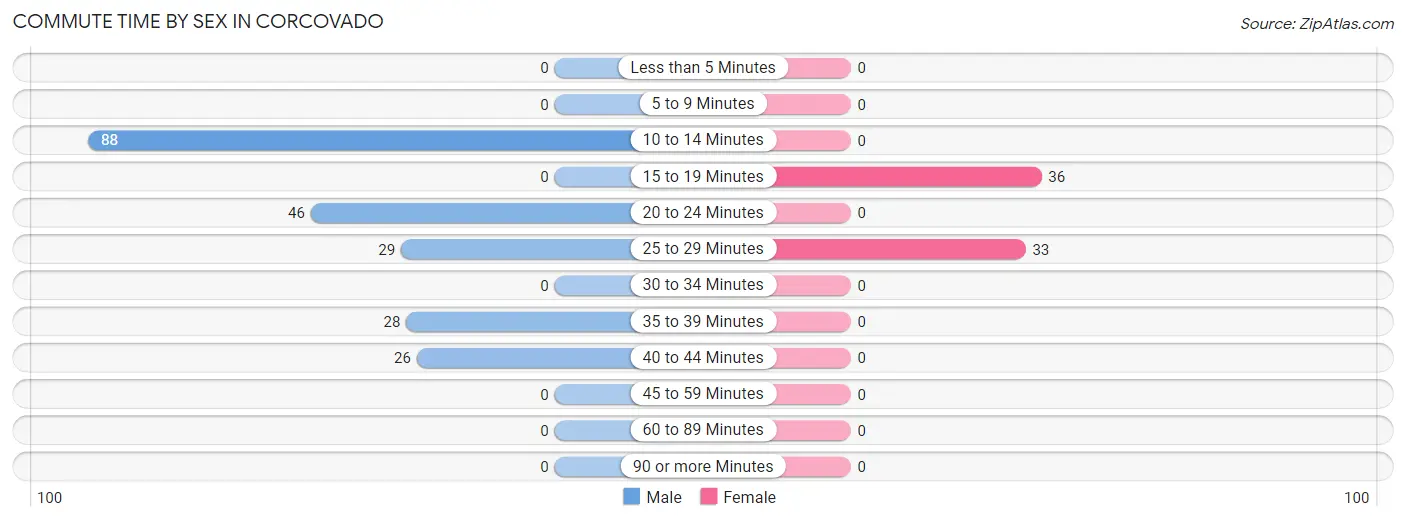
| Commute Time | Male | Female |
| Less than 5 Minutes | 0 (0.0%) | 0 (0.0%) |
| 5 to 9 Minutes | 0 (0.0%) | 0 (0.0%) |
| 10 to 14 Minutes | 88 (40.6%) | 0 (0.0%) |
| 15 to 19 Minutes | 0 (0.0%) | 36 (52.2%) |
| 20 to 24 Minutes | 46 (21.2%) | 0 (0.0%) |
| 25 to 29 Minutes | 29 (13.4%) | 33 (47.8%) |
| 30 to 34 Minutes | 0 (0.0%) | 0 (0.0%) |
| 35 to 39 Minutes | 28 (12.9%) | 0 (0.0%) |
| 40 to 44 Minutes | 26 (12.0%) | 0 (0.0%) |
| 45 to 59 Minutes | 0 (0.0%) | 0 (0.0%) |
| 60 to 89 Minutes | 0 (0.0%) | 0 (0.0%) |
| 90 or more Minutes | 0 (0.0%) | 0 (0.0%) |
Time of Departure to Work by Sex in Corcovado
The most frequent times of departure to work in Corcovado are 12:00 AM to 4:59 AM (46, 21.2%) for males and 9:00 AM to 9:59 AM (36, 52.2%) for females.
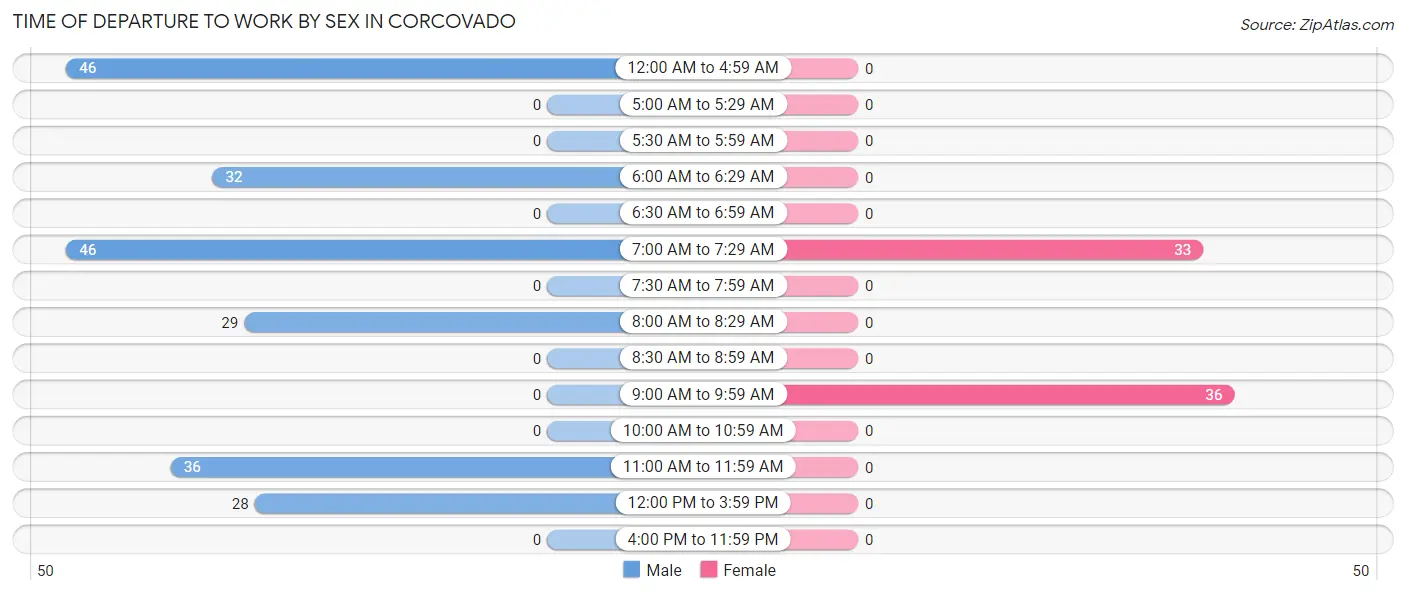
| Time of Departure | Male | Female |
| 12:00 AM to 4:59 AM | 46 (21.2%) | 0 (0.0%) |
| 5:00 AM to 5:29 AM | 0 (0.0%) | 0 (0.0%) |
| 5:30 AM to 5:59 AM | 0 (0.0%) | 0 (0.0%) |
| 6:00 AM to 6:29 AM | 32 (14.7%) | 0 (0.0%) |
| 6:30 AM to 6:59 AM | 0 (0.0%) | 0 (0.0%) |
| 7:00 AM to 7:29 AM | 46 (21.2%) | 33 (47.8%) |
| 7:30 AM to 7:59 AM | 0 (0.0%) | 0 (0.0%) |
| 8:00 AM to 8:29 AM | 29 (13.4%) | 0 (0.0%) |
| 8:30 AM to 8:59 AM | 0 (0.0%) | 0 (0.0%) |
| 9:00 AM to 9:59 AM | 0 (0.0%) | 36 (52.2%) |
| 10:00 AM to 10:59 AM | 0 (0.0%) | 0 (0.0%) |
| 11:00 AM to 11:59 AM | 36 (16.6%) | 0 (0.0%) |
| 12:00 PM to 3:59 PM | 28 (12.9%) | 0 (0.0%) |
| 4:00 PM to 11:59 PM | 0 (0.0%) | 0 (0.0%) |
| Total | 217 (100.0%) | 69 (100.0%) |
Housing Occupancy in Corcovado
Occupancy by Ownership in Corcovado
Of the total 375 dwellings in Corcovado, owner-occupied units account for 249 (66.4%), while renter-occupied units make up 126 (33.6%).
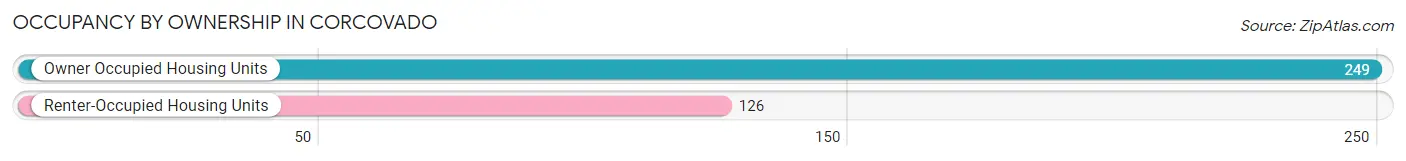
| Occupancy | # Housing Units | % Housing Units |
| Owner Occupied Housing Units | 249 | 66.4% |
| Renter-Occupied Housing Units | 126 | 33.6% |
| Total Occupied Housing Units | 375 | 100.0% |
Occupancy by Household Size in Corcovado
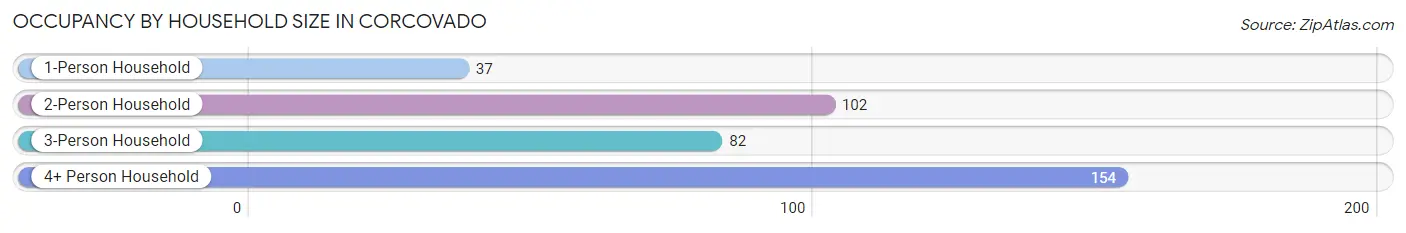
| Household Size | # Housing Units | % Housing Units |
| 1-Person Household | 37 | 9.9% |
| 2-Person Household | 102 | 27.2% |
| 3-Person Household | 82 | 21.9% |
| 4+ Person Household | 154 | 41.1% |
| Total Housing Units | 375 | 100.0% |
Occupancy by Ownership by Household Size in Corcovado
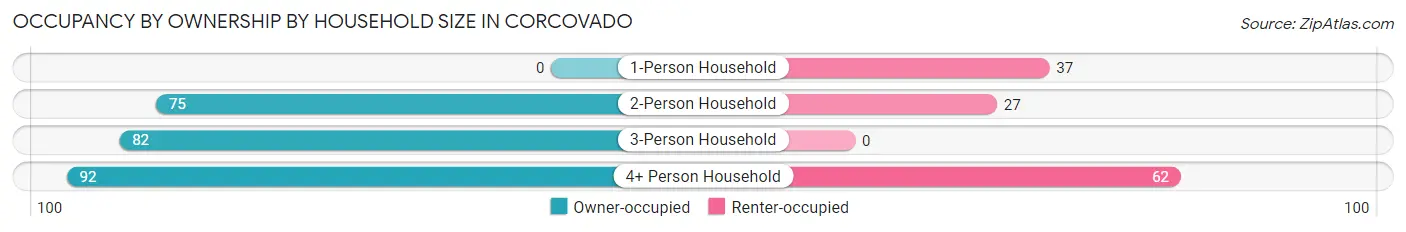
| Household Size | Owner-occupied | Renter-occupied |
| 1-Person Household | 0 (0.0%) | 37 (100.0%) |
| 2-Person Household | 75 (73.5%) | 27 (26.5%) |
| 3-Person Household | 82 (100.0%) | 0 (0.0%) |
| 4+ Person Household | 92 (59.7%) | 62 (40.3%) |
| Total Housing Units | 249 (66.4%) | 126 (33.6%) |
Occupancy by Educational Attainment in Corcovado
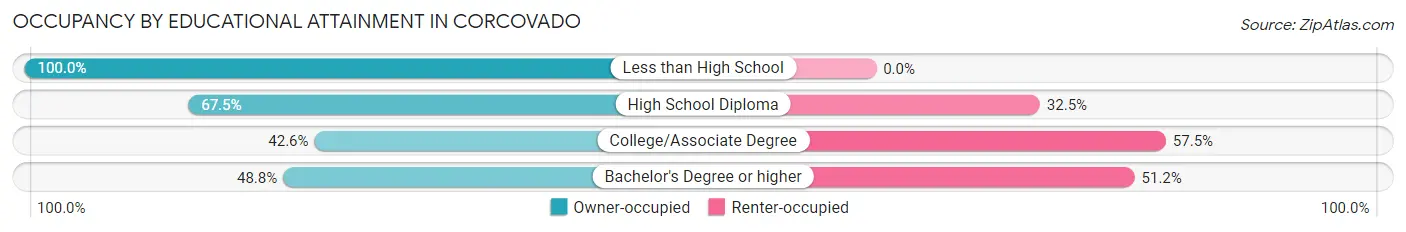
| Household Size | Owner-occupied | Renter-occupied |
| Less than High School | 93 (100.0%) | 0 (0.0%) |
| High School Diploma | 77 (67.5%) | 37 (32.5%) |
| College/Associate Degree | 20 (42.5%) | 27 (57.5%) |
| Bachelor's Degree or higher | 59 (48.8%) | 62 (51.2%) |
Occupancy by Age of Householder in Corcovado
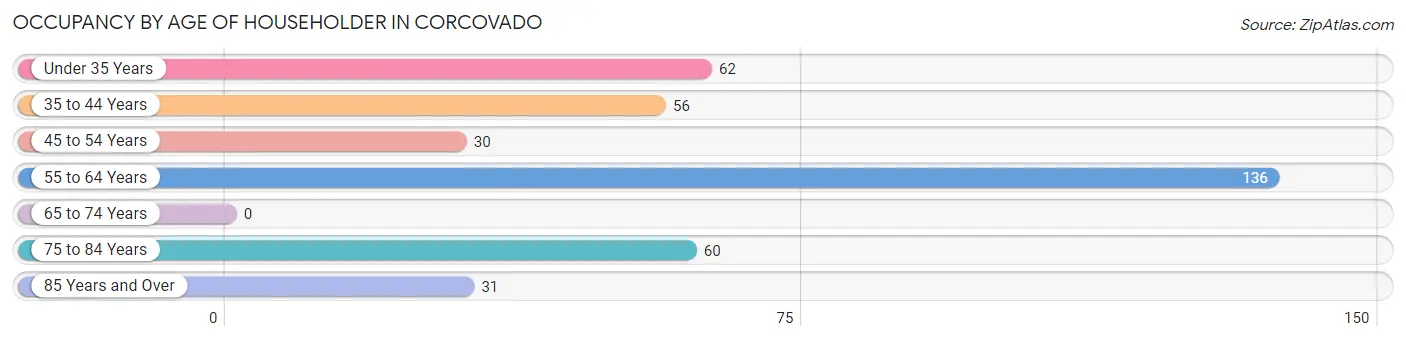
| Age Bracket | # Households | % Households |
| Under 35 Years | 62 | 16.5% |
| 35 to 44 Years | 56 | 14.9% |
| 45 to 54 Years | 30 | 8.0% |
| 55 to 64 Years | 136 | 36.3% |
| 65 to 74 Years | 0 | 0.0% |
| 75 to 84 Years | 60 | 16.0% |
| 85 Years and Over | 31 | 8.3% |
| Total | 375 | 100.0% |
Housing Finances in Corcovado
Median Income by Occupancy in Corcovado
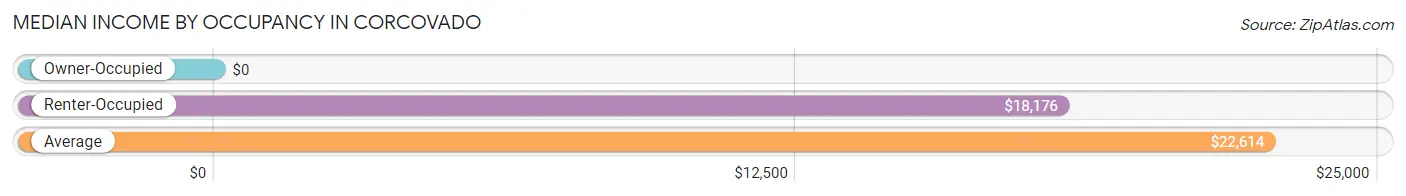
| Occupancy Type | # Households | Median Income |
| Owner-Occupied | 249 (66.4%) | $0 |
| Renter-Occupied | 126 (33.6%) | $18,176 |
| Average | 375 (100.0%) | $22,614 |
Occupancy by Householder Income Bracket in Corcovado
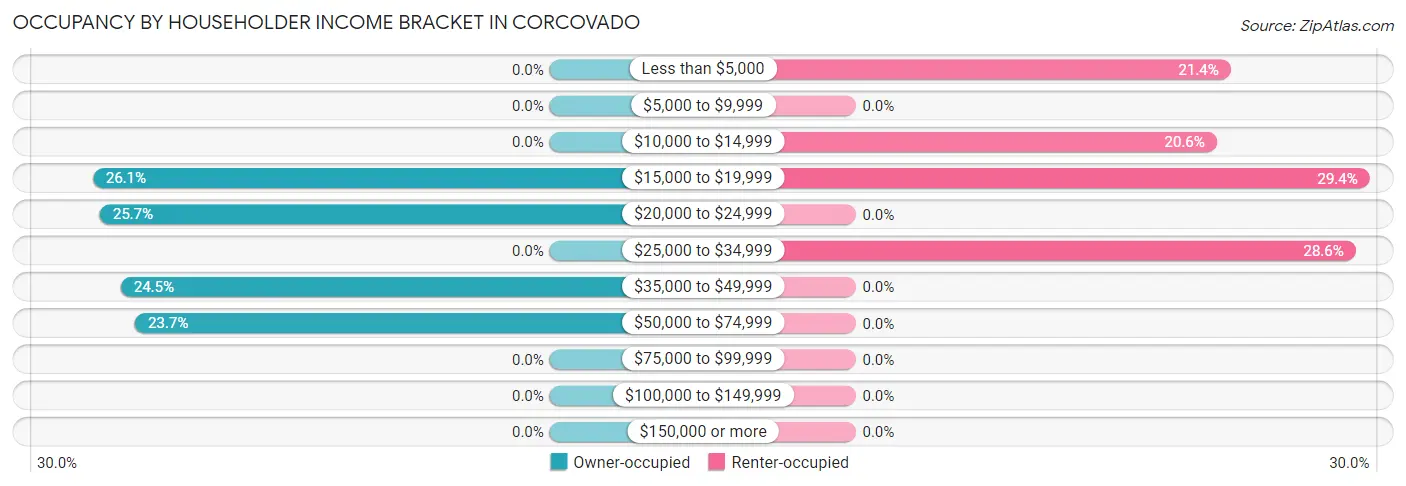
| Income Bracket | Owner-occupied | Renter-occupied |
| Less than $5,000 | 0 (0.0%) | 27 (21.4%) |
| $5,000 to $9,999 | 0 (0.0%) | 0 (0.0%) |
| $10,000 to $14,999 | 0 (0.0%) | 26 (20.6%) |
| $15,000 to $19,999 | 65 (26.1%) | 37 (29.4%) |
| $20,000 to $24,999 | 64 (25.7%) | 0 (0.0%) |
| $25,000 to $34,999 | 0 (0.0%) | 36 (28.6%) |
| $35,000 to $49,999 | 61 (24.5%) | 0 (0.0%) |
| $50,000 to $74,999 | 59 (23.7%) | 0 (0.0%) |
| $75,000 to $99,999 | 0 (0.0%) | 0 (0.0%) |
| $100,000 to $149,999 | 0 (0.0%) | 0 (0.0%) |
| $150,000 or more | 0 (0.0%) | 0 (0.0%) |
| Total | 249 (100.0%) | 126 (100.0%) |
Monthly Housing Cost Tiers in Corcovado
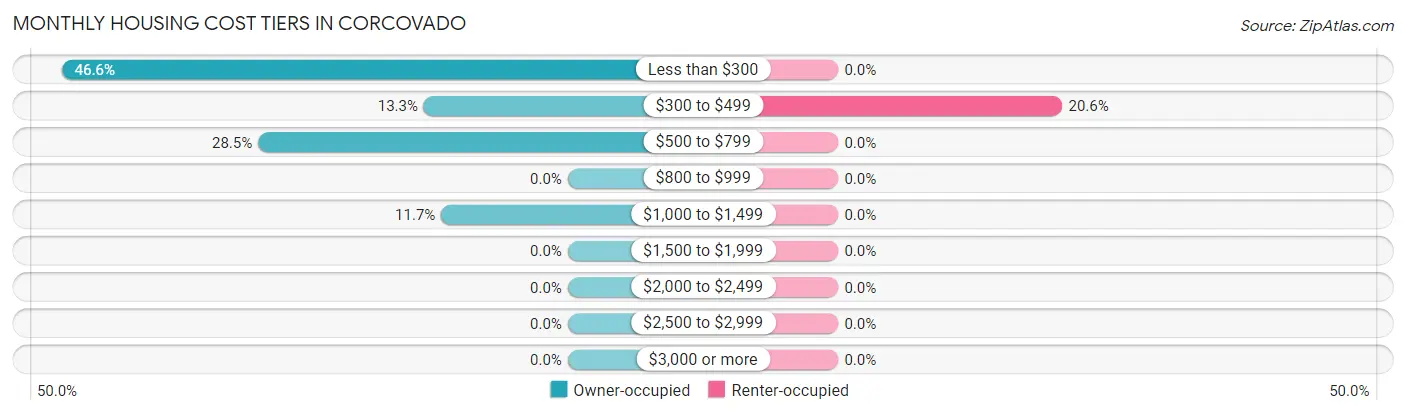
| Monthly Cost | Owner-occupied | Renter-occupied |
| Less than $300 | 116 (46.6%) | 0 (0.0%) |
| $300 to $499 | 33 (13.3%) | 26 (20.6%) |
| $500 to $799 | 71 (28.5%) | 0 (0.0%) |
| $800 to $999 | 0 (0.0%) | 0 (0.0%) |
| $1,000 to $1,499 | 29 (11.7%) | 0 (0.0%) |
| $1,500 to $1,999 | 0 (0.0%) | 0 (0.0%) |
| $2,000 to $2,499 | 0 (0.0%) | 0 (0.0%) |
| $2,500 to $2,999 | 0 (0.0%) | 0 (0.0%) |
| $3,000 or more | 0 (0.0%) | 0 (0.0%) |
| Total | 249 (100.0%) | 126 (100.0%) |
Physical Housing Characteristics in Corcovado
Housing Structures in Corcovado
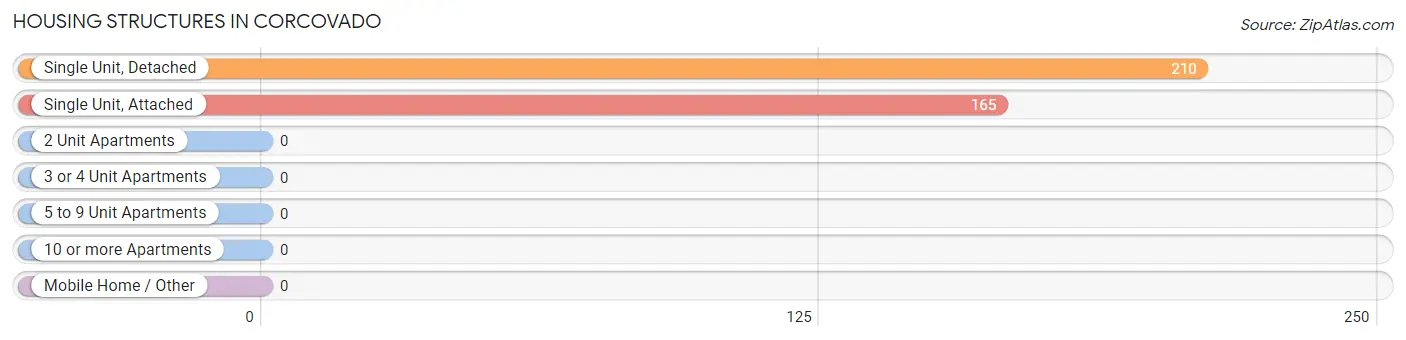
| Structure Type | # Housing Units | % Housing Units |
| Single Unit, Detached | 210 | 56.0% |
| Single Unit, Attached | 165 | 44.0% |
| 2 Unit Apartments | 0 | 0.0% |
| 3 or 4 Unit Apartments | 0 | 0.0% |
| 5 to 9 Unit Apartments | 0 | 0.0% |
| 10 or more Apartments | 0 | 0.0% |
| Mobile Home / Other | 0 | 0.0% |
| Total | 375 | 100.0% |
Housing Structures by Occupancy in Corcovado
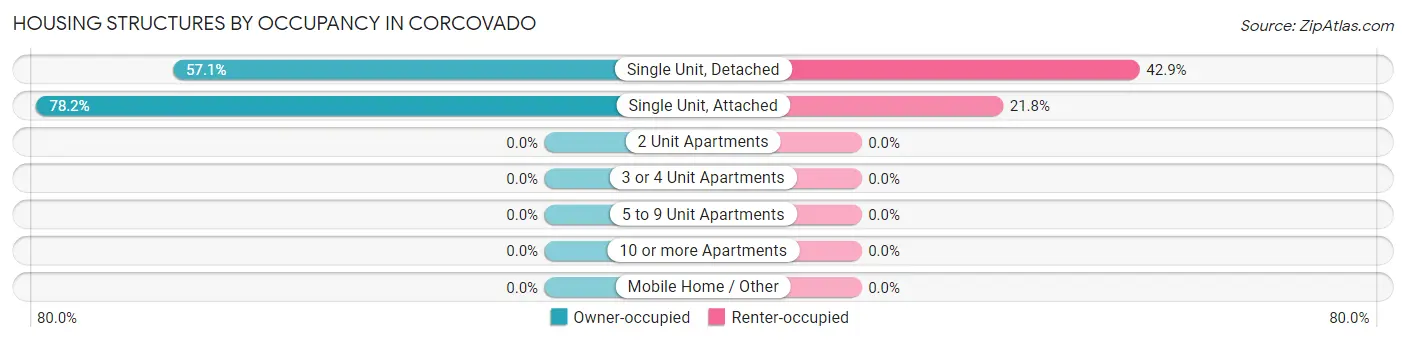
| Structure Type | Owner-occupied | Renter-occupied |
| Single Unit, Detached | 120 (57.1%) | 90 (42.9%) |
| Single Unit, Attached | 129 (78.2%) | 36 (21.8%) |
| 2 Unit Apartments | 0 (0.0%) | 0 (0.0%) |
| 3 or 4 Unit Apartments | 0 (0.0%) | 0 (0.0%) |
| 5 to 9 Unit Apartments | 0 (0.0%) | 0 (0.0%) |
| 10 or more Apartments | 0 (0.0%) | 0 (0.0%) |
| Mobile Home / Other | 0 (0.0%) | 0 (0.0%) |
| Total | 249 (66.4%) | 126 (33.6%) |
Housing Structures by Number of Rooms in Corcovado
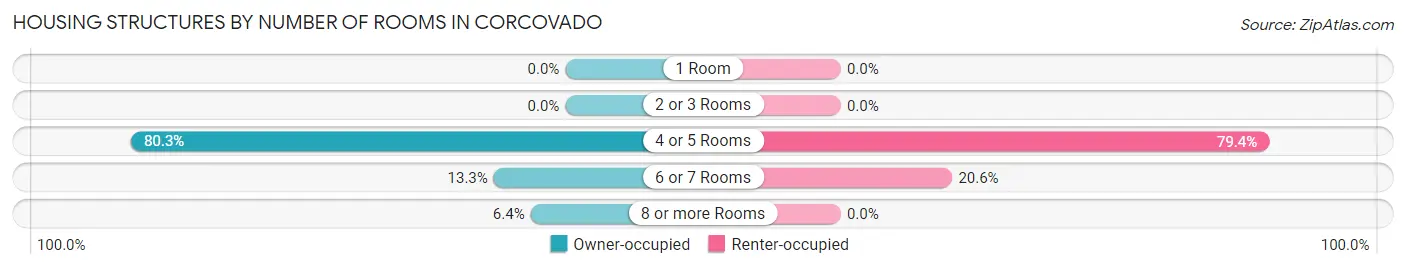
| Number of Rooms | Owner-occupied | Renter-occupied |
| 1 Room | 0 (0.0%) | 0 (0.0%) |
| 2 or 3 Rooms | 0 (0.0%) | 0 (0.0%) |
| 4 or 5 Rooms | 200 (80.3%) | 100 (79.4%) |
| 6 or 7 Rooms | 33 (13.3%) | 26 (20.6%) |
| 8 or more Rooms | 16 (6.4%) | 0 (0.0%) |
| Total | 249 (100.0%) | 126 (100.0%) |
Housing Structure by Heating Type in Corcovado
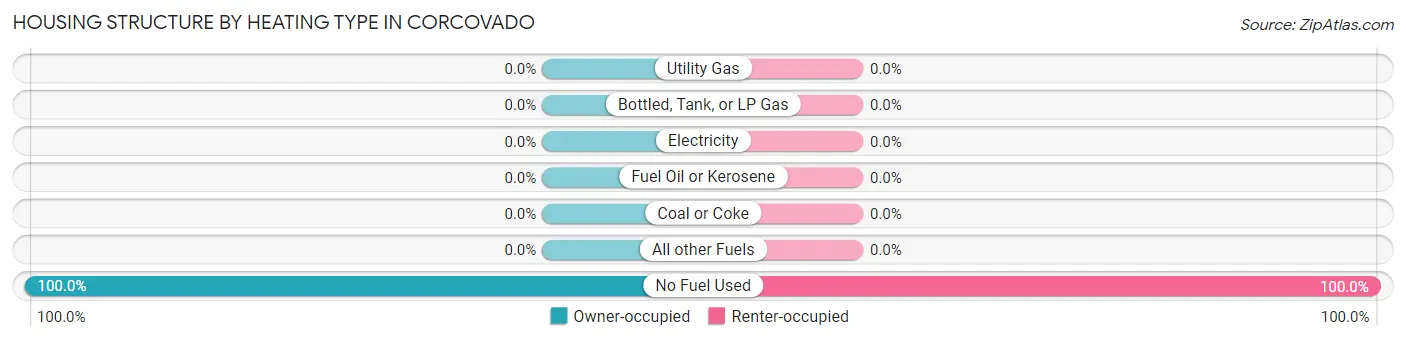
| Heating Type | Owner-occupied | Renter-occupied |
| Utility Gas | 0 (0.0%) | 0 (0.0%) |
| Bottled, Tank, or LP Gas | 0 (0.0%) | 0 (0.0%) |
| Electricity | 0 (0.0%) | 0 (0.0%) |
| Fuel Oil or Kerosene | 0 (0.0%) | 0 (0.0%) |
| Coal or Coke | 0 (0.0%) | 0 (0.0%) |
| All other Fuels | 0 (0.0%) | 0 (0.0%) |
| No Fuel Used | 249 (100.0%) | 126 (100.0%) |
| Total | 249 (100.0%) | 126 (100.0%) |
Household Vehicle Usage in Corcovado
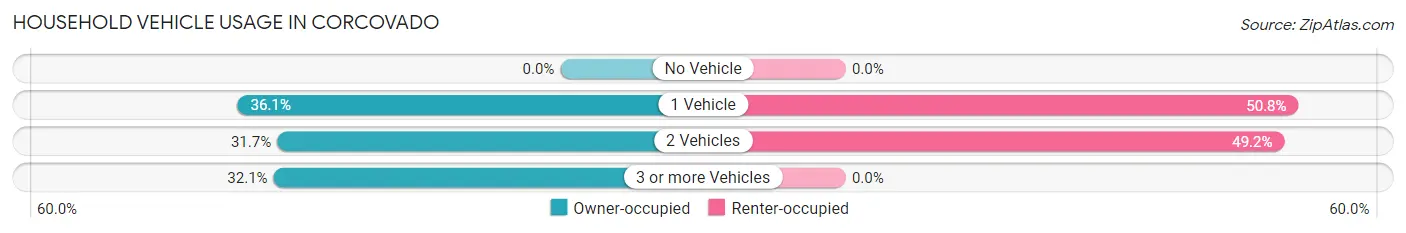
| Vehicles per Household | Owner-occupied | Renter-occupied |
| No Vehicle | 0 (0.0%) | 0 (0.0%) |
| 1 Vehicle | 90 (36.1%) | 64 (50.8%) |
| 2 Vehicles | 79 (31.7%) | 62 (49.2%) |
| 3 or more Vehicles | 80 (32.1%) | 0 (0.0%) |
| Total | 249 (100.0%) | 126 (100.0%) |
Real Estate & Mortgages in Corcovado
Real Estate and Mortgage Overview in Corcovado
| Characteristic | Without Mortgage | With Mortgage |
| Housing Units | 149 | 100 |
| Median Property Value | $56,400 | $98,600 |
| Median Household Income | $20,766 | $0 |
| Monthly Housing Costs | $190 | $0 |
| Real Estate Taxes | - | - |
Property Value by Mortgage Status in Corcovado
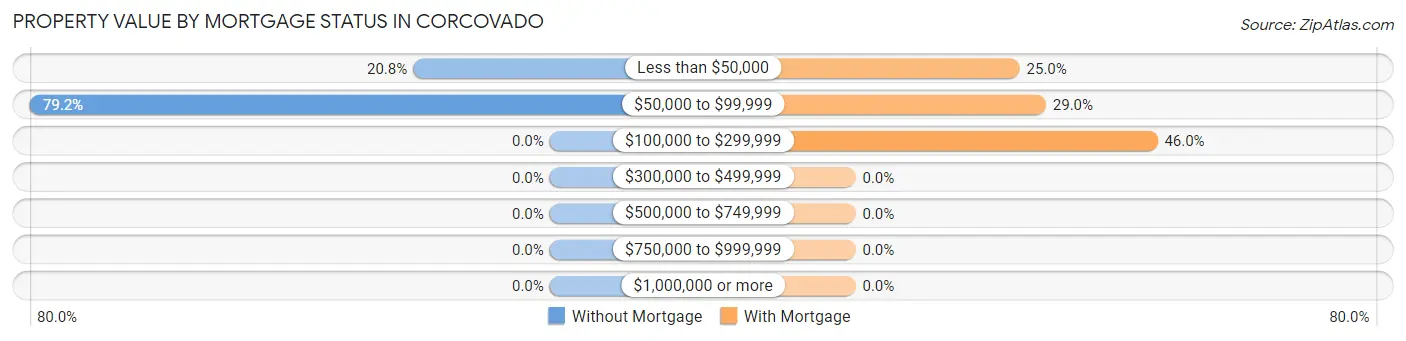
| Property Value | Without Mortgage | With Mortgage |
| Less than $50,000 | 31 (20.8%) | 25 (25.0%) |
| $50,000 to $99,999 | 118 (79.2%) | 29 (29.0%) |
| $100,000 to $299,999 | 0 (0.0%) | 46 (46.0%) |
| $300,000 to $499,999 | 0 (0.0%) | 0 (0.0%) |
| $500,000 to $749,999 | 0 (0.0%) | 0 (0.0%) |
| $750,000 to $999,999 | 0 (0.0%) | 0 (0.0%) |
| $1,000,000 or more | 0 (0.0%) | 0 (0.0%) |
| Total | 149 (100.0%) | 100 (100.0%) |
Household Income by Mortgage Status in Corcovado
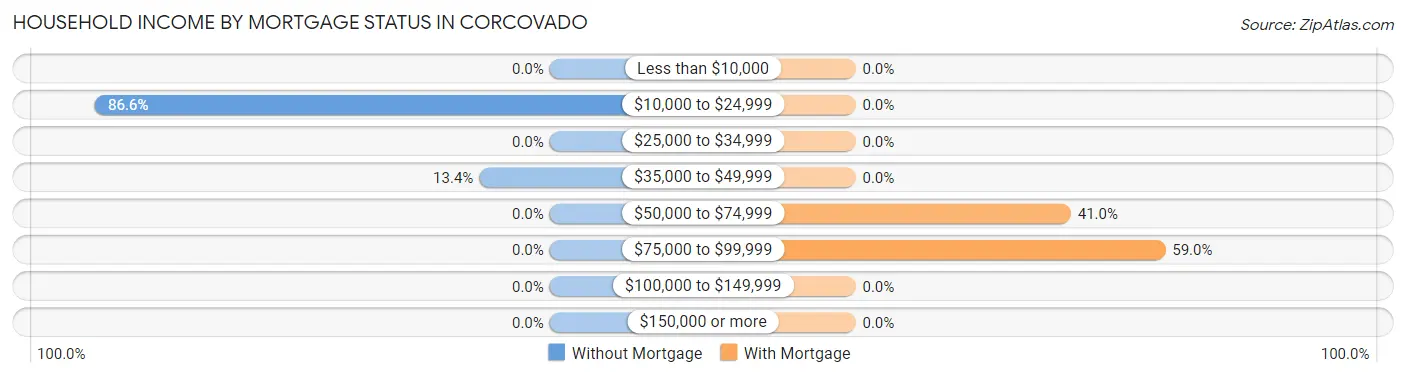
| Household Income | Without Mortgage | With Mortgage |
| Less than $10,000 | 0 (0.0%) | 0 (0.0%) |
| $10,000 to $24,999 | 129 (86.6%) | 0 (0.0%) |
| $25,000 to $34,999 | 0 (0.0%) | 0 (0.0%) |
| $35,000 to $49,999 | 20 (13.4%) | 0 (0.0%) |
| $50,000 to $74,999 | 0 (0.0%) | 41 (41.0%) |
| $75,000 to $99,999 | 0 (0.0%) | 59 (59.0%) |
| $100,000 to $149,999 | 0 (0.0%) | 0 (0.0%) |
| $150,000 or more | 0 (0.0%) | 0 (0.0%) |
| Total | 149 (100.0%) | 100 (100.0%) |
Property Value to Household Income Ratio in Corcovado
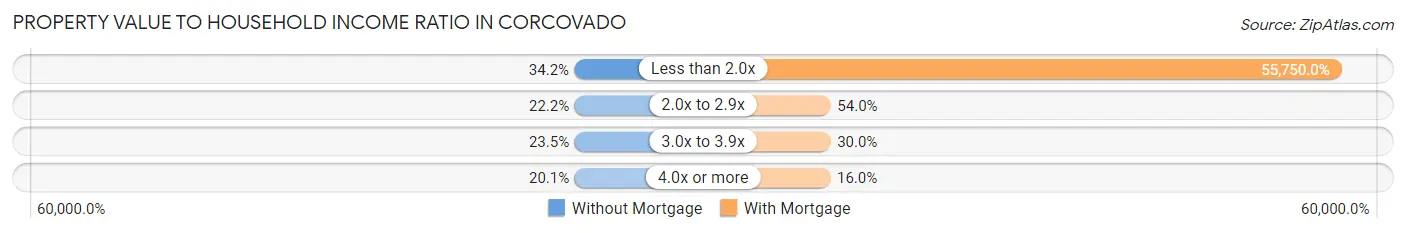
| Value-to-Income Ratio | Without Mortgage | With Mortgage |
| Less than 2.0x | 51 (34.2%) | 55,750 (55,750.0%) |
| 2.0x to 2.9x | 33 (22.2%) | 54 (54.0%) |
| 3.0x to 3.9x | 35 (23.5%) | 30 (30.0%) |
| 4.0x or more | 30 (20.1%) | 16 (16.0%) |
| Total | 149 (100.0%) | 100 (100.0%) |
Real Estate Taxes by Mortgage Status in Corcovado
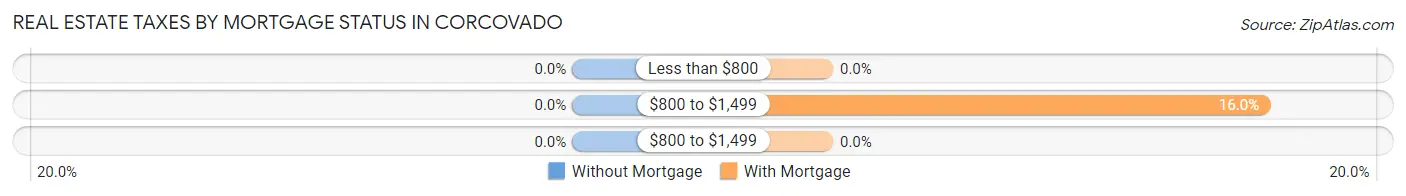
| Property Taxes | Without Mortgage | With Mortgage |
| Less than $800 | 0 (0.0%) | 0 (0.0%) |
| $800 to $1,499 | 0 (0.0%) | 16 (16.0%) |
| $800 to $1,499 | 0 (0.0%) | 0 (0.0%) |
| Total | 149 (100.0%) | 100 (100.0%) |
Health & Disability in Corcovado
Health Insurance Coverage by Age in Corcovado
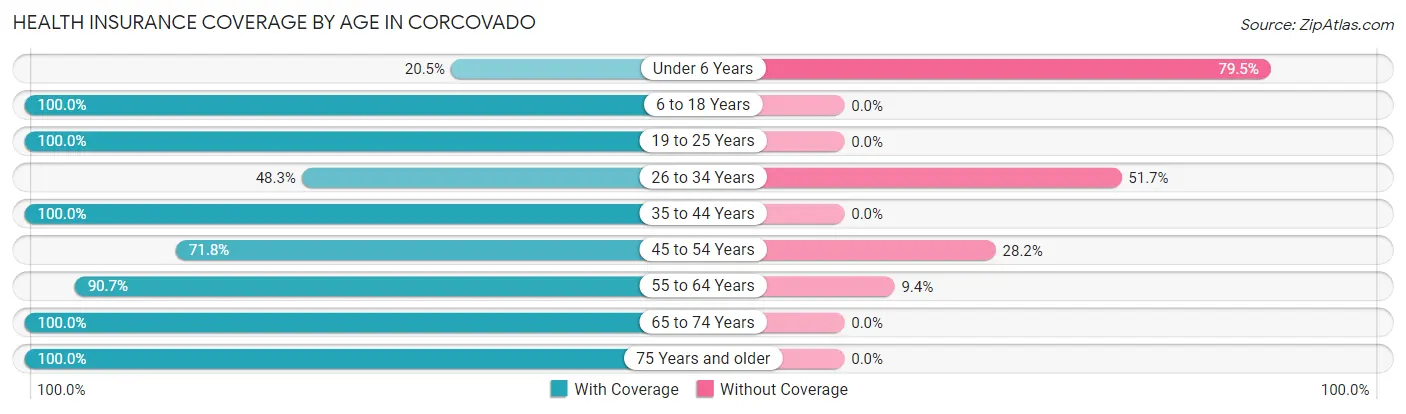
| Age Bracket | With Coverage | Without Coverage |
| Under 6 Years | 16 (20.5%) | 62 (79.5%) |
| 6 to 18 Years | 199 (100.0%) | 0 (0.0%) |
| 19 to 25 Years | 119 (100.0%) | 0 (0.0%) |
| 26 to 34 Years | 58 (48.3%) | 62 (51.7%) |
| 35 to 44 Years | 117 (100.0%) | 0 (0.0%) |
| 45 to 54 Years | 117 (71.8%) | 46 (28.2%) |
| 55 to 64 Years | 194 (90.6%) | 20 (9.3%) |
| 65 to 74 Years | 101 (100.0%) | 0 (0.0%) |
| 75 Years and older | 194 (100.0%) | 0 (0.0%) |
| Total | 1,115 (85.4%) | 190 (14.6%) |
Health Insurance Coverage by Citizenship Status in Corcovado
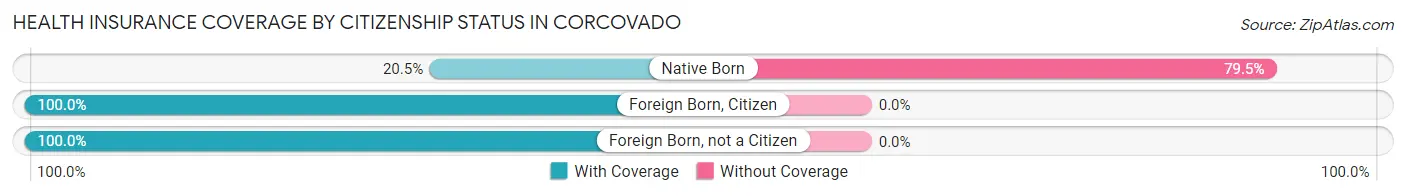
| Citizenship Status | With Coverage | Without Coverage |
| Native Born | 16 (20.5%) | 62 (79.5%) |
| Foreign Born, Citizen | 199 (100.0%) | 0 (0.0%) |
| Foreign Born, not a Citizen | 119 (100.0%) | 0 (0.0%) |
Health Insurance Coverage by Household Income in Corcovado
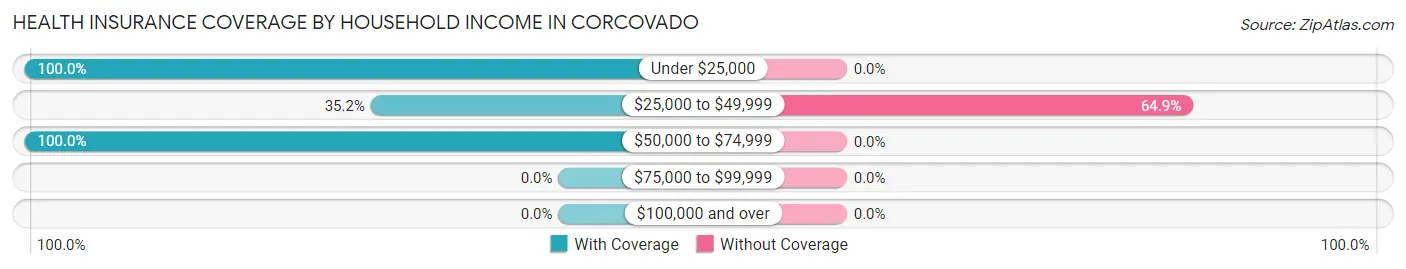
| Household Income | With Coverage | Without Coverage |
| Under $25,000 | 762 (100.0%) | 0 (0.0%) |
| $25,000 to $49,999 | 103 (35.1%) | 190 (64.8%) |
| $50,000 to $74,999 | 250 (100.0%) | 0 (0.0%) |
| $75,000 to $99,999 | 0 (0.0%) | 0 (0.0%) |
| $100,000 and over | 0 (0.0%) | 0 (0.0%) |
Public vs Private Health Insurance Coverage by Age in Corcovado
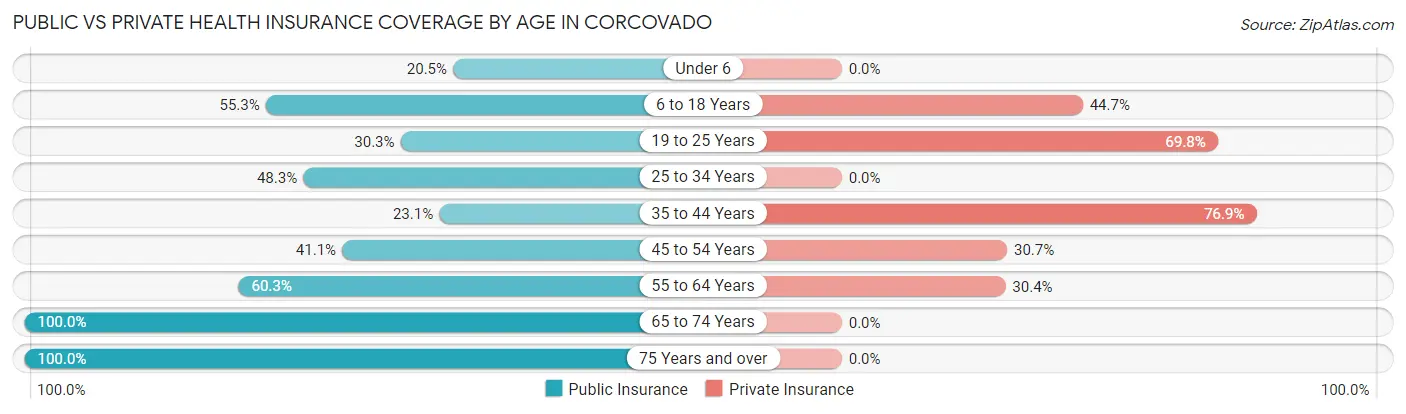
| Age Bracket | Public Insurance | Private Insurance |
| Under 6 | 16 (20.5%) | 0 (0.0%) |
| 6 to 18 Years | 110 (55.3%) | 89 (44.7%) |
| 19 to 25 Years | 36 (30.2%) | 83 (69.8%) |
| 25 to 34 Years | 58 (48.3%) | 0 (0.0%) |
| 35 to 44 Years | 27 (23.1%) | 90 (76.9%) |
| 45 to 54 Years | 67 (41.1%) | 50 (30.7%) |
| 55 to 64 Years | 129 (60.3%) | 65 (30.4%) |
| 65 to 74 Years | 101 (100.0%) | 0 (0.0%) |
| 75 Years and over | 194 (100.0%) | 0 (0.0%) |
| Total | 738 (56.6%) | 377 (28.9%) |
Disability Status by Sex by Age in Corcovado
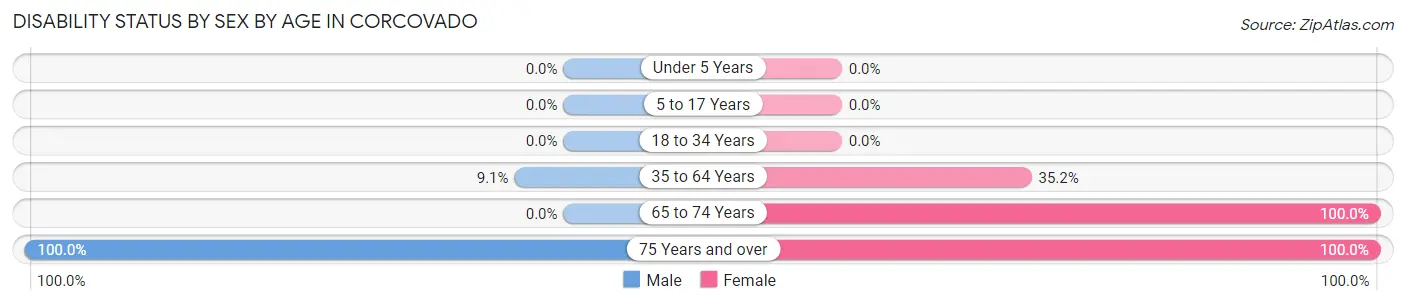
| Age Bracket | Male | Female |
| Under 5 Years | 0 (0.0%) | 0 (0.0%) |
| 5 to 17 Years | 0 (0.0%) | 0 (0.0%) |
| 18 to 34 Years | 0 (0.0%) | 0 (0.0%) |
| 35 to 64 Years | 16 (9.1%) | 112 (35.2%) |
| 65 to 74 Years | 0 (0.0%) | 48 (100.0%) |
| 75 Years and over | 133 (100.0%) | 61 (100.0%) |
Disability Class by Sex by Age in Corcovado
Disability Class: Hearing Difficulty
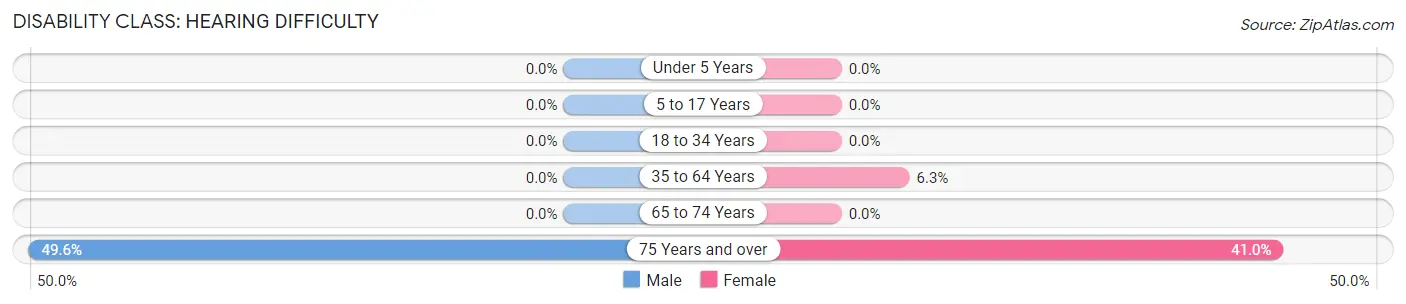
| Age Bracket | Male | Female |
| Under 5 Years | 0 (0.0%) | 0 (0.0%) |
| 5 to 17 Years | 0 (0.0%) | 0 (0.0%) |
| 18 to 34 Years | 0 (0.0%) | 0 (0.0%) |
| 35 to 64 Years | 0 (0.0%) | 20 (6.3%) |
| 65 to 74 Years | 0 (0.0%) | 0 (0.0%) |
| 75 Years and over | 66 (49.6%) | 25 (41.0%) |
Disability Class: Vision Difficulty
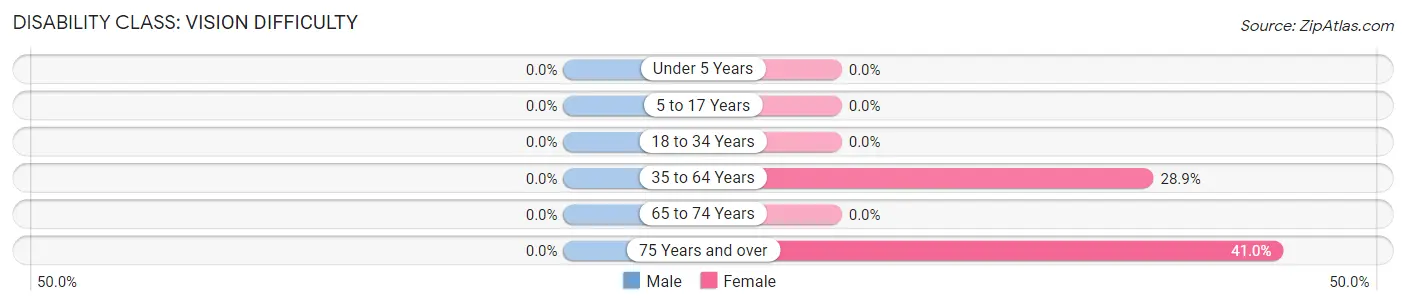
| Age Bracket | Male | Female |
| Under 5 Years | 0 (0.0%) | 0 (0.0%) |
| 5 to 17 Years | 0 (0.0%) | 0 (0.0%) |
| 18 to 34 Years | 0 (0.0%) | 0 (0.0%) |
| 35 to 64 Years | 0 (0.0%) | 92 (28.9%) |
| 65 to 74 Years | 0 (0.0%) | 0 (0.0%) |
| 75 Years and over | 0 (0.0%) | 25 (41.0%) |
Disability Class: Cognitive Difficulty
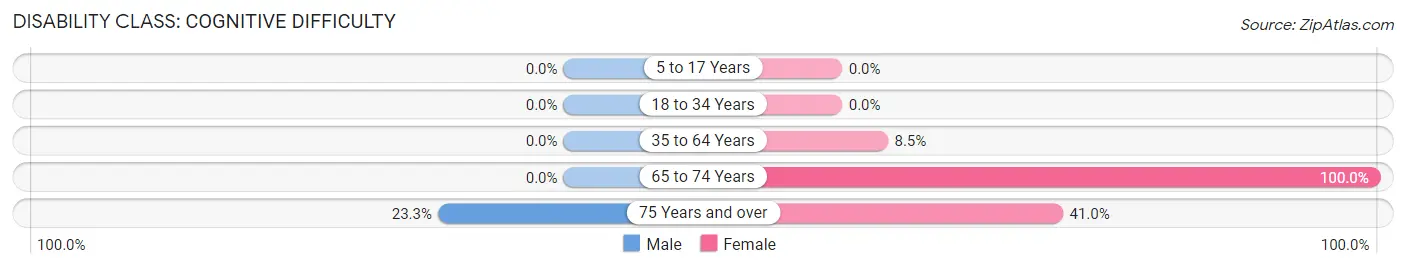
| Age Bracket | Male | Female |
| 5 to 17 Years | 0 (0.0%) | 0 (0.0%) |
| 18 to 34 Years | 0 (0.0%) | 0 (0.0%) |
| 35 to 64 Years | 0 (0.0%) | 27 (8.5%) |
| 65 to 74 Years | 0 (0.0%) | 48 (100.0%) |
| 75 Years and over | 31 (23.3%) | 25 (41.0%) |
Disability Class: Ambulatory Difficulty
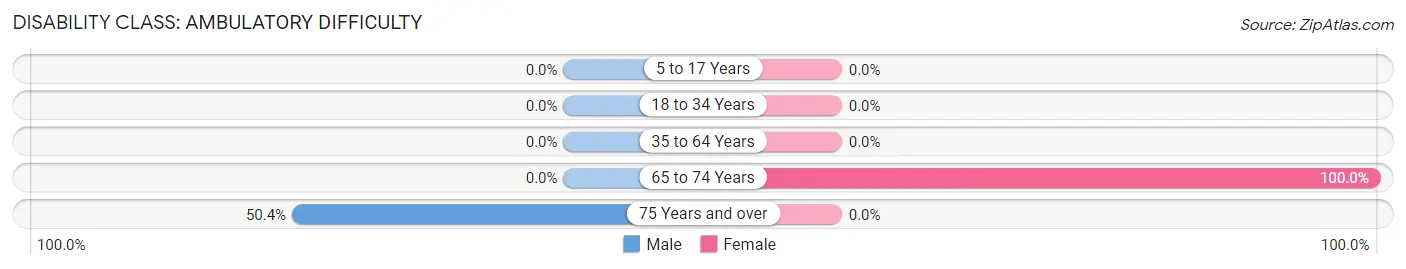
| Age Bracket | Male | Female |
| 5 to 17 Years | 0 (0.0%) | 0 (0.0%) |
| 18 to 34 Years | 0 (0.0%) | 0 (0.0%) |
| 35 to 64 Years | 0 (0.0%) | 0 (0.0%) |
| 65 to 74 Years | 0 (0.0%) | 48 (100.0%) |
| 75 Years and over | 67 (50.4%) | 0 (0.0%) |
Disability Class: Self-Care Difficulty
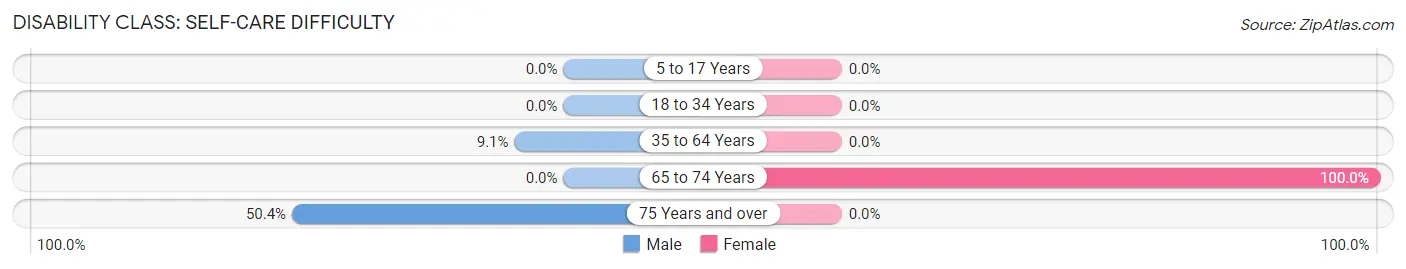
| Age Bracket | Male | Female |
| 5 to 17 Years | 0 (0.0%) | 0 (0.0%) |
| 18 to 34 Years | 0 (0.0%) | 0 (0.0%) |
| 35 to 64 Years | 16 (9.1%) | 0 (0.0%) |
| 65 to 74 Years | 0 (0.0%) | 48 (100.0%) |
| 75 Years and over | 67 (50.4%) | 0 (0.0%) |
Technology Access in Corcovado
Computing Device Access in Corcovado
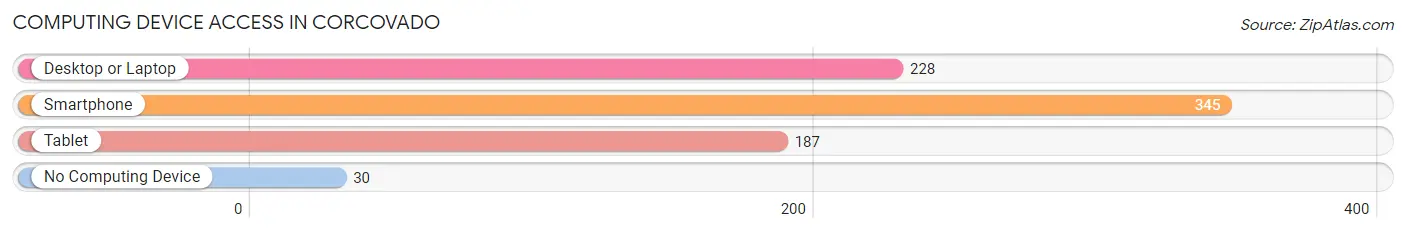
| Device Type | # Households | % Households |
| Desktop or Laptop | 228 | 60.8% |
| Smartphone | 345 | 92.0% |
| Tablet | 187 | 49.9% |
| No Computing Device | 30 | 8.0% |
| Total | 375 | 100.0% |
Internet Access in Corcovado
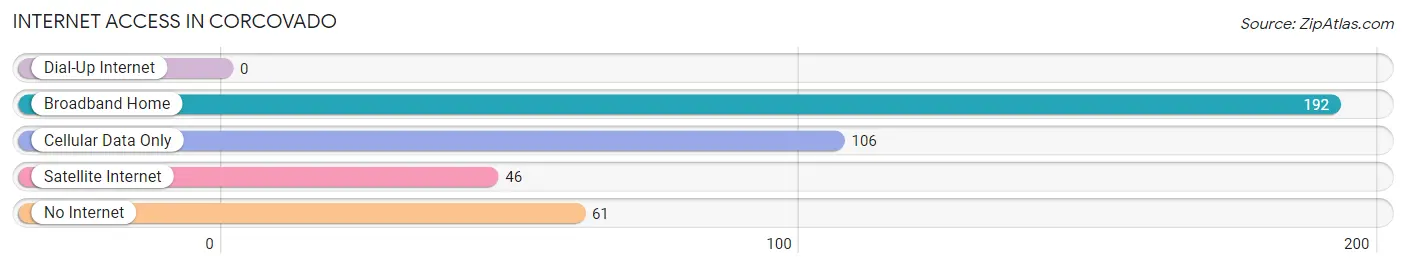
| Internet Type | # Households | % Households |
| Dial-Up Internet | 0 | 0.0% |
| Broadband Home | 192 | 51.2% |
| Cellular Data Only | 106 | 28.3% |
| Satellite Internet | 46 | 12.3% |
| No Internet | 61 | 16.3% |
| Total | 375 | 100.0% |
Corcovado Summary
Corcovado is a municipality located in the state of Rio Grande do Sul, Brazil. It is situated in the south of the state, near the border with Uruguay. The municipality covers an area of 1,845.7 km2 and has a population of approximately 8,000 people.
History
The area of Corcovado was first settled by the Portuguese in the early 19th century. The settlement was initially called “Vila de Corcovado”, and was founded in 1820. The name was derived from the nearby mountain of Corcovado, which is part of the Serra Geral mountain range.
The settlement was initially a small farming community, but it soon grew in size and importance. In 1845, the town was elevated to the status of a municipality.
Geography
Corcovado is located in the south of the state of Rio Grande do Sul, near the border with Uruguay. The municipality covers an area of 1,845.7 km2 and is situated at an elevation of approximately 500 m above sea level.
The municipality is located in the Serra Geral mountain range, and is home to the Corcovado mountain, which is the highest peak in the range. The mountain is approximately 2,000 m above sea level.
The municipality is also home to several rivers, including the Rio dos Sinos, the Rio das Antas, and the Rio dos Patos.
Economy
The economy of Corcovado is largely based on agriculture and livestock. The main crops grown in the municipality are corn, wheat, and soybeans. Livestock farming is also an important part of the local economy, with cattle, sheep, and pigs being the main animals raised.
In addition to agriculture and livestock, the municipality also has a small manufacturing sector. The main industries in the municipality are food processing, textiles, and woodworking.
Demographics
As of 2020, the population of Corcovado was estimated to be 8,000 people. The majority of the population is of European descent, with a small minority of Afro-Brazilians and Indigenous people.
The majority of the population is Roman Catholic, with a small minority of Protestants. The official language of the municipality is Portuguese.
Conclusion
Corcovado is a municipality located in the state of Rio Grande do Sul, Brazil. It is situated in the south of the state, near the border with Uruguay. The municipality covers an area of 1,845.7 km2 and has a population of approximately 8,000 people. The economy of Corcovado is largely based on agriculture and livestock, with corn, wheat, and soybeans being the main crops grown in the municipality. The majority of the population is of European descent, with a small minority of Afro-Brazilians and Indigenous people. The official language of the municipality is Portuguese.
Common Questions
What is Per Capita Income in Corcovado?
Per Capita income in Corcovado is $9,391.
What is the Median Family Income in Corcovado?
Median Family Income in Corcovado is $24,015.
What is the Median Household income in Corcovado?
Median Household Income in Corcovado is $22,614.
What is Inequality or Gini Index in Corcovado?
Inequality or Gini Index in Corcovado is 0.34.
What is the Total Population of Corcovado?
Total Population of Corcovado is 1,305.
What is the Total Male Population of Corcovado?
Total Male Population of Corcovado is 707.
What is the Total Female Population of Corcovado?
Total Female Population of Corcovado is 598.
What is the Ratio of Males per 100 Females in Corcovado?
There are 118.23 Males per 100 Females in Corcovado.
What is the Ratio of Females per 100 Males in Corcovado?
There are 84.58 Females per 100 Males in Corcovado.
What is the Median Population Age in Corcovado?
Median Population Age in Corcovado is 46.2 Years.
What is the Average Family Size in Corcovado
Average Family Size in Corcovado is 3.6 People.
What is the Average Household Size in Corcovado
Average Household Size in Corcovado is 3.5 People.
How Large is the Labor Force in Corcovado?
There are 286 People in the Labor Forcein in Corcovado.
What is the Percentage of People in the Labor Force in Corcovado?
27.4% of People are in the Labor Force in Corcovado.