Sabana Eneas, PR Map & Demographics
Sabana Eneas Map
Sabana Eneas Overview
$13,261
PER CAPITA INCOME
$21,893
AVG FAMILY INCOME
$14,839
AVG HOUSEHOLD INCOME
58.1%
WAGE / INCOME GAP [ % ]
41.9¢/ $1
WAGE / INCOME GAP [ $ ]
$9,806
FAMILY INCOME DEFICIT
0.56
INEQUALITY / GINI INDEX
1,356
TOTAL POPULATION
600
MALE POPULATION
756
FEMALE POPULATION
79.37
MALES / 100 FEMALES
126.00
FEMALES / 100 MALES
54.0
MEDIAN AGE
3.6
AVG FAMILY SIZE
2.3
AVG HOUSEHOLD SIZE
358
LABOR FORCE [ PEOPLE ]
31.7%
PERCENT IN LABOR FORCE
8.1%
UNEMPLOYMENT RATE
Income in Sabana Eneas
Income Overview in Sabana Eneas
Per Capita Income in Sabana Eneas is $13,261, while median incomes of families and households are $21,893 and $14,839 respectively.
| Characteristic | Number | Measure |
| Per Capita Income | 1,356 | $13,261 |
| Median Family Income | 279 | $21,893 |
| Mean Family Income | 279 | $35,985 |
| Median Household Income | 582 | $14,839 |
| Mean Household Income | 582 | $25,454 |
| Income Deficit | 279 | $9,806 |
| Wage / Income Gap (%) | 1,356 | 58.07% |
| Wage / Income Gap ($) | 1,356 | 41.93¢ per $1 |
| Gini / Inequality Index | 1,356 | 0.56 |
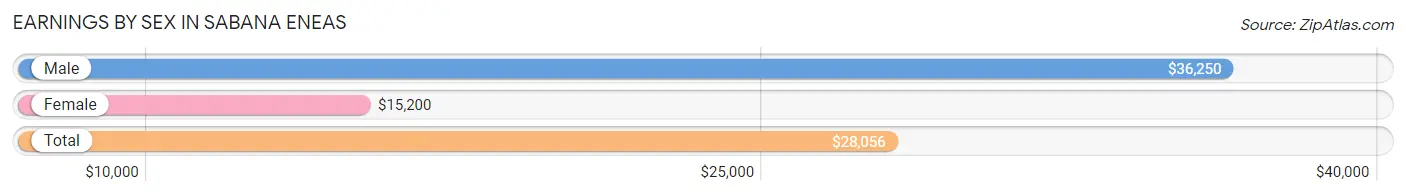
Earnings by Sex in Sabana Eneas
Average Earnings in Sabana Eneas are $28,056, $36,250 for men and $15,200 for women, a difference of 58.1%.
| Sex | Number | Average Earnings |
| Male | 180 (51.4%) | $36,250 |
| Female | 170 (48.6%) | $15,200 |
| Total | 350 (100.0%) | $28,056 |
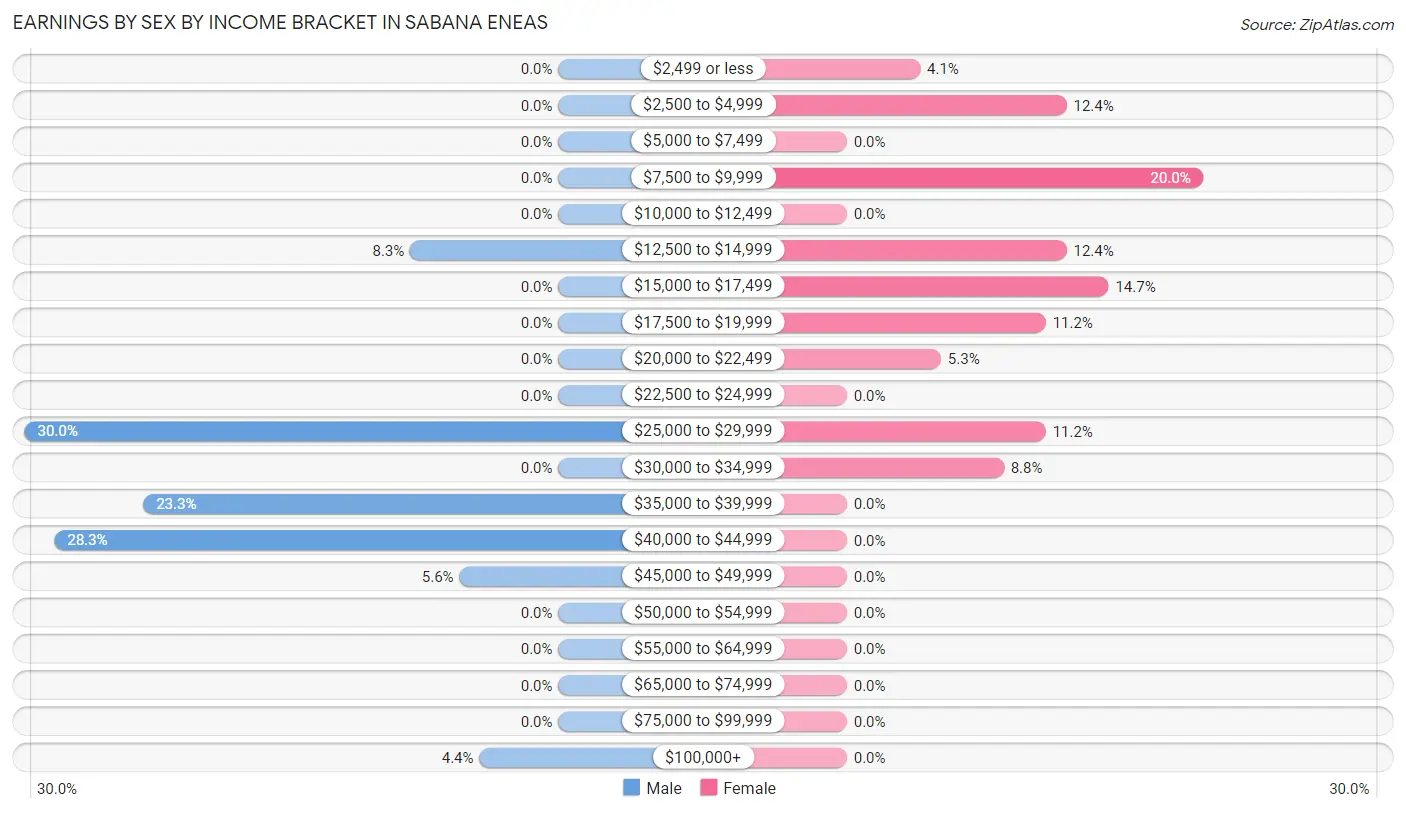
Earnings by Sex by Income Bracket in Sabana Eneas
The most common earnings brackets in Sabana Eneas are $25,000 to $29,999 for men (54 | 30.0%) and $7,500 to $9,999 for women (34 | 20.0%).
| Income | Male | Female |
| $2,499 or less | 0 (0.0%) | 7 (4.1%) |
| $2,500 to $4,999 | 0 (0.0%) | 21 (12.3%) |
| $5,000 to $7,499 | 0 (0.0%) | 0 (0.0%) |
| $7,500 to $9,999 | 0 (0.0%) | 34 (20.0%) |
| $10,000 to $12,499 | 0 (0.0%) | 0 (0.0%) |
| $12,500 to $14,999 | 15 (8.3%) | 21 (12.3%) |
| $15,000 to $17,499 | 0 (0.0%) | 25 (14.7%) |
| $17,500 to $19,999 | 0 (0.0%) | 19 (11.2%) |
| $20,000 to $22,499 | 0 (0.0%) | 9 (5.3%) |
| $22,500 to $24,999 | 0 (0.0%) | 0 (0.0%) |
| $25,000 to $29,999 | 54 (30.0%) | 19 (11.2%) |
| $30,000 to $34,999 | 0 (0.0%) | 15 (8.8%) |
| $35,000 to $39,999 | 42 (23.3%) | 0 (0.0%) |
| $40,000 to $44,999 | 51 (28.3%) | 0 (0.0%) |
| $45,000 to $49,999 | 10 (5.6%) | 0 (0.0%) |
| $50,000 to $54,999 | 0 (0.0%) | 0 (0.0%) |
| $55,000 to $64,999 | 0 (0.0%) | 0 (0.0%) |
| $65,000 to $74,999 | 0 (0.0%) | 0 (0.0%) |
| $75,000 to $99,999 | 0 (0.0%) | 0 (0.0%) |
| $100,000+ | 8 (4.4%) | 0 (0.0%) |
| Total | 180 (100.0%) | 170 (100.0%) |
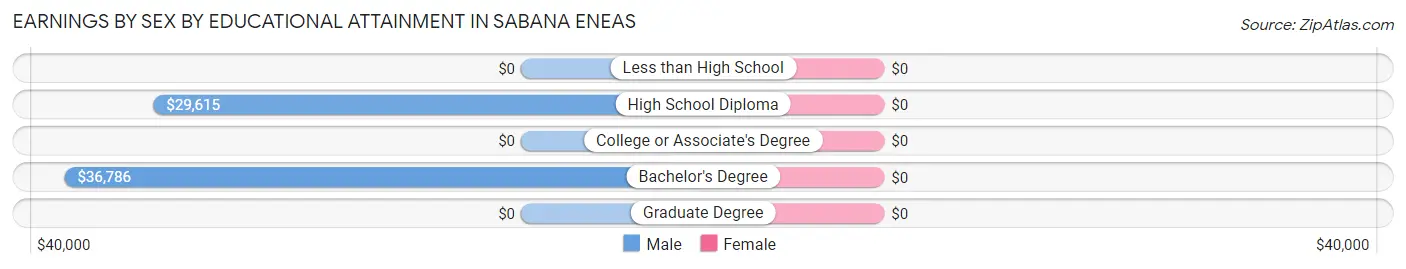
Earnings by Sex by Educational Attainment in Sabana Eneas
| Educational Attainment | Male Income | Female Income |
| Less than High School | - | - |
| High School Diploma | $29,615 | $0 |
| College or Associate's Degree | - | - |
| Bachelor's Degree | $36,786 | $0 |
| Graduate Degree | - | - |
| Total | $36,250 | $16,154 |
Family Income in Sabana Eneas
Family Income Brackets in Sabana Eneas
According to the Sabana Eneas family income data, there are 73 families falling into the $15,000 to $24,999 income range, which is the most common income bracket and makes up 26.2% of all families.
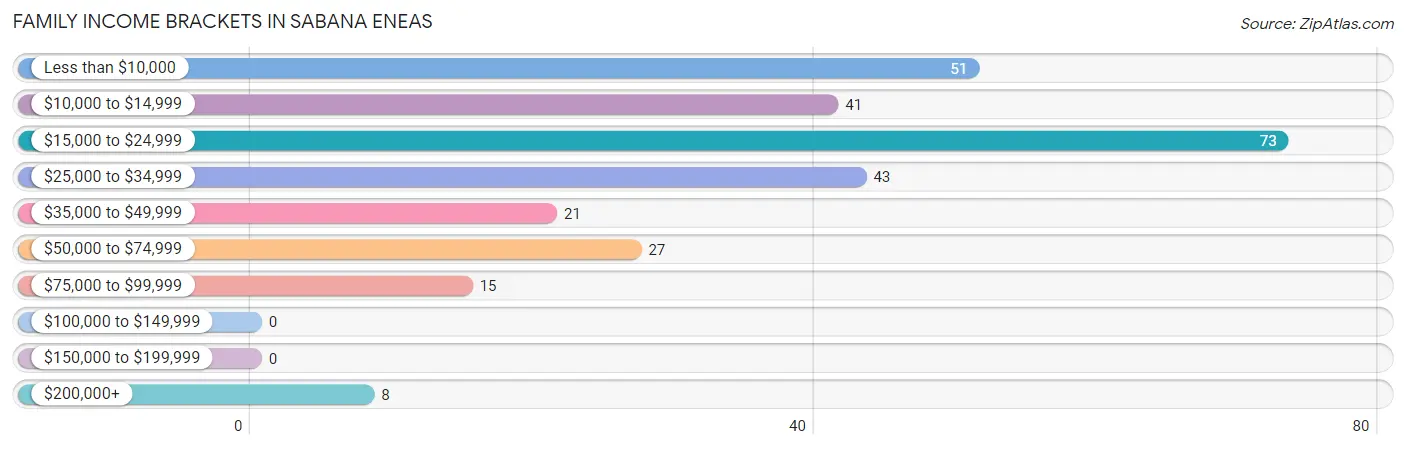
| Income Bracket | # Families | % Families |
| Less than $10,000 | 51 | 18.3% |
| $10,000 to $14,999 | 41 | 14.7% |
| $15,000 to $24,999 | 73 | 26.2% |
| $25,000 to $34,999 | 43 | 15.4% |
| $35,000 to $49,999 | 21 | 7.5% |
| $50,000 to $74,999 | 27 | 9.7% |
| $75,000 to $99,999 | 15 | 5.4% |
| $100,000 to $149,999 | 0 | 0.0% |
| $150,000 to $199,999 | 0 | 0.0% |
| $200,000+ | 8 | 2.9% |
Family Income by Famaliy Size in Sabana Eneas
2-person families (161 | 57.7%) account for the highest median family income in Sabana Eneas with $20,625 per family, while 2-person families (161 | 57.7%) have the highest median income of $10,312 per family member.
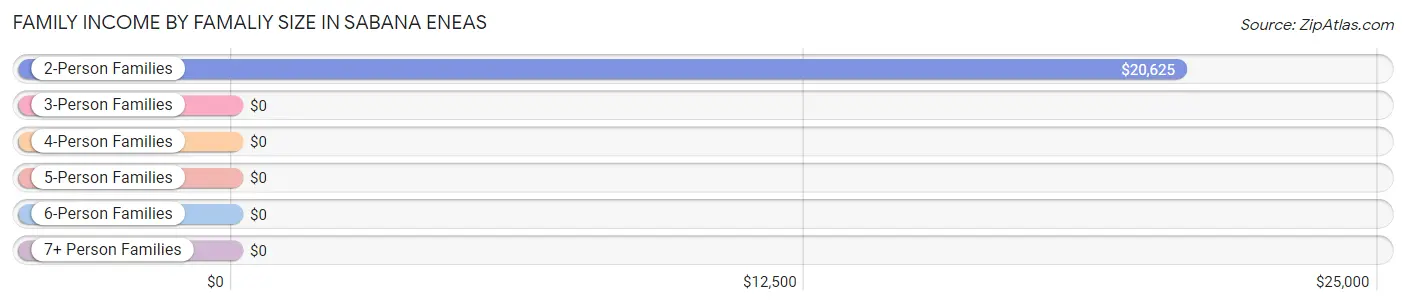
| Income Bracket | # Families | Median Income |
| 2-Person Families | 161 (57.7%) | $20,625 |
| 3-Person Families | 52 (18.6%) | $0 |
| 4-Person Families | 57 (20.4%) | $0 |
| 5-Person Families | 0 (0.0%) | $0 |
| 6-Person Families | 9 (3.2%) | $0 |
| 7+ Person Families | 0 (0.0%) | $0 |
| Total | 279 (100.0%) | $21,893 |
Family Income by Number of Earners in Sabana Eneas
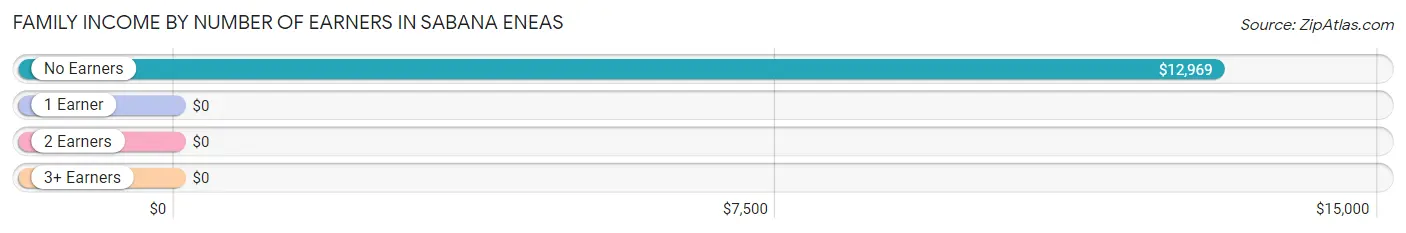
| Number of Earners | # Families | Median Income |
| No Earners | 158 (56.6%) | $12,969 |
| 1 Earner | 68 (24.4%) | $0 |
| 2 Earners | 44 (15.8%) | $0 |
| 3+ Earners | 9 (3.2%) | $0 |
| Total | 279 (100.0%) | $21,893 |
Household Income in Sabana Eneas
Household Income Brackets in Sabana Eneas
With 197 households falling in the category, the less than $10,000 income range is the most frequent in Sabana Eneas, accounting for 33.9% of all households.
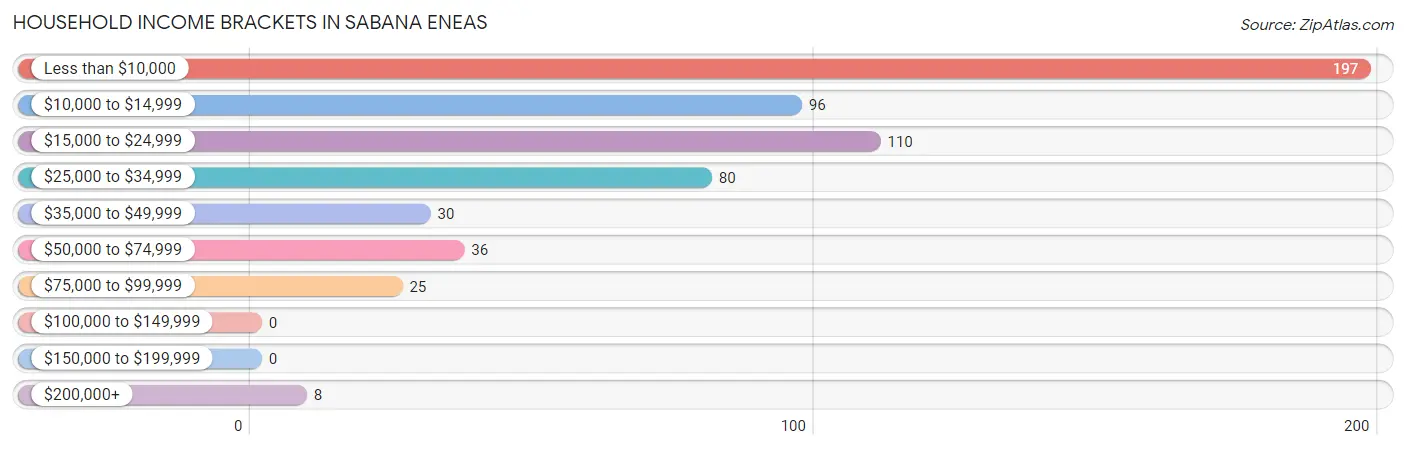
| Income Bracket | # Households | % Households |
| Less than $10,000 | 197 | 33.8% |
| $10,000 to $14,999 | 96 | 16.5% |
| $15,000 to $24,999 | 110 | 18.9% |
| $25,000 to $34,999 | 80 | 13.7% |
| $35,000 to $49,999 | 30 | 5.2% |
| $50,000 to $74,999 | 36 | 6.2% |
| $75,000 to $99,999 | 25 | 4.3% |
| $100,000 to $149,999 | 0 | 0.0% |
| $150,000 to $199,999 | 0 | 0.0% |
| $200,000+ | 8 | 1.4% |
Household Income by Householder Age in Sabana Eneas
The median household income in Sabana Eneas is $14,839, with the highest median household income of $28,491 found in the 65+ years age bracket for the primary householder. A total of 233 households (40.0%) fall into this category.
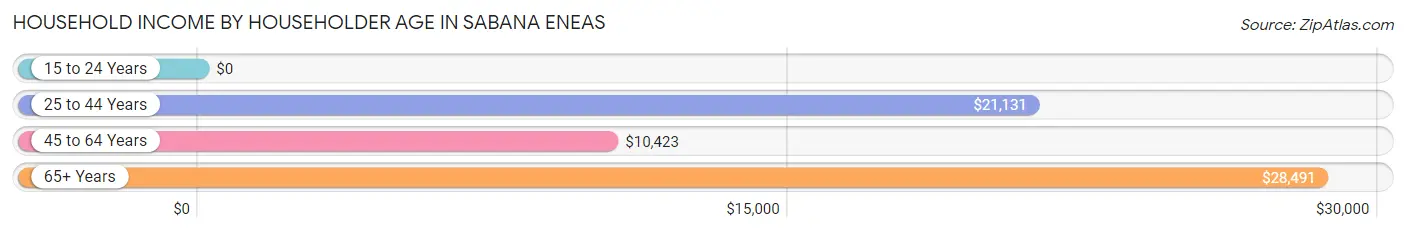
| Income Bracket | # Households | Median Income |
| 15 to 24 Years | 0 (0.0%) | $0 |
| 25 to 44 Years | 61 (10.5%) | $21,131 |
| 45 to 64 Years | 288 (49.5%) | $10,423 |
| 65+ Years | 233 (40.0%) | $28,491 |
| Total | 582 (100.0%) | $14,839 |
Poverty in Sabana Eneas
Income Below Poverty by Sex and Age in Sabana Eneas
With 38.7% poverty level for males and 62.2% for females among the residents of Sabana Eneas, 5 year old males and 6 to 11 year old females are the most vulnerable to poverty, with 25 males (100.0%) and 30 females (100.0%) in their respective age groups living below the poverty level.
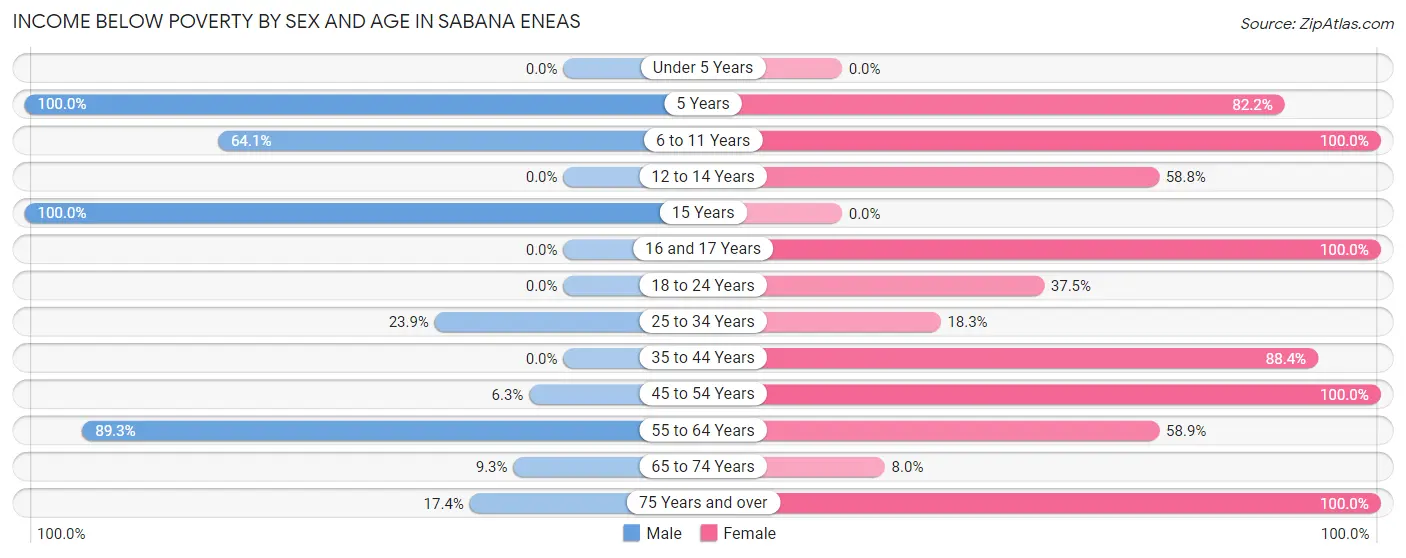
| Age Bracket | Male | Female |
| Under 5 Years | 0 (0.0%) | 0 (0.0%) |
| 5 Years | 25 (100.0%) | 60 (82.2%) |
| 6 to 11 Years | 25 (64.1%) | 30 (100.0%) |
| 12 to 14 Years | 0 (0.0%) | 20 (58.8%) |
| 15 Years | 11 (100.0%) | 0 (0.0%) |
| 16 and 17 Years | 0 (0.0%) | 12 (100.0%) |
| 18 to 24 Years | 0 (0.0%) | 12 (37.5%) |
| 25 to 34 Years | 16 (23.9%) | 13 (18.3%) |
| 35 to 44 Years | 0 (0.0%) | 76 (88.4%) |
| 45 to 54 Years | 9 (6.3%) | 80 (100.0%) |
| 55 to 64 Years | 125 (89.3%) | 76 (58.9%) |
| 65 to 74 Years | 9 (9.3%) | 9 (8.0%) |
| 75 Years and over | 12 (17.4%) | 82 (100.0%) |
| Total | 232 (38.7%) | 470 (62.2%) |
Income Above Poverty by Sex and Age in Sabana Eneas
According to the poverty statistics in Sabana Eneas, males aged 35 to 44 years and females aged 15 years are the age groups that are most secure financially, with 100.0% of males and 100.0% of females in these age groups living above the poverty line.
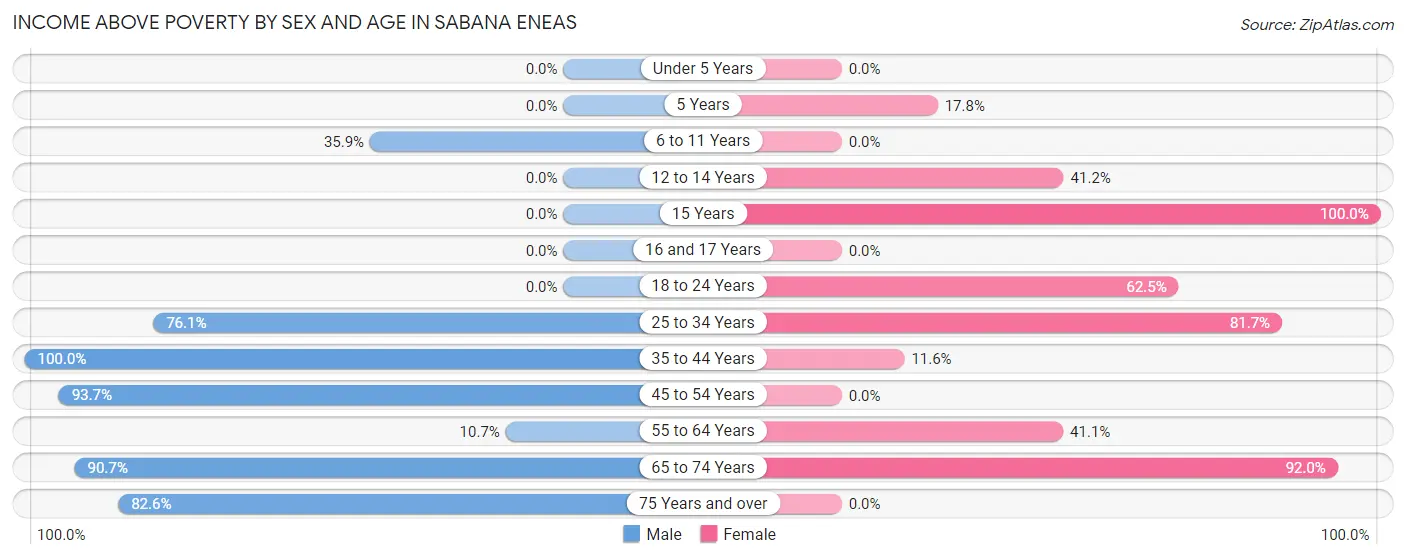
| Age Bracket | Male | Female |
| Under 5 Years | 0 (0.0%) | 0 (0.0%) |
| 5 Years | 0 (0.0%) | 13 (17.8%) |
| 6 to 11 Years | 14 (35.9%) | 0 (0.0%) |
| 12 to 14 Years | 0 (0.0%) | 14 (41.2%) |
| 15 Years | 0 (0.0%) | 14 (100.0%) |
| 16 and 17 Years | 0 (0.0%) | 0 (0.0%) |
| 18 to 24 Years | 0 (0.0%) | 20 (62.5%) |
| 25 to 34 Years | 51 (76.1%) | 58 (81.7%) |
| 35 to 44 Years | 10 (100.0%) | 10 (11.6%) |
| 45 to 54 Years | 133 (93.7%) | 0 (0.0%) |
| 55 to 64 Years | 15 (10.7%) | 53 (41.1%) |
| 65 to 74 Years | 88 (90.7%) | 104 (92.0%) |
| 75 Years and over | 57 (82.6%) | 0 (0.0%) |
| Total | 368 (61.3%) | 286 (37.8%) |
Income Below Poverty Among Married-Couple Families in Sabana Eneas
The poverty statistics for married-couple families in Sabana Eneas show that 38.6% or 61 of the total 158 families live below the poverty line. Families with 1 or 2 children have the highest poverty rate of 61.9%, comprising of 13 families. On the other hand, families with no children have the lowest poverty rate of 35.0%, which includes 48 families.
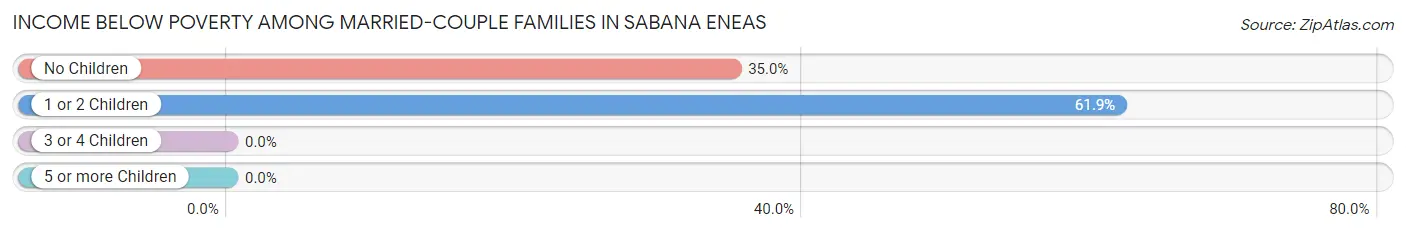
| Children | Above Poverty | Below Poverty |
| No Children | 89 (65.0%) | 48 (35.0%) |
| 1 or 2 Children | 8 (38.1%) | 13 (61.9%) |
| 3 or 4 Children | 0 (0.0%) | 0 (0.0%) |
| 5 or more Children | 0 (0.0%) | 0 (0.0%) |
| Total | 97 (61.4%) | 61 (38.6%) |
Income Below Poverty Among Single-Parent Households in Sabana Eneas
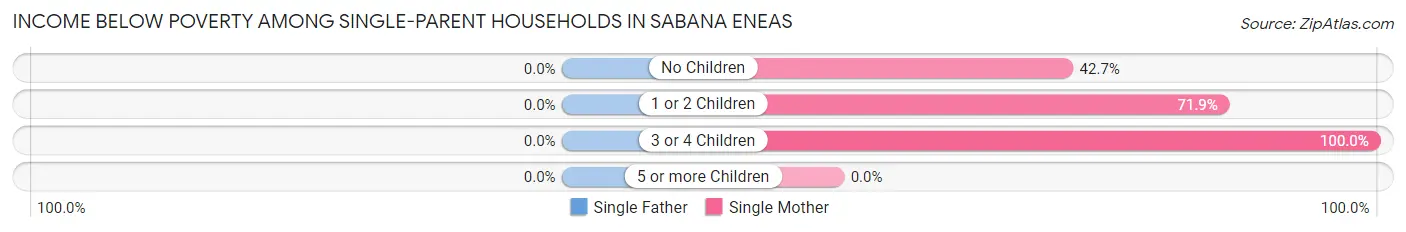
| Children | Single Father | Single Mother |
| No Children | 0 (0.0%) | 29 (42.6%) |
| 1 or 2 Children | 0 (0.0%) | 23 (71.9%) |
| 3 or 4 Children | 0 (0.0%) | 21 (100.0%) |
| 5 or more Children | 0 (0.0%) | 0 (0.0%) |
| Total | 0 (0.0%) | 73 (60.3%) |
Income Below Poverty Among Married-Couple vs Single-Parent Households in Sabana Eneas
The poverty data for Sabana Eneas shows that 61 of the married-couple family households (38.6%) and 73 of the single-parent households (60.3%) are living below the poverty level. Within the married-couple family households, those with 1 or 2 children have the highest poverty rate, with 13 households (61.9%) falling below the poverty line. Among the single-parent households, those with 3 or 4 children have the highest poverty rate, with 21 household (100.0%) living below poverty.
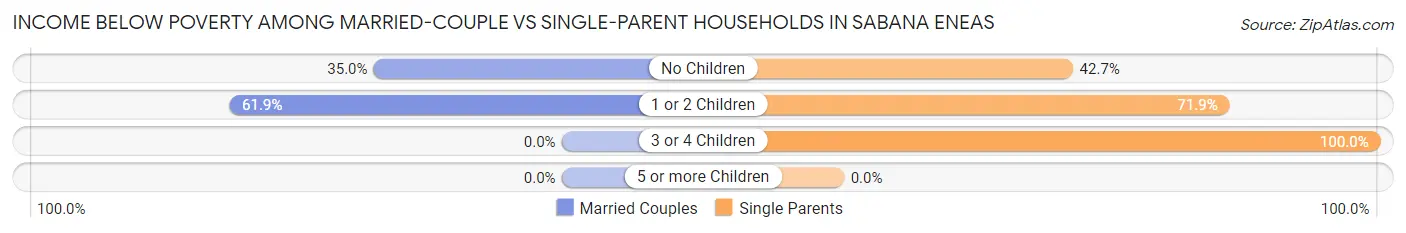
| Children | Married-Couple Families | Single-Parent Households |
| No Children | 48 (35.0%) | 29 (42.6%) |
| 1 or 2 Children | 13 (61.9%) | 23 (71.9%) |
| 3 or 4 Children | 0 (0.0%) | 21 (100.0%) |
| 5 or more Children | 0 (0.0%) | 0 (0.0%) |
| Total | 61 (38.6%) | 73 (60.3%) |
Race in Sabana Eneas
The most populous races in Sabana Eneas are Hispanic or Latino (1,356 | 100.0%), White / Caucasian (763 | 56.3%), and Some other Race (370 | 27.3%).
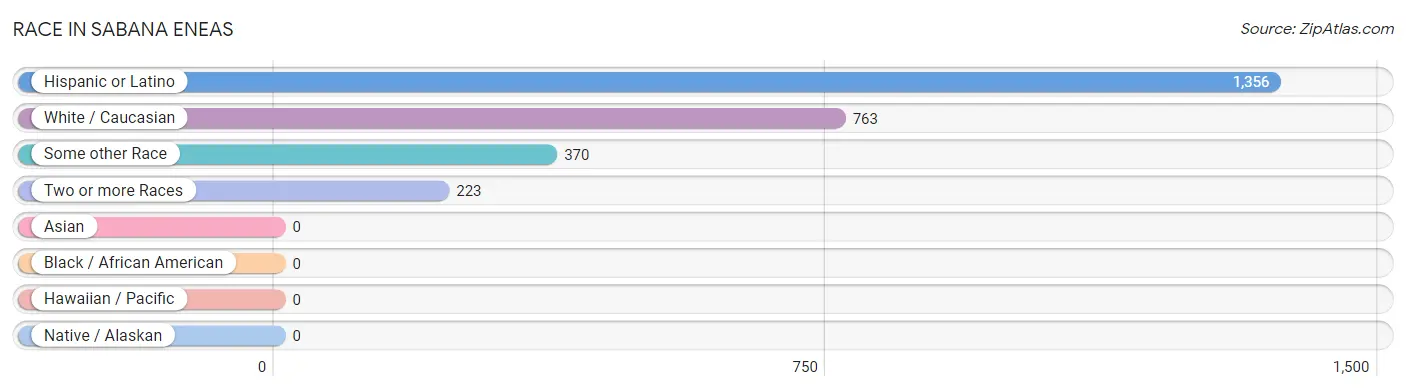
| Race | # Population | % Population |
| Asian | 0 | 0.0% |
| Black / African American | 0 | 0.0% |
| Hawaiian / Pacific | 0 | 0.0% |
| Hispanic or Latino | 1,356 | 100.0% |
| Native / Alaskan | 0 | 0.0% |
| White / Caucasian | 763 | 56.3% |
| Two or more Races | 223 | 16.5% |
| Some other Race | 370 | 27.3% |
| Total | 1,356 | 100.0% |
Ancestry in Sabana Eneas
The most populous ancestries reported in Sabana Eneas are Puerto Rican (1,341 | 98.9%), and Cuban (15 | 1.1%), together accounting for 100.0% of all Sabana Eneas residents.
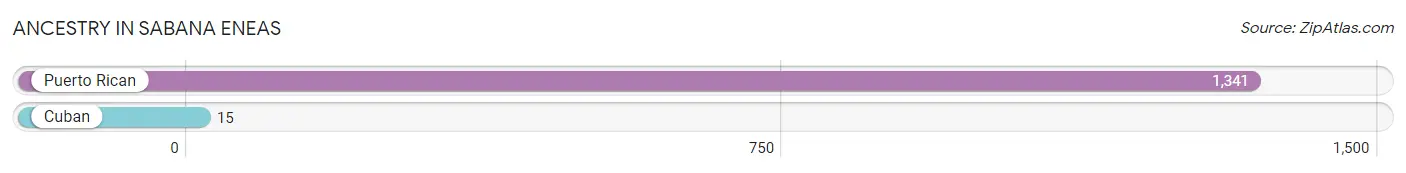
| Ancestry | # Population | % Population |
| Cuban | 15 | 1.1% |
| Puerto Rican | 1,341 | 98.9% | View All 2 Rows |
Immigrants in Sabana Eneas

| Immigration Origin | # Population | % Population | View All 0 Rows |
Sex and Age in Sabana Eneas
Sex and Age in Sabana Eneas
The most populous age groups in Sabana Eneas are 45 to 49 Years (133 | 22.2%) for men and 5 to 9 Years (103 | 13.6%) for women.
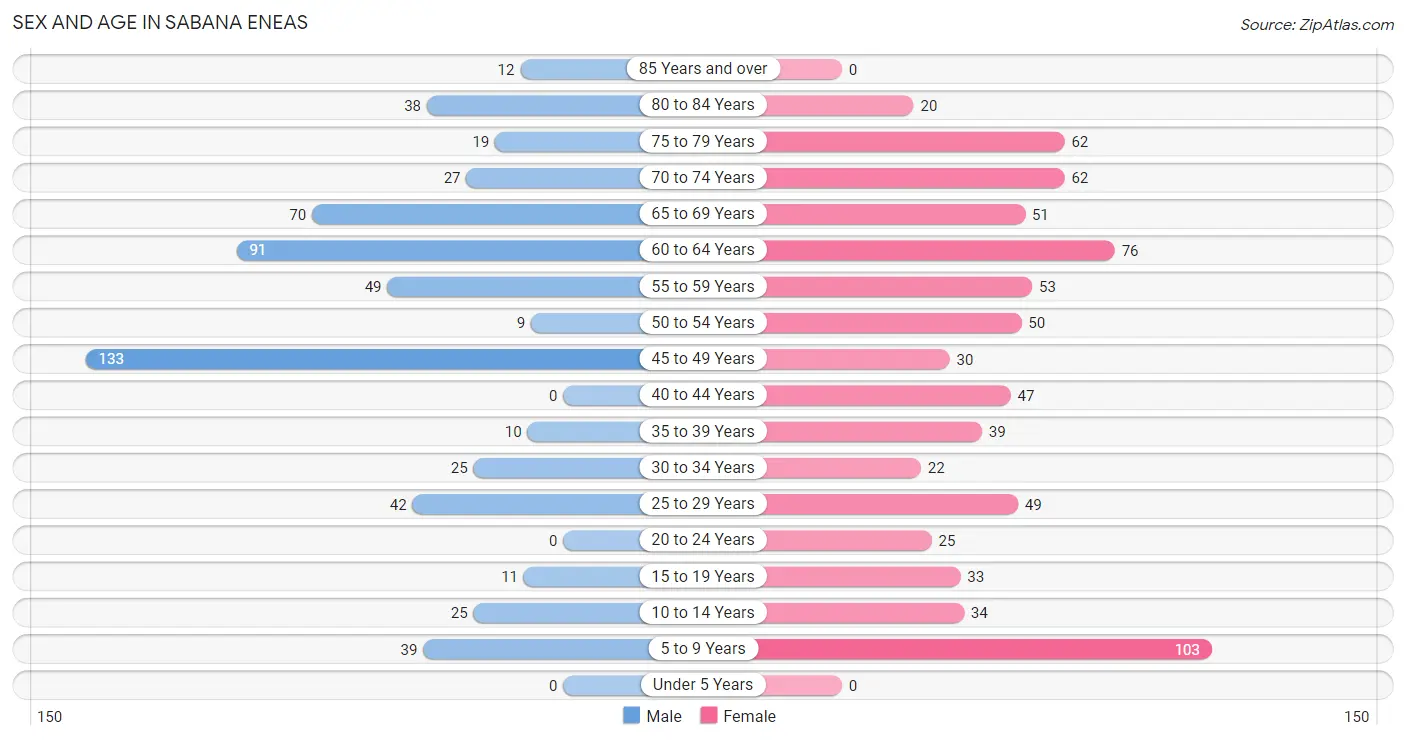
| Age Bracket | Male | Female |
| Under 5 Years | 0 (0.0%) | 0 (0.0%) |
| 5 to 9 Years | 39 (6.5%) | 103 (13.6%) |
| 10 to 14 Years | 25 (4.2%) | 34 (4.5%) |
| 15 to 19 Years | 11 (1.8%) | 33 (4.4%) |
| 20 to 24 Years | 0 (0.0%) | 25 (3.3%) |
| 25 to 29 Years | 42 (7.0%) | 49 (6.5%) |
| 30 to 34 Years | 25 (4.2%) | 22 (2.9%) |
| 35 to 39 Years | 10 (1.7%) | 39 (5.2%) |
| 40 to 44 Years | 0 (0.0%) | 47 (6.2%) |
| 45 to 49 Years | 133 (22.2%) | 30 (4.0%) |
| 50 to 54 Years | 9 (1.5%) | 50 (6.6%) |
| 55 to 59 Years | 49 (8.2%) | 53 (7.0%) |
| 60 to 64 Years | 91 (15.2%) | 76 (10.1%) |
| 65 to 69 Years | 70 (11.7%) | 51 (6.8%) |
| 70 to 74 Years | 27 (4.5%) | 62 (8.2%) |
| 75 to 79 Years | 19 (3.2%) | 62 (8.2%) |
| 80 to 84 Years | 38 (6.3%) | 20 (2.6%) |
| 85 Years and over | 12 (2.0%) | 0 (0.0%) |
| Total | 600 (100.0%) | 756 (100.0%) |
Families and Households in Sabana Eneas
Median Family Size in Sabana Eneas
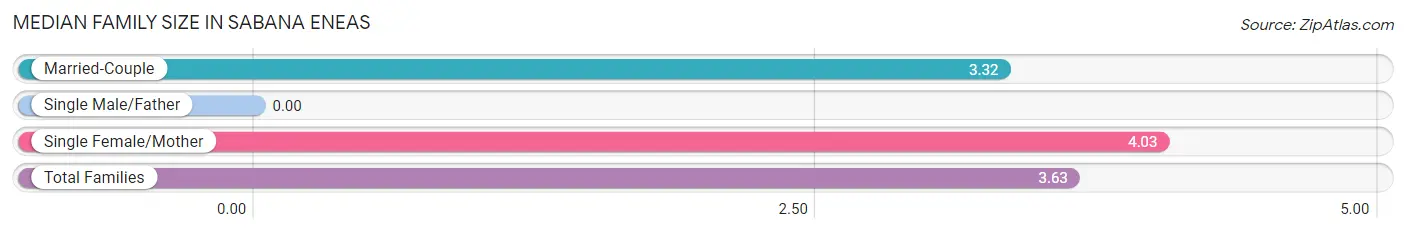
| Family Type | # Families | Family Size |
| Married-Couple | 158 (56.6%) | 3.32 |
| Single Male/Father | 0 (0.0%) | - |
| Single Female/Mother | 121 (43.4%) | 4.03 |
| Total Families | 279 (100.0%) | 3.63 |
Median Household Size in Sabana Eneas
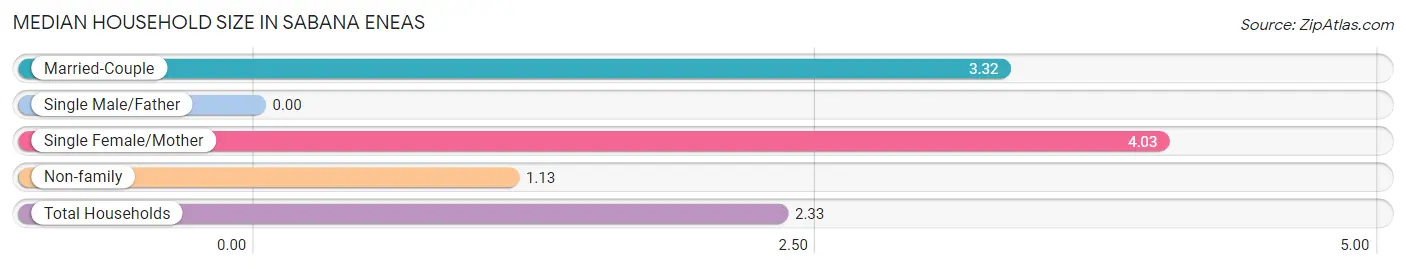
| Household Type | # Households | Household Size |
| Married-Couple | 158 (27.2%) | 3.32 |
| Single Male/Father | 0 (0.0%) | - |
| Single Female/Mother | 121 (20.8%) | 4.03 |
| Non-family | 303 (52.1%) | 1.13 |
| Total Households | 582 (100.0%) | 2.33 |
Household Size by Marriage Status in Sabana Eneas
Out of a total of 582 households in Sabana Eneas, 279 (47.9%) are family households, while 303 (52.1%) are nonfamily households. The most numerous type of family households are 2-person households, comprising 161, and the most common type of nonfamily households are 1-person households, comprising 263.
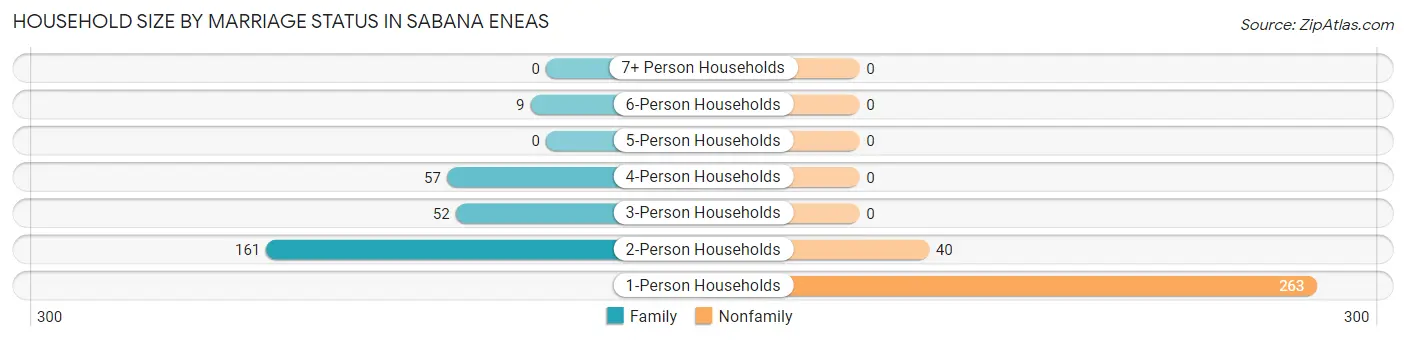
| Household Size | Family Households | Nonfamily Households |
| 1-Person Households | - | 263 (45.2%) |
| 2-Person Households | 161 (27.7%) | 40 (6.9%) |
| 3-Person Households | 52 (8.9%) | 0 (0.0%) |
| 4-Person Households | 57 (9.8%) | 0 (0.0%) |
| 5-Person Households | 0 (0.0%) | 0 (0.0%) |
| 6-Person Households | 9 (1.5%) | 0 (0.0%) |
| 7+ Person Households | 0 (0.0%) | 0 (0.0%) |
| Total | 279 (47.9%) | 303 (52.1%) |
Female Fertility in Sabana Eneas
Fertility by Age in Sabana Eneas
| Age Bracket | Women with Births | Births / 1,000 Women |
| 15 to 19 years | 0 (0.0%) | 0.0 |
| 20 to 34 years | 0 (0.0%) | 0.0 |
| 35 to 50 years | 0 (0.0%) | 0.0 |
| Total | 0 (0.0%) | 0.0 |
Fertility by Age by Marriage Status in Sabana Eneas
| Age Bracket | Married | Unmarried |
| 15 to 19 years | 0 (0.0%) | 0 (0.0%) |
| 20 to 34 years | 0 (0.0%) | 0 (0.0%) |
| 35 to 50 years | 0 (0.0%) | 0 (0.0%) |
| Total | 0 (0.0%) | 0 (0.0%) |
Fertility by Education in Sabana Eneas
| Educational Attainment | Women with Births | Births / 1,000 Women |
| Less than High School | 0 (0.0%) | 0.0 |
| High School Diploma | 0 (0.0%) | 0.0 |
| College or Associate's Degree | 0 (0.0%) | 0.0 |
| Bachelor's Degree | 0 (0.0%) | 0.0 |
| Graduate Degree | 0 (0.0%) | 0.0 |
| Total | 0 (0.0%) | 0.0 |
Fertility by Education by Marriage Status in Sabana Eneas
| Educational Attainment | Married | Unmarried |
| Less than High School | 0 (0.0%) | 0 (0.0%) |
| High School Diploma | 0 (0.0%) | 0 (0.0%) |
| College or Associate's Degree | 0 (0.0%) | 0 (0.0%) |
| Bachelor's Degree | 0 (0.0%) | 0 (0.0%) |
| Graduate Degree | 0 (0.0%) | 0 (0.0%) |
| Total | 0 (0.0%) | 0 (0.0%) |
Employment Characteristics in Sabana Eneas
Employment by Class of Employer in Sabana Eneas
Among the 314 employed individuals in Sabana Eneas, private company employees (243 | 77.4%), self-employed (incorporated) (18 | 5.7%), and self-employed (not incorporated) (18 | 5.7%) make up the most common classes of employment.
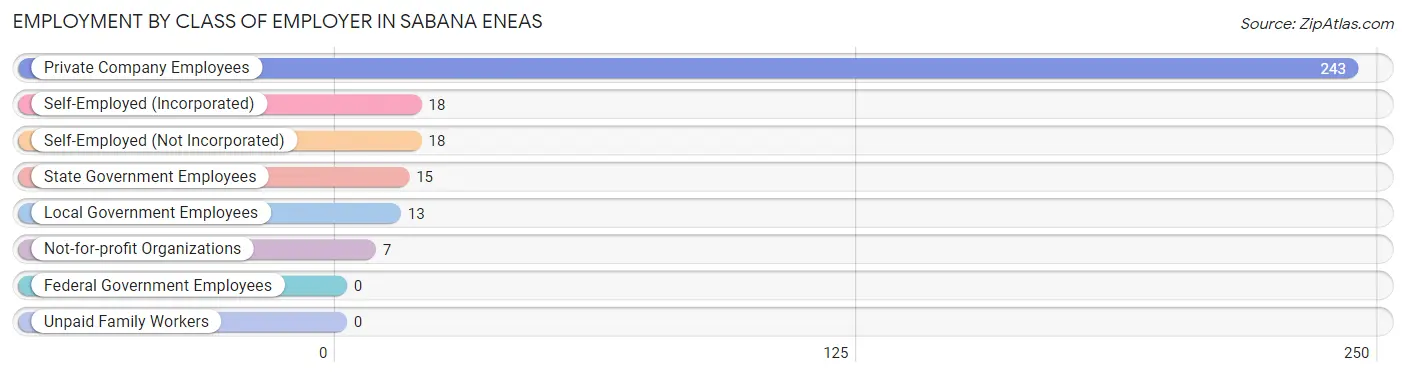
| Employer Class | # Employees | % Employees |
| Private Company Employees | 243 | 77.4% |
| Self-Employed (Incorporated) | 18 | 5.7% |
| Self-Employed (Not Incorporated) | 18 | 5.7% |
| Not-for-profit Organizations | 7 | 2.2% |
| Local Government Employees | 13 | 4.1% |
| State Government Employees | 15 | 4.8% |
| Federal Government Employees | 0 | 0.0% |
| Unpaid Family Workers | 0 | 0.0% |
| Total | 314 | 100.0% |
Employment Status by Age in Sabana Eneas
According to the labor force statistics for Sabana Eneas, out of the total population over 16 years of age (1,130), 31.7% or 358 individuals are in the labor force, with 8.1% or 29 of them unemployed. The age group with the highest labor force participation rate is 20 to 24 years, with 100.0% or 25 individuals in the labor force. Within the labor force, the 45 to 54 years age range has the highest percentage of unemployed individuals, with 18.1% or 21 of them being unemployed.
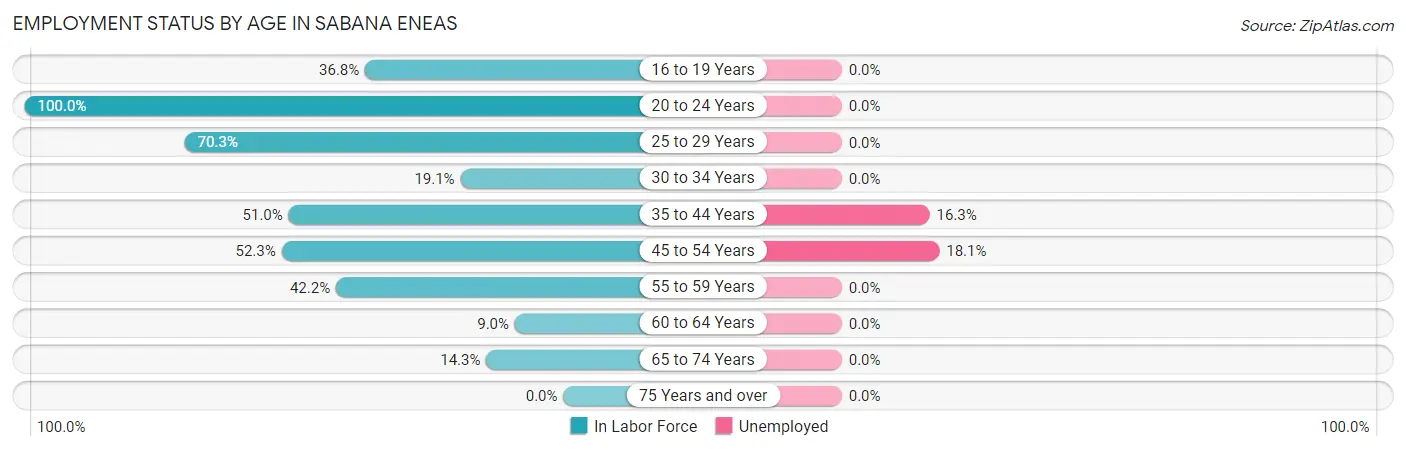
| Age Bracket | In Labor Force | Unemployed |
| 16 to 19 Years | 7 (36.8%) | 0 (0.0%) |
| 20 to 24 Years | 25 (100.0%) | 0 (0.0%) |
| 25 to 29 Years | 64 (70.3%) | 0 (0.0%) |
| 30 to 34 Years | 9 (19.1%) | 0 (0.0%) |
| 35 to 44 Years | 49 (51.0%) | 8 (16.3%) |
| 45 to 54 Years | 116 (52.3%) | 21 (18.1%) |
| 55 to 59 Years | 43 (42.2%) | 0 (0.0%) |
| 60 to 64 Years | 15 (9.0%) | 0 (0.0%) |
| 65 to 74 Years | 30 (14.3%) | 0 (0.0%) |
| 75 Years and over | 0 (0.0%) | 0 (0.0%) |
| Total | 358 (31.7%) | 29 (8.1%) |
Employment Status by Educational Attainment in Sabana Eneas
According to labor force statistics for Sabana Eneas, 40.8% of individuals (296) out of the total population between 25 and 64 years of age (725) are in the labor force, with 9.8% or 29 of them being unemployed. The group with the highest labor force participation rate are those with the educational attainment of bachelor's degree or higher, with 66.8% or 149 individuals in the labor force. Within the labor force, individuals with college / associate degree education have the highest percentage of unemployment, with 25.0% or 8 of them being unemployed.
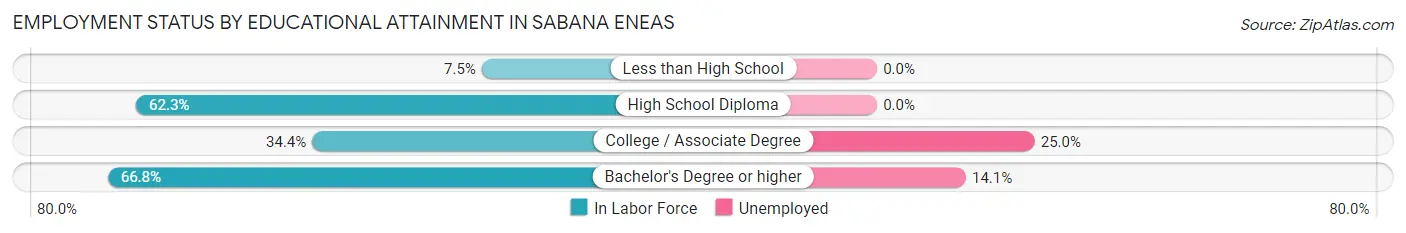
| Educational Attainment | In Labor Force | Unemployed |
| Less than High School | 19 (7.5%) | 0 (0.0%) |
| High School Diploma | 96 (62.3%) | 0 (0.0%) |
| College / Associate Degree | 32 (34.4%) | 23 (25.0%) |
| Bachelor's Degree or higher | 149 (66.8%) | 31 (14.1%) |
| Total | 296 (40.8%) | 71 (9.8%) |
Employment Occupations by Sex in Sabana Eneas
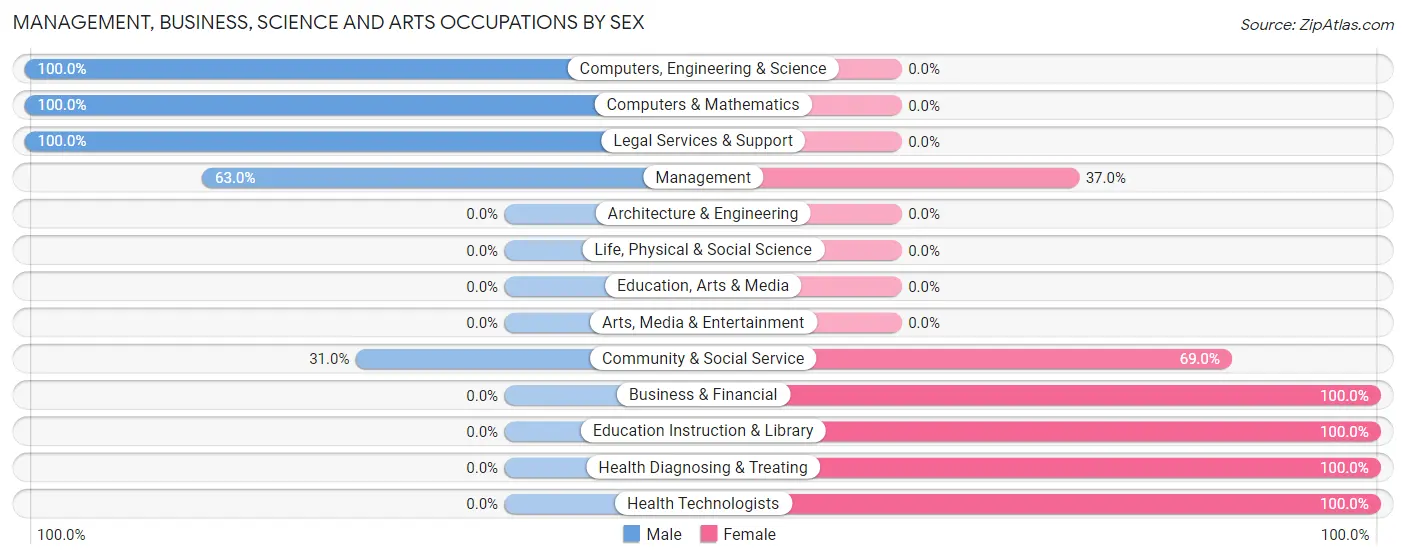
Management, Business, Science and Arts Occupations
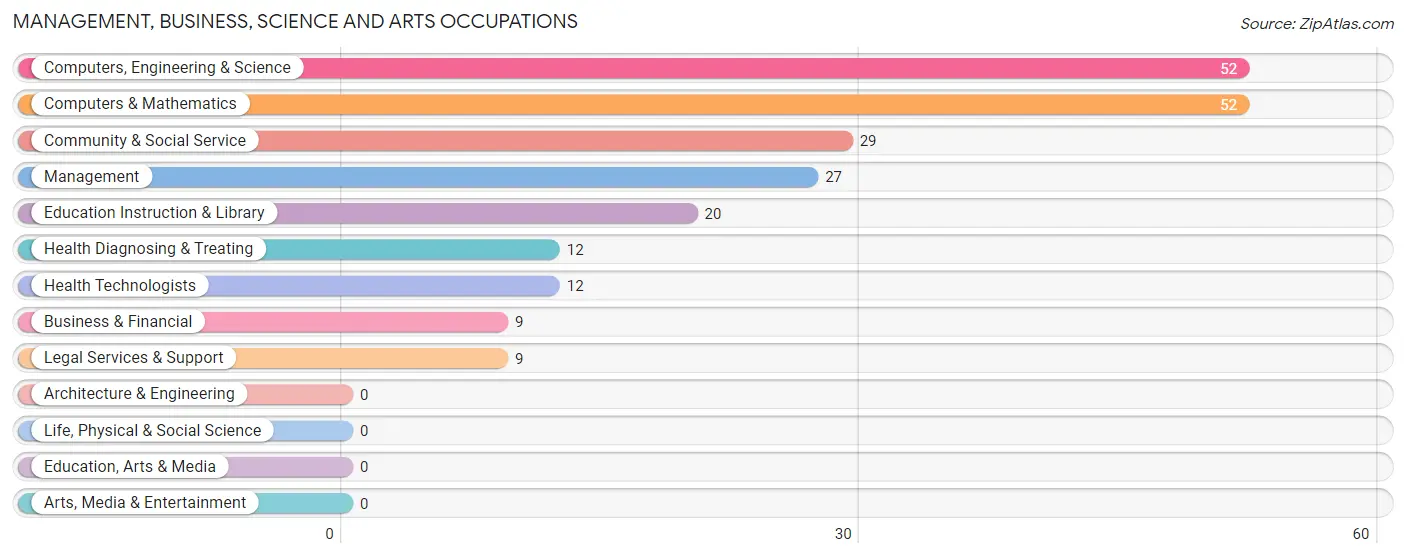
The most common Management, Business, Science and Arts occupations in Sabana Eneas are Computers, Engineering & Science (52 | 15.8%), Computers & Mathematics (52 | 15.8%), Community & Social Service (29 | 8.8%), Management (27 | 8.2%), and Education Instruction & Library (20 | 6.1%).
Management, Business, Science and Arts Occupations by Sex
Within the Management, Business, Science and Arts occupations in Sabana Eneas, the most male-oriented occupations are Computers, Engineering & Science (100.0%), Computers & Mathematics (100.0%), and Legal Services & Support (100.0%), while the most female-oriented occupations are Business & Financial (100.0%), Education Instruction & Library (100.0%), and Health Diagnosing & Treating (100.0%).
| Occupation | Male | Female |
| Management | 17 (63.0%) | 10 (37.0%) |
| Business & Financial | 0 (0.0%) | 9 (100.0%) |
| Computers, Engineering & Science | 52 (100.0%) | 0 (0.0%) |
| Computers & Mathematics | 52 (100.0%) | 0 (0.0%) |
| Architecture & Engineering | 0 (0.0%) | 0 (0.0%) |
| Life, Physical & Social Science | 0 (0.0%) | 0 (0.0%) |
| Community & Social Service | 9 (31.0%) | 20 (69.0%) |
| Education, Arts & Media | 0 (0.0%) | 0 (0.0%) |
| Legal Services & Support | 9 (100.0%) | 0 (0.0%) |
| Education Instruction & Library | 0 (0.0%) | 20 (100.0%) |
| Arts, Media & Entertainment | 0 (0.0%) | 0 (0.0%) |
| Health Diagnosing & Treating | 0 (0.0%) | 12 (100.0%) |
| Health Technologists | 0 (0.0%) | 12 (100.0%) |
| Total (Category) | 78 (60.5%) | 51 (39.5%) |
| Total (Overall) | 180 (54.7%) | 149 (45.3%) |
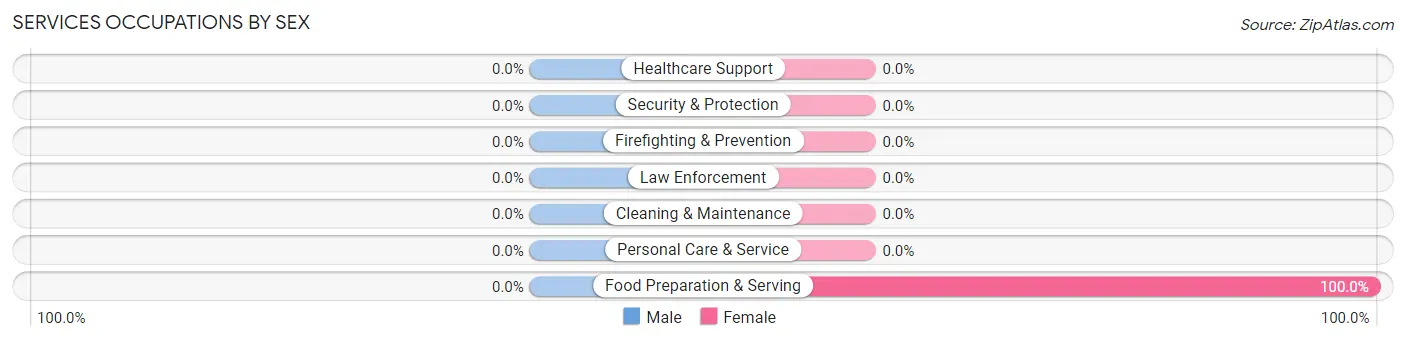
Services Occupations
The most common Services occupations in Sabana Eneas are , and Food Preparation & Serving (30 | 9.1%).
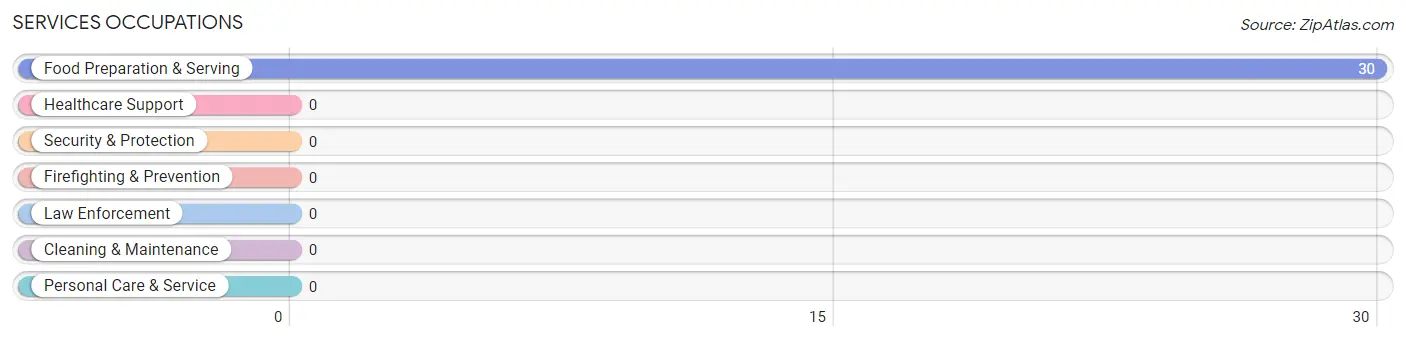
Services Occupations by Sex
| Occupation | Male | Female |
| Healthcare Support | 0 (0.0%) | 0 (0.0%) |
| Security & Protection | 0 (0.0%) | 0 (0.0%) |
| Firefighting & Prevention | 0 (0.0%) | 0 (0.0%) |
| Law Enforcement | 0 (0.0%) | 0 (0.0%) |
| Food Preparation & Serving | 0 (0.0%) | 30 (100.0%) |
| Cleaning & Maintenance | 0 (0.0%) | 0 (0.0%) |
| Personal Care & Service | 0 (0.0%) | 0 (0.0%) |
| Total (Category) | 0 (0.0%) | 30 (100.0%) |
| Total (Overall) | 180 (54.7%) | 149 (45.3%) |
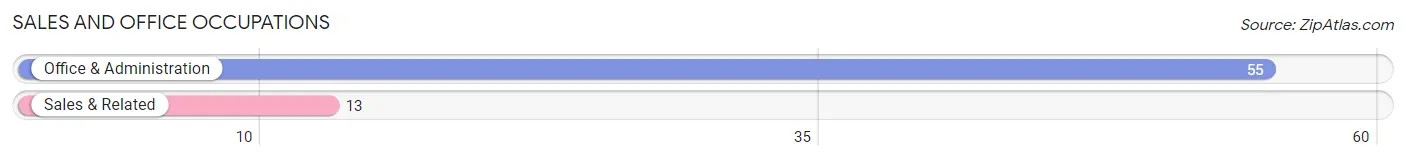
Sales and Office Occupations
The most common Sales and Office occupations in Sabana Eneas are Office & Administration (55 | 16.7%), and Sales & Related (13 | 4.0%).
Sales and Office Occupations by Sex
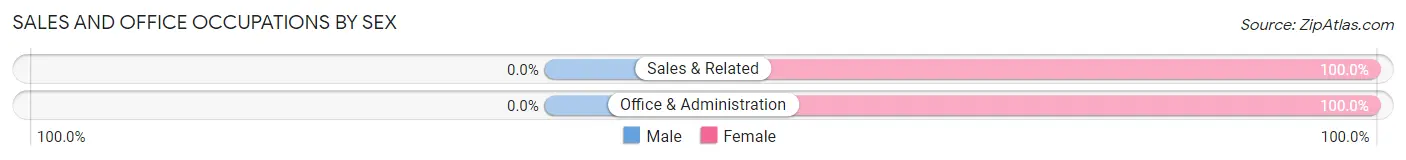
| Occupation | Male | Female |
| Sales & Related | 0 (0.0%) | 13 (100.0%) |
| Office & Administration | 0 (0.0%) | 55 (100.0%) |
| Total (Category) | 0 (0.0%) | 68 (100.0%) |
| Total (Overall) | 180 (54.7%) | 149 (45.3%) |
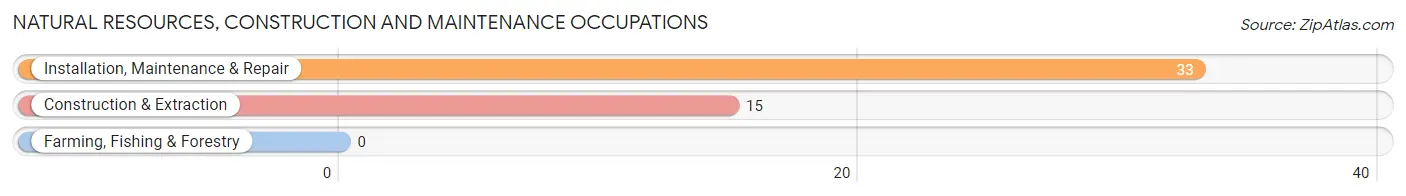
Natural Resources, Construction and Maintenance Occupations
The most common Natural Resources, Construction and Maintenance occupations in Sabana Eneas are Installation, Maintenance & Repair (33 | 10.0%), and Construction & Extraction (15 | 4.6%).
Natural Resources, Construction and Maintenance Occupations by Sex
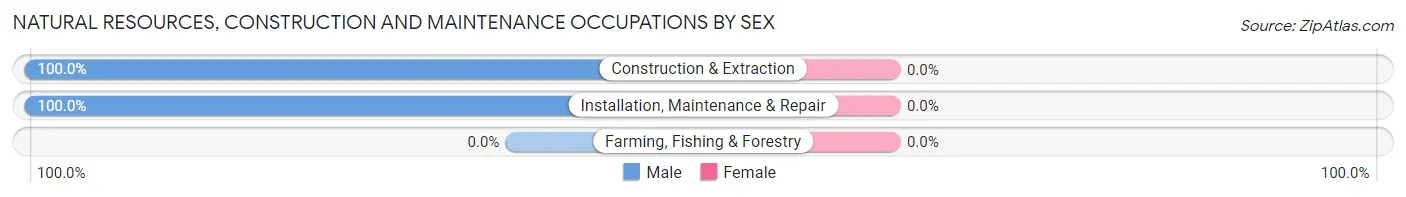
| Occupation | Male | Female |
| Farming, Fishing & Forestry | 0 (0.0%) | 0 (0.0%) |
| Construction & Extraction | 15 (100.0%) | 0 (0.0%) |
| Installation, Maintenance & Repair | 33 (100.0%) | 0 (0.0%) |
| Total (Category) | 48 (100.0%) | 0 (0.0%) |
| Total (Overall) | 180 (54.7%) | 149 (45.3%) |
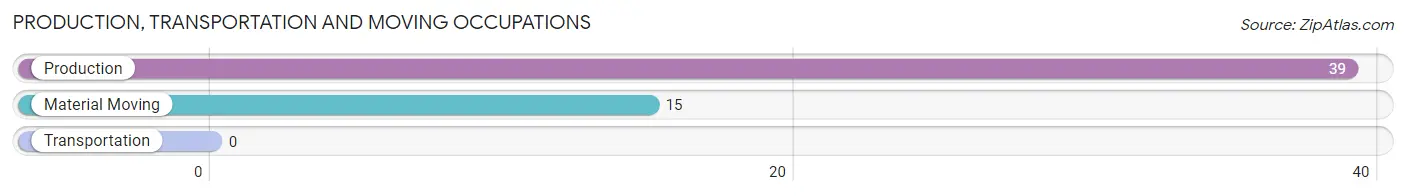
Production, Transportation and Moving Occupations
The most common Production, Transportation and Moving occupations in Sabana Eneas are Production (39 | 11.8%), and Material Moving (15 | 4.6%).
Production, Transportation and Moving Occupations by Sex
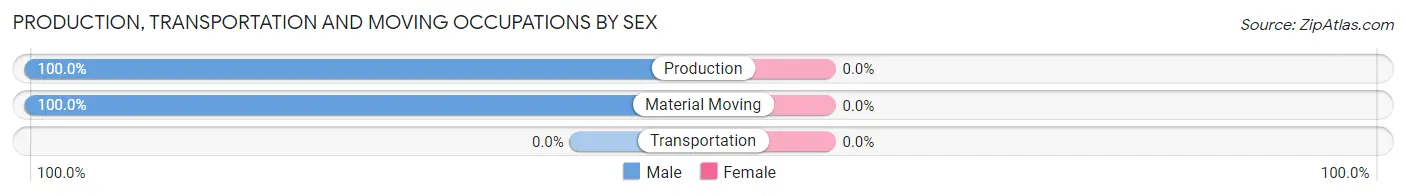
| Occupation | Male | Female |
| Production | 39 (100.0%) | 0 (0.0%) |
| Transportation | 0 (0.0%) | 0 (0.0%) |
| Material Moving | 15 (100.0%) | 0 (0.0%) |
| Total (Category) | 54 (100.0%) | 0 (0.0%) |
| Total (Overall) | 180 (54.7%) | 149 (45.3%) |
Employment Industries by Sex in Sabana Eneas
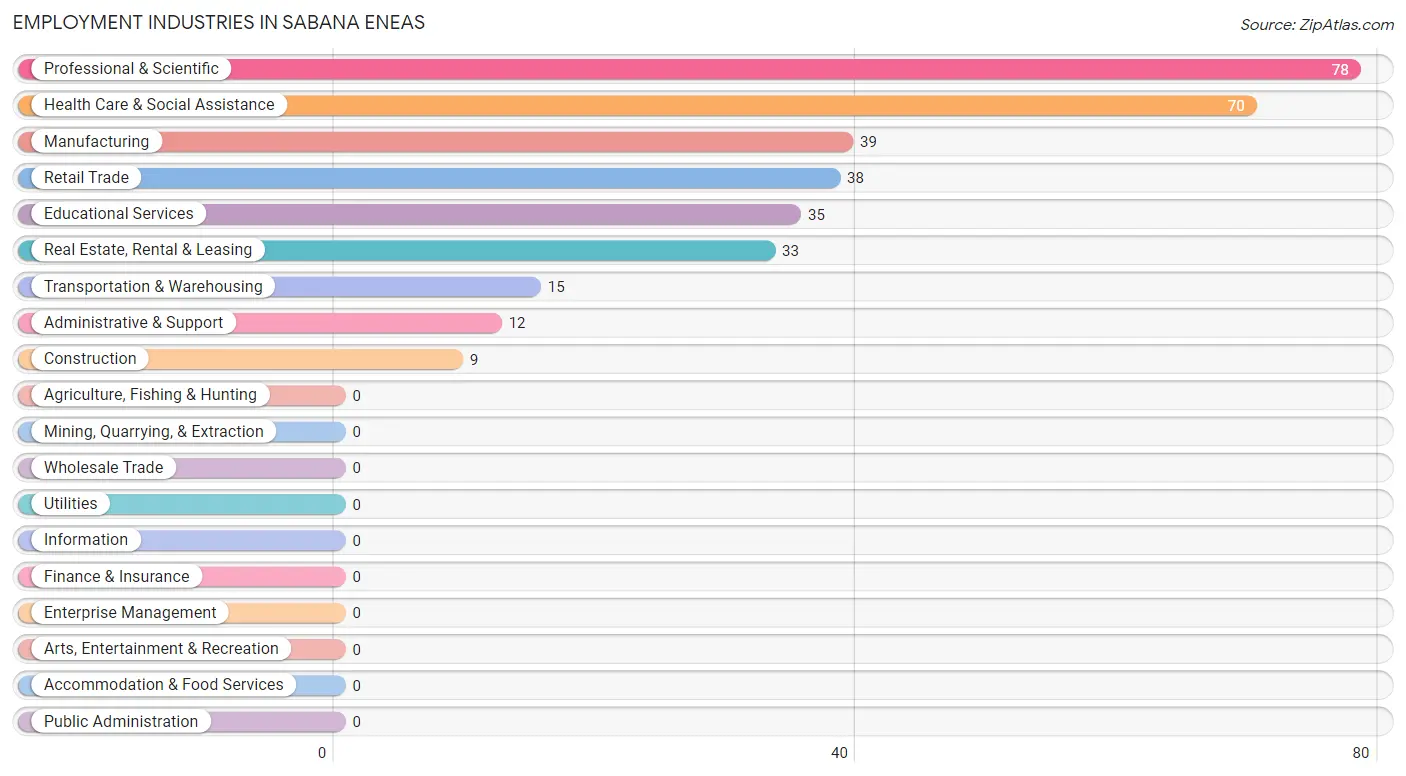
Employment Industries in Sabana Eneas
The major employment industries in Sabana Eneas include Professional & Scientific (78 | 23.7%), Health Care & Social Assistance (70 | 21.3%), Manufacturing (39 | 11.8%), Retail Trade (38 | 11.6%), and Educational Services (35 | 10.6%).
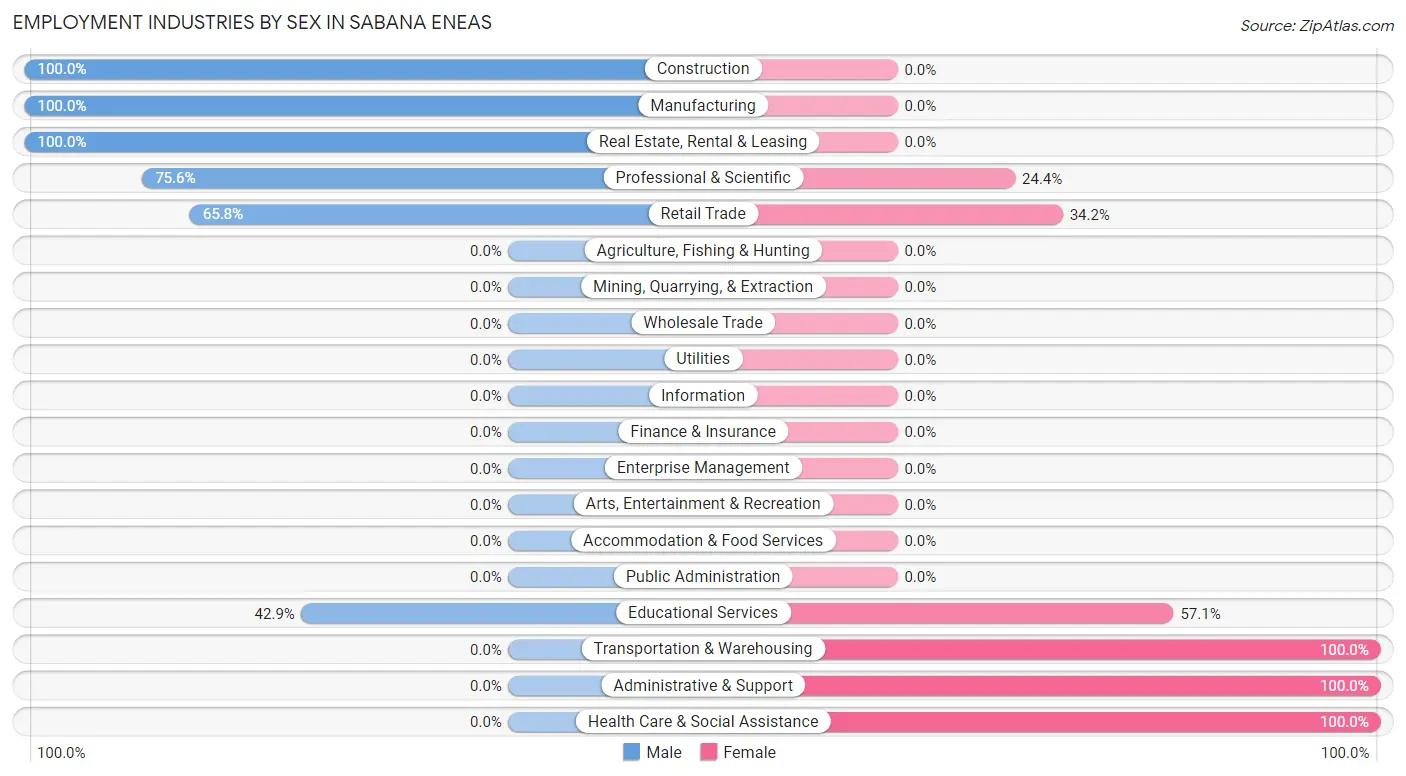
Employment Industries by Sex in Sabana Eneas
The Sabana Eneas industries that see more men than women are Construction (100.0%), Manufacturing (100.0%), and Real Estate, Rental & Leasing (100.0%), whereas the industries that tend to have a higher number of women are Transportation & Warehousing (100.0%), Administrative & Support (100.0%), and Health Care & Social Assistance (100.0%).
| Industry | Male | Female |
| Agriculture, Fishing & Hunting | 0 (0.0%) | 0 (0.0%) |
| Mining, Quarrying, & Extraction | 0 (0.0%) | 0 (0.0%) |
| Construction | 9 (100.0%) | 0 (0.0%) |
| Manufacturing | 39 (100.0%) | 0 (0.0%) |
| Wholesale Trade | 0 (0.0%) | 0 (0.0%) |
| Retail Trade | 25 (65.8%) | 13 (34.2%) |
| Transportation & Warehousing | 0 (0.0%) | 15 (100.0%) |
| Utilities | 0 (0.0%) | 0 (0.0%) |
| Information | 0 (0.0%) | 0 (0.0%) |
| Finance & Insurance | 0 (0.0%) | 0 (0.0%) |
| Real Estate, Rental & Leasing | 33 (100.0%) | 0 (0.0%) |
| Professional & Scientific | 59 (75.6%) | 19 (24.4%) |
| Enterprise Management | 0 (0.0%) | 0 (0.0%) |
| Administrative & Support | 0 (0.0%) | 12 (100.0%) |
| Educational Services | 15 (42.9%) | 20 (57.1%) |
| Health Care & Social Assistance | 0 (0.0%) | 70 (100.0%) |
| Arts, Entertainment & Recreation | 0 (0.0%) | 0 (0.0%) |
| Accommodation & Food Services | 0 (0.0%) | 0 (0.0%) |
| Public Administration | 0 (0.0%) | 0 (0.0%) |
| Total | 180 (54.7%) | 149 (45.3%) |
Education in Sabana Eneas
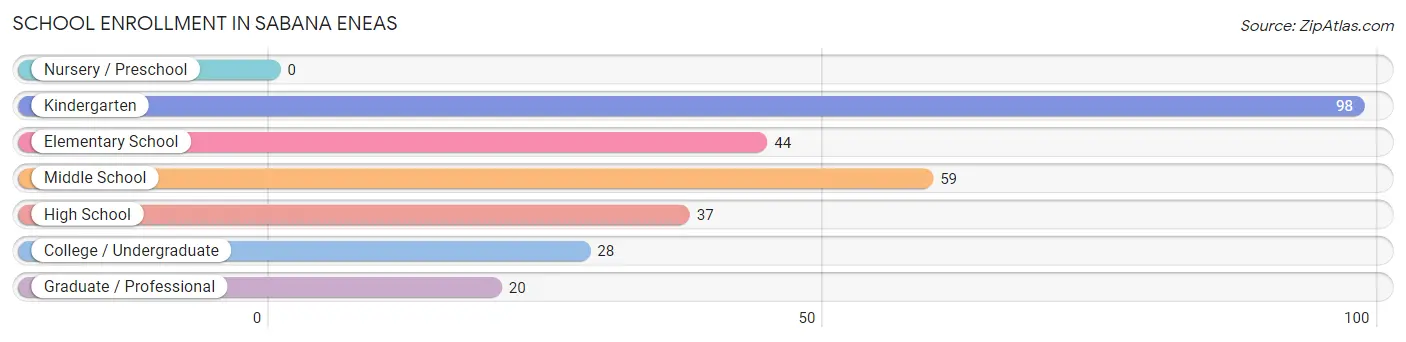
School Enrollment in Sabana Eneas
The most common levels of schooling among the 286 students in Sabana Eneas are kindergarten (98 | 34.3%), middle school (59 | 20.6%), and elementary school (44 | 15.4%).
| School Level | # Students | % Students |
| Nursery / Preschool | 0 | 0.0% |
| Kindergarten | 98 | 34.3% |
| Elementary School | 44 | 15.4% |
| Middle School | 59 | 20.6% |
| High School | 37 | 12.9% |
| College / Undergraduate | 28 | 9.8% |
| Graduate / Professional | 20 | 7.0% |
| Total | 286 | 100.0% |
School Enrollment by Age by Funding Source in Sabana Eneas
Out of a total of 286 students who are enrolled in schools in Sabana Eneas, 75 (26.2%) attend a private institution, while the remaining 211 (73.8%) are enrolled in public schools. The age group of 18 to 19 year olds has the highest likelihood of being enrolled in private schools, with 7 (100.0% in the age bracket) enrolled. Conversely, the age group of 15 to 17 year olds has the lowest likelihood of being enrolled in a private school, with 37 (100.0% in the age bracket) attending a public institution.
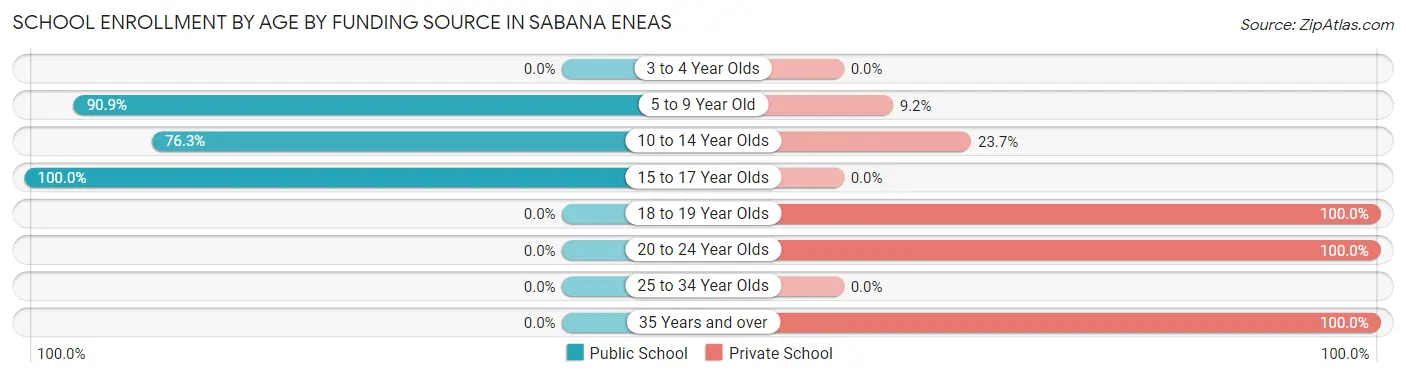
| Age Bracket | Public School | Private School |
| 3 to 4 Year Olds | 0 (0.0%) | 0 (0.0%) |
| 5 to 9 Year Old | 129 (90.8%) | 13 (9.1%) |
| 10 to 14 Year Olds | 45 (76.3%) | 14 (23.7%) |
| 15 to 17 Year Olds | 37 (100.0%) | 0 (0.0%) |
| 18 to 19 Year Olds | 0 (0.0%) | 7 (100.0%) |
| 20 to 24 Year Olds | 0 (0.0%) | 25 (100.0%) |
| 25 to 34 Year Olds | 0 (0.0%) | 0 (0.0%) |
| 35 Years and over | 0 (0.0%) | 16 (100.0%) |
| Total | 211 (73.8%) | 75 (26.2%) |
Educational Attainment by Field of Study in Sabana Eneas
Business (148 | 56.5%), science & technology (27 | 10.3%), education (26 | 9.9%), psychology (23 | 8.8%), and arts & humanities (21 | 8.0%) are the most common fields of study among 262 individuals in Sabana Eneas who have obtained a bachelor's degree or higher.
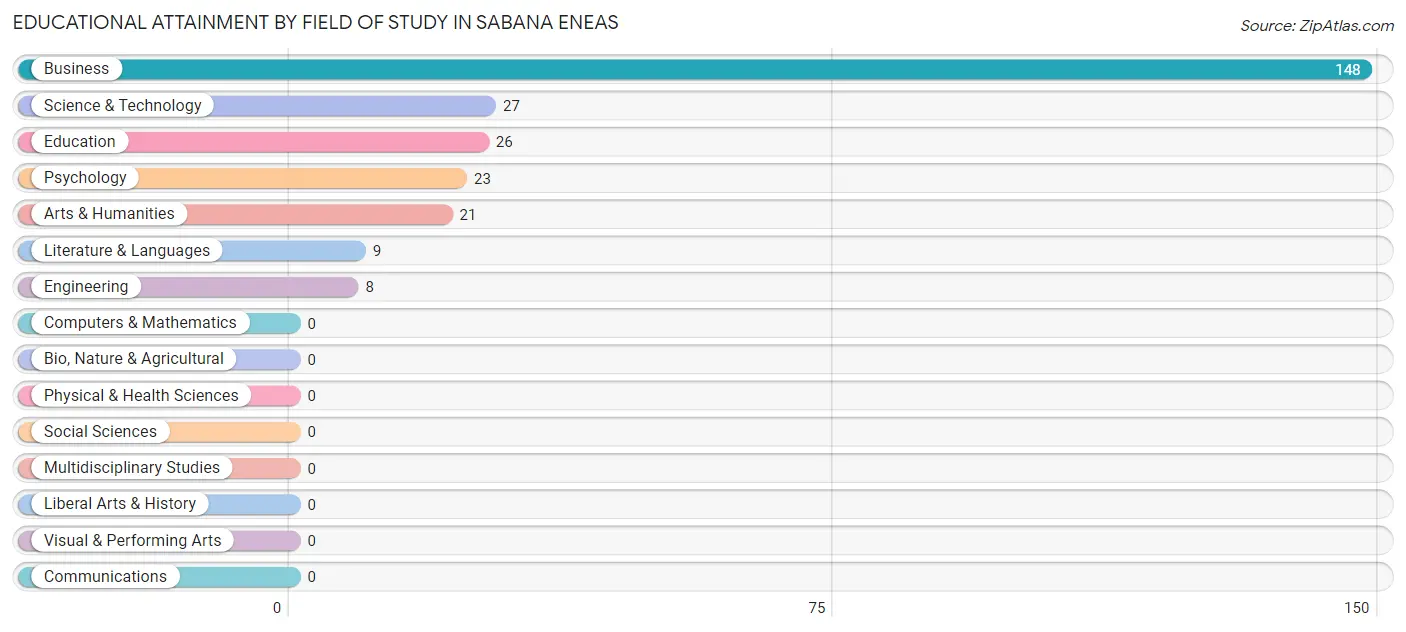
| Field of Study | # Graduates | % Graduates |
| Computers & Mathematics | 0 | 0.0% |
| Bio, Nature & Agricultural | 0 | 0.0% |
| Physical & Health Sciences | 0 | 0.0% |
| Psychology | 23 | 8.8% |
| Social Sciences | 0 | 0.0% |
| Engineering | 8 | 3.0% |
| Multidisciplinary Studies | 0 | 0.0% |
| Science & Technology | 27 | 10.3% |
| Business | 148 | 56.5% |
| Education | 26 | 9.9% |
| Literature & Languages | 9 | 3.4% |
| Liberal Arts & History | 0 | 0.0% |
| Visual & Performing Arts | 0 | 0.0% |
| Communications | 0 | 0.0% |
| Arts & Humanities | 21 | 8.0% |
| Total | 262 | 100.0% |
Transportation & Commute in Sabana Eneas
Vehicle Availability by Sex in Sabana Eneas
The most prevalent vehicle ownership categories in Sabana Eneas are males with 2 vehicles (90, accounting for 50.0%) and females with 2 vehicles (65, making up 67.2%).
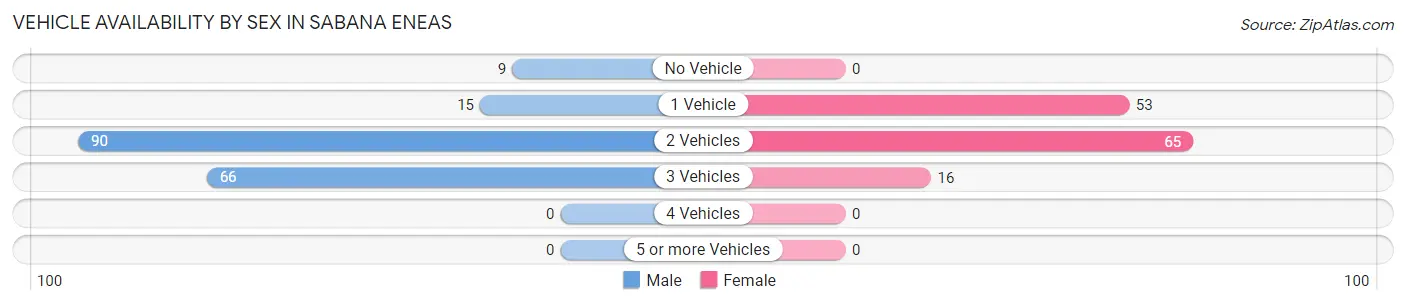
| Vehicles Available | Male | Female |
| No Vehicle | 9 (5.0%) | 0 (0.0%) |
| 1 Vehicle | 15 (8.3%) | 53 (39.6%) |
| 2 Vehicles | 90 (50.0%) | 65 (48.5%) |
| 3 Vehicles | 66 (36.7%) | 16 (11.9%) |
| 4 Vehicles | 0 (0.0%) | 0 (0.0%) |
| 5 or more Vehicles | 0 (0.0%) | 0 (0.0%) |
| Total | 180 (100.0%) | 134 (100.0%) |
Commute Time in Sabana Eneas
The most frequently occuring commute durations in Sabana Eneas are 10 to 14 minutes (136 commuters, 44.6%), 15 to 19 minutes (56 commuters, 18.4%), and 40 to 44 minutes (33 commuters, 10.8%).
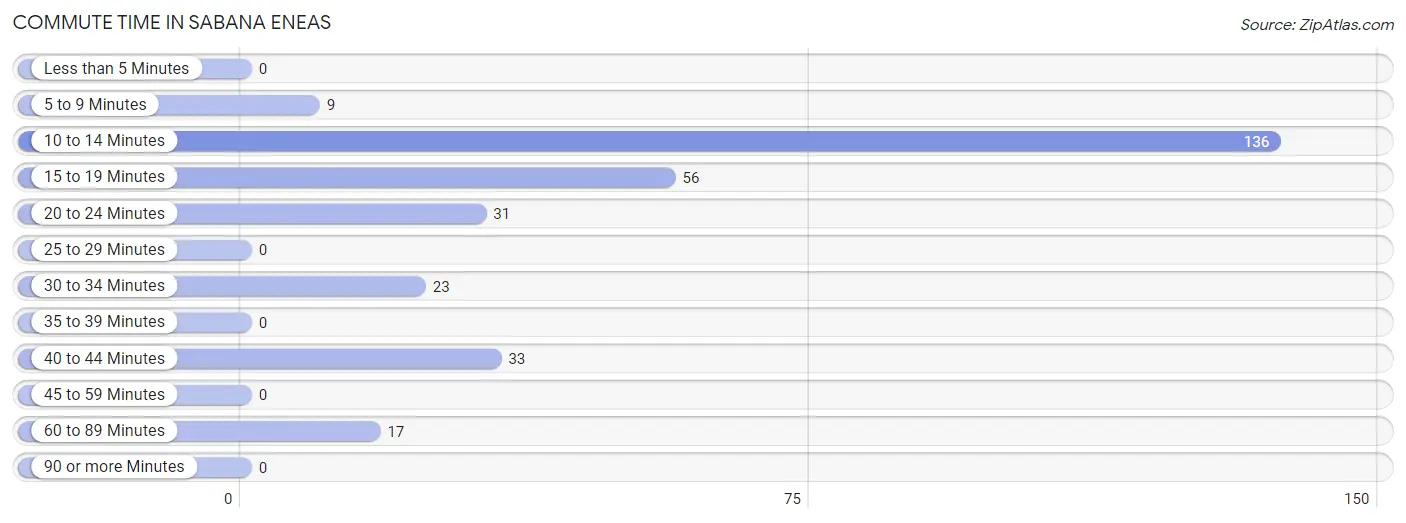
| Commute Time | # Commuters | % Commuters |
| Less than 5 Minutes | 0 | 0.0% |
| 5 to 9 Minutes | 9 | 2.9% |
| 10 to 14 Minutes | 136 | 44.6% |
| 15 to 19 Minutes | 56 | 18.4% |
| 20 to 24 Minutes | 31 | 10.2% |
| 25 to 29 Minutes | 0 | 0.0% |
| 30 to 34 Minutes | 23 | 7.5% |
| 35 to 39 Minutes | 0 | 0.0% |
| 40 to 44 Minutes | 33 | 10.8% |
| 45 to 59 Minutes | 0 | 0.0% |
| 60 to 89 Minutes | 17 | 5.6% |
| 90 or more Minutes | 0 | 0.0% |
Commute Time by Sex in Sabana Eneas
The most common commute times in Sabana Eneas are 10 to 14 minutes (90 commuters, 50.0%) for males and 10 to 14 minutes (46 commuters, 36.8%) for females.
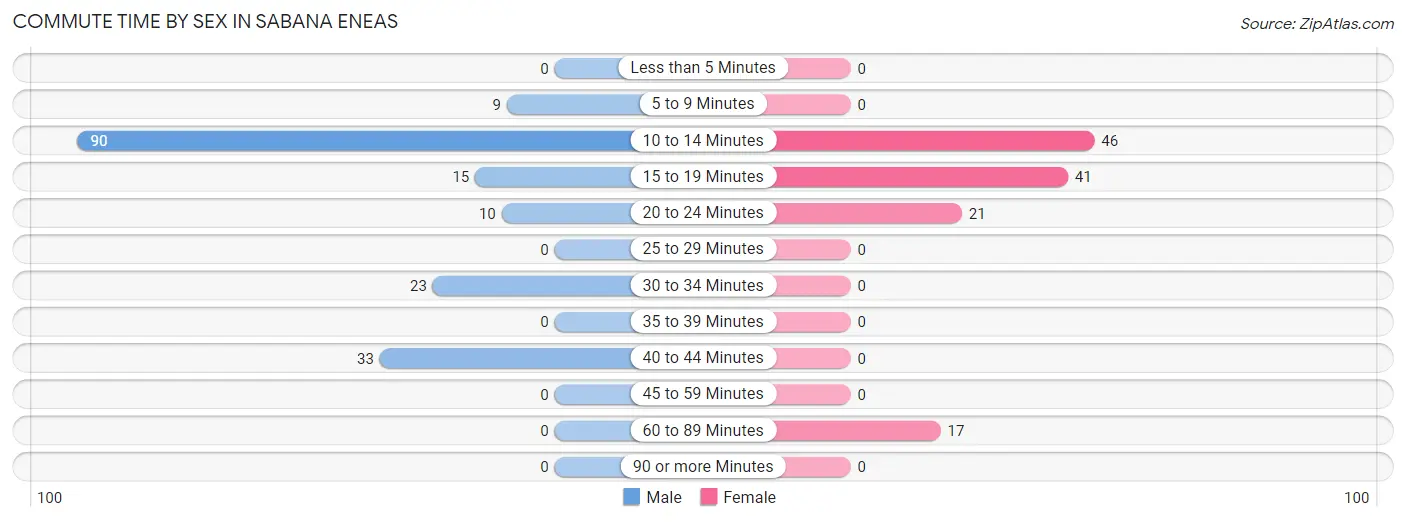
| Commute Time | Male | Female |
| Less than 5 Minutes | 0 (0.0%) | 0 (0.0%) |
| 5 to 9 Minutes | 9 (5.0%) | 0 (0.0%) |
| 10 to 14 Minutes | 90 (50.0%) | 46 (36.8%) |
| 15 to 19 Minutes | 15 (8.3%) | 41 (32.8%) |
| 20 to 24 Minutes | 10 (5.6%) | 21 (16.8%) |
| 25 to 29 Minutes | 0 (0.0%) | 0 (0.0%) |
| 30 to 34 Minutes | 23 (12.8%) | 0 (0.0%) |
| 35 to 39 Minutes | 0 (0.0%) | 0 (0.0%) |
| 40 to 44 Minutes | 33 (18.3%) | 0 (0.0%) |
| 45 to 59 Minutes | 0 (0.0%) | 0 (0.0%) |
| 60 to 89 Minutes | 0 (0.0%) | 17 (13.6%) |
| 90 or more Minutes | 0 (0.0%) | 0 (0.0%) |
Time of Departure to Work by Sex in Sabana Eneas
The most frequent times of departure to work in Sabana Eneas are 7:00 AM to 7:29 AM (142, 78.9%) for males and 7:00 AM to 7:29 AM (41, 32.8%) for females.
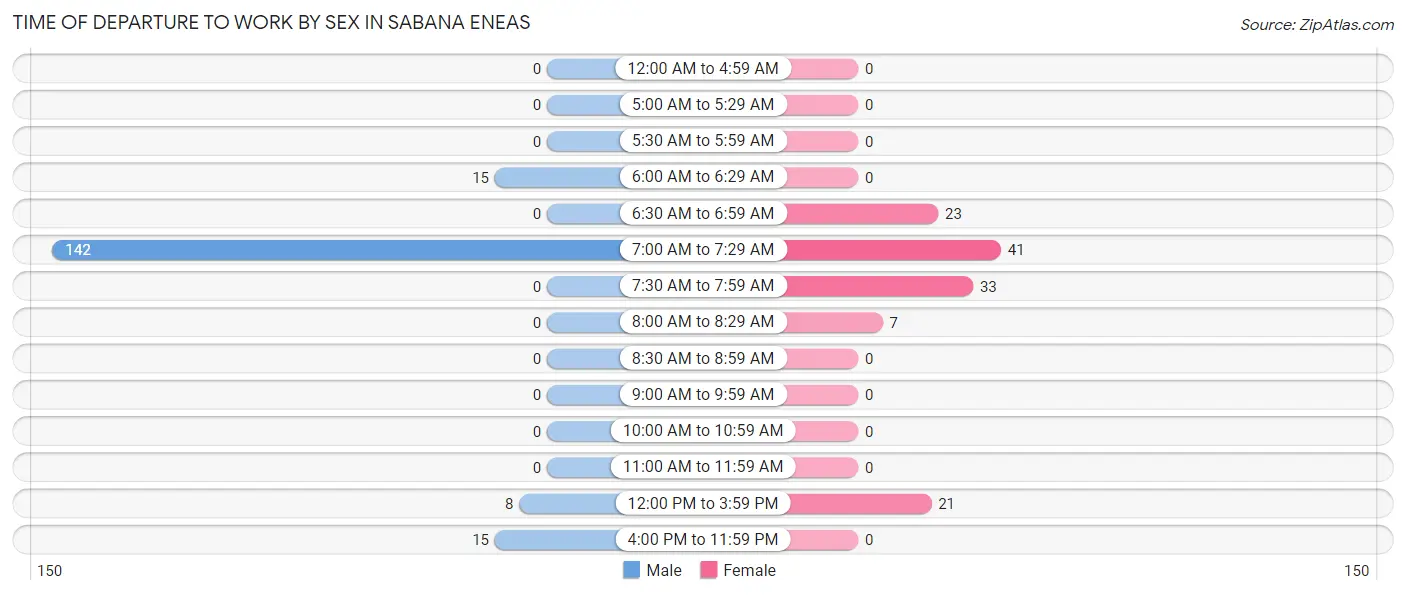
| Time of Departure | Male | Female |
| 12:00 AM to 4:59 AM | 0 (0.0%) | 0 (0.0%) |
| 5:00 AM to 5:29 AM | 0 (0.0%) | 0 (0.0%) |
| 5:30 AM to 5:59 AM | 0 (0.0%) | 0 (0.0%) |
| 6:00 AM to 6:29 AM | 15 (8.3%) | 0 (0.0%) |
| 6:30 AM to 6:59 AM | 0 (0.0%) | 23 (18.4%) |
| 7:00 AM to 7:29 AM | 142 (78.9%) | 41 (32.8%) |
| 7:30 AM to 7:59 AM | 0 (0.0%) | 33 (26.4%) |
| 8:00 AM to 8:29 AM | 0 (0.0%) | 7 (5.6%) |
| 8:30 AM to 8:59 AM | 0 (0.0%) | 0 (0.0%) |
| 9:00 AM to 9:59 AM | 0 (0.0%) | 0 (0.0%) |
| 10:00 AM to 10:59 AM | 0 (0.0%) | 0 (0.0%) |
| 11:00 AM to 11:59 AM | 0 (0.0%) | 0 (0.0%) |
| 12:00 PM to 3:59 PM | 8 (4.4%) | 21 (16.8%) |
| 4:00 PM to 11:59 PM | 15 (8.3%) | 0 (0.0%) |
| Total | 180 (100.0%) | 125 (100.0%) |
Housing Occupancy in Sabana Eneas
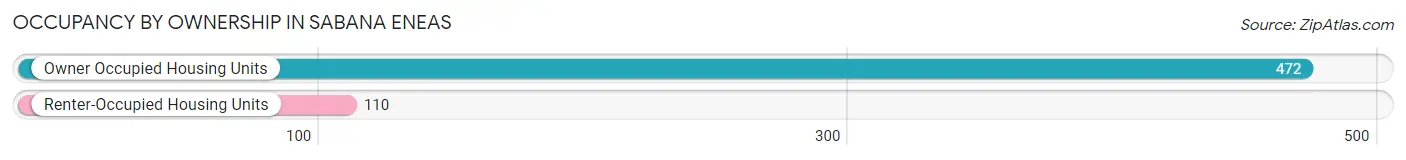
Occupancy by Ownership in Sabana Eneas
Of the total 582 dwellings in Sabana Eneas, owner-occupied units account for 472 (81.1%), while renter-occupied units make up 110 (18.9%).
| Occupancy | # Housing Units | % Housing Units |
| Owner Occupied Housing Units | 472 | 81.1% |
| Renter-Occupied Housing Units | 110 | 18.9% |
| Total Occupied Housing Units | 582 | 100.0% |
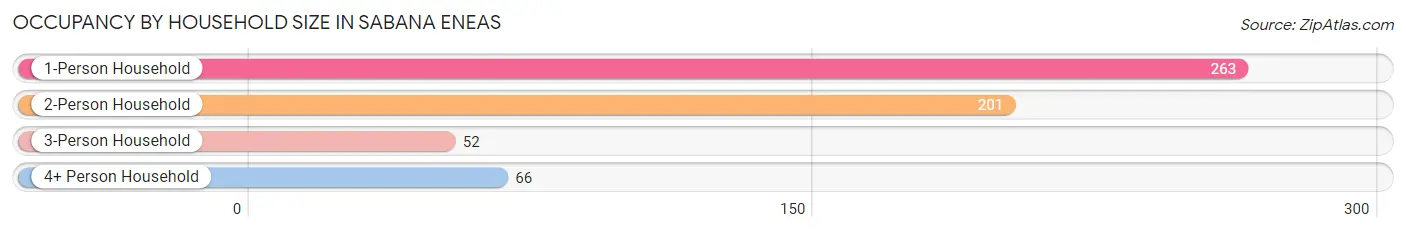
Occupancy by Household Size in Sabana Eneas
| Household Size | # Housing Units | % Housing Units |
| 1-Person Household | 263 | 45.2% |
| 2-Person Household | 201 | 34.5% |
| 3-Person Household | 52 | 8.9% |
| 4+ Person Household | 66 | 11.3% |
| Total Housing Units | 582 | 100.0% |
Occupancy by Ownership by Household Size in Sabana Eneas
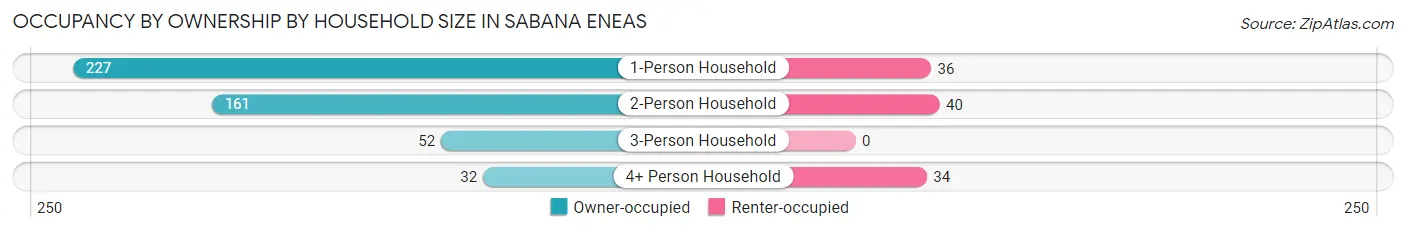
| Household Size | Owner-occupied | Renter-occupied |
| 1-Person Household | 227 (86.3%) | 36 (13.7%) |
| 2-Person Household | 161 (80.1%) | 40 (19.9%) |
| 3-Person Household | 52 (100.0%) | 0 (0.0%) |
| 4+ Person Household | 32 (48.5%) | 34 (51.5%) |
| Total Housing Units | 472 (81.1%) | 110 (18.9%) |
Occupancy by Educational Attainment in Sabana Eneas
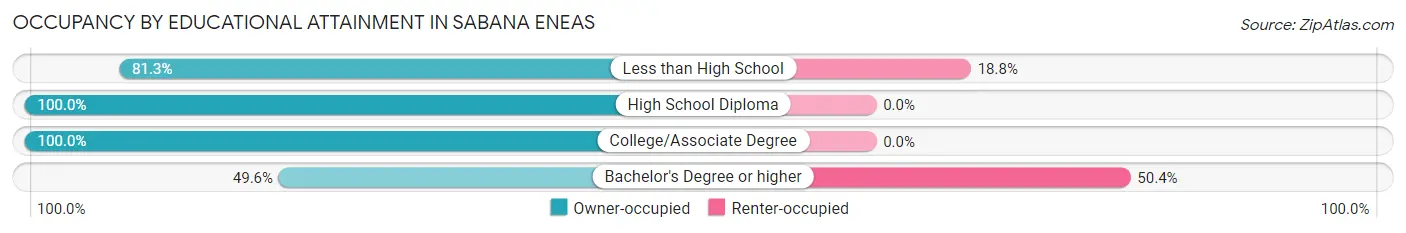
| Household Size | Owner-occupied | Renter-occupied |
| Less than High School | 208 (81.2%) | 48 (18.8%) |
| High School Diploma | 147 (100.0%) | 0 (0.0%) |
| College/Associate Degree | 56 (100.0%) | 0 (0.0%) |
| Bachelor's Degree or higher | 61 (49.6%) | 62 (50.4%) |
Occupancy by Age of Householder in Sabana Eneas
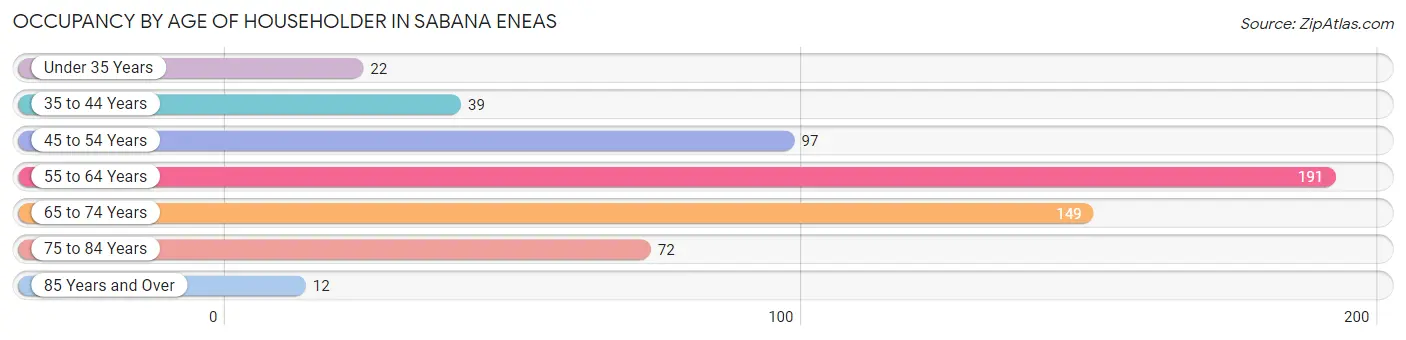
| Age Bracket | # Households | % Households |
| Under 35 Years | 22 | 3.8% |
| 35 to 44 Years | 39 | 6.7% |
| 45 to 54 Years | 97 | 16.7% |
| 55 to 64 Years | 191 | 32.8% |
| 65 to 74 Years | 149 | 25.6% |
| 75 to 84 Years | 72 | 12.4% |
| 85 Years and Over | 12 | 2.1% |
| Total | 582 | 100.0% |
Housing Finances in Sabana Eneas
Median Income by Occupancy in Sabana Eneas
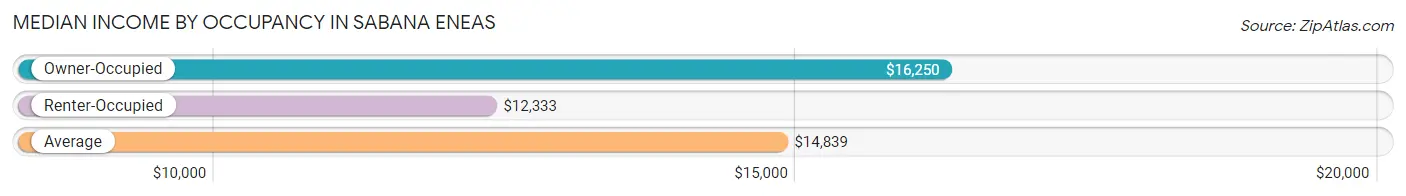
| Occupancy Type | # Households | Median Income |
| Owner-Occupied | 472 (81.1%) | $16,250 |
| Renter-Occupied | 110 (18.9%) | $12,333 |
| Average | 582 (100.0%) | $14,839 |
Occupancy by Householder Income Bracket in Sabana Eneas
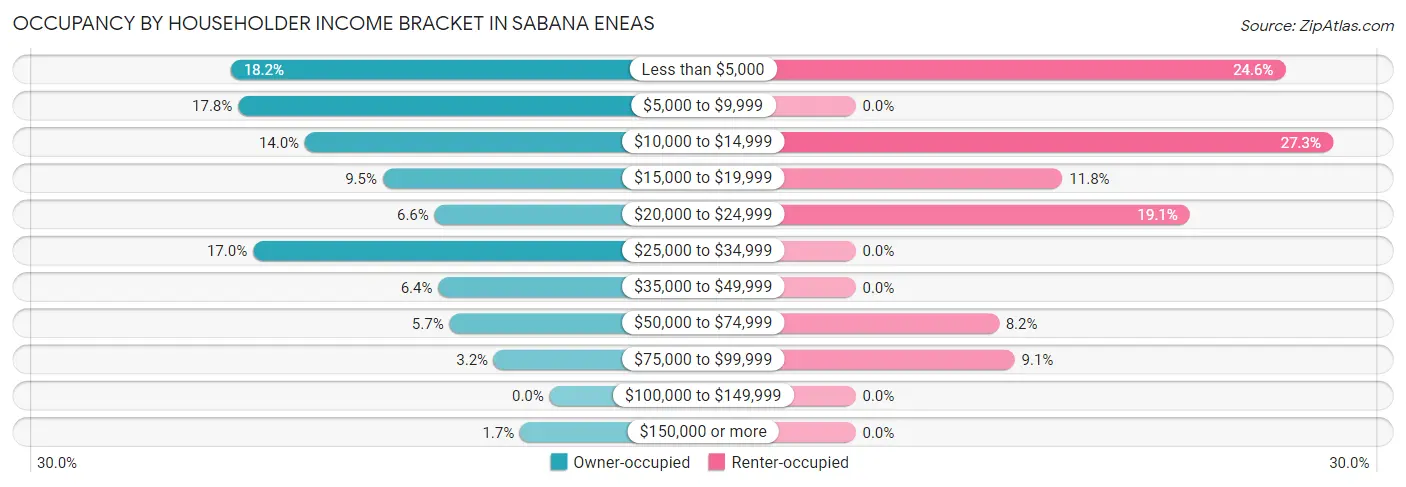
| Income Bracket | Owner-occupied | Renter-occupied |
| Less than $5,000 | 86 (18.2%) | 27 (24.5%) |
| $5,000 to $9,999 | 84 (17.8%) | 0 (0.0%) |
| $10,000 to $14,999 | 66 (14.0%) | 30 (27.3%) |
| $15,000 to $19,999 | 45 (9.5%) | 13 (11.8%) |
| $20,000 to $24,999 | 31 (6.6%) | 21 (19.1%) |
| $25,000 to $34,999 | 80 (17.0%) | 0 (0.0%) |
| $35,000 to $49,999 | 30 (6.4%) | 0 (0.0%) |
| $50,000 to $74,999 | 27 (5.7%) | 9 (8.2%) |
| $75,000 to $99,999 | 15 (3.2%) | 10 (9.1%) |
| $100,000 to $149,999 | 0 (0.0%) | 0 (0.0%) |
| $150,000 or more | 8 (1.7%) | 0 (0.0%) |
| Total | 472 (100.0%) | 110 (100.0%) |
Monthly Housing Cost Tiers in Sabana Eneas
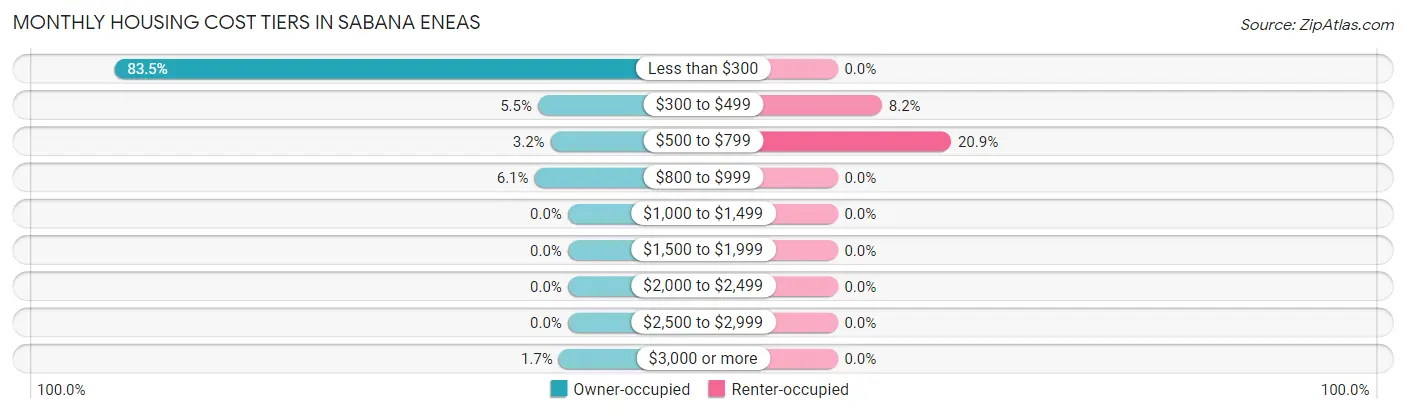
| Monthly Cost | Owner-occupied | Renter-occupied |
| Less than $300 | 394 (83.5%) | 0 (0.0%) |
| $300 to $499 | 26 (5.5%) | 9 (8.2%) |
| $500 to $799 | 15 (3.2%) | 23 (20.9%) |
| $800 to $999 | 29 (6.1%) | 0 (0.0%) |
| $1,000 to $1,499 | 0 (0.0%) | 0 (0.0%) |
| $1,500 to $1,999 | 0 (0.0%) | 0 (0.0%) |
| $2,000 to $2,499 | 0 (0.0%) | 0 (0.0%) |
| $2,500 to $2,999 | 0 (0.0%) | 0 (0.0%) |
| $3,000 or more | 8 (1.7%) | 0 (0.0%) |
| Total | 472 (100.0%) | 110 (100.0%) |
Physical Housing Characteristics in Sabana Eneas
Housing Structures in Sabana Eneas
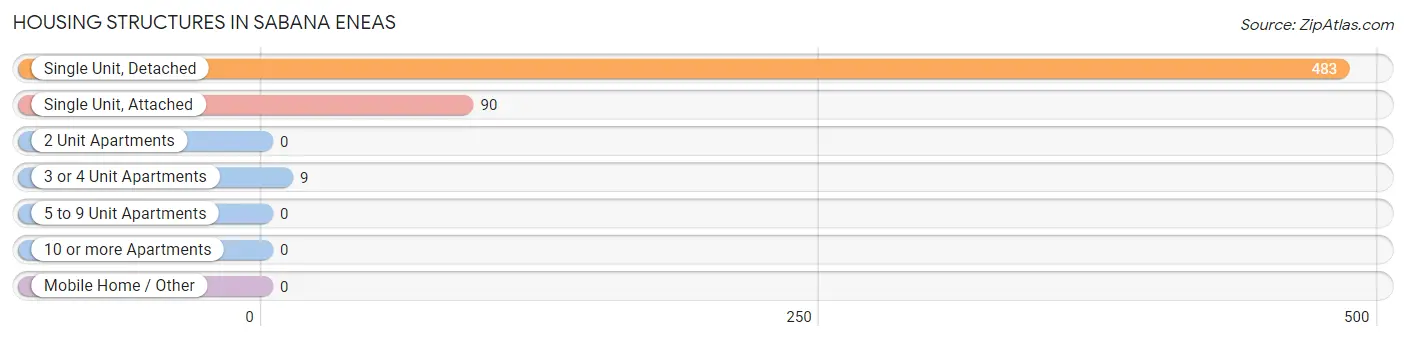
| Structure Type | # Housing Units | % Housing Units |
| Single Unit, Detached | 483 | 83.0% |
| Single Unit, Attached | 90 | 15.5% |
| 2 Unit Apartments | 0 | 0.0% |
| 3 or 4 Unit Apartments | 9 | 1.5% |
| 5 to 9 Unit Apartments | 0 | 0.0% |
| 10 or more Apartments | 0 | 0.0% |
| Mobile Home / Other | 0 | 0.0% |
| Total | 582 | 100.0% |
Housing Structures by Occupancy in Sabana Eneas
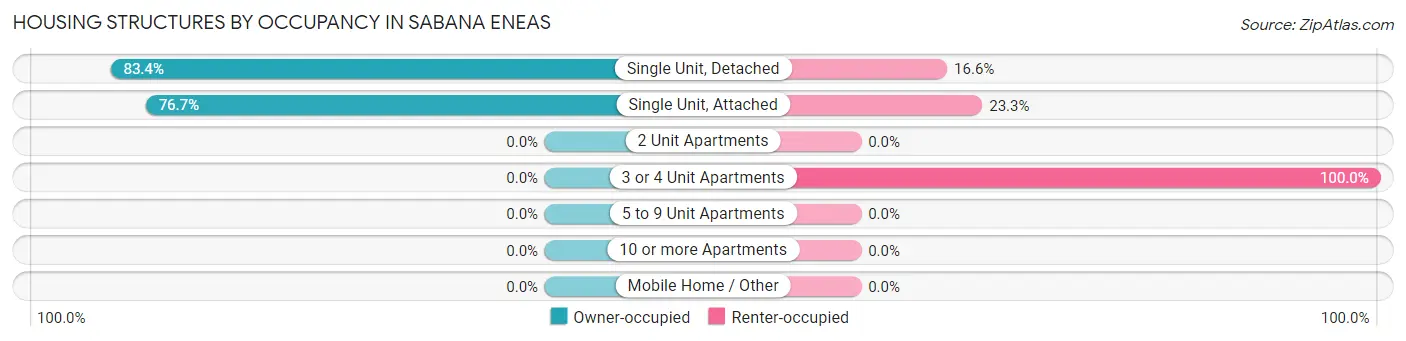
| Structure Type | Owner-occupied | Renter-occupied |
| Single Unit, Detached | 403 (83.4%) | 80 (16.6%) |
| Single Unit, Attached | 69 (76.7%) | 21 (23.3%) |
| 2 Unit Apartments | 0 (0.0%) | 0 (0.0%) |
| 3 or 4 Unit Apartments | 0 (0.0%) | 9 (100.0%) |
| 5 to 9 Unit Apartments | 0 (0.0%) | 0 (0.0%) |
| 10 or more Apartments | 0 (0.0%) | 0 (0.0%) |
| Mobile Home / Other | 0 (0.0%) | 0 (0.0%) |
| Total | 472 (81.1%) | 110 (18.9%) |
Housing Structures by Number of Rooms in Sabana Eneas
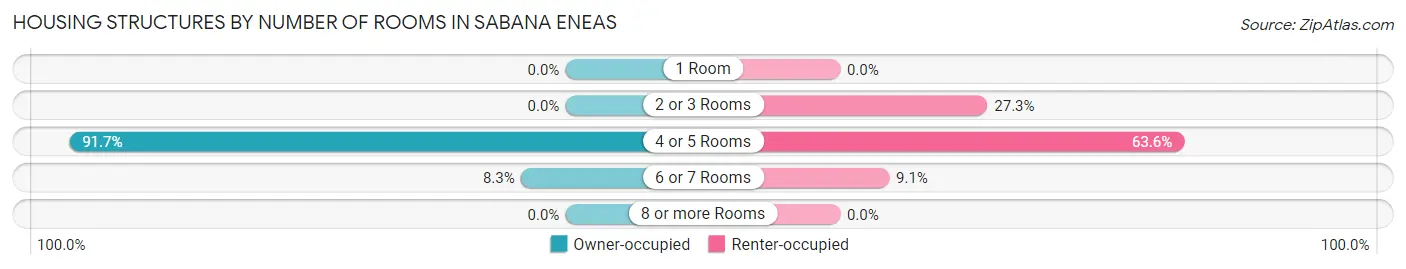
| Number of Rooms | Owner-occupied | Renter-occupied |
| 1 Room | 0 (0.0%) | 0 (0.0%) |
| 2 or 3 Rooms | 0 (0.0%) | 30 (27.3%) |
| 4 or 5 Rooms | 433 (91.7%) | 70 (63.6%) |
| 6 or 7 Rooms | 39 (8.3%) | 10 (9.1%) |
| 8 or more Rooms | 0 (0.0%) | 0 (0.0%) |
| Total | 472 (100.0%) | 110 (100.0%) |
Housing Structure by Heating Type in Sabana Eneas
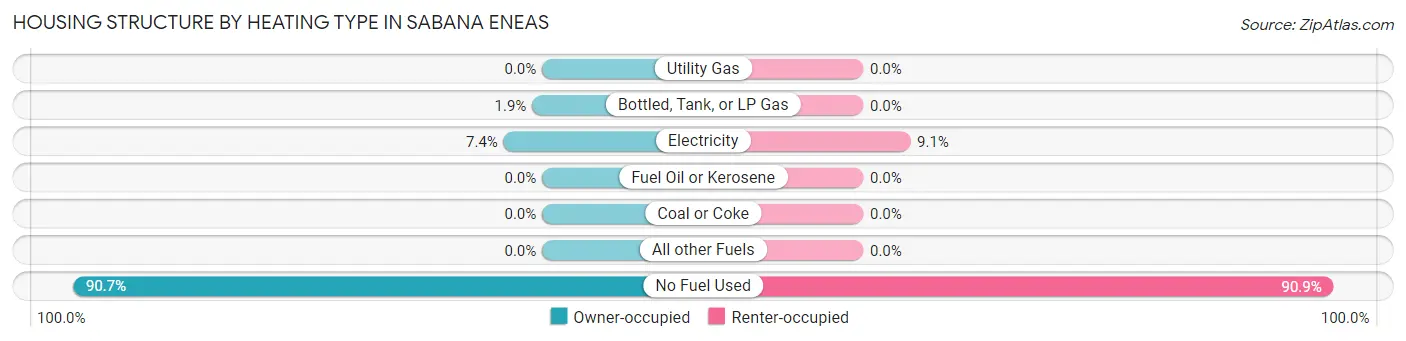
| Heating Type | Owner-occupied | Renter-occupied |
| Utility Gas | 0 (0.0%) | 0 (0.0%) |
| Bottled, Tank, or LP Gas | 9 (1.9%) | 0 (0.0%) |
| Electricity | 35 (7.4%) | 10 (9.1%) |
| Fuel Oil or Kerosene | 0 (0.0%) | 0 (0.0%) |
| Coal or Coke | 0 (0.0%) | 0 (0.0%) |
| All other Fuels | 0 (0.0%) | 0 (0.0%) |
| No Fuel Used | 428 (90.7%) | 100 (90.9%) |
| Total | 472 (100.0%) | 110 (100.0%) |
Household Vehicle Usage in Sabana Eneas
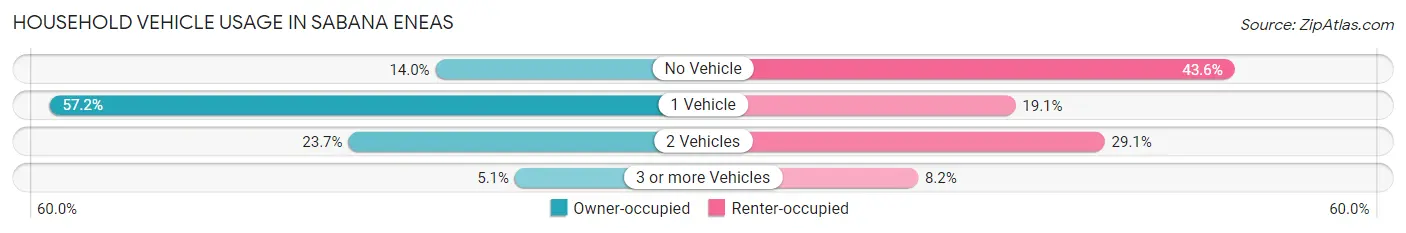
| Vehicles per Household | Owner-occupied | Renter-occupied |
| No Vehicle | 66 (14.0%) | 48 (43.6%) |
| 1 Vehicle | 270 (57.2%) | 21 (19.1%) |
| 2 Vehicles | 112 (23.7%) | 32 (29.1%) |
| 3 or more Vehicles | 24 (5.1%) | 9 (8.2%) |
| Total | 472 (100.0%) | 110 (100.0%) |
Real Estate & Mortgages in Sabana Eneas
Real Estate and Mortgage Overview in Sabana Eneas
| Characteristic | Without Mortgage | With Mortgage |
| Housing Units | 435 | 37 |
| Median Property Value | $64,800 | $137,500 |
| Median Household Income | $13,508 | $8 |
| Monthly Housing Costs | $125 | $8 |
| Real Estate Taxes | - | - |
Property Value by Mortgage Status in Sabana Eneas
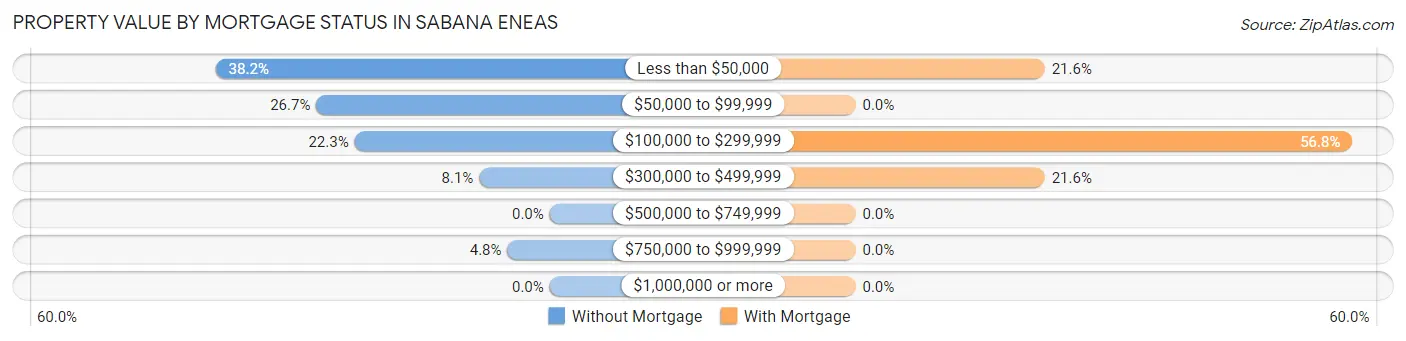
| Property Value | Without Mortgage | With Mortgage |
| Less than $50,000 | 166 (38.2%) | 8 (21.6%) |
| $50,000 to $99,999 | 116 (26.7%) | 0 (0.0%) |
| $100,000 to $299,999 | 97 (22.3%) | 21 (56.8%) |
| $300,000 to $499,999 | 35 (8.1%) | 8 (21.6%) |
| $500,000 to $749,999 | 0 (0.0%) | 0 (0.0%) |
| $750,000 to $999,999 | 21 (4.8%) | 0 (0.0%) |
| $1,000,000 or more | 0 (0.0%) | 0 (0.0%) |
| Total | 435 (100.0%) | 37 (100.0%) |
Household Income by Mortgage Status in Sabana Eneas
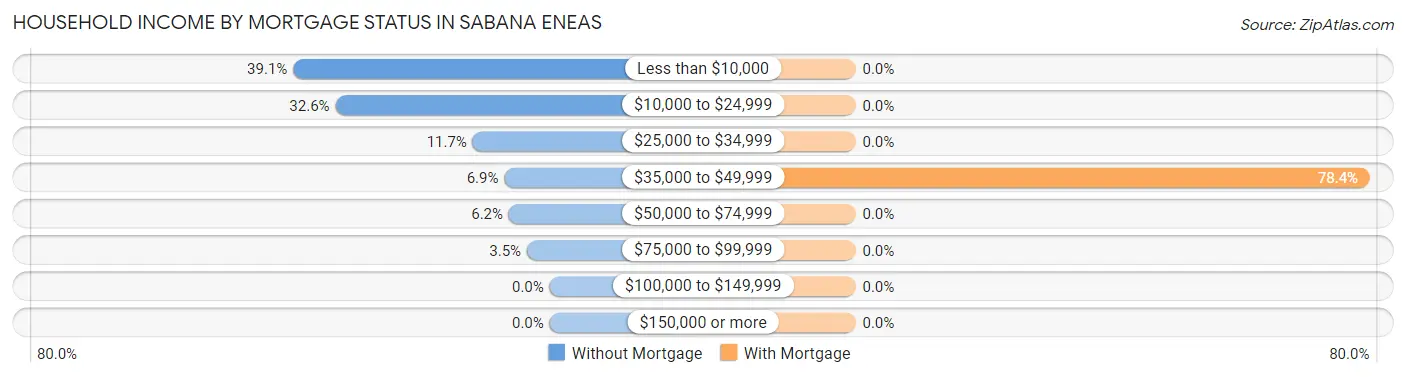
| Household Income | Without Mortgage | With Mortgage |
| Less than $10,000 | 170 (39.1%) | 0 (0.0%) |
| $10,000 to $24,999 | 142 (32.6%) | 0 (0.0%) |
| $25,000 to $34,999 | 51 (11.7%) | 0 (0.0%) |
| $35,000 to $49,999 | 30 (6.9%) | 29 (78.4%) |
| $50,000 to $74,999 | 27 (6.2%) | 0 (0.0%) |
| $75,000 to $99,999 | 15 (3.5%) | 0 (0.0%) |
| $100,000 to $149,999 | 0 (0.0%) | 0 (0.0%) |
| $150,000 or more | 0 (0.0%) | 0 (0.0%) |
| Total | 435 (100.0%) | 37 (100.0%) |
Property Value to Household Income Ratio in Sabana Eneas
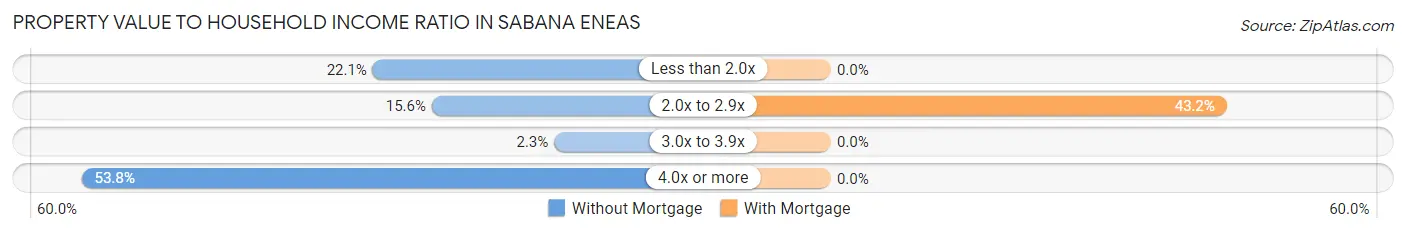
| Value-to-Income Ratio | Without Mortgage | With Mortgage |
| Less than 2.0x | 96 (22.1%) | 0 (0.0%) |
| 2.0x to 2.9x | 68 (15.6%) | 16 (43.2%) |
| 3.0x to 3.9x | 10 (2.3%) | 0 (0.0%) |
| 4.0x or more | 234 (53.8%) | 0 (0.0%) |
| Total | 435 (100.0%) | 37 (100.0%) |
Real Estate Taxes by Mortgage Status in Sabana Eneas
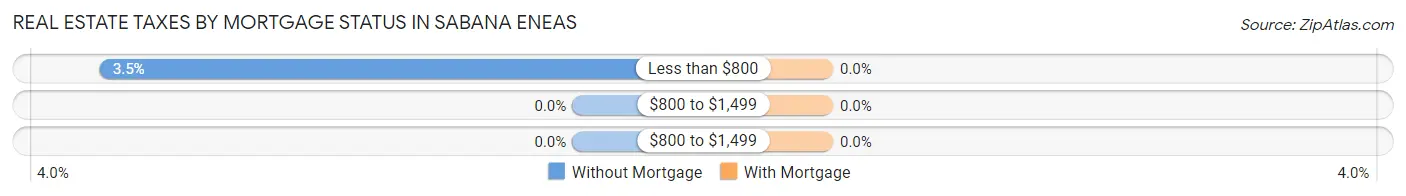
| Property Taxes | Without Mortgage | With Mortgage |
| Less than $800 | 15 (3.5%) | 0 (0.0%) |
| $800 to $1,499 | 0 (0.0%) | 0 (0.0%) |
| $800 to $1,499 | 0 (0.0%) | 0 (0.0%) |
| Total | 435 (100.0%) | 37 (100.0%) |
Health & Disability in Sabana Eneas
Health Insurance Coverage by Age in Sabana Eneas
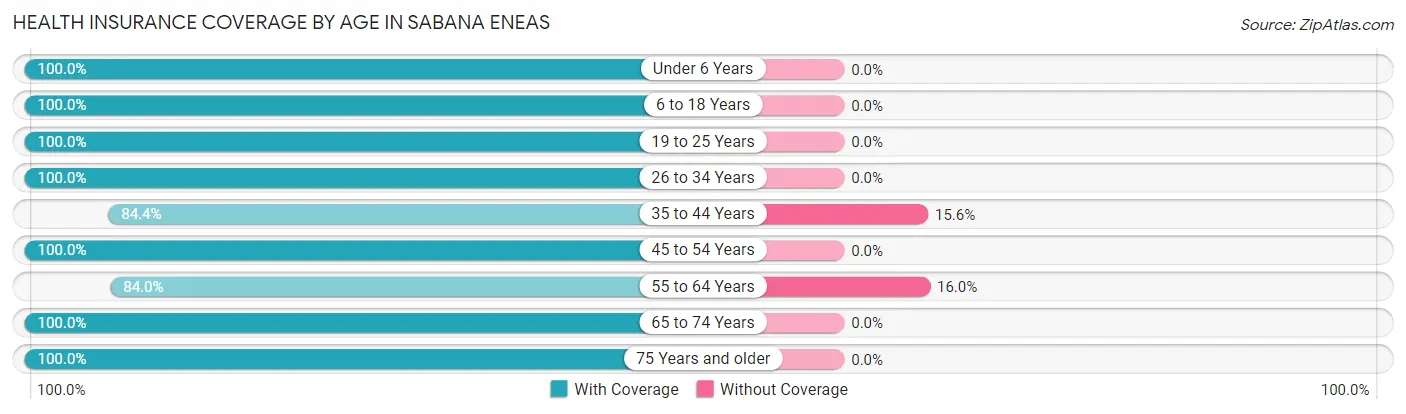
| Age Bracket | With Coverage | Without Coverage |
| Under 6 Years | 98 (100.0%) | 0 (0.0%) |
| 6 to 18 Years | 140 (100.0%) | 0 (0.0%) |
| 19 to 25 Years | 32 (100.0%) | 0 (0.0%) |
| 26 to 34 Years | 138 (100.0%) | 0 (0.0%) |
| 35 to 44 Years | 81 (84.4%) | 15 (15.6%) |
| 45 to 54 Years | 222 (100.0%) | 0 (0.0%) |
| 55 to 64 Years | 226 (84.0%) | 43 (16.0%) |
| 65 to 74 Years | 210 (100.0%) | 0 (0.0%) |
| 75 Years and older | 151 (100.0%) | 0 (0.0%) |
| Total | 1,298 (95.7%) | 58 (4.3%) |
Health Insurance Coverage by Citizenship Status in Sabana Eneas
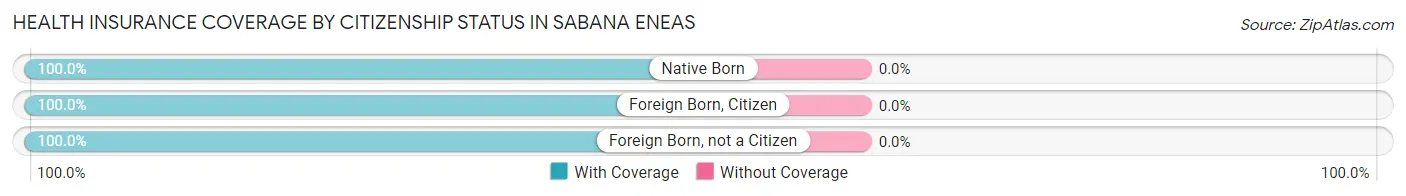
| Citizenship Status | With Coverage | Without Coverage |
| Native Born | 98 (100.0%) | 0 (0.0%) |
| Foreign Born, Citizen | 140 (100.0%) | 0 (0.0%) |
| Foreign Born, not a Citizen | 32 (100.0%) | 0 (0.0%) |
Health Insurance Coverage by Household Income in Sabana Eneas
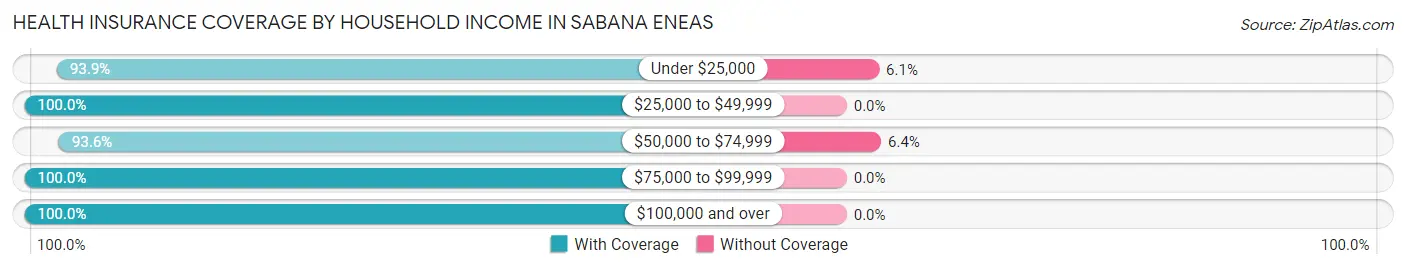
| Household Income | With Coverage | Without Coverage |
| Under $25,000 | 759 (93.9%) | 49 (6.1%) |
| $25,000 to $49,999 | 244 (100.0%) | 0 (0.0%) |
| $50,000 to $74,999 | 131 (93.6%) | 9 (6.4%) |
| $75,000 to $99,999 | 118 (100.0%) | 0 (0.0%) |
| $100,000 and over | 46 (100.0%) | 0 (0.0%) |
Public vs Private Health Insurance Coverage by Age in Sabana Eneas
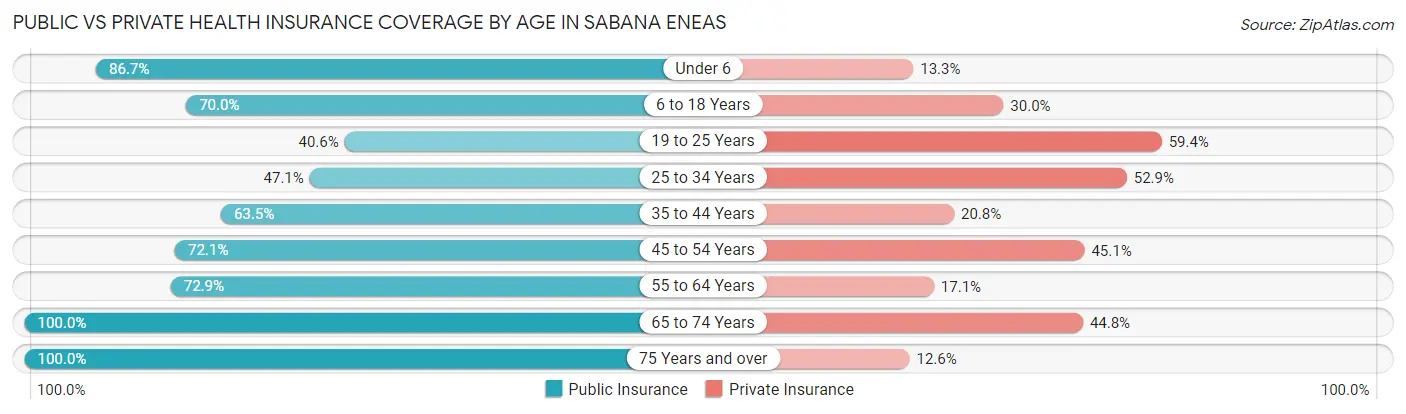
| Age Bracket | Public Insurance | Private Insurance |
| Under 6 | 85 (86.7%) | 13 (13.3%) |
| 6 to 18 Years | 98 (70.0%) | 42 (30.0%) |
| 19 to 25 Years | 13 (40.6%) | 19 (59.4%) |
| 25 to 34 Years | 65 (47.1%) | 73 (52.9%) |
| 35 to 44 Years | 61 (63.5%) | 20 (20.8%) |
| 45 to 54 Years | 160 (72.1%) | 100 (45.1%) |
| 55 to 64 Years | 196 (72.9%) | 46 (17.1%) |
| 65 to 74 Years | 210 (100.0%) | 94 (44.8%) |
| 75 Years and over | 151 (100.0%) | 19 (12.6%) |
| Total | 1,039 (76.6%) | 426 (31.4%) |
Disability Status by Sex by Age in Sabana Eneas
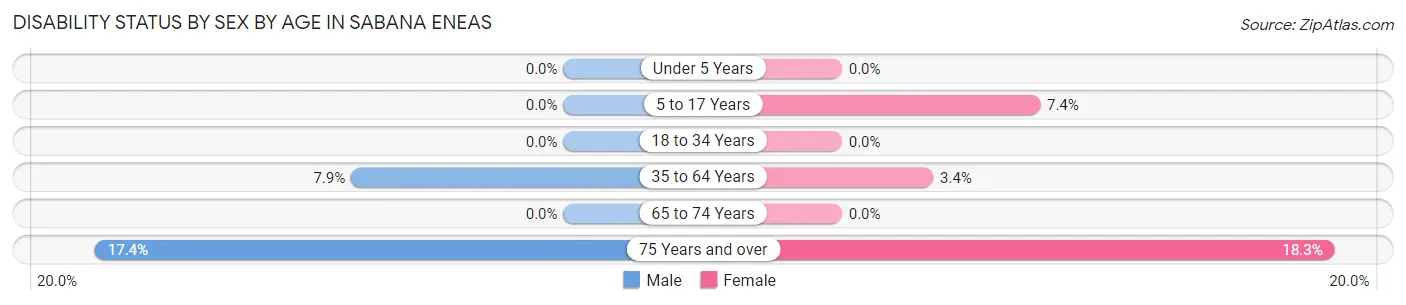
| Age Bracket | Male | Female |
| Under 5 Years | 0 (0.0%) | 0 (0.0%) |
| 5 to 17 Years | 0 (0.0%) | 12 (7.4%) |
| 18 to 34 Years | 0 (0.0%) | 0 (0.0%) |
| 35 to 64 Years | 23 (7.9%) | 10 (3.4%) |
| 65 to 74 Years | 0 (0.0%) | 0 (0.0%) |
| 75 Years and over | 12 (17.4%) | 15 (18.3%) |
Disability Class by Sex by Age in Sabana Eneas
Disability Class: Hearing Difficulty
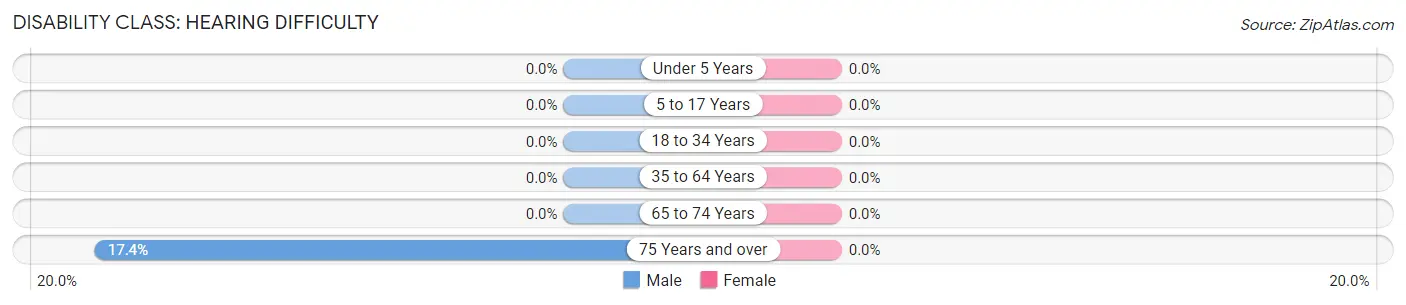
| Age Bracket | Male | Female |
| Under 5 Years | 0 (0.0%) | 0 (0.0%) |
| 5 to 17 Years | 0 (0.0%) | 0 (0.0%) |
| 18 to 34 Years | 0 (0.0%) | 0 (0.0%) |
| 35 to 64 Years | 0 (0.0%) | 0 (0.0%) |
| 65 to 74 Years | 0 (0.0%) | 0 (0.0%) |
| 75 Years and over | 12 (17.4%) | 0 (0.0%) |
Disability Class: Vision Difficulty
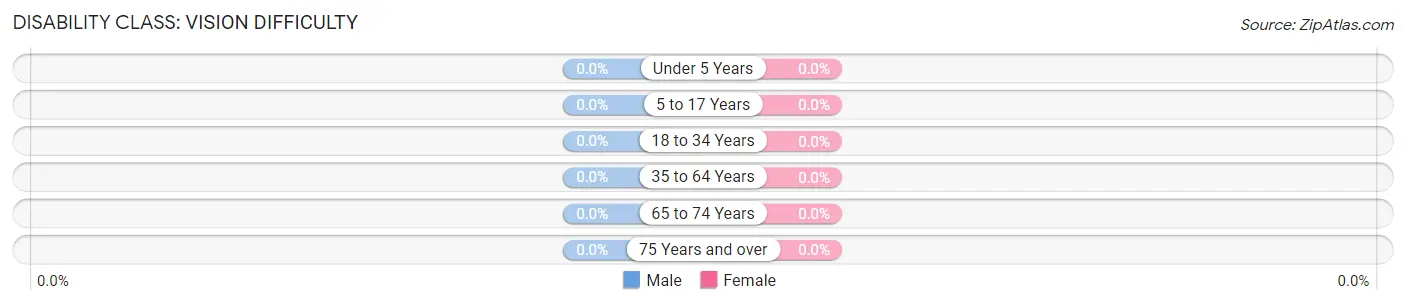
| Age Bracket | Male | Female |
| Under 5 Years | 0 (0.0%) | 0 (0.0%) |
| 5 to 17 Years | 0 (0.0%) | 0 (0.0%) |
| 18 to 34 Years | 0 (0.0%) | 0 (0.0%) |
| 35 to 64 Years | 0 (0.0%) | 0 (0.0%) |
| 65 to 74 Years | 0 (0.0%) | 0 (0.0%) |
| 75 Years and over | 0 (0.0%) | 0 (0.0%) |
Disability Class: Cognitive Difficulty
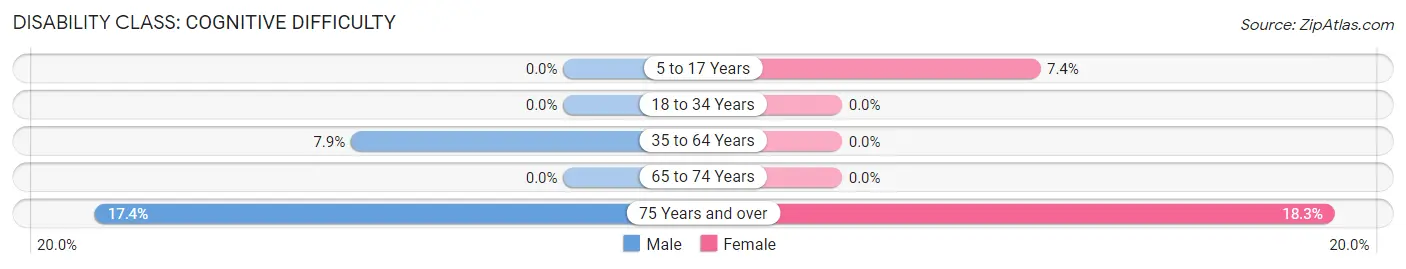
| Age Bracket | Male | Female |
| 5 to 17 Years | 0 (0.0%) | 12 (7.4%) |
| 18 to 34 Years | 0 (0.0%) | 0 (0.0%) |
| 35 to 64 Years | 23 (7.9%) | 0 (0.0%) |
| 65 to 74 Years | 0 (0.0%) | 0 (0.0%) |
| 75 Years and over | 12 (17.4%) | 15 (18.3%) |
Disability Class: Ambulatory Difficulty
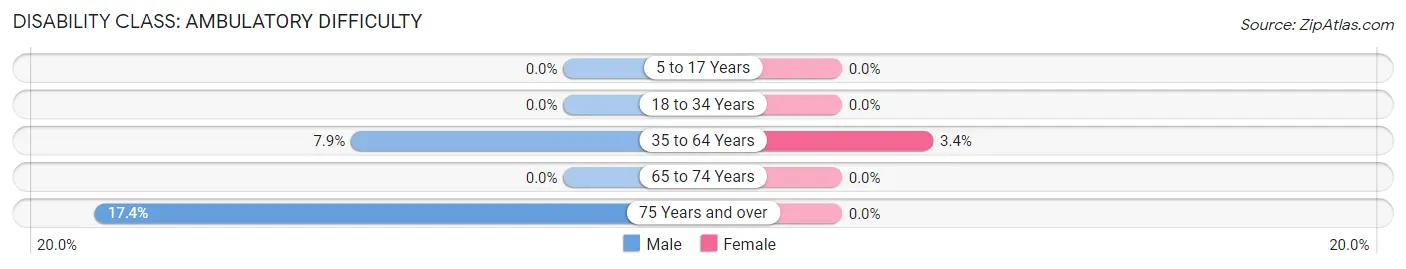
| Age Bracket | Male | Female |
| 5 to 17 Years | 0 (0.0%) | 0 (0.0%) |
| 18 to 34 Years | 0 (0.0%) | 0 (0.0%) |
| 35 to 64 Years | 23 (7.9%) | 10 (3.4%) |
| 65 to 74 Years | 0 (0.0%) | 0 (0.0%) |
| 75 Years and over | 12 (17.4%) | 0 (0.0%) |
Disability Class: Self-Care Difficulty
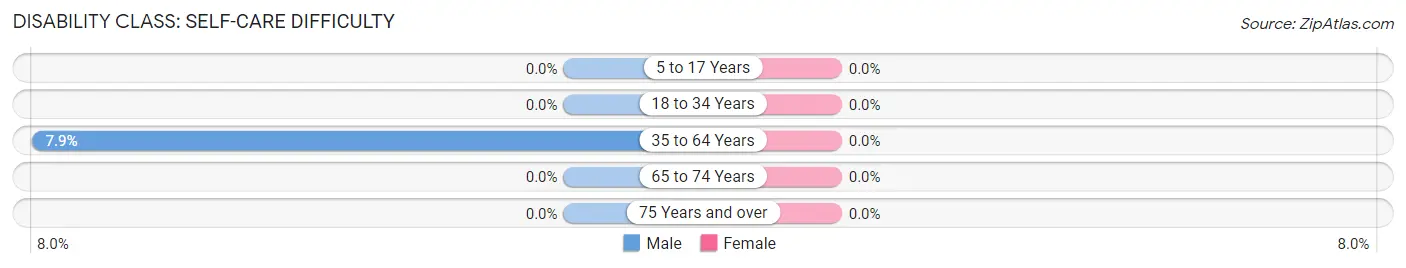
| Age Bracket | Male | Female |
| 5 to 17 Years | 0 (0.0%) | 0 (0.0%) |
| 18 to 34 Years | 0 (0.0%) | 0 (0.0%) |
| 35 to 64 Years | 23 (7.9%) | 0 (0.0%) |
| 65 to 74 Years | 0 (0.0%) | 0 (0.0%) |
| 75 Years and over | 0 (0.0%) | 0 (0.0%) |
Technology Access in Sabana Eneas
Computing Device Access in Sabana Eneas
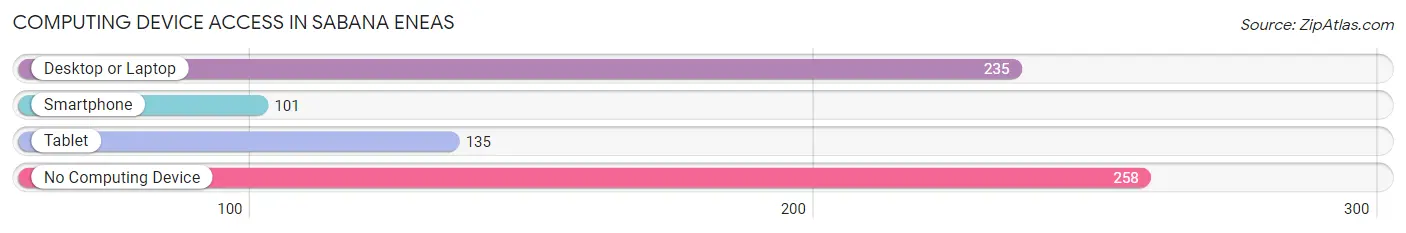
| Device Type | # Households | % Households |
| Desktop or Laptop | 235 | 40.4% |
| Smartphone | 101 | 17.3% |
| Tablet | 135 | 23.2% |
| No Computing Device | 258 | 44.3% |
| Total | 582 | 100.0% |
Internet Access in Sabana Eneas
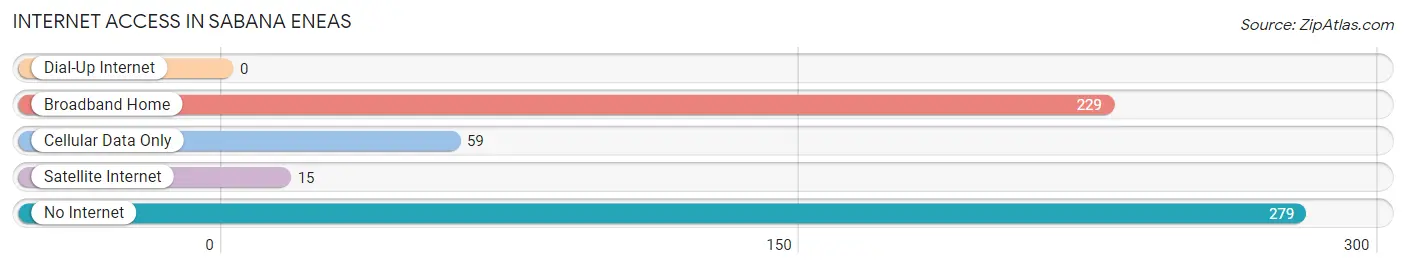
| Internet Type | # Households | % Households |
| Dial-Up Internet | 0 | 0.0% |
| Broadband Home | 229 | 39.4% |
| Cellular Data Only | 59 | 10.1% |
| Satellite Internet | 15 | 2.6% |
| No Internet | 279 | 47.9% |
| Total | 582 | 100.0% |
Sabana Eneas Summary
Sabana Eneas is a municipality located in the northern region of Puerto Rico. It is part of the San Juan-Caguas-Guaynabo Metropolitan Statistical Area. As of the 2010 census, the population of Sabana Eneas was 8,845.
History
The area of Sabana Eneas was originally inhabited by the Taíno Indians. The first settlers of the area were the Spanish, who arrived in the 16th century. The area was originally known as Sabana de la Palma, and was part of the municipality of Toa Alta. In 1824, the area was separated from Toa Alta and became its own municipality.
Geography
Sabana Eneas is located in the northern region of Puerto Rico, in the San Juan-Caguas-Guaynabo Metropolitan Statistical Area. It is bordered by the municipalities of Toa Alta, Bayamón, and Naranjito. The municipality has a total area of 8.3 square miles, of which 8.2 square miles is land and 0.1 square miles is water.
Economy
The economy of Sabana Eneas is largely based on agriculture. The main crops grown in the area are coffee, plantains, and bananas. The municipality also has a small manufacturing sector, which produces clothing, furniture, and other goods.
Demographics
As of the 2010 census, the population of Sabana Eneas was 8,845. The population is mostly of mixed European and African descent. The median household income in the municipality is $17,845, and the median age is 37. The unemployment rate in the municipality is 11.3%.
Common Questions
What is Per Capita Income in Sabana Eneas?
Per Capita income in Sabana Eneas is $13,261.
What is the Median Family Income in Sabana Eneas?
Median Family Income in Sabana Eneas is $21,893.
What is the Median Household income in Sabana Eneas?
Median Household Income in Sabana Eneas is $14,839.
What is Income or Wage Gap in Sabana Eneas?
Income or Wage Gap in Sabana Eneas is 58.1%.
Women in Sabana Eneas earn 41.9 cents for every dollar earned by a man.
What is Family Income Deficit in Sabana Eneas?
Family Income Deficit in Sabana Eneas is $9,806.
Families that are below poverty line in Sabana Eneas earn $9,806 less on average than the poverty threshold level.
What is Inequality or Gini Index in Sabana Eneas?
Inequality or Gini Index in Sabana Eneas is 0.56.
What is the Total Population of Sabana Eneas?
Total Population of Sabana Eneas is 1,356.
What is the Total Male Population of Sabana Eneas?
Total Male Population of Sabana Eneas is 600.
What is the Total Female Population of Sabana Eneas?
Total Female Population of Sabana Eneas is 756.
What is the Ratio of Males per 100 Females in Sabana Eneas?
There are 79.37 Males per 100 Females in Sabana Eneas.
What is the Ratio of Females per 100 Males in Sabana Eneas?
There are 126.00 Females per 100 Males in Sabana Eneas.
What is the Median Population Age in Sabana Eneas?
Median Population Age in Sabana Eneas is 54.0 Years.
What is the Average Family Size in Sabana Eneas
Average Family Size in Sabana Eneas is 3.6 People.
What is the Average Household Size in Sabana Eneas
Average Household Size in Sabana Eneas is 2.3 People.
How Large is the Labor Force in Sabana Eneas?
There are 358 People in the Labor Forcein in Sabana Eneas.
What is the Percentage of People in the Labor Force in Sabana Eneas?
31.7% of People are in the Labor Force in Sabana Eneas.
What is the Unemployment Rate in Sabana Eneas?
Unemployment Rate in Sabana Eneas is 8.1%.