Barahona, PR Map & Demographics
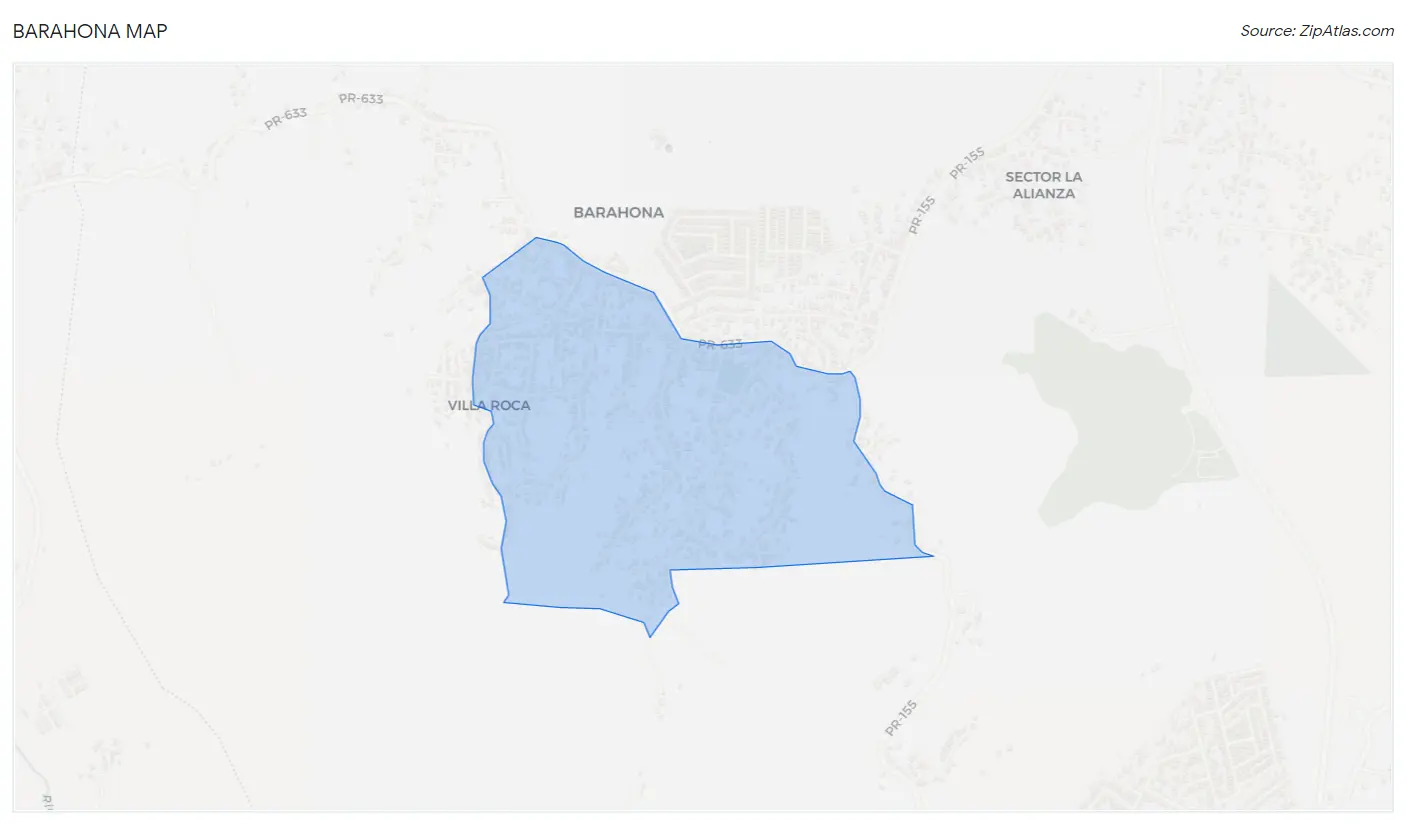
Barahona Map
Barahona Overview
$11,665
PER CAPITA INCOME
$23,821
AVG FAMILY INCOME
$20,175
AVG HOUSEHOLD INCOME
42.2%
WAGE / INCOME GAP [ % ]
57.8¢/ $1
WAGE / INCOME GAP [ $ ]
0.52
INEQUALITY / GINI INDEX
1,983
TOTAL POPULATION
748
MALE POPULATION
1,235
FEMALE POPULATION
60.57
MALES / 100 FEMALES
165.11
FEMALES / 100 MALES
31.8
MEDIAN AGE
3.6
AVG FAMILY SIZE
3.2
AVG HOUSEHOLD SIZE
686
LABOR FORCE [ PEOPLE ]
45.7%
PERCENT IN LABOR FORCE
8.6%
UNEMPLOYMENT RATE
Income in Barahona
Income Overview in Barahona
Per Capita Income in Barahona is $11,665, while median incomes of families and households are $23,821 and $20,175 respectively.
| Characteristic | Number | Measure |
| Per Capita Income | 1,983 | $11,665 |
| Median Family Income | 493 | $23,821 |
| Mean Family Income | 493 | $38,847 |
| Median Household Income | 623 | $20,175 |
| Mean Household Income | 623 | $32,189 |
| Income Deficit | 493 | $0 |
| Wage / Income Gap (%) | 1,983 | 42.18% |
| Wage / Income Gap ($) | 1,983 | 57.82¢ per $1 |
| Gini / Inequality Index | 1,983 | 0.52 |
Earnings by Sex in Barahona
Average Earnings in Barahona are $22,679, $30,536 for men and $17,656 for women, a difference of 42.2%.
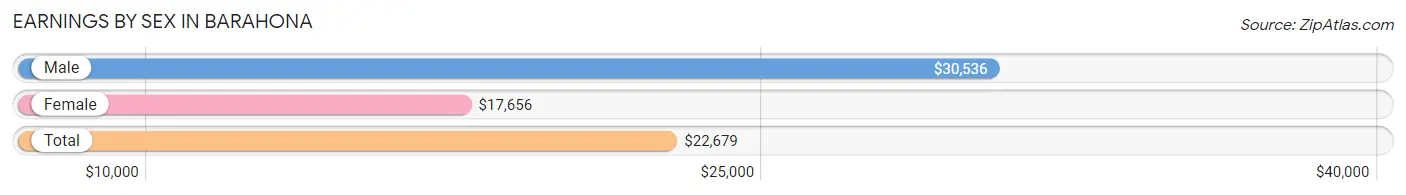
| Sex | Number | Average Earnings |
| Male | 372 (57.0%) | $30,536 |
| Female | 281 (43.0%) | $17,656 |
| Total | 653 (100.0%) | $22,679 |
Earnings by Sex by Income Bracket in Barahona
The most common earnings brackets in Barahona are $30,000 to $34,999 for men (98 | 26.3%) and $7,500 to $9,999 for women (47 | 16.7%).
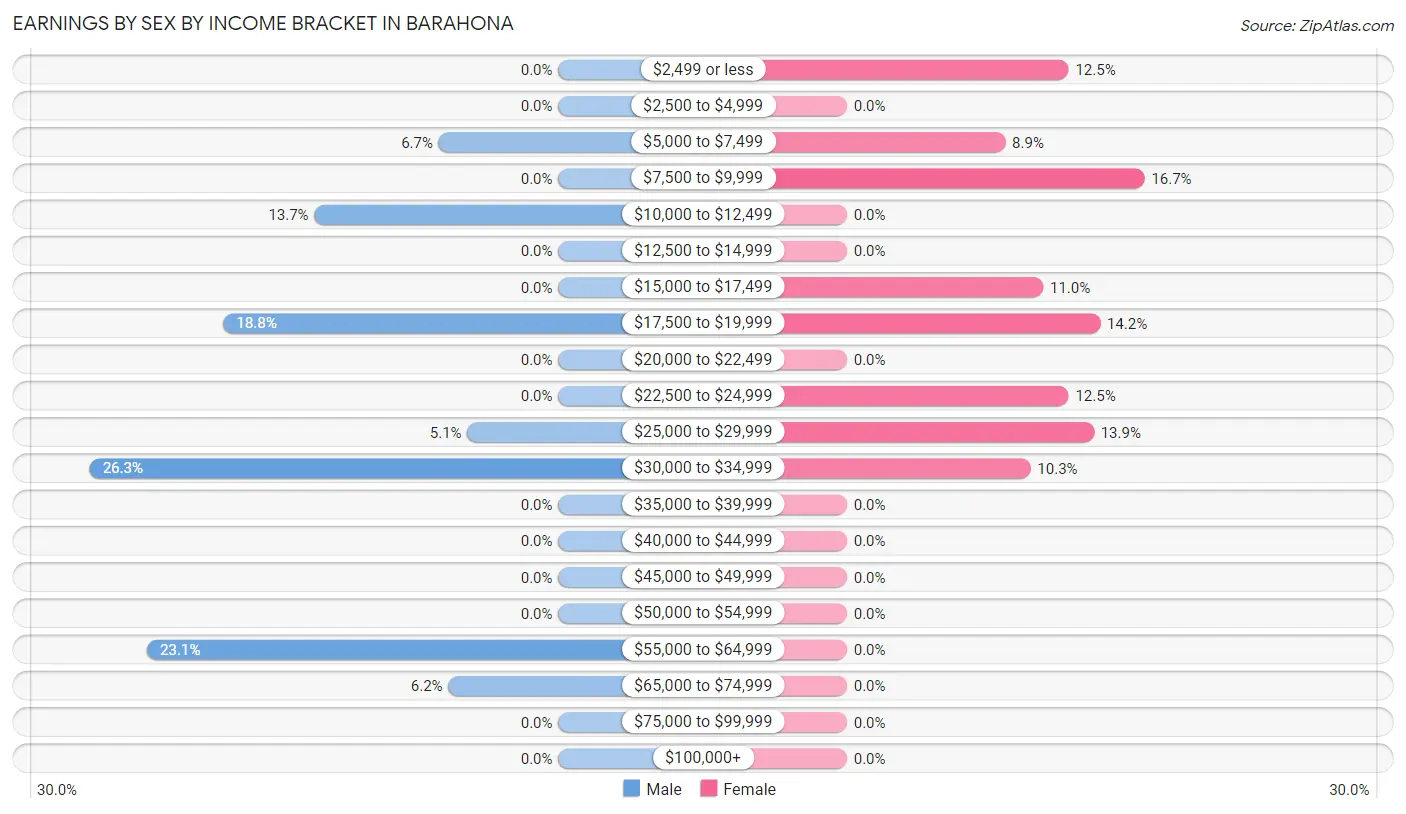
| Income | Male | Female |
| $2,499 or less | 0 (0.0%) | 35 (12.5%) |
| $2,500 to $4,999 | 0 (0.0%) | 0 (0.0%) |
| $5,000 to $7,499 | 25 (6.7%) | 25 (8.9%) |
| $7,500 to $9,999 | 0 (0.0%) | 47 (16.7%) |
| $10,000 to $12,499 | 51 (13.7%) | 0 (0.0%) |
| $12,500 to $14,999 | 0 (0.0%) | 0 (0.0%) |
| $15,000 to $17,499 | 0 (0.0%) | 31 (11.0%) |
| $17,500 to $19,999 | 70 (18.8%) | 40 (14.2%) |
| $20,000 to $22,499 | 0 (0.0%) | 0 (0.0%) |
| $22,500 to $24,999 | 0 (0.0%) | 35 (12.5%) |
| $25,000 to $29,999 | 19 (5.1%) | 39 (13.9%) |
| $30,000 to $34,999 | 98 (26.3%) | 29 (10.3%) |
| $35,000 to $39,999 | 0 (0.0%) | 0 (0.0%) |
| $40,000 to $44,999 | 0 (0.0%) | 0 (0.0%) |
| $45,000 to $49,999 | 0 (0.0%) | 0 (0.0%) |
| $50,000 to $54,999 | 0 (0.0%) | 0 (0.0%) |
| $55,000 to $64,999 | 86 (23.1%) | 0 (0.0%) |
| $65,000 to $74,999 | 23 (6.2%) | 0 (0.0%) |
| $75,000 to $99,999 | 0 (0.0%) | 0 (0.0%) |
| $100,000+ | 0 (0.0%) | 0 (0.0%) |
| Total | 372 (100.0%) | 281 (100.0%) |
Earnings by Sex by Educational Attainment in Barahona
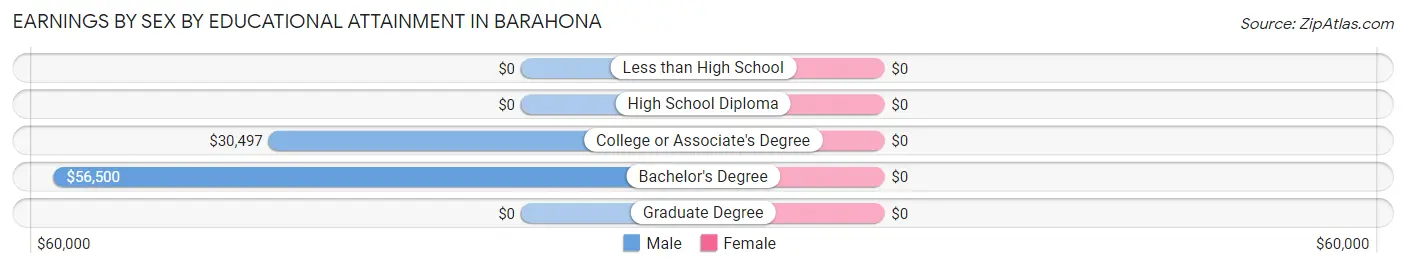
| Educational Attainment | Male Income | Female Income |
| Less than High School | - | - |
| High School Diploma | - | - |
| College or Associate's Degree | $30,497 | $0 |
| Bachelor's Degree | $56,500 | $0 |
| Graduate Degree | - | - |
| Total | $30,536 | $22,607 |
Family Income in Barahona
Family Income Brackets in Barahona
According to the Barahona family income data, there are 138 families falling into the $15,000 to $24,999 income range, which is the most common income bracket and makes up 28.0% of all families.
| Income Bracket | # Families | % Families |
| Less than $10,000 | 43 | 8.7% |
| $10,000 to $14,999 | 82 | 16.6% |
| $15,000 to $24,999 | 138 | 28.0% |
| $25,000 to $34,999 | 49 | 9.9% |
| $35,000 to $49,999 | 52 | 10.5% |
| $50,000 to $74,999 | 73 | 14.8% |
| $75,000 to $99,999 | 23 | 4.7% |
| $100,000 to $149,999 | 33 | 6.7% |
| $150,000 to $199,999 | 0 | 0.0% |
| $200,000+ | 0 | 0.0% |
Family Income by Famaliy Size in Barahona
3-person families (200 | 40.6%) account for the highest median family income in Barahona with $21,850 per family, while 3-person families (200 | 40.6%) have the highest median income of $7,283 per family member.
| Income Bracket | # Families | Median Income |
| 2-Person Families | 124 (25.2%) | $0 |
| 3-Person Families | 200 (40.6%) | $21,850 |
| 4-Person Families | 154 (31.2%) | $0 |
| 5-Person Families | 15 (3.0%) | $0 |
| 6-Person Families | 0 (0.0%) | $0 |
| 7+ Person Families | 0 (0.0%) | $0 |
| Total | 493 (100.0%) | $23,821 |
Family Income by Number of Earners in Barahona
| Number of Earners | # Families | Median Income |
| No Earners | 167 (33.9%) | $0 |
| 1 Earner | 180 (36.5%) | $25,167 |
| 2 Earners | 146 (29.6%) | $73,583 |
| 3+ Earners | 0 (0.0%) | $0 |
| Total | 493 (100.0%) | $23,821 |
Household Income in Barahona
Household Income Brackets in Barahona
With 158 households falling in the category, the $15,000 to $24,999 income range is the most frequent in Barahona, accounting for 25.4% of all households.
| Income Bracket | # Households | % Households |
| Less than $10,000 | 142 | 22.8% |
| $10,000 to $14,999 | 93 | 14.9% |
| $15,000 to $24,999 | 158 | 25.4% |
| $25,000 to $34,999 | 49 | 7.9% |
| $35,000 to $49,999 | 52 | 8.3% |
| $50,000 to $74,999 | 73 | 11.7% |
| $75,000 to $99,999 | 23 | 3.7% |
| $100,000 to $149,999 | 33 | 5.3% |
| $150,000 to $199,999 | 0 | 0.0% |
| $200,000+ | 0 | 0.0% |
Household Income by Householder Age in Barahona
The median household income in Barahona is $20,175, with the highest median household income of $24,286 found in the 25 to 44 years age bracket for the primary householder. A total of 156 households (25.0%) fall into this category. Meanwhile, the 15 to 24 years age bracket for the primary householder has the lowest median household income of $0, with 21 households (3.4%) in this group.
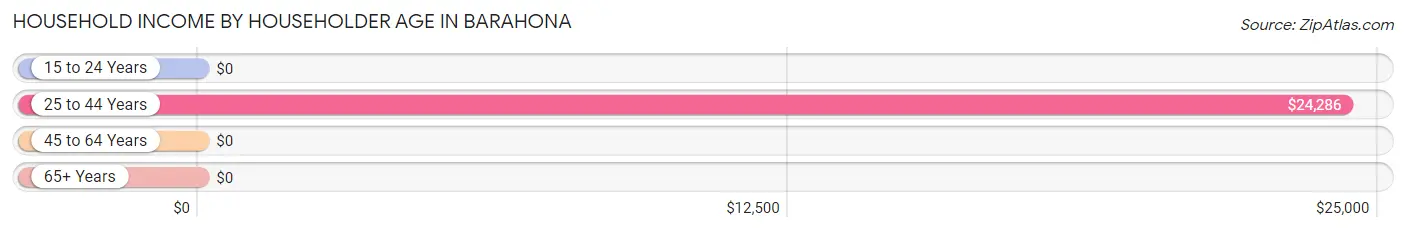
| Income Bracket | # Households | Median Income |
| 15 to 24 Years | 21 (3.4%) | $0 |
| 25 to 44 Years | 156 (25.0%) | $24,286 |
| 45 to 64 Years | 319 (51.2%) | $0 |
| 65+ Years | 127 (20.4%) | $0 |
| Total | 623 (100.0%) | $20,175 |
Poverty in Barahona
Income Below Poverty by Sex and Age in Barahona
With 45.3% poverty level for males and 59.8% for females among the residents of Barahona, 6 to 11 year old males and 55 to 64 year old females are the most vulnerable to poverty, with 48 males (100.0%) and 35 females (100.0%) in their respective age groups living below the poverty level.
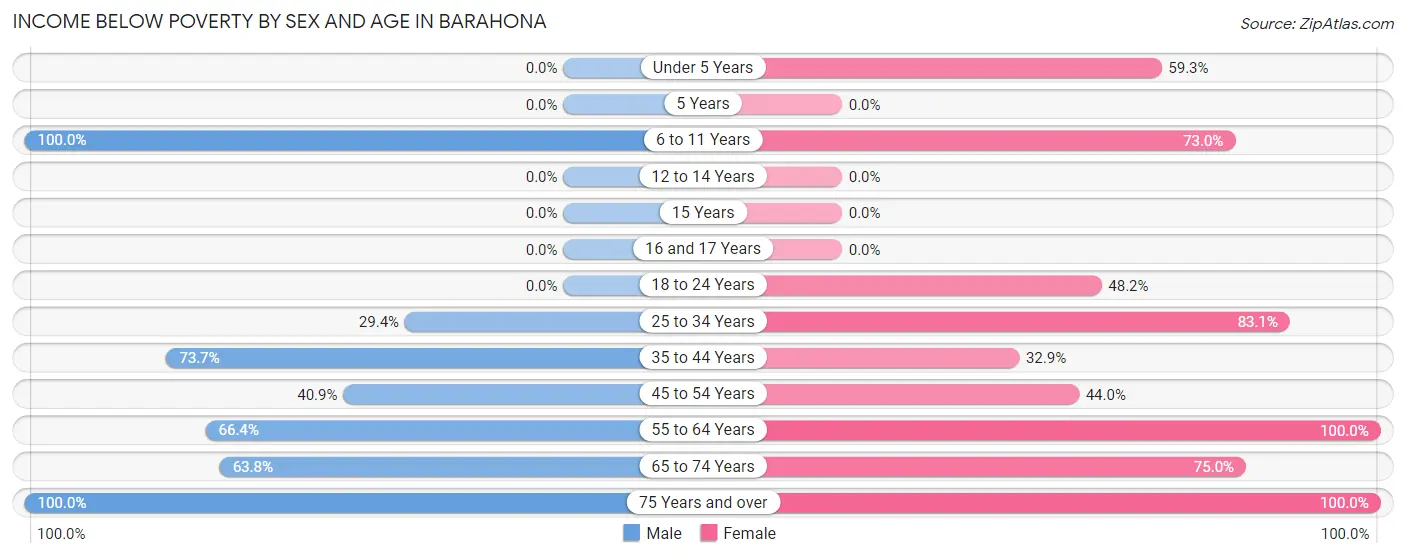
| Age Bracket | Male | Female |
| Under 5 Years | 0 (0.0%) | 86 (59.3%) |
| 5 Years | 0 (0.0%) | 0 (0.0%) |
| 6 to 11 Years | 48 (100.0%) | 119 (73.0%) |
| 12 to 14 Years | 0 (0.0%) | 0 (0.0%) |
| 15 Years | 0 (0.0%) | 0 (0.0%) |
| 16 and 17 Years | 0 (0.0%) | 0 (0.0%) |
| 18 to 24 Years | 0 (0.0%) | 66 (48.2%) |
| 25 to 34 Years | 65 (29.4%) | 143 (83.1%) |
| 35 to 44 Years | 42 (73.7%) | 25 (32.9%) |
| 45 to 54 Years | 58 (40.8%) | 84 (44.0%) |
| 55 to 64 Years | 81 (66.4%) | 35 (100.0%) |
| 65 to 74 Years | 44 (63.8%) | 51 (75.0%) |
| 75 Years and over | 1 (100.0%) | 130 (100.0%) |
| Total | 339 (45.3%) | 739 (59.8%) |
Income Above Poverty by Sex and Age in Barahona
According to the poverty statistics in Barahona, males aged under 5 years and females aged 12 to 14 years are the age groups that are most secure financially, with 100.0% of males and 100.0% of females in these age groups living above the poverty line.
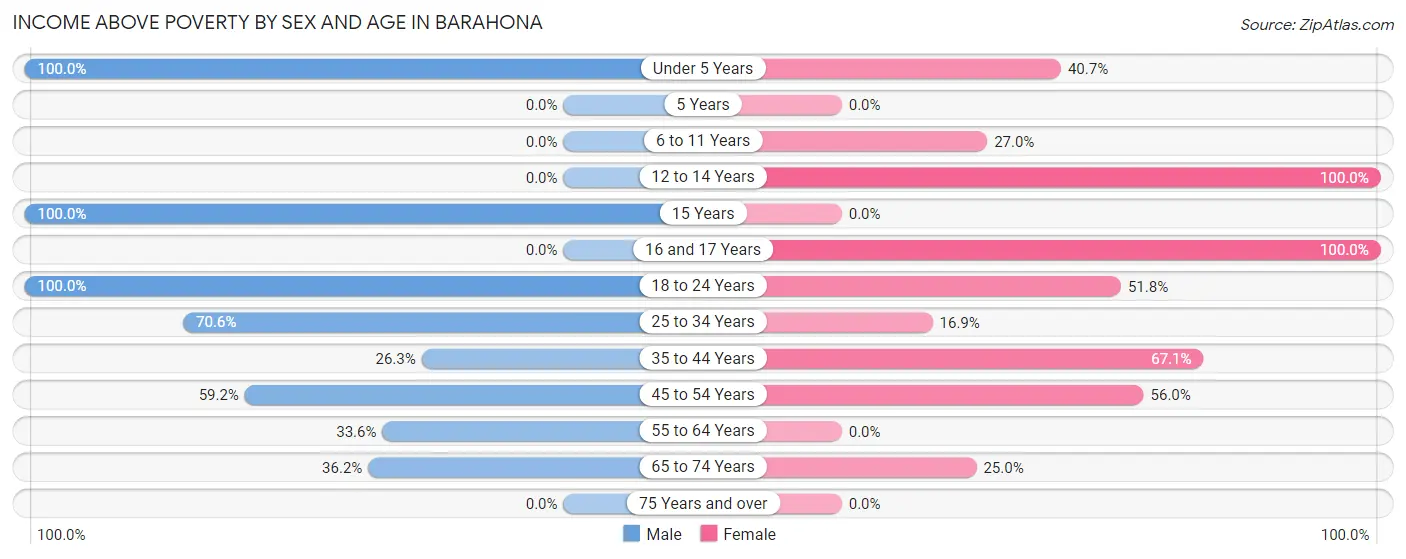
| Age Bracket | Male | Female |
| Under 5 Years | 30 (100.0%) | 59 (40.7%) |
| 5 Years | 0 (0.0%) | 0 (0.0%) |
| 6 to 11 Years | 0 (0.0%) | 44 (27.0%) |
| 12 to 14 Years | 0 (0.0%) | 79 (100.0%) |
| 15 Years | 16 (100.0%) | 0 (0.0%) |
| 16 and 17 Years | 0 (0.0%) | 39 (100.0%) |
| 18 to 24 Years | 42 (100.0%) | 71 (51.8%) |
| 25 to 34 Years | 156 (70.6%) | 29 (16.9%) |
| 35 to 44 Years | 15 (26.3%) | 51 (67.1%) |
| 45 to 54 Years | 84 (59.2%) | 107 (56.0%) |
| 55 to 64 Years | 41 (33.6%) | 0 (0.0%) |
| 65 to 74 Years | 25 (36.2%) | 17 (25.0%) |
| 75 Years and over | 0 (0.0%) | 0 (0.0%) |
| Total | 409 (54.7%) | 496 (40.2%) |
Income Below Poverty Among Married-Couple Families in Barahona
The poverty statistics for married-couple families in Barahona show that 48.1% or 142 of the total 295 families live below the poverty line. Families with 1 or 2 children have the highest poverty rate of 65.8%, comprising of 73 families. On the other hand, families with no children have the lowest poverty rate of 37.5%, which includes 69 families.
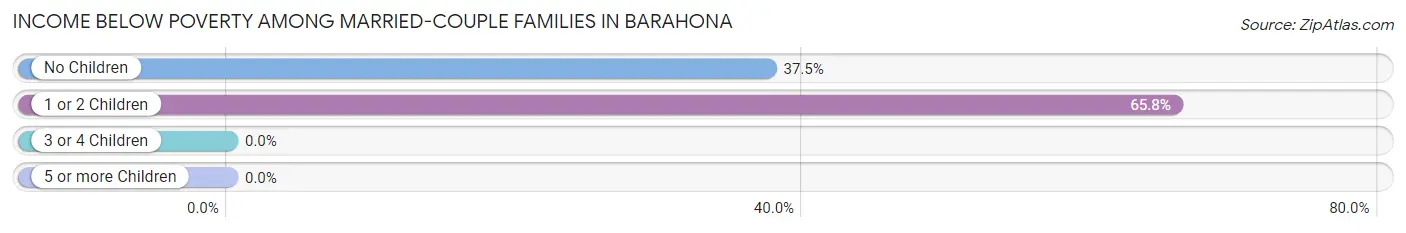
| Children | Above Poverty | Below Poverty |
| No Children | 115 (62.5%) | 69 (37.5%) |
| 1 or 2 Children | 38 (34.2%) | 73 (65.8%) |
| 3 or 4 Children | 0 (0.0%) | 0 (0.0%) |
| 5 or more Children | 0 (0.0%) | 0 (0.0%) |
| Total | 153 (51.9%) | 142 (48.1%) |
Income Below Poverty Among Single-Parent Households in Barahona
According to the poverty data in Barahona, 81.4% or 83 single-father households and 34.4% or 33 single-mother households are living below the poverty line. Among single-father households, those with no children have the highest poverty rate, with 63 households (100.0%) experiencing poverty. Likewise, among single-mother households, those with no children have the highest poverty rate, with 15 households (100.0%) falling below the poverty line.
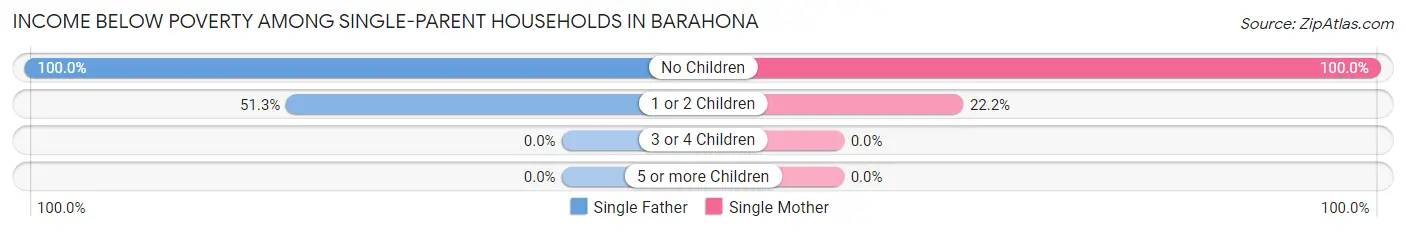
| Children | Single Father | Single Mother |
| No Children | 63 (100.0%) | 15 (100.0%) |
| 1 or 2 Children | 20 (51.3%) | 18 (22.2%) |
| 3 or 4 Children | 0 (0.0%) | 0 (0.0%) |
| 5 or more Children | 0 (0.0%) | 0 (0.0%) |
| Total | 83 (81.4%) | 33 (34.4%) |
Income Below Poverty Among Married-Couple vs Single-Parent Households in Barahona
The poverty data for Barahona shows that 142 of the married-couple family households (48.1%) and 116 of the single-parent households (58.6%) are living below the poverty level. Within the married-couple family households, those with 1 or 2 children have the highest poverty rate, with 73 households (65.8%) falling below the poverty line. Among the single-parent households, those with no children have the highest poverty rate, with 78 household (100.0%) living below poverty.
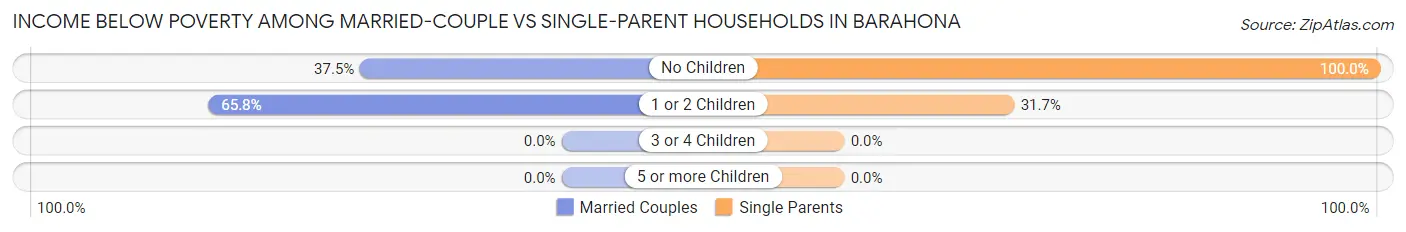
| Children | Married-Couple Families | Single-Parent Households |
| No Children | 69 (37.5%) | 78 (100.0%) |
| 1 or 2 Children | 73 (65.8%) | 38 (31.7%) |
| 3 or 4 Children | 0 (0.0%) | 0 (0.0%) |
| 5 or more Children | 0 (0.0%) | 0 (0.0%) |
| Total | 142 (48.1%) | 116 (58.6%) |
Race in Barahona
The most populous races in Barahona are Hispanic or Latino (1,983 | 100.0%), Two or more Races (983 | 49.6%), and White / Caucasian (828 | 41.7%).
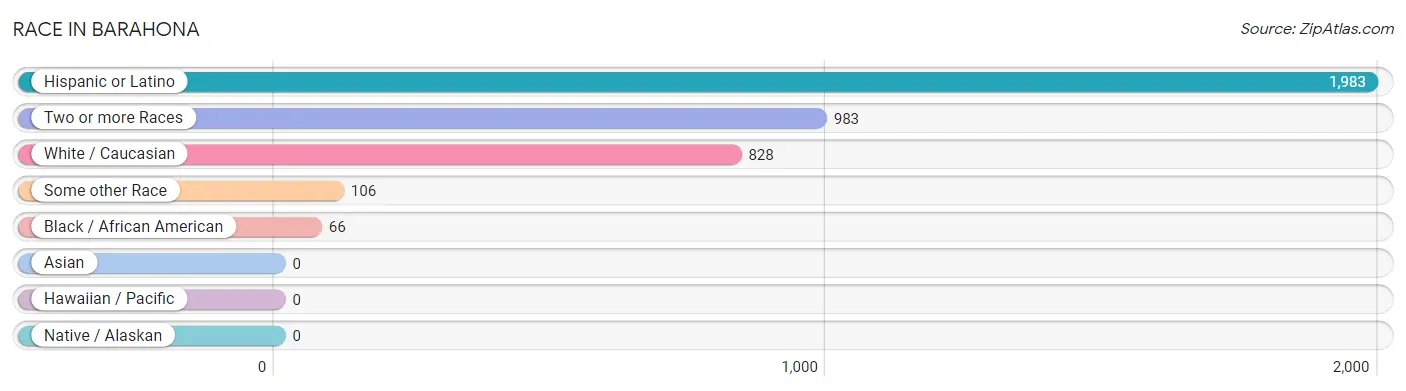
| Race | # Population | % Population |
| Asian | 0 | 0.0% |
| Black / African American | 66 | 3.3% |
| Hawaiian / Pacific | 0 | 0.0% |
| Hispanic or Latino | 1,983 | 100.0% |
| Native / Alaskan | 0 | 0.0% |
| White / Caucasian | 828 | 41.7% |
| Two or more Races | 983 | 49.6% |
| Some other Race | 106 | 5.3% |
| Total | 1,983 | 100.0% |
Ancestry in Barahona
The most populous ancestries reported in Barahona are , and Puerto Rican (1,983 | 100.0%), together accounting for 100.0% of all Barahona residents.

| Ancestry | # Population | % Population |
| Puerto Rican | 1,983 | 100.0% | View All 1 Rows |
Immigrants in Barahona

| Immigration Origin | # Population | % Population | View All 0 Rows |
Sex and Age in Barahona
Sex and Age in Barahona
The most populous age groups in Barahona are 30 to 34 Years (151 | 20.2%) for men and 45 to 49 Years (158 | 12.8%) for women.
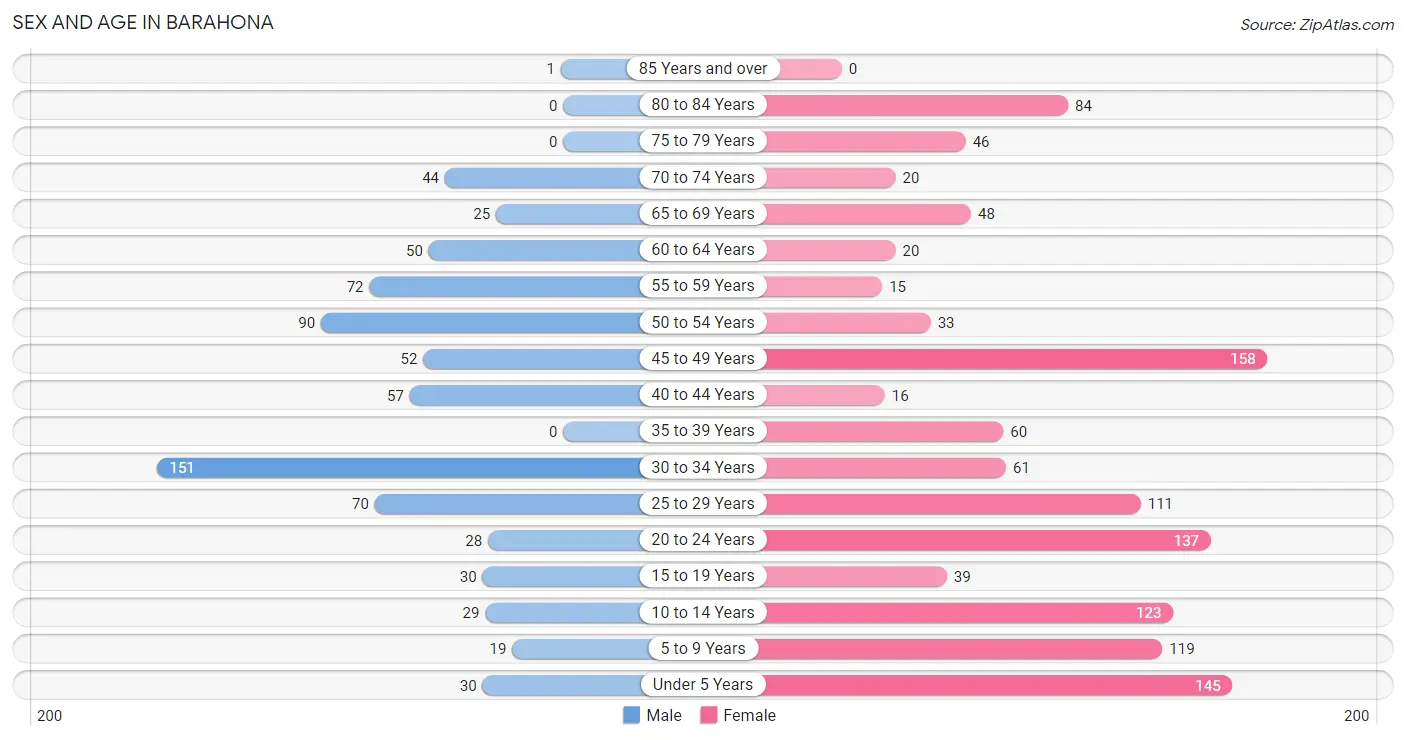
| Age Bracket | Male | Female |
| Under 5 Years | 30 (4.0%) | 145 (11.7%) |
| 5 to 9 Years | 19 (2.5%) | 119 (9.6%) |
| 10 to 14 Years | 29 (3.9%) | 123 (10.0%) |
| 15 to 19 Years | 30 (4.0%) | 39 (3.2%) |
| 20 to 24 Years | 28 (3.7%) | 137 (11.1%) |
| 25 to 29 Years | 70 (9.4%) | 111 (9.0%) |
| 30 to 34 Years | 151 (20.2%) | 61 (4.9%) |
| 35 to 39 Years | 0 (0.0%) | 60 (4.9%) |
| 40 to 44 Years | 57 (7.6%) | 16 (1.3%) |
| 45 to 49 Years | 52 (7.0%) | 158 (12.8%) |
| 50 to 54 Years | 90 (12.0%) | 33 (2.7%) |
| 55 to 59 Years | 72 (9.6%) | 15 (1.2%) |
| 60 to 64 Years | 50 (6.7%) | 20 (1.6%) |
| 65 to 69 Years | 25 (3.3%) | 48 (3.9%) |
| 70 to 74 Years | 44 (5.9%) | 20 (1.6%) |
| 75 to 79 Years | 0 (0.0%) | 46 (3.7%) |
| 80 to 84 Years | 0 (0.0%) | 84 (6.8%) |
| 85 Years and over | 1 (0.1%) | 0 (0.0%) |
| Total | 748 (100.0%) | 1,235 (100.0%) |
Families and Households in Barahona
Median Family Size in Barahona
The median family size in Barahona is 3.65 persons per family, with single female/mother families (96 | 19.5%) accounting for the largest median family size of 4.08 persons per family. On the other hand, married-couple families (295 | 59.8%) represent the smallest median family size with 3.40 persons per family.
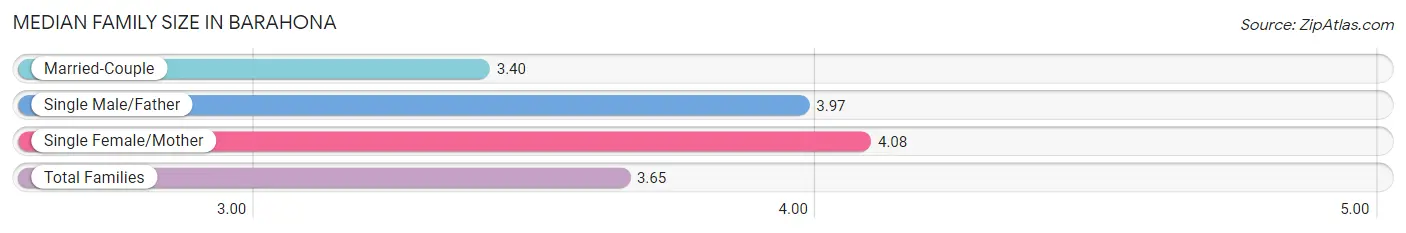
| Family Type | # Families | Family Size |
| Married-Couple | 295 (59.8%) | 3.40 |
| Single Male/Father | 102 (20.7%) | 3.97 |
| Single Female/Mother | 96 (19.5%) | 4.08 |
| Total Families | 493 (100.0%) | 3.65 |
Median Household Size in Barahona
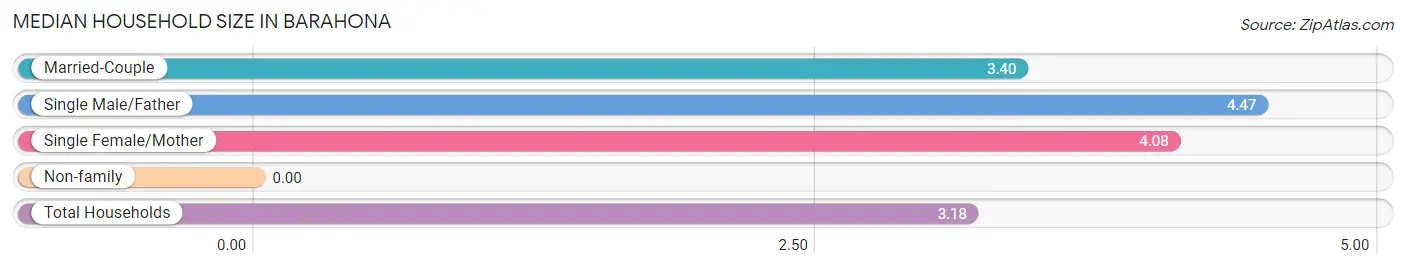
| Household Type | # Households | Household Size |
| Married-Couple | 295 (47.3%) | 3.40 |
| Single Male/Father | 102 (16.4%) | 4.47 |
| Single Female/Mother | 96 (15.4%) | 4.08 |
| Non-family | 130 (20.9%) | - |
| Total Households | 623 (100.0%) | 3.18 |
Household Size by Marriage Status in Barahona
Out of a total of 623 households in Barahona, 493 (79.1%) are family households, while 130 (20.9%) are nonfamily households. The most numerous type of family households are 4-person households, comprising 193, and the most common type of nonfamily households are 1-person households, comprising 130.
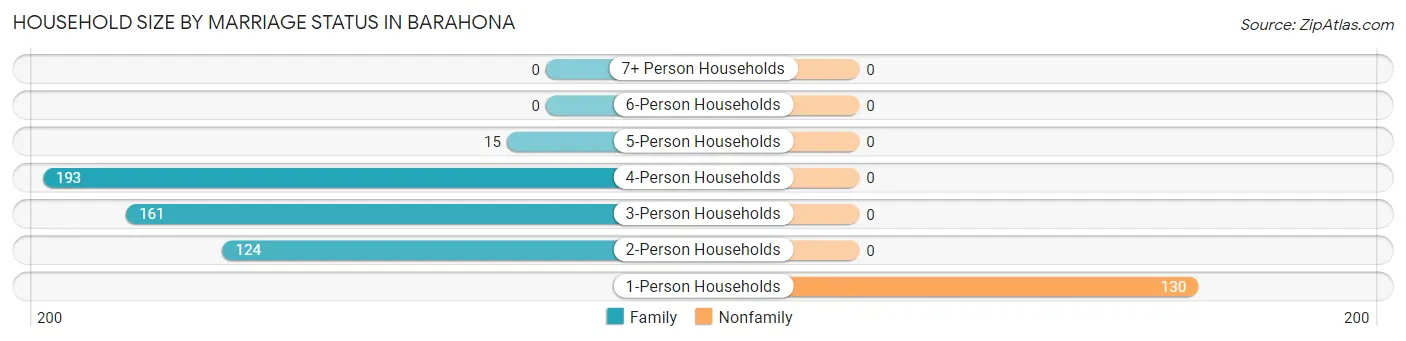
| Household Size | Family Households | Nonfamily Households |
| 1-Person Households | - | 130 (20.9%) |
| 2-Person Households | 124 (19.9%) | 0 (0.0%) |
| 3-Person Households | 161 (25.8%) | 0 (0.0%) |
| 4-Person Households | 193 (31.0%) | 0 (0.0%) |
| 5-Person Households | 15 (2.4%) | 0 (0.0%) |
| 6-Person Households | 0 (0.0%) | 0 (0.0%) |
| 7+ Person Households | 0 (0.0%) | 0 (0.0%) |
| Total | 493 (79.1%) | 130 (20.9%) |
Female Fertility in Barahona
Fertility by Age in Barahona
Average fertility rate in Barahona is 50.0 births per 1,000 women. Women in the age bracket of 20 to 34 years have the highest fertility rate with 94.0 births per 1,000 women. Women in the age bracket of 20 to 34 years acount for 100.0% of all women with births.
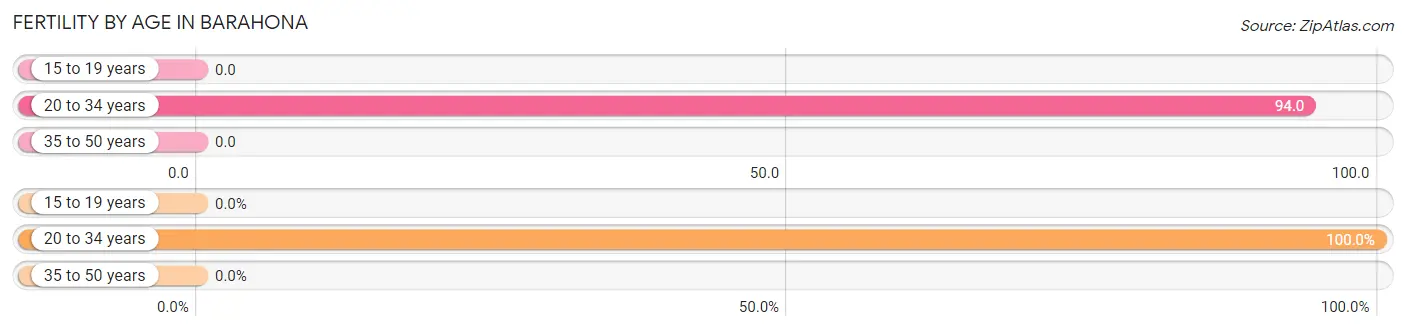
| Age Bracket | Women with Births | Births / 1,000 Women |
| 15 to 19 years | 0 (0.0%) | 0.0 |
| 20 to 34 years | 29 (100.0%) | 94.0 |
| 35 to 50 years | 0 (0.0%) | 0.0 |
| Total | 29 (100.0%) | 50.0 |
Fertility by Age by Marriage Status in Barahona
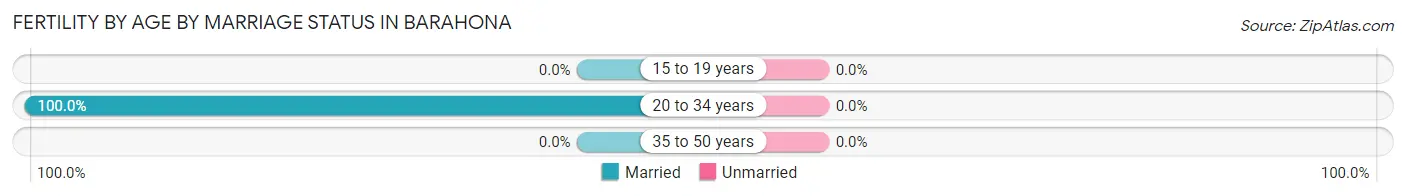
| Age Bracket | Married | Unmarried |
| 15 to 19 years | 0 (0.0%) | 0 (0.0%) |
| 20 to 34 years | 29 (100.0%) | 0 (0.0%) |
| 35 to 50 years | 0 (0.0%) | 0 (0.0%) |
| Total | 29 (100.0%) | 0 (0.0%) |
Fertility by Education in Barahona
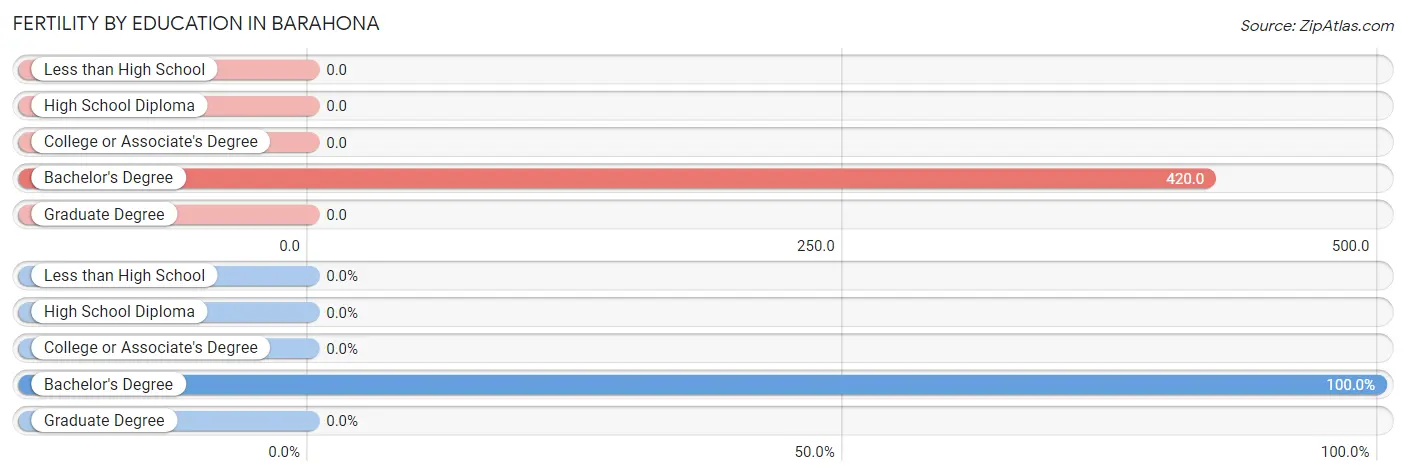
| Educational Attainment | Women with Births | Births / 1,000 Women |
| Less than High School | 0 (0.0%) | 0.0 |
| High School Diploma | 0 (0.0%) | 0.0 |
| College or Associate's Degree | 0 (0.0%) | 0.0 |
| Bachelor's Degree | 29 (100.0%) | 420.0 |
| Graduate Degree | 0 (0.0%) | 0.0 |
| Total | 29 (100.0%) | 50.0 |
Fertility by Education by Marriage Status in Barahona
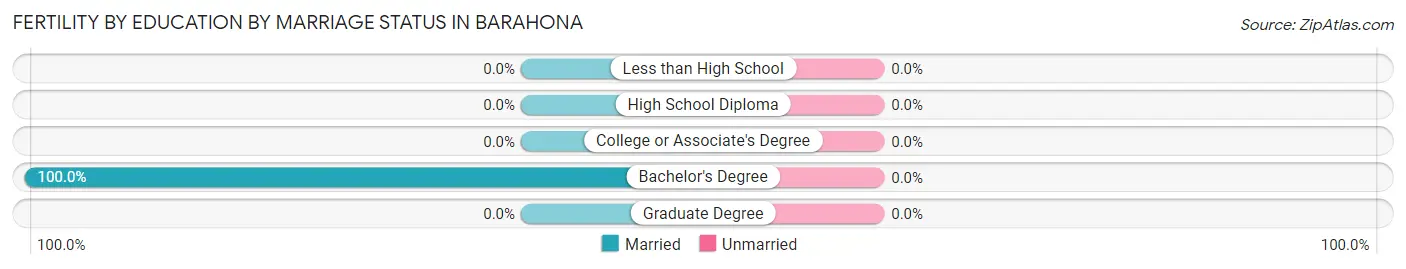
| Educational Attainment | Married | Unmarried |
| Less than High School | 0 (0.0%) | 0 (0.0%) |
| High School Diploma | 0 (0.0%) | 0 (0.0%) |
| College or Associate's Degree | 0 (0.0%) | 0 (0.0%) |
| Bachelor's Degree | 29 (100.0%) | 0 (0.0%) |
| Graduate Degree | 0 (0.0%) | 0 (0.0%) |
| Total | 29 (100.0%) | 0 (0.0%) |
Employment Characteristics in Barahona
Employment by Class of Employer in Barahona
Among the 628 employed individuals in Barahona, private company employees (324 | 51.6%), federal government employees (115 | 18.3%), and state government employees (54 | 8.6%) make up the most common classes of employment.
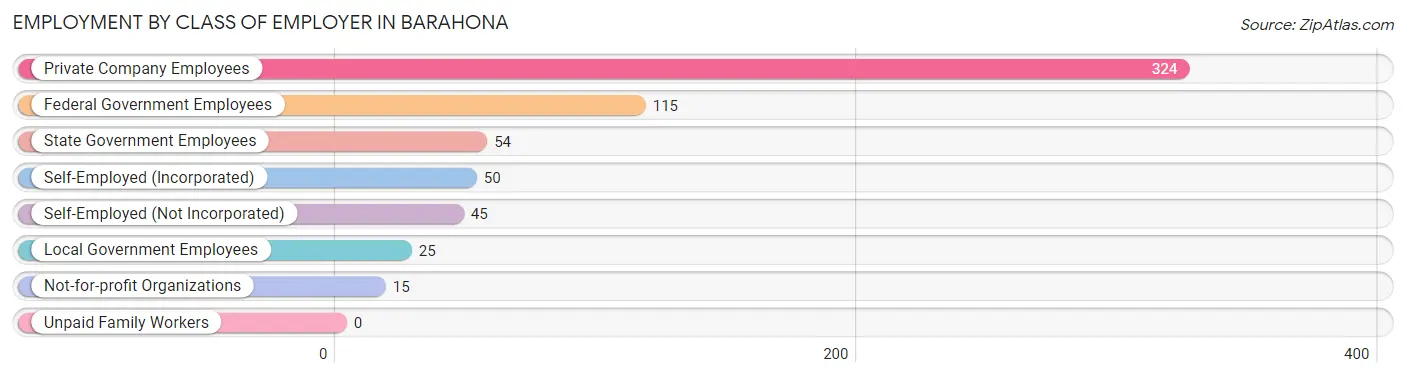
| Employer Class | # Employees | % Employees |
| Private Company Employees | 324 | 51.6% |
| Self-Employed (Incorporated) | 50 | 8.0% |
| Self-Employed (Not Incorporated) | 45 | 7.2% |
| Not-for-profit Organizations | 15 | 2.4% |
| Local Government Employees | 25 | 4.0% |
| State Government Employees | 54 | 8.6% |
| Federal Government Employees | 115 | 18.3% |
| Unpaid Family Workers | 0 | 0.0% |
| Total | 628 | 100.0% |
Employment Status by Age in Barahona
According to the labor force statistics for Barahona, out of the total population over 16 years of age (1,502), 45.7% or 686 individuals are in the labor force, with 8.6% or 59 of them unemployed. The age group with the highest labor force participation rate is 55 to 59 years, with 100.0% or 87 individuals in the labor force. Within the labor force, the 20 to 24 years age range has the highest percentage of unemployed individuals, with 43.1% or 59 of them being unemployed.
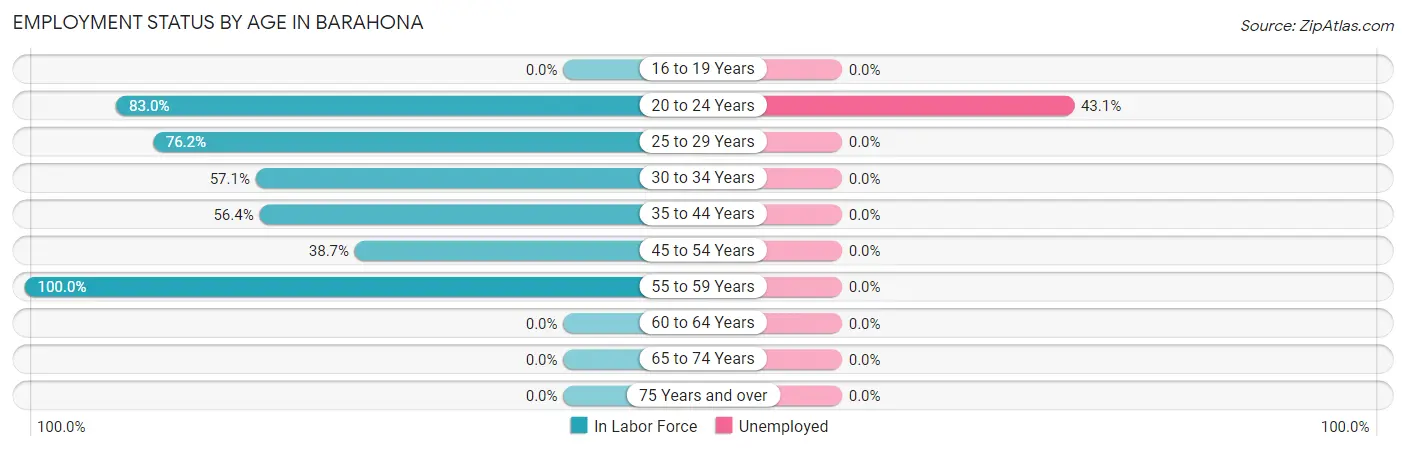
| Age Bracket | In Labor Force | Unemployed |
| 16 to 19 Years | 0 (0.0%) | 0 (0.0%) |
| 20 to 24 Years | 137 (83.0%) | 59 (43.1%) |
| 25 to 29 Years | 138 (76.2%) | 0 (0.0%) |
| 30 to 34 Years | 121 (57.1%) | 0 (0.0%) |
| 35 to 44 Years | 75 (56.4%) | 0 (0.0%) |
| 45 to 54 Years | 129 (38.7%) | 0 (0.0%) |
| 55 to 59 Years | 87 (100.0%) | 0 (0.0%) |
| 60 to 64 Years | 0 (0.0%) | 0 (0.0%) |
| 65 to 74 Years | 0 (0.0%) | 0 (0.0%) |
| 75 Years and over | 0 (0.0%) | 0 (0.0%) |
| Total | 686 (45.7%) | 59 (8.6%) |
Employment Status by Educational Attainment in Barahona
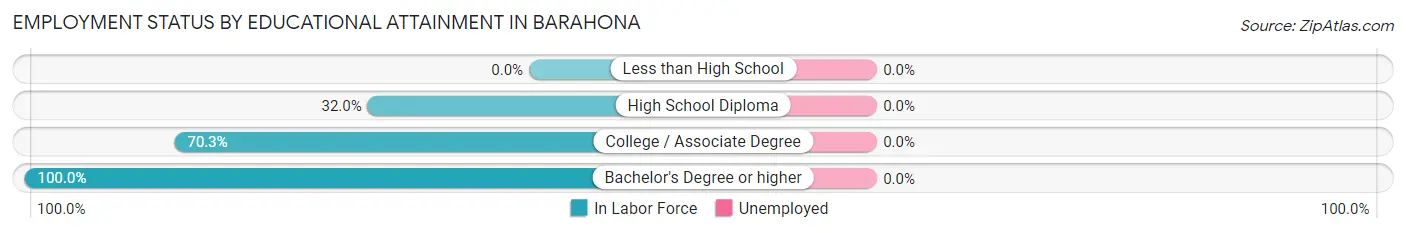
| Educational Attainment | In Labor Force | Unemployed |
| Less than High School | 0 (0.0%) | 0 (0.0%) |
| High School Diploma | 132 (32.0%) | 0 (0.0%) |
| College / Associate Degree | 277 (70.3%) | 0 (0.0%) |
| Bachelor's Degree or higher | 141 (100.0%) | 0 (0.0%) |
| Total | 550 (54.1%) | 0 (0.0%) |
Employment Occupations by Sex in Barahona
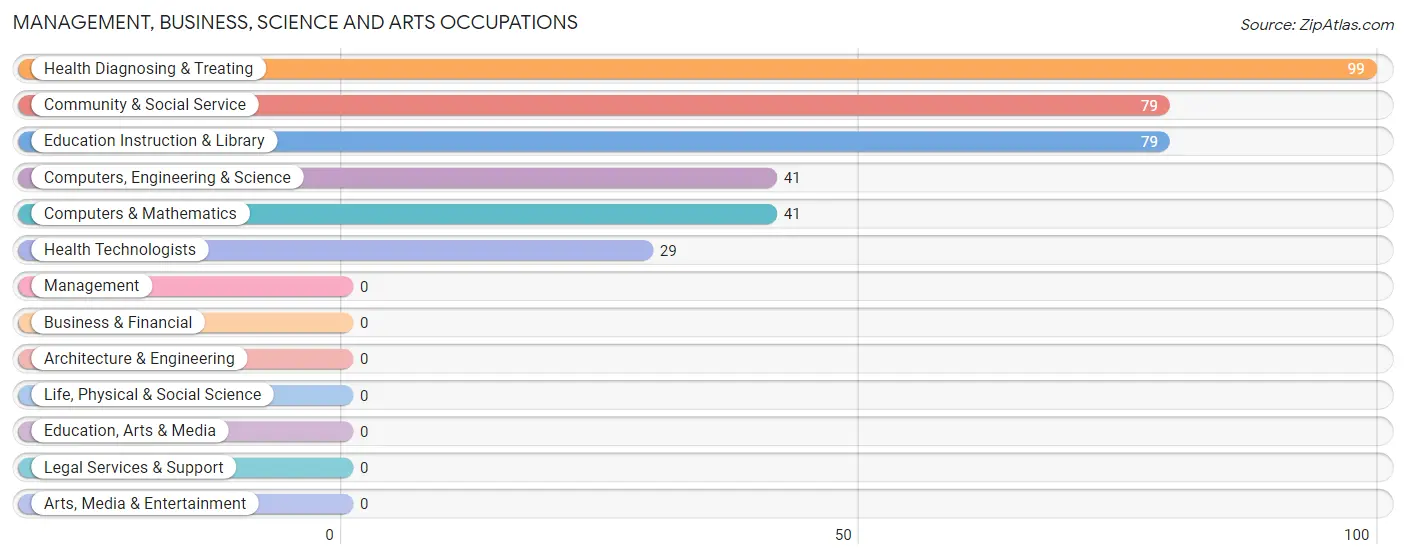
Management, Business, Science and Arts Occupations
The most common Management, Business, Science and Arts occupations in Barahona are Health Diagnosing & Treating (99 | 15.8%), Community & Social Service (79 | 12.6%), Education Instruction & Library (79 | 12.6%), Computers, Engineering & Science (41 | 6.5%), and Computers & Mathematics (41 | 6.5%).
Management, Business, Science and Arts Occupations by Sex
Within the Management, Business, Science and Arts occupations in Barahona, the most male-oriented occupations are Computers, Engineering & Science (100.0%), Computers & Mathematics (100.0%), and Health Diagnosing & Treating (35.3%), while the most female-oriented occupations are Health Technologists (100.0%), Community & Social Service (81.0%), and Education Instruction & Library (81.0%).
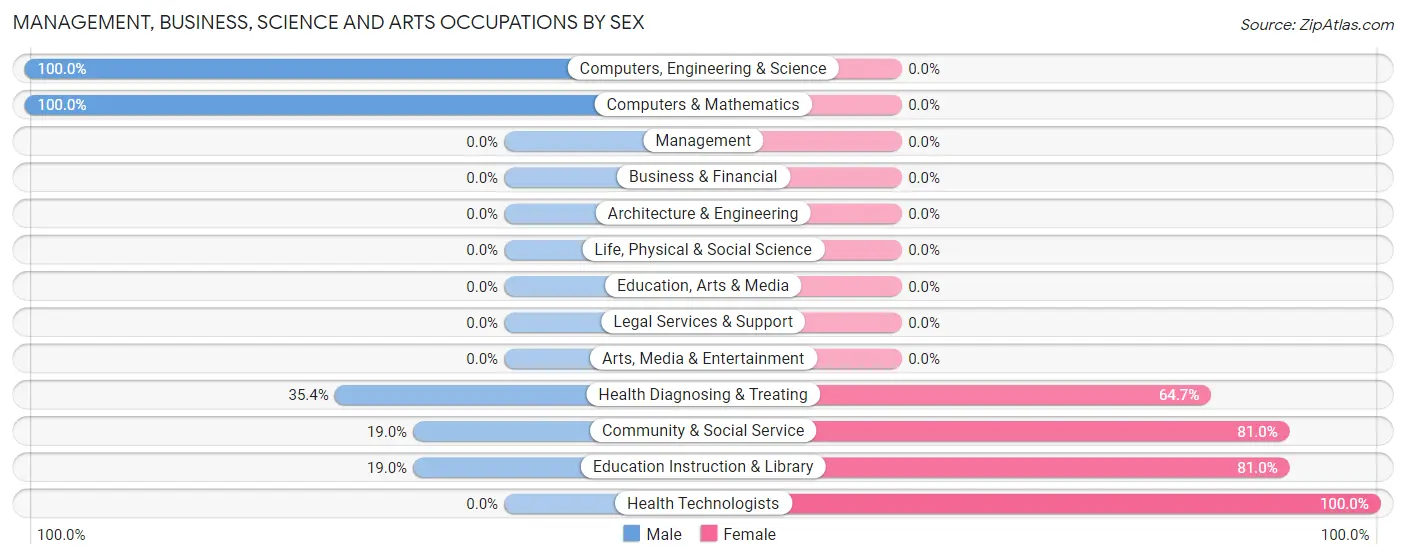
| Occupation | Male | Female |
| Management | 0 (0.0%) | 0 (0.0%) |
| Business & Financial | 0 (0.0%) | 0 (0.0%) |
| Computers, Engineering & Science | 41 (100.0%) | 0 (0.0%) |
| Computers & Mathematics | 41 (100.0%) | 0 (0.0%) |
| Architecture & Engineering | 0 (0.0%) | 0 (0.0%) |
| Life, Physical & Social Science | 0 (0.0%) | 0 (0.0%) |
| Community & Social Service | 15 (19.0%) | 64 (81.0%) |
| Education, Arts & Media | 0 (0.0%) | 0 (0.0%) |
| Legal Services & Support | 0 (0.0%) | 0 (0.0%) |
| Education Instruction & Library | 15 (19.0%) | 64 (81.0%) |
| Arts, Media & Entertainment | 0 (0.0%) | 0 (0.0%) |
| Health Diagnosing & Treating | 35 (35.3%) | 64 (64.6%) |
| Health Technologists | 0 (0.0%) | 29 (100.0%) |
| Total (Category) | 91 (41.5%) | 128 (58.5%) |
| Total (Overall) | 347 (55.2%) | 281 (44.8%) |
Services Occupations
Services Occupations by Sex
| Occupation | Male | Female |
| Healthcare Support | 0 (0.0%) | 0 (0.0%) |
| Security & Protection | 0 (0.0%) | 0 (0.0%) |
| Firefighting & Prevention | 0 (0.0%) | 0 (0.0%) |
| Law Enforcement | 0 (0.0%) | 0 (0.0%) |
| Food Preparation & Serving | 0 (0.0%) | 0 (0.0%) |
| Cleaning & Maintenance | 0 (0.0%) | 0 (0.0%) |
| Personal Care & Service | 0 (0.0%) | 0 (0.0%) |
| Total (Category) | 0 (0.0%) | 0 (0.0%) |
| Total (Overall) | 347 (55.2%) | 281 (44.8%) |
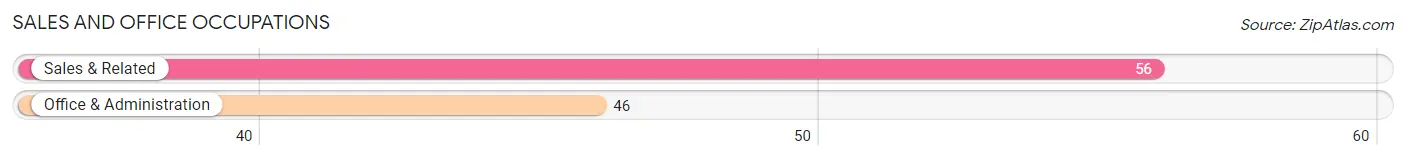
Sales and Office Occupations
The most common Sales and Office occupations in Barahona are Sales & Related (56 | 8.9%), and Office & Administration (46 | 7.3%).
Sales and Office Occupations by Sex
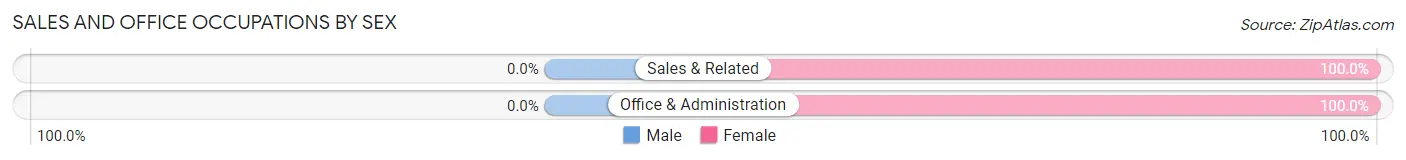
| Occupation | Male | Female |
| Sales & Related | 0 (0.0%) | 56 (100.0%) |
| Office & Administration | 0 (0.0%) | 46 (100.0%) |
| Total (Category) | 0 (0.0%) | 102 (100.0%) |
| Total (Overall) | 347 (55.2%) | 281 (44.8%) |
Natural Resources, Construction and Maintenance Occupations
The most common Natural Resources, Construction and Maintenance occupations in Barahona are Installation, Maintenance & Repair (163 | 26.0%), and Construction & Extraction (70 | 11.2%).
Natural Resources, Construction and Maintenance Occupations by Sex
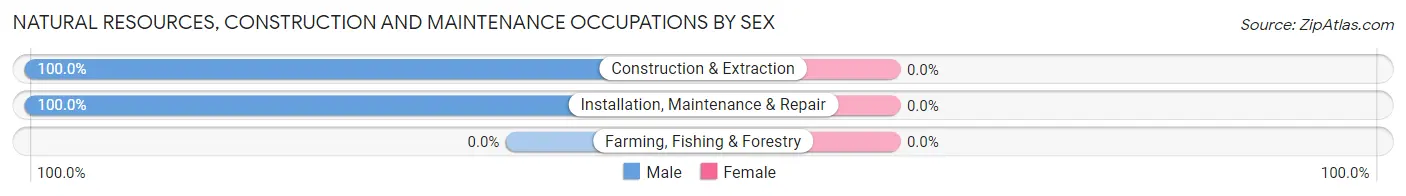
| Occupation | Male | Female |
| Farming, Fishing & Forestry | 0 (0.0%) | 0 (0.0%) |
| Construction & Extraction | 70 (100.0%) | 0 (0.0%) |
| Installation, Maintenance & Repair | 163 (100.0%) | 0 (0.0%) |
| Total (Category) | 233 (100.0%) | 0 (0.0%) |
| Total (Overall) | 347 (55.2%) | 281 (44.8%) |
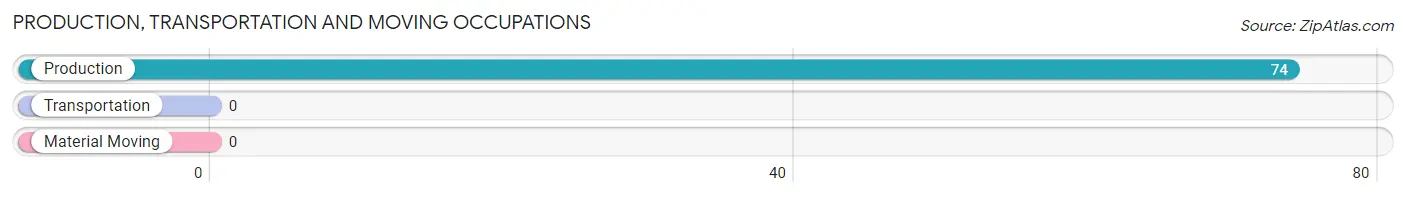
Production, Transportation and Moving Occupations
The most common Production, Transportation and Moving occupations in Barahona are , and Production (74 | 11.8%).
Production, Transportation and Moving Occupations by Sex
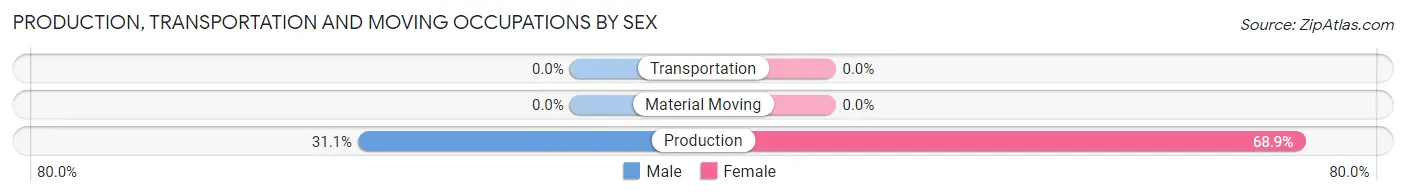
| Occupation | Male | Female |
| Production | 23 (31.1%) | 51 (68.9%) |
| Transportation | 0 (0.0%) | 0 (0.0%) |
| Material Moving | 0 (0.0%) | 0 (0.0%) |
| Total (Category) | 23 (31.1%) | 51 (68.9%) |
| Total (Overall) | 347 (55.2%) | 281 (44.8%) |
Employment Industries by Sex in Barahona
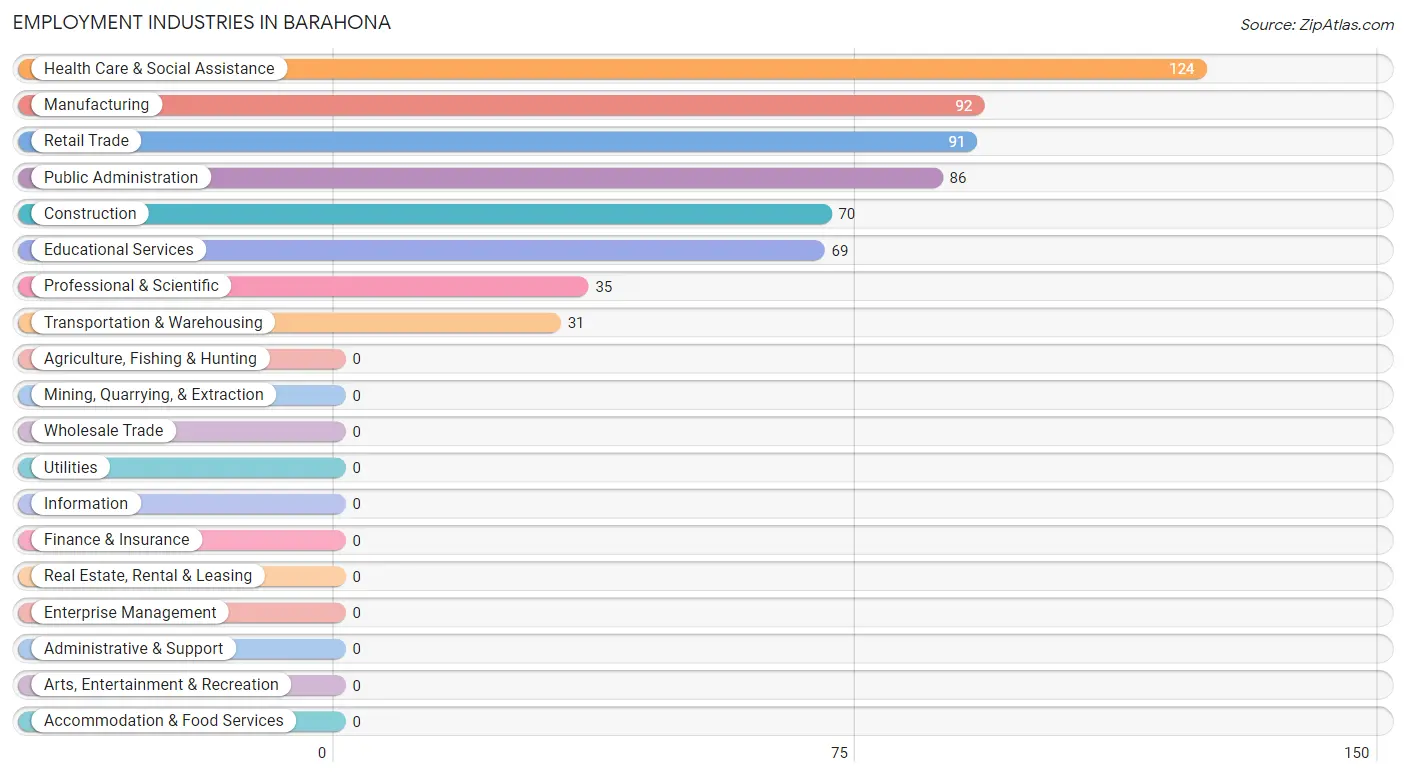
Employment Industries in Barahona
The major employment industries in Barahona include Health Care & Social Assistance (124 | 19.8%), Manufacturing (92 | 14.6%), Retail Trade (91 | 14.5%), Public Administration (86 | 13.7%), and Construction (70 | 11.2%).
Employment Industries by Sex in Barahona
The Barahona industries that see more men than women are Construction (100.0%), Public Administration (100.0%), and Retail Trade (76.9%), whereas the industries that tend to have a higher number of women are Transportation & Warehousing (100.0%), Professional & Scientific (100.0%), and Educational Services (78.3%).
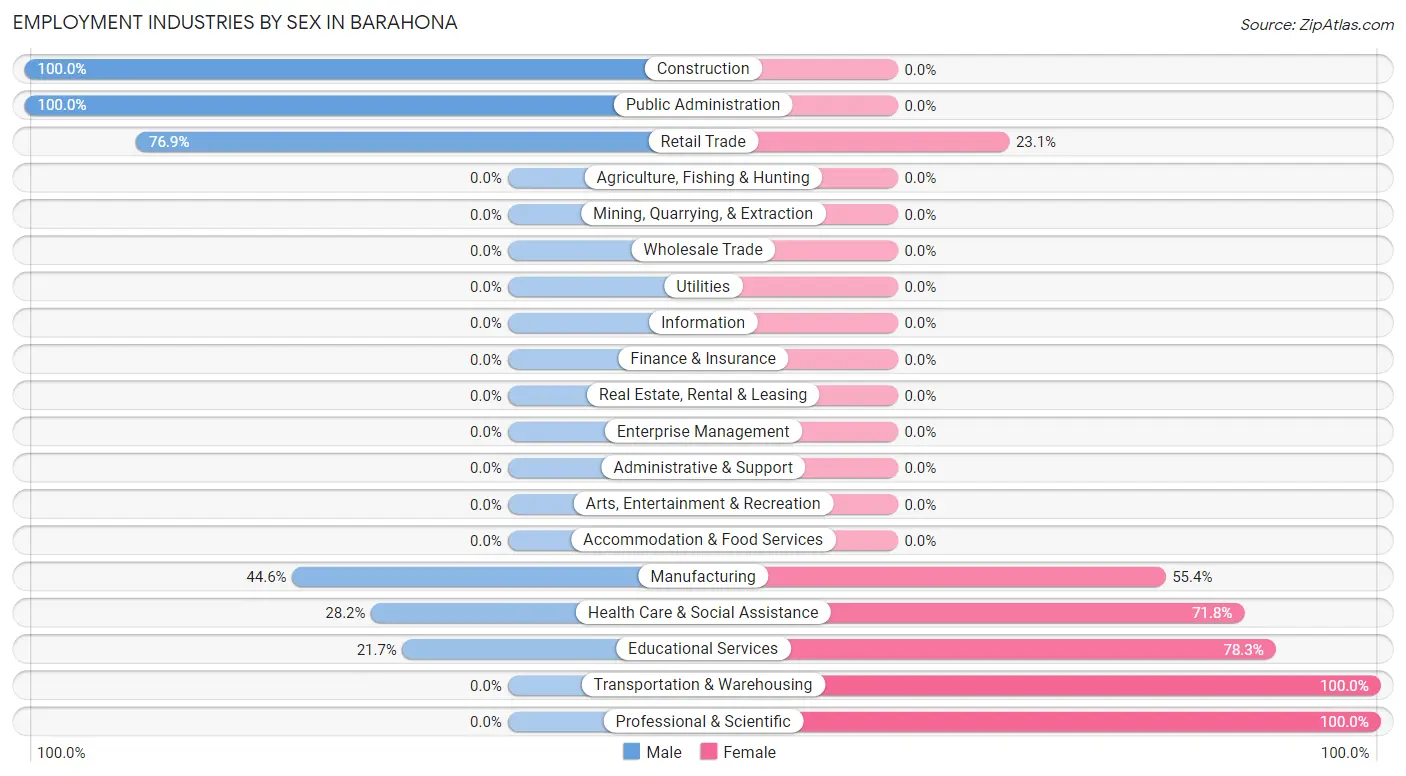
| Industry | Male | Female |
| Agriculture, Fishing & Hunting | 0 (0.0%) | 0 (0.0%) |
| Mining, Quarrying, & Extraction | 0 (0.0%) | 0 (0.0%) |
| Construction | 70 (100.0%) | 0 (0.0%) |
| Manufacturing | 41 (44.6%) | 51 (55.4%) |
| Wholesale Trade | 0 (0.0%) | 0 (0.0%) |
| Retail Trade | 70 (76.9%) | 21 (23.1%) |
| Transportation & Warehousing | 0 (0.0%) | 31 (100.0%) |
| Utilities | 0 (0.0%) | 0 (0.0%) |
| Information | 0 (0.0%) | 0 (0.0%) |
| Finance & Insurance | 0 (0.0%) | 0 (0.0%) |
| Real Estate, Rental & Leasing | 0 (0.0%) | 0 (0.0%) |
| Professional & Scientific | 0 (0.0%) | 35 (100.0%) |
| Enterprise Management | 0 (0.0%) | 0 (0.0%) |
| Administrative & Support | 0 (0.0%) | 0 (0.0%) |
| Educational Services | 15 (21.7%) | 54 (78.3%) |
| Health Care & Social Assistance | 35 (28.2%) | 89 (71.8%) |
| Arts, Entertainment & Recreation | 0 (0.0%) | 0 (0.0%) |
| Accommodation & Food Services | 0 (0.0%) | 0 (0.0%) |
| Public Administration | 86 (100.0%) | 0 (0.0%) |
| Total | 347 (55.2%) | 281 (44.8%) |
Education in Barahona
School Enrollment in Barahona
The most common levels of schooling among the 544 students in Barahona are college / undergraduate (194 | 35.7%), elementary school (148 | 27.2%), and middle school (142 | 26.1%).
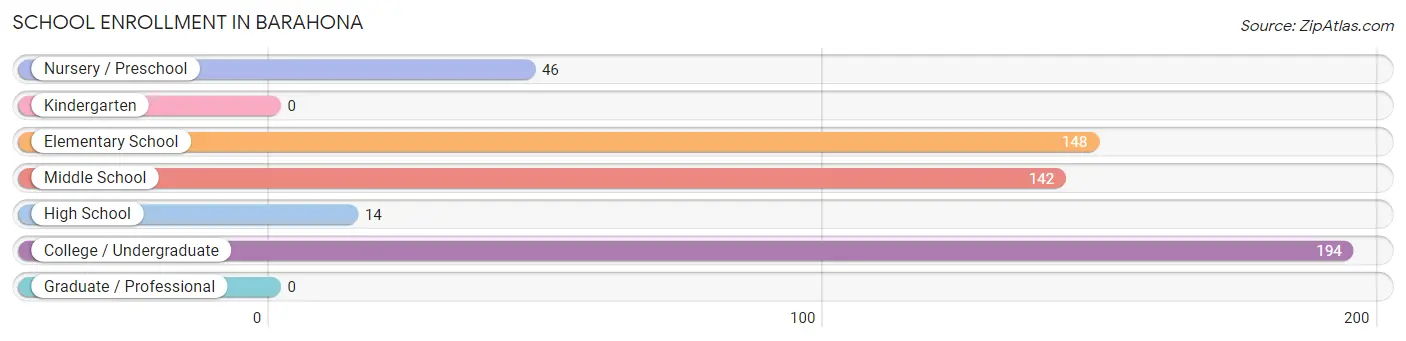
| School Level | # Students | % Students |
| Nursery / Preschool | 46 | 8.5% |
| Kindergarten | 0 | 0.0% |
| Elementary School | 148 | 27.2% |
| Middle School | 142 | 26.1% |
| High School | 14 | 2.6% |
| College / Undergraduate | 194 | 35.7% |
| Graduate / Professional | 0 | 0.0% |
| Total | 544 | 100.0% |
School Enrollment by Age by Funding Source in Barahona
Out of a total of 544 students who are enrolled in schools in Barahona, 174 (32.0%) attend a private institution, while the remaining 370 (68.0%) are enrolled in public schools. The age group of 15 to 17 year olds has the highest likelihood of being enrolled in private schools, with 55 (100.0% in the age bracket) enrolled. Conversely, the age group of 3 to 4 year olds has the lowest likelihood of being enrolled in a private school, with 46 (100.0% in the age bracket) attending a public institution.
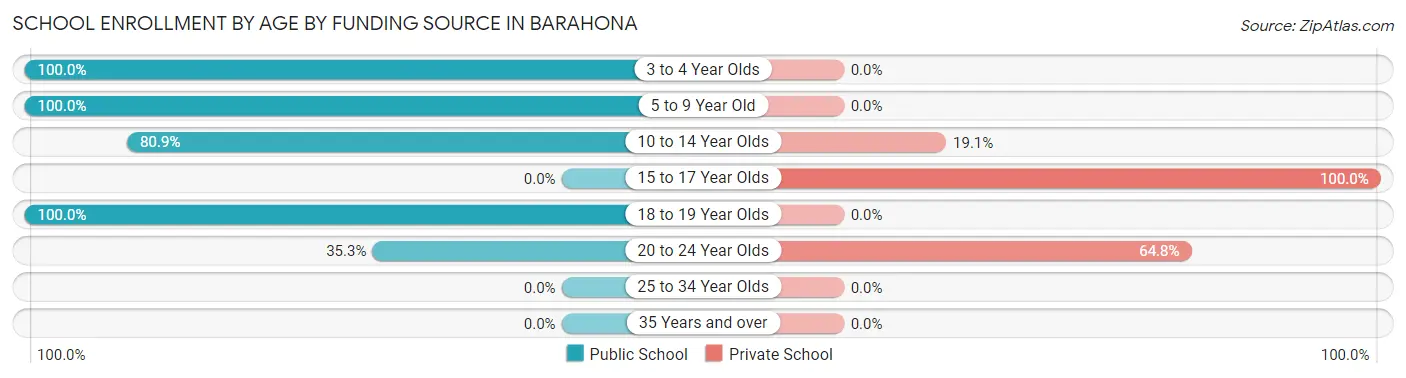
| Age Bracket | Public School | Private School |
| 3 to 4 Year Olds | 46 (100.0%) | 0 (0.0%) |
| 5 to 9 Year Old | 138 (100.0%) | 0 (0.0%) |
| 10 to 14 Year Olds | 123 (80.9%) | 29 (19.1%) |
| 15 to 17 Year Olds | 0 (0.0%) | 55 (100.0%) |
| 18 to 19 Year Olds | 14 (100.0%) | 0 (0.0%) |
| 20 to 24 Year Olds | 49 (35.2%) | 90 (64.7%) |
| 25 to 34 Year Olds | 0 (0.0%) | 0 (0.0%) |
| 35 Years and over | 0 (0.0%) | 0 (0.0%) |
| Total | 370 (68.0%) | 174 (32.0%) |
Educational Attainment by Field of Study in Barahona
Education (54 | 34.2%), arts & humanities (52 | 32.9%), liberal arts & history (20 | 12.7%), bio, nature & agricultural (17 | 10.8%), and business (15 | 9.5%) are the most common fields of study among 158 individuals in Barahona who have obtained a bachelor's degree or higher.
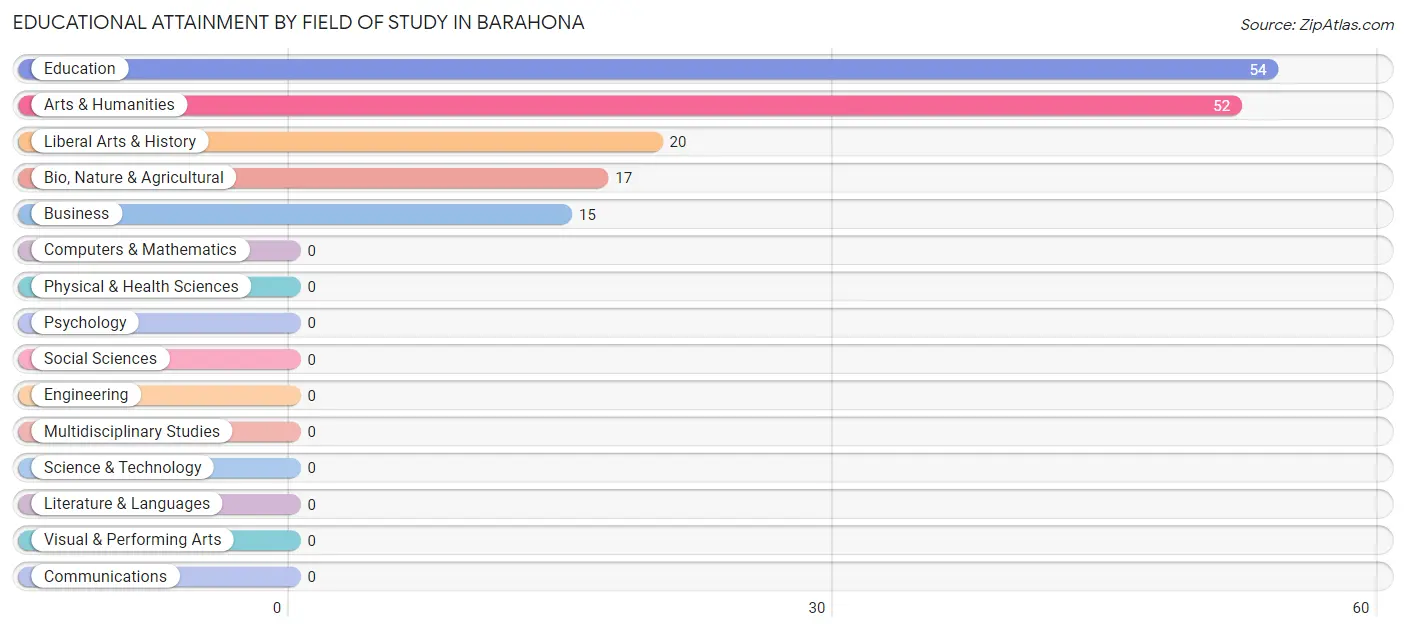
| Field of Study | # Graduates | % Graduates |
| Computers & Mathematics | 0 | 0.0% |
| Bio, Nature & Agricultural | 17 | 10.8% |
| Physical & Health Sciences | 0 | 0.0% |
| Psychology | 0 | 0.0% |
| Social Sciences | 0 | 0.0% |
| Engineering | 0 | 0.0% |
| Multidisciplinary Studies | 0 | 0.0% |
| Science & Technology | 0 | 0.0% |
| Business | 15 | 9.5% |
| Education | 54 | 34.2% |
| Literature & Languages | 0 | 0.0% |
| Liberal Arts & History | 20 | 12.7% |
| Visual & Performing Arts | 0 | 0.0% |
| Communications | 0 | 0.0% |
| Arts & Humanities | 52 | 32.9% |
| Total | 158 | 100.0% |
Transportation & Commute in Barahona
Vehicle Availability by Sex in Barahona
The most prevalent vehicle ownership categories in Barahona are males with 3 vehicles (143, accounting for 41.2%) and females with 3 vehicles (119, making up 50.9%).
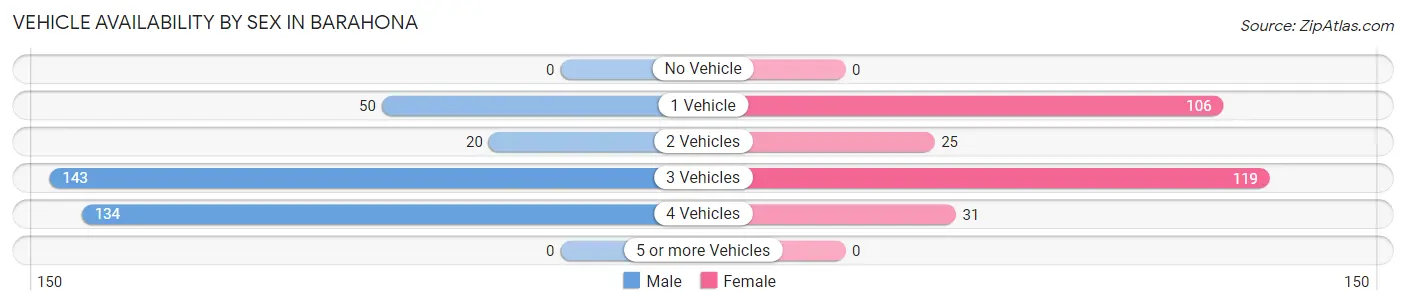
| Vehicles Available | Male | Female |
| No Vehicle | 0 (0.0%) | 0 (0.0%) |
| 1 Vehicle | 50 (14.4%) | 106 (37.7%) |
| 2 Vehicles | 20 (5.8%) | 25 (8.9%) |
| 3 Vehicles | 143 (41.2%) | 119 (42.3%) |
| 4 Vehicles | 134 (38.6%) | 31 (11.0%) |
| 5 or more Vehicles | 0 (0.0%) | 0 (0.0%) |
| Total | 347 (100.0%) | 281 (100.0%) |
Commute Time in Barahona
The most frequently occuring commute durations in Barahona are 15 to 19 minutes (268 commuters, 42.7%), 30 to 34 minutes (87 commuters, 13.9%), and 25 to 29 minutes (60 commuters, 9.6%).
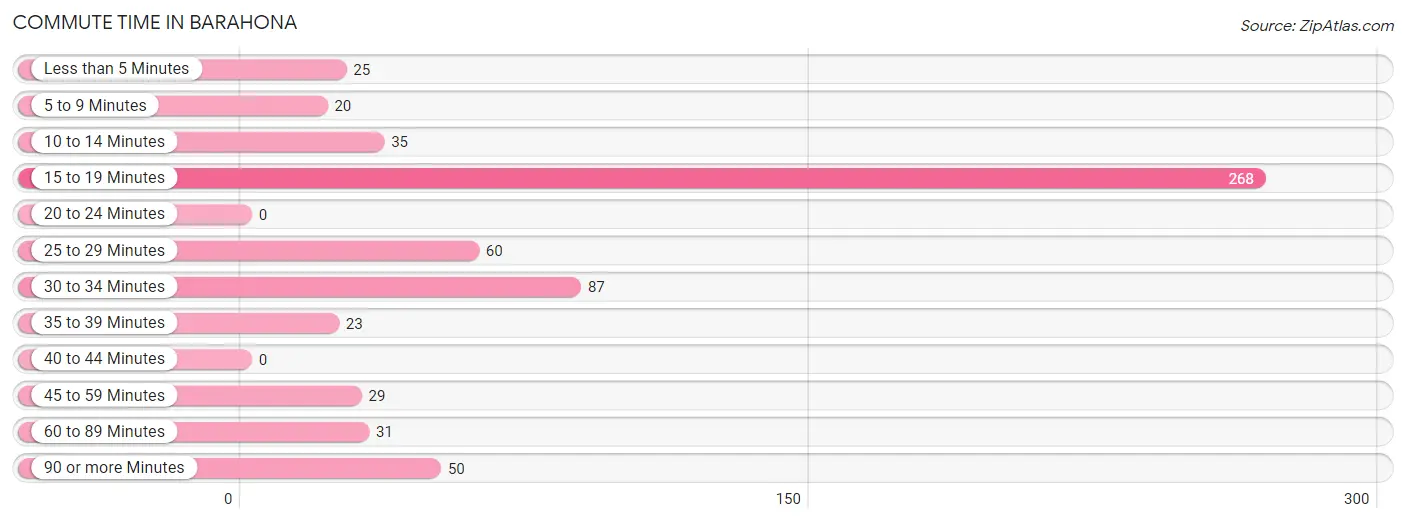
| Commute Time | # Commuters | % Commuters |
| Less than 5 Minutes | 25 | 4.0% |
| 5 to 9 Minutes | 20 | 3.2% |
| 10 to 14 Minutes | 35 | 5.6% |
| 15 to 19 Minutes | 268 | 42.7% |
| 20 to 24 Minutes | 0 | 0.0% |
| 25 to 29 Minutes | 60 | 9.6% |
| 30 to 34 Minutes | 87 | 13.9% |
| 35 to 39 Minutes | 23 | 3.7% |
| 40 to 44 Minutes | 0 | 0.0% |
| 45 to 59 Minutes | 29 | 4.6% |
| 60 to 89 Minutes | 31 | 4.9% |
| 90 or more Minutes | 50 | 8.0% |
Commute Time by Sex in Barahona
The most common commute times in Barahona are 15 to 19 minutes (208 commuters, 59.9%) for males and 15 to 19 minutes (60 commuters, 21.3%) for females.
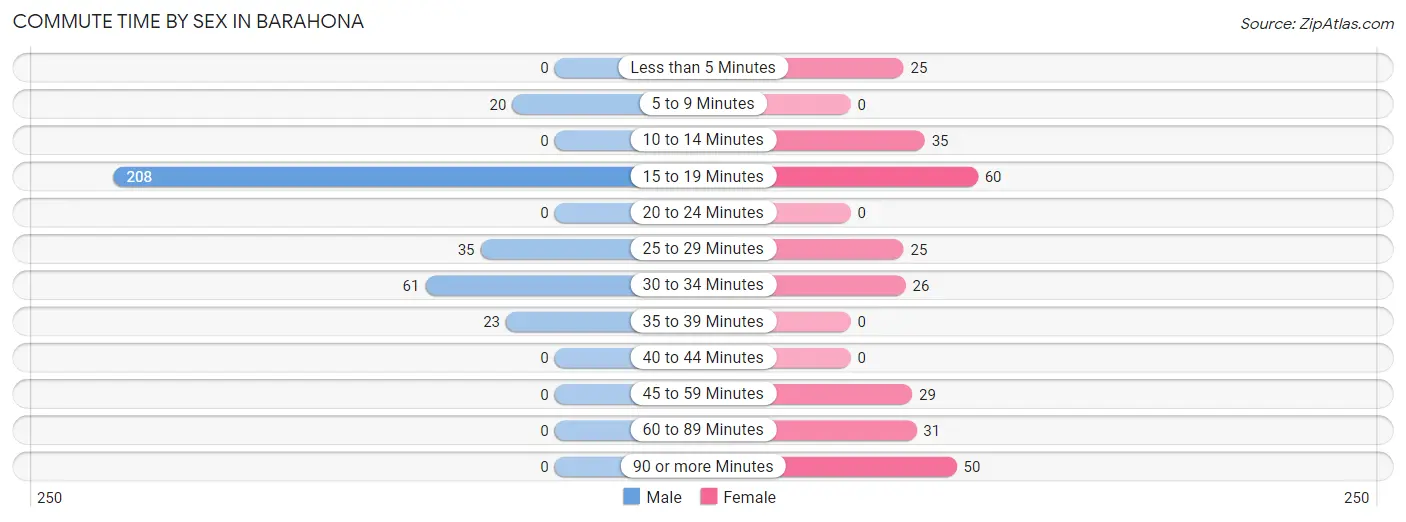
| Commute Time | Male | Female |
| Less than 5 Minutes | 0 (0.0%) | 25 (8.9%) |
| 5 to 9 Minutes | 20 (5.8%) | 0 (0.0%) |
| 10 to 14 Minutes | 0 (0.0%) | 35 (12.5%) |
| 15 to 19 Minutes | 208 (59.9%) | 60 (21.3%) |
| 20 to 24 Minutes | 0 (0.0%) | 0 (0.0%) |
| 25 to 29 Minutes | 35 (10.1%) | 25 (8.9%) |
| 30 to 34 Minutes | 61 (17.6%) | 26 (9.2%) |
| 35 to 39 Minutes | 23 (6.6%) | 0 (0.0%) |
| 40 to 44 Minutes | 0 (0.0%) | 0 (0.0%) |
| 45 to 59 Minutes | 0 (0.0%) | 29 (10.3%) |
| 60 to 89 Minutes | 0 (0.0%) | 31 (11.0%) |
| 90 or more Minutes | 0 (0.0%) | 50 (17.8%) |
Time of Departure to Work by Sex in Barahona
The most frequent times of departure to work in Barahona are 6:00 AM to 6:29 AM (100, 28.8%) for males and 7:00 AM to 7:29 AM (103, 36.6%) for females.
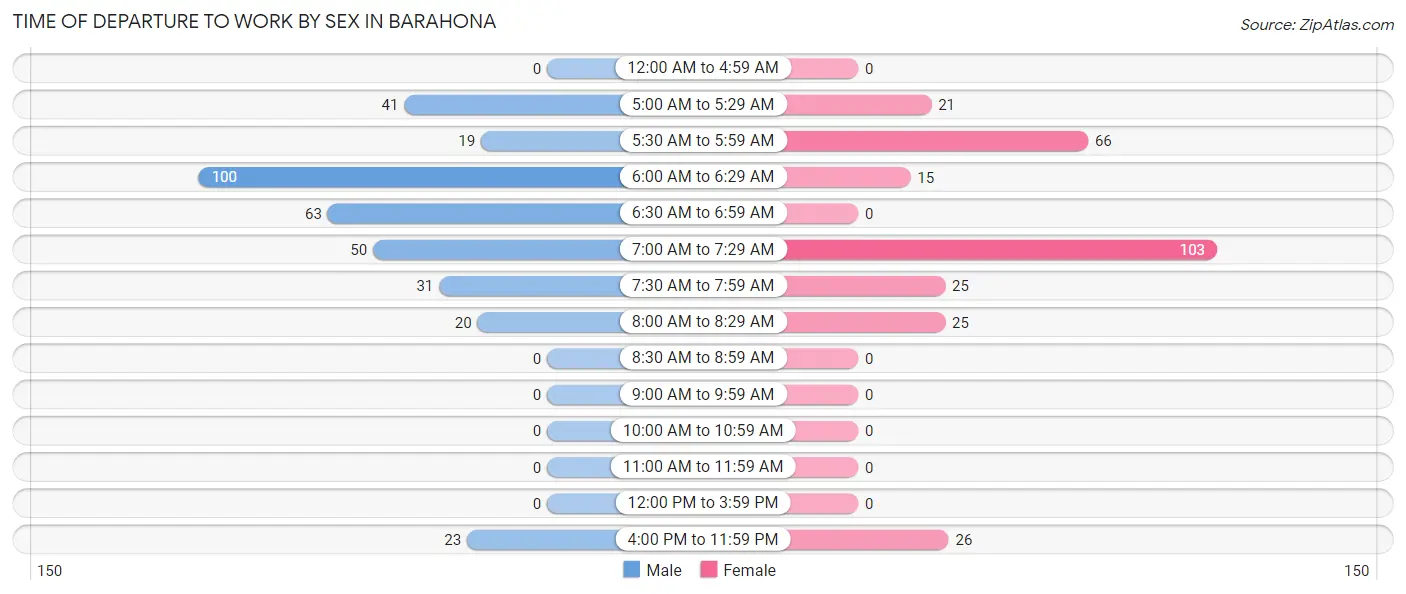
| Time of Departure | Male | Female |
| 12:00 AM to 4:59 AM | 0 (0.0%) | 0 (0.0%) |
| 5:00 AM to 5:29 AM | 41 (11.8%) | 21 (7.5%) |
| 5:30 AM to 5:59 AM | 19 (5.5%) | 66 (23.5%) |
| 6:00 AM to 6:29 AM | 100 (28.8%) | 15 (5.3%) |
| 6:30 AM to 6:59 AM | 63 (18.2%) | 0 (0.0%) |
| 7:00 AM to 7:29 AM | 50 (14.4%) | 103 (36.6%) |
| 7:30 AM to 7:59 AM | 31 (8.9%) | 25 (8.9%) |
| 8:00 AM to 8:29 AM | 20 (5.8%) | 25 (8.9%) |
| 8:30 AM to 8:59 AM | 0 (0.0%) | 0 (0.0%) |
| 9:00 AM to 9:59 AM | 0 (0.0%) | 0 (0.0%) |
| 10:00 AM to 10:59 AM | 0 (0.0%) | 0 (0.0%) |
| 11:00 AM to 11:59 AM | 0 (0.0%) | 0 (0.0%) |
| 12:00 PM to 3:59 PM | 0 (0.0%) | 0 (0.0%) |
| 4:00 PM to 11:59 PM | 23 (6.6%) | 26 (9.2%) |
| Total | 347 (100.0%) | 281 (100.0%) |
Housing Occupancy in Barahona
Occupancy by Ownership in Barahona
Of the total 623 dwellings in Barahona, owner-occupied units account for 346 (55.5%), while renter-occupied units make up 277 (44.5%).
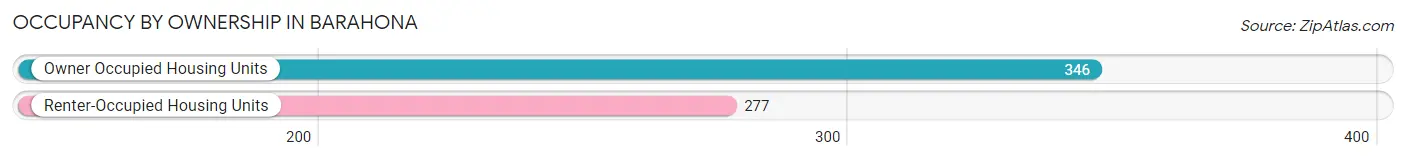
| Occupancy | # Housing Units | % Housing Units |
| Owner Occupied Housing Units | 346 | 55.5% |
| Renter-Occupied Housing Units | 277 | 44.5% |
| Total Occupied Housing Units | 623 | 100.0% |
Occupancy by Household Size in Barahona
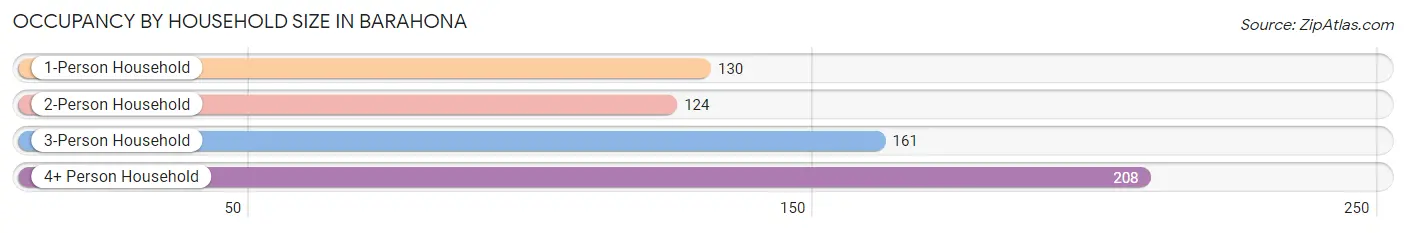
| Household Size | # Housing Units | % Housing Units |
| 1-Person Household | 130 | 20.9% |
| 2-Person Household | 124 | 19.9% |
| 3-Person Household | 161 | 25.8% |
| 4+ Person Household | 208 | 33.4% |
| Total Housing Units | 623 | 100.0% |
Occupancy by Ownership by Household Size in Barahona
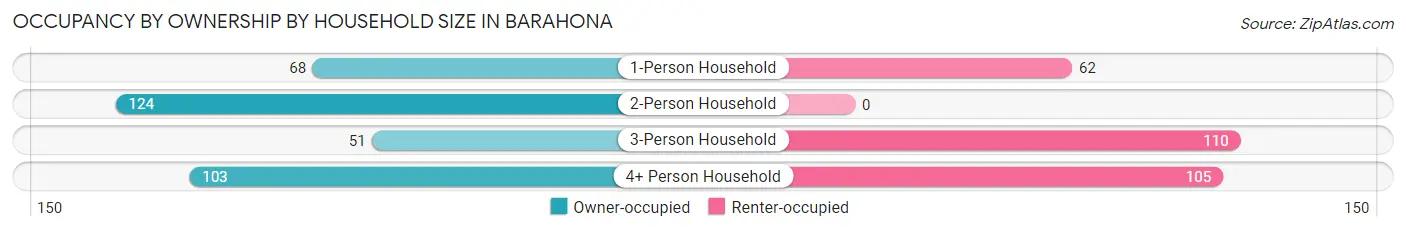
| Household Size | Owner-occupied | Renter-occupied |
| 1-Person Household | 68 (52.3%) | 62 (47.7%) |
| 2-Person Household | 124 (100.0%) | 0 (0.0%) |
| 3-Person Household | 51 (31.7%) | 110 (68.3%) |
| 4+ Person Household | 103 (49.5%) | 105 (50.5%) |
| Total Housing Units | 346 (55.5%) | 277 (44.5%) |
Occupancy by Educational Attainment in Barahona
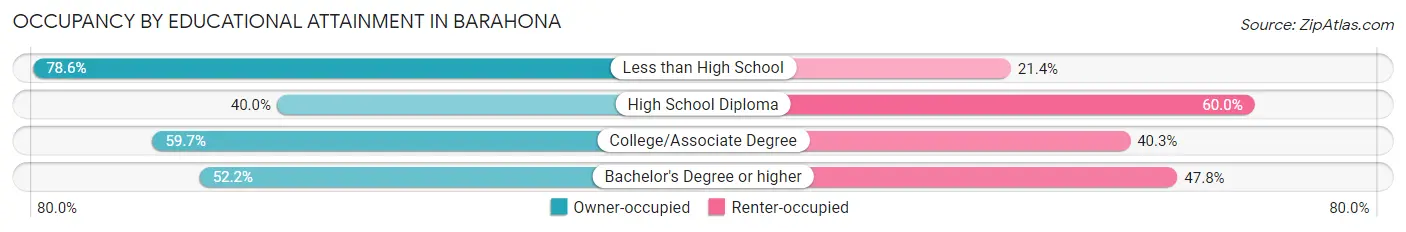
| Household Size | Owner-occupied | Renter-occupied |
| Less than High School | 92 (78.6%) | 25 (21.4%) |
| High School Diploma | 84 (40.0%) | 126 (60.0%) |
| College/Associate Degree | 123 (59.7%) | 83 (40.3%) |
| Bachelor's Degree or higher | 47 (52.2%) | 43 (47.8%) |
Occupancy by Age of Householder in Barahona
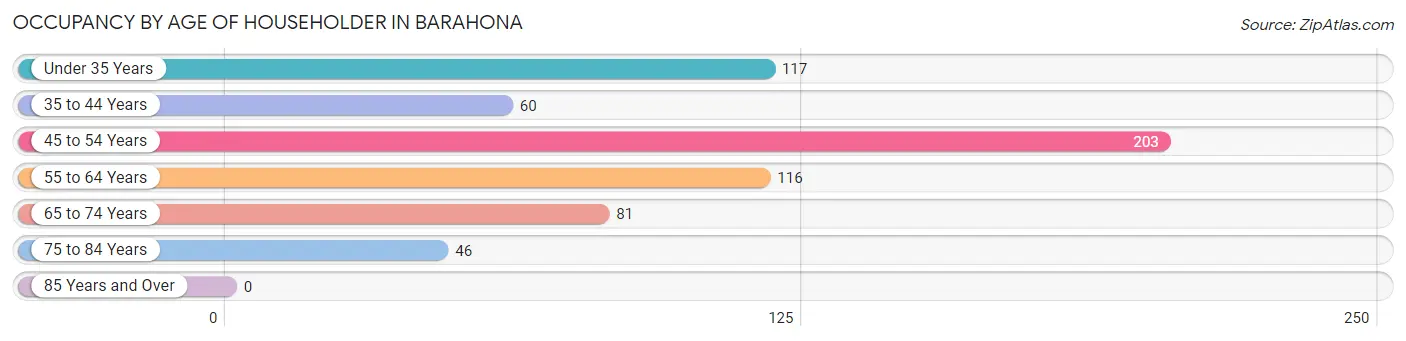
| Age Bracket | # Households | % Households |
| Under 35 Years | 117 | 18.8% |
| 35 to 44 Years | 60 | 9.6% |
| 45 to 54 Years | 203 | 32.6% |
| 55 to 64 Years | 116 | 18.6% |
| 65 to 74 Years | 81 | 13.0% |
| 75 to 84 Years | 46 | 7.4% |
| 85 Years and Over | 0 | 0.0% |
| Total | 623 | 100.0% |
Housing Finances in Barahona
Median Income by Occupancy in Barahona
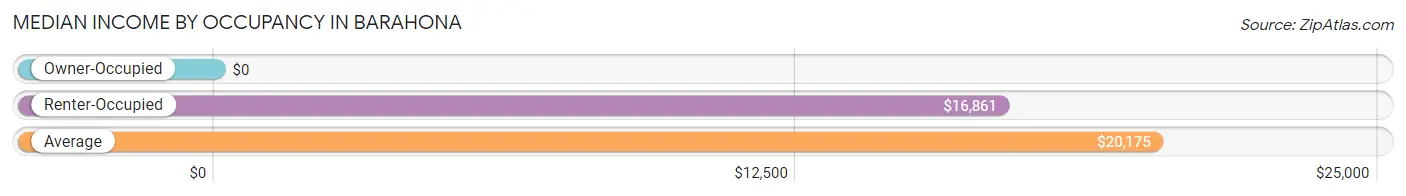
| Occupancy Type | # Households | Median Income |
| Owner-Occupied | 346 (55.5%) | $0 |
| Renter-Occupied | 277 (44.5%) | $16,861 |
| Average | 623 (100.0%) | $20,175 |
Occupancy by Householder Income Bracket in Barahona
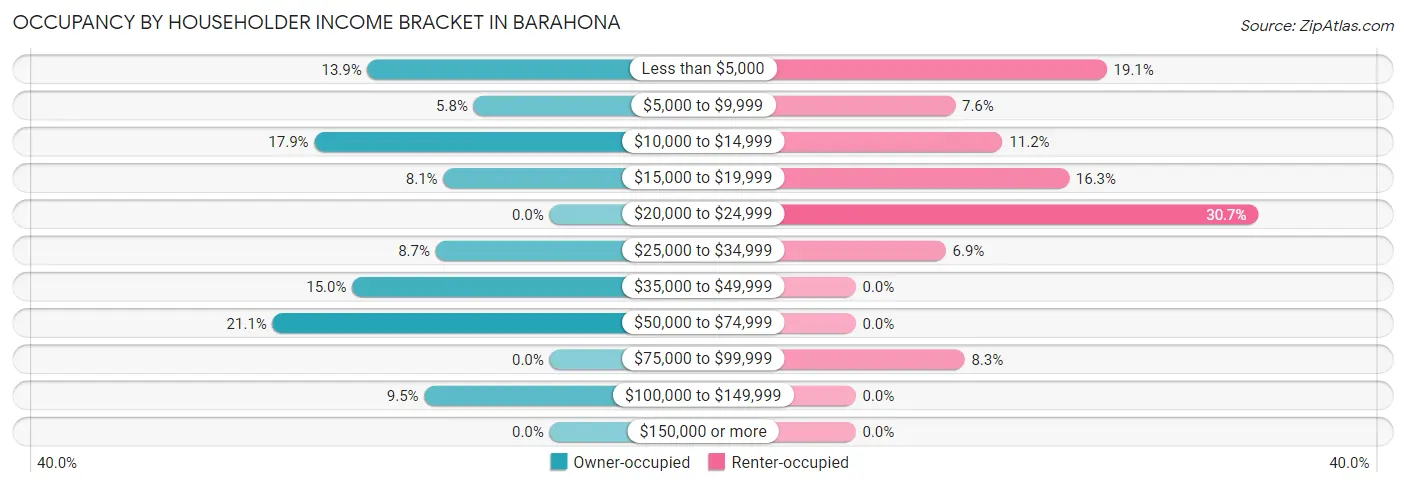
| Income Bracket | Owner-occupied | Renter-occupied |
| Less than $5,000 | 48 (13.9%) | 53 (19.1%) |
| $5,000 to $9,999 | 20 (5.8%) | 21 (7.6%) |
| $10,000 to $14,999 | 62 (17.9%) | 31 (11.2%) |
| $15,000 to $19,999 | 28 (8.1%) | 45 (16.3%) |
| $20,000 to $24,999 | 0 (0.0%) | 85 (30.7%) |
| $25,000 to $34,999 | 30 (8.7%) | 19 (6.9%) |
| $35,000 to $49,999 | 52 (15.0%) | 0 (0.0%) |
| $50,000 to $74,999 | 73 (21.1%) | 0 (0.0%) |
| $75,000 to $99,999 | 0 (0.0%) | 23 (8.3%) |
| $100,000 to $149,999 | 33 (9.5%) | 0 (0.0%) |
| $150,000 or more | 0 (0.0%) | 0 (0.0%) |
| Total | 346 (100.0%) | 277 (100.0%) |
Monthly Housing Cost Tiers in Barahona
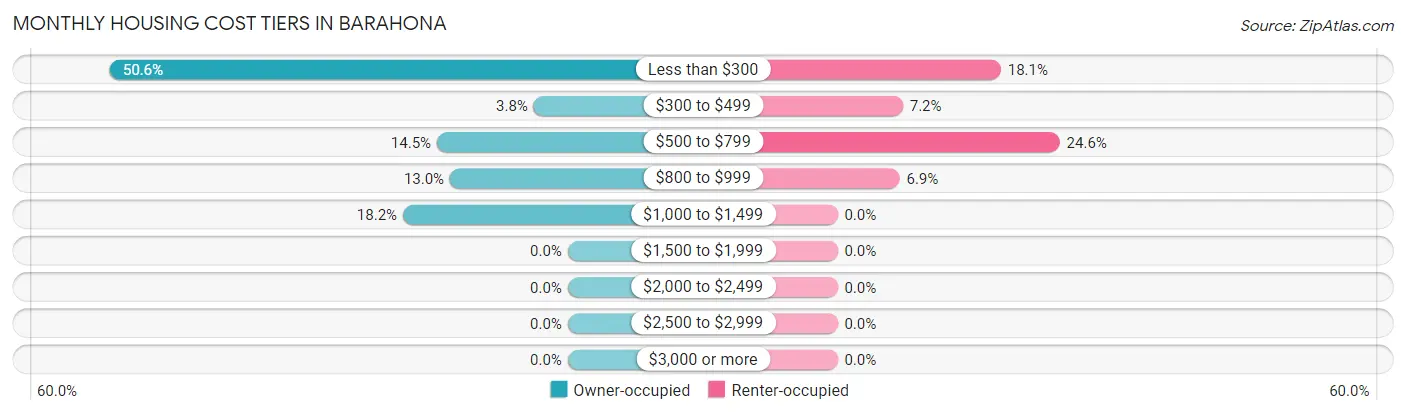
| Monthly Cost | Owner-occupied | Renter-occupied |
| Less than $300 | 175 (50.6%) | 50 (18.0%) |
| $300 to $499 | 13 (3.8%) | 20 (7.2%) |
| $500 to $799 | 50 (14.4%) | 68 (24.5%) |
| $800 to $999 | 45 (13.0%) | 19 (6.9%) |
| $1,000 to $1,499 | 63 (18.2%) | 0 (0.0%) |
| $1,500 to $1,999 | 0 (0.0%) | 0 (0.0%) |
| $2,000 to $2,499 | 0 (0.0%) | 0 (0.0%) |
| $2,500 to $2,999 | 0 (0.0%) | 0 (0.0%) |
| $3,000 or more | 0 (0.0%) | 0 (0.0%) |
| Total | 346 (100.0%) | 277 (100.0%) |
Physical Housing Characteristics in Barahona
Housing Structures in Barahona
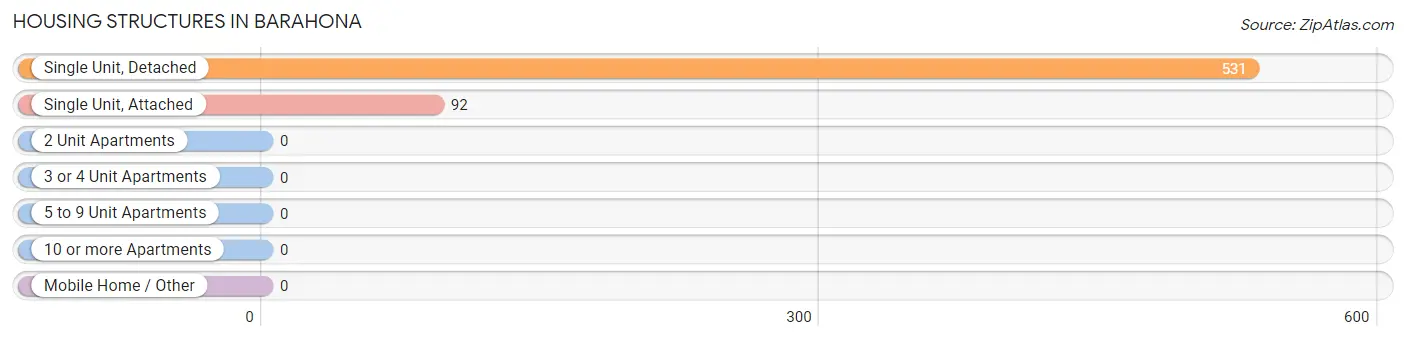
| Structure Type | # Housing Units | % Housing Units |
| Single Unit, Detached | 531 | 85.2% |
| Single Unit, Attached | 92 | 14.8% |
| 2 Unit Apartments | 0 | 0.0% |
| 3 or 4 Unit Apartments | 0 | 0.0% |
| 5 to 9 Unit Apartments | 0 | 0.0% |
| 10 or more Apartments | 0 | 0.0% |
| Mobile Home / Other | 0 | 0.0% |
| Total | 623 | 100.0% |
Housing Structures by Occupancy in Barahona
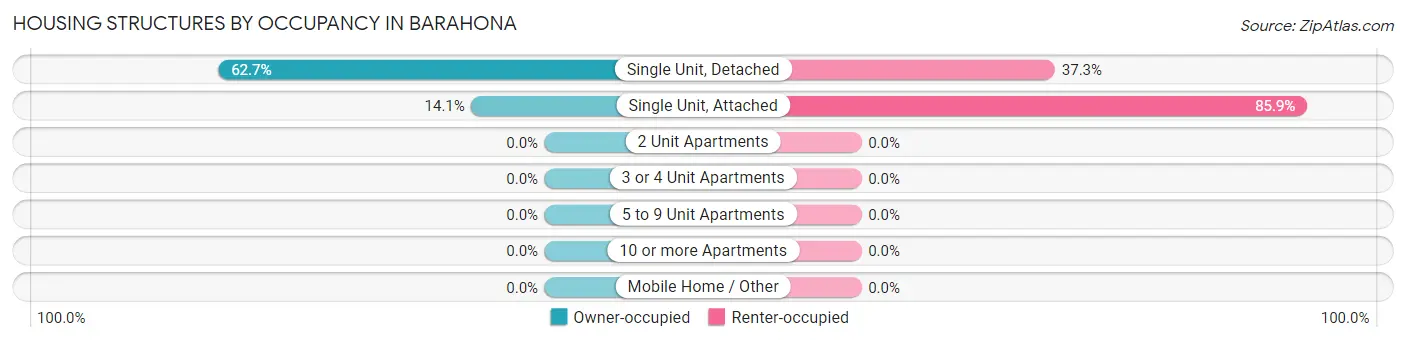
| Structure Type | Owner-occupied | Renter-occupied |
| Single Unit, Detached | 333 (62.7%) | 198 (37.3%) |
| Single Unit, Attached | 13 (14.1%) | 79 (85.9%) |
| 2 Unit Apartments | 0 (0.0%) | 0 (0.0%) |
| 3 or 4 Unit Apartments | 0 (0.0%) | 0 (0.0%) |
| 5 to 9 Unit Apartments | 0 (0.0%) | 0 (0.0%) |
| 10 or more Apartments | 0 (0.0%) | 0 (0.0%) |
| Mobile Home / Other | 0 (0.0%) | 0 (0.0%) |
| Total | 346 (55.5%) | 277 (44.5%) |
Housing Structures by Number of Rooms in Barahona
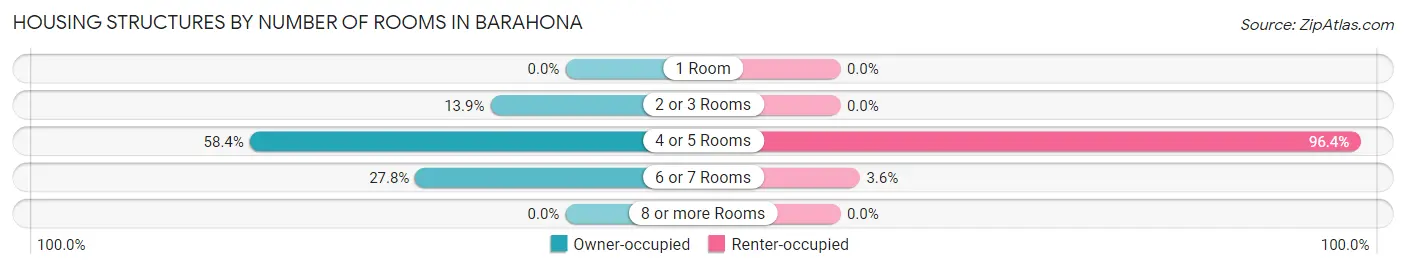
| Number of Rooms | Owner-occupied | Renter-occupied |
| 1 Room | 0 (0.0%) | 0 (0.0%) |
| 2 or 3 Rooms | 48 (13.9%) | 0 (0.0%) |
| 4 or 5 Rooms | 202 (58.4%) | 267 (96.4%) |
| 6 or 7 Rooms | 96 (27.8%) | 10 (3.6%) |
| 8 or more Rooms | 0 (0.0%) | 0 (0.0%) |
| Total | 346 (100.0%) | 277 (100.0%) |
Housing Structure by Heating Type in Barahona
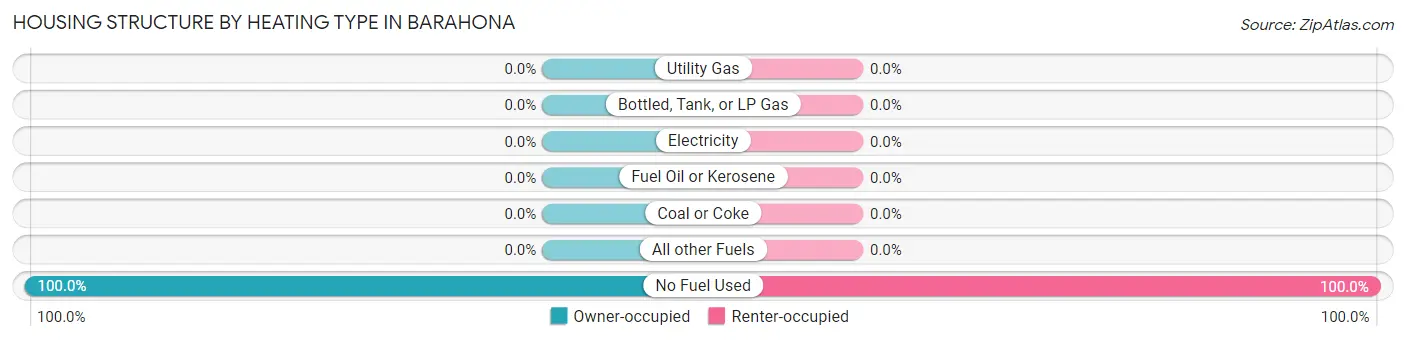
| Heating Type | Owner-occupied | Renter-occupied |
| Utility Gas | 0 (0.0%) | 0 (0.0%) |
| Bottled, Tank, or LP Gas | 0 (0.0%) | 0 (0.0%) |
| Electricity | 0 (0.0%) | 0 (0.0%) |
| Fuel Oil or Kerosene | 0 (0.0%) | 0 (0.0%) |
| Coal or Coke | 0 (0.0%) | 0 (0.0%) |
| All other Fuels | 0 (0.0%) | 0 (0.0%) |
| No Fuel Used | 346 (100.0%) | 277 (100.0%) |
| Total | 346 (100.0%) | 277 (100.0%) |
Household Vehicle Usage in Barahona
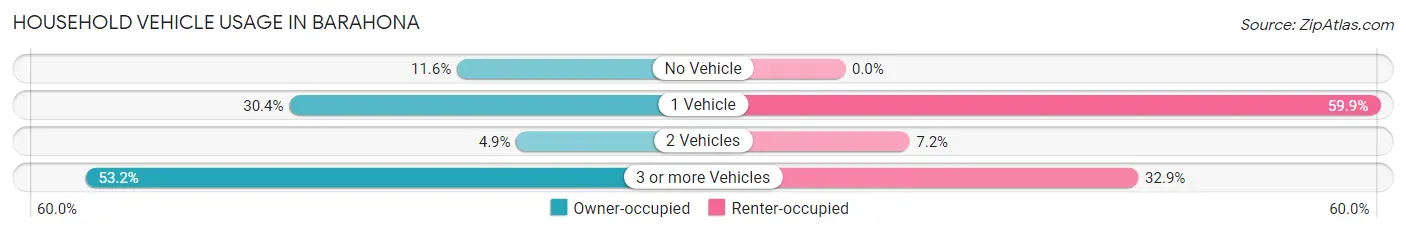
| Vehicles per Household | Owner-occupied | Renter-occupied |
| No Vehicle | 40 (11.6%) | 0 (0.0%) |
| 1 Vehicle | 105 (30.3%) | 166 (59.9%) |
| 2 Vehicles | 17 (4.9%) | 20 (7.2%) |
| 3 or more Vehicles | 184 (53.2%) | 91 (32.9%) |
| Total | 346 (100.0%) | 277 (100.0%) |
Real Estate & Mortgages in Barahona
Real Estate and Mortgage Overview in Barahona
| Characteristic | Without Mortgage | With Mortgage |
| Housing Units | 188 | 158 |
| Median Property Value | $86,800 | $124,400 |
| Median Household Income | $11,048 | $0 |
| Monthly Housing Costs | $152 | $0 |
| Real Estate Taxes | - | - |
Property Value by Mortgage Status in Barahona
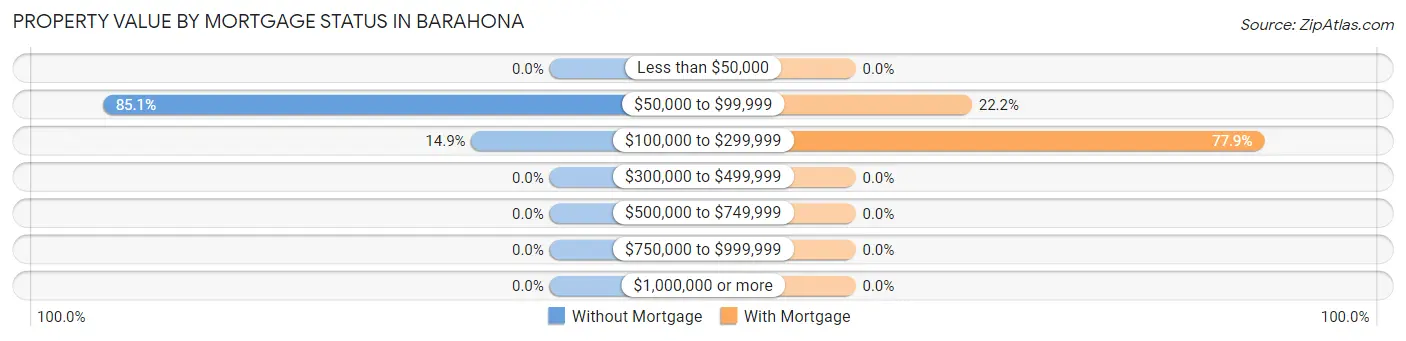
| Property Value | Without Mortgage | With Mortgage |
| Less than $50,000 | 0 (0.0%) | 0 (0.0%) |
| $50,000 to $99,999 | 160 (85.1%) | 35 (22.2%) |
| $100,000 to $299,999 | 28 (14.9%) | 123 (77.8%) |
| $300,000 to $499,999 | 0 (0.0%) | 0 (0.0%) |
| $500,000 to $749,999 | 0 (0.0%) | 0 (0.0%) |
| $750,000 to $999,999 | 0 (0.0%) | 0 (0.0%) |
| $1,000,000 or more | 0 (0.0%) | 0 (0.0%) |
| Total | 188 (100.0%) | 158 (100.0%) |
Household Income by Mortgage Status in Barahona
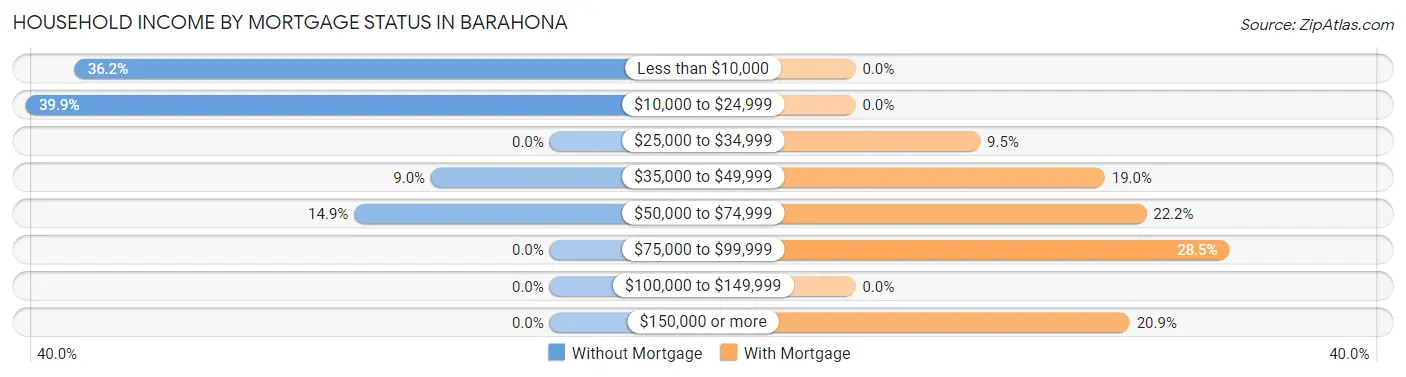
| Household Income | Without Mortgage | With Mortgage |
| Less than $10,000 | 68 (36.2%) | 0 (0.0%) |
| $10,000 to $24,999 | 75 (39.9%) | 0 (0.0%) |
| $25,000 to $34,999 | 0 (0.0%) | 15 (9.5%) |
| $35,000 to $49,999 | 17 (9.0%) | 30 (19.0%) |
| $50,000 to $74,999 | 28 (14.9%) | 35 (22.2%) |
| $75,000 to $99,999 | 0 (0.0%) | 45 (28.5%) |
| $100,000 to $149,999 | 0 (0.0%) | 0 (0.0%) |
| $150,000 or more | 0 (0.0%) | 33 (20.9%) |
| Total | 188 (100.0%) | 158 (100.0%) |
Property Value to Household Income Ratio in Barahona
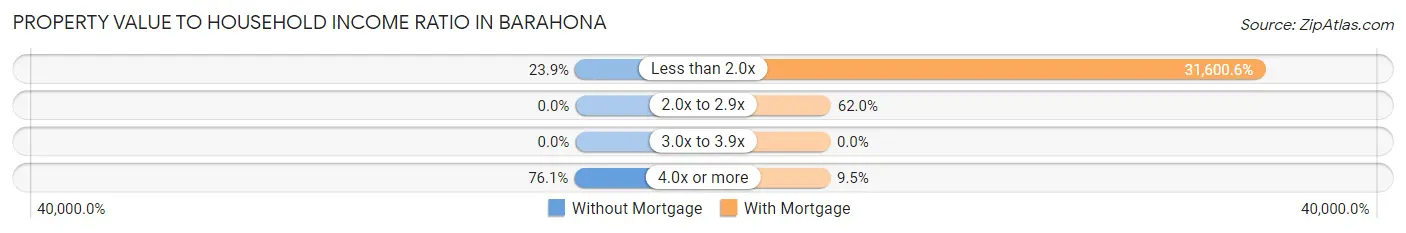
| Value-to-Income Ratio | Without Mortgage | With Mortgage |
| Less than 2.0x | 45 (23.9%) | 49,929 (31,600.6%) |
| 2.0x to 2.9x | 0 (0.0%) | 98 (62.0%) |
| 3.0x to 3.9x | 0 (0.0%) | 0 (0.0%) |
| 4.0x or more | 143 (76.1%) | 15 (9.5%) |
| Total | 188 (100.0%) | 158 (100.0%) |
Real Estate Taxes by Mortgage Status in Barahona
| Property Taxes | Without Mortgage | With Mortgage |
| Less than $800 | 0 (0.0%) | 0 (0.0%) |
| $800 to $1,499 | 0 (0.0%) | 0 (0.0%) |
| $800 to $1,499 | 0 (0.0%) | 0 (0.0%) |
| Total | 188 (100.0%) | 158 (100.0%) |
Health & Disability in Barahona
Health Insurance Coverage by Age in Barahona
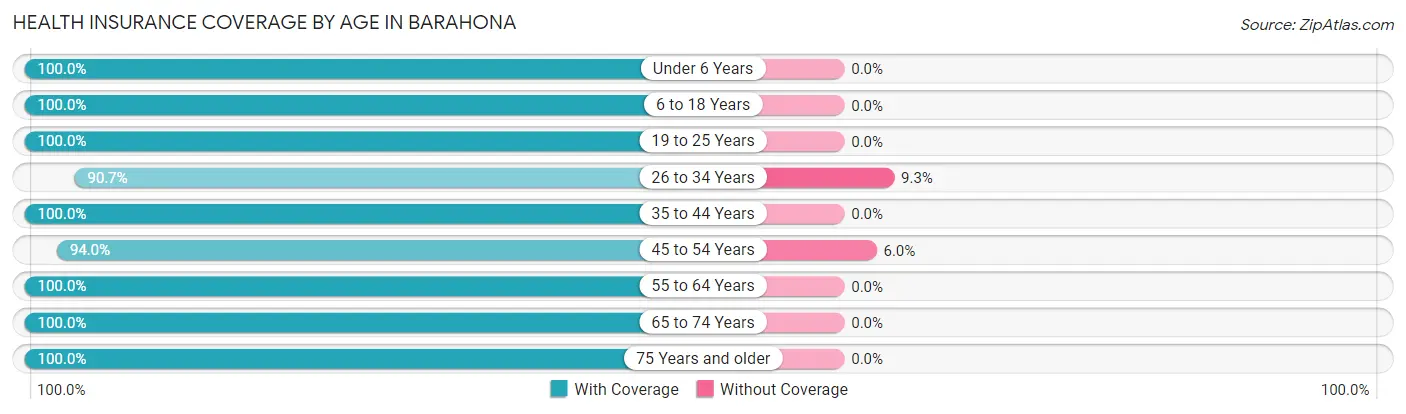
| Age Bracket | With Coverage | Without Coverage |
| Under 6 Years | 175 (100.0%) | 0 (0.0%) |
| 6 to 18 Years | 359 (100.0%) | 0 (0.0%) |
| 19 to 25 Years | 235 (100.0%) | 0 (0.0%) |
| 26 to 34 Years | 293 (90.7%) | 30 (9.3%) |
| 35 to 44 Years | 133 (100.0%) | 0 (0.0%) |
| 45 to 54 Years | 313 (94.0%) | 20 (6.0%) |
| 55 to 64 Years | 157 (100.0%) | 0 (0.0%) |
| 65 to 74 Years | 137 (100.0%) | 0 (0.0%) |
| 75 Years and older | 131 (100.0%) | 0 (0.0%) |
| Total | 1,933 (97.5%) | 50 (2.5%) |
Health Insurance Coverage by Citizenship Status in Barahona
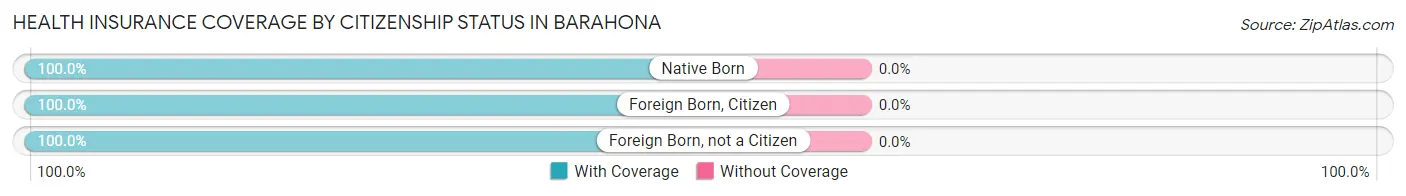
| Citizenship Status | With Coverage | Without Coverage |
| Native Born | 175 (100.0%) | 0 (0.0%) |
| Foreign Born, Citizen | 359 (100.0%) | 0 (0.0%) |
| Foreign Born, not a Citizen | 235 (100.0%) | 0 (0.0%) |
Health Insurance Coverage by Household Income in Barahona
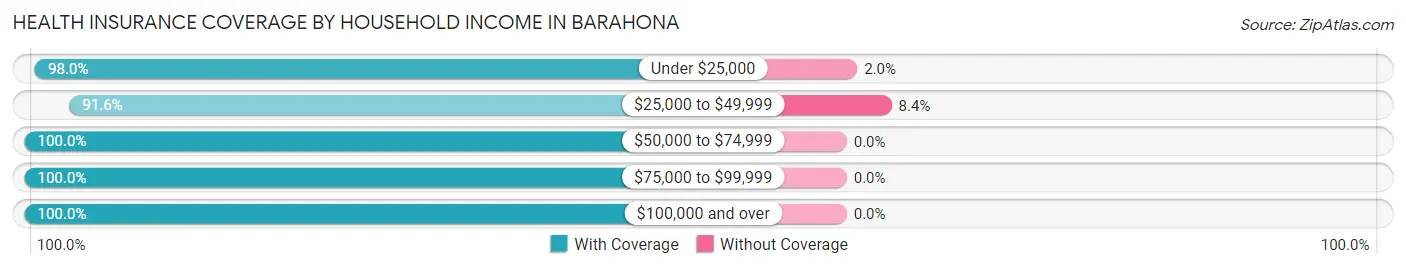
| Household Income | With Coverage | Without Coverage |
| Under $25,000 | 999 (98.0%) | 20 (2.0%) |
| $25,000 to $49,999 | 327 (91.6%) | 30 (8.4%) |
| $50,000 to $74,999 | 358 (100.0%) | 0 (0.0%) |
| $75,000 to $99,999 | 111 (100.0%) | 0 (0.0%) |
| $100,000 and over | 137 (100.0%) | 0 (0.0%) |
Public vs Private Health Insurance Coverage by Age in Barahona
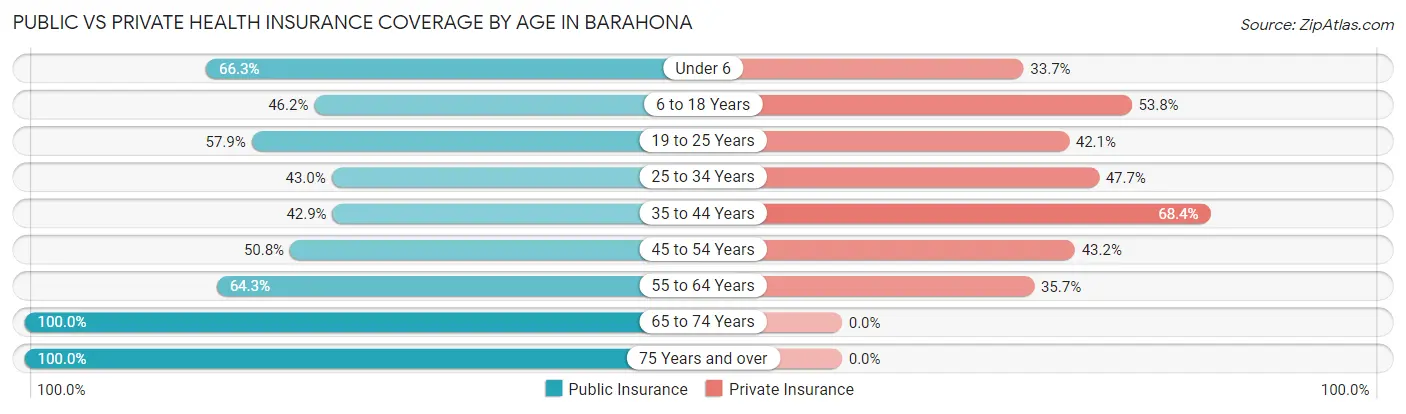
| Age Bracket | Public Insurance | Private Insurance |
| Under 6 | 116 (66.3%) | 59 (33.7%) |
| 6 to 18 Years | 166 (46.2%) | 193 (53.8%) |
| 19 to 25 Years | 136 (57.9%) | 99 (42.1%) |
| 25 to 34 Years | 139 (43.0%) | 154 (47.7%) |
| 35 to 44 Years | 57 (42.9%) | 91 (68.4%) |
| 45 to 54 Years | 169 (50.7%) | 144 (43.2%) |
| 55 to 64 Years | 101 (64.3%) | 56 (35.7%) |
| 65 to 74 Years | 137 (100.0%) | 0 (0.0%) |
| 75 Years and over | 131 (100.0%) | 0 (0.0%) |
| Total | 1,152 (58.1%) | 796 (40.1%) |
Disability Status by Sex by Age in Barahona
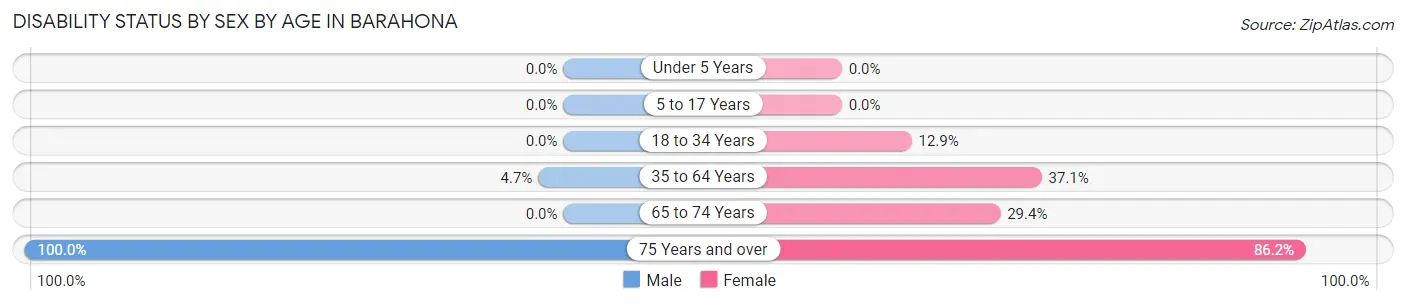
| Age Bracket | Male | Female |
| Under 5 Years | 0 (0.0%) | 0 (0.0%) |
| 5 to 17 Years | 0 (0.0%) | 0 (0.0%) |
| 18 to 34 Years | 0 (0.0%) | 40 (12.9%) |
| 35 to 64 Years | 15 (4.7%) | 112 (37.1%) |
| 65 to 74 Years | 0 (0.0%) | 20 (29.4%) |
| 75 Years and over | 1 (100.0%) | 112 (86.2%) |
Disability Class by Sex by Age in Barahona
Disability Class: Hearing Difficulty
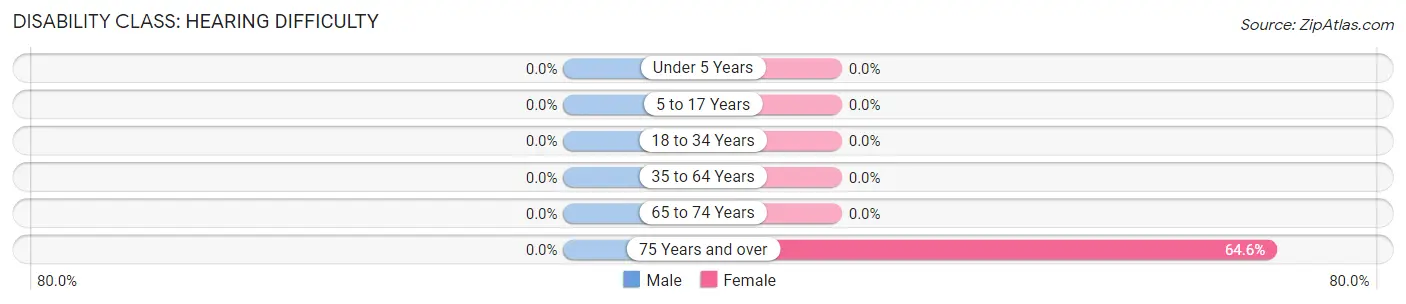
| Age Bracket | Male | Female |
| Under 5 Years | 0 (0.0%) | 0 (0.0%) |
| 5 to 17 Years | 0 (0.0%) | 0 (0.0%) |
| 18 to 34 Years | 0 (0.0%) | 0 (0.0%) |
| 35 to 64 Years | 0 (0.0%) | 0 (0.0%) |
| 65 to 74 Years | 0 (0.0%) | 0 (0.0%) |
| 75 Years and over | 0 (0.0%) | 84 (64.6%) |
Disability Class: Vision Difficulty
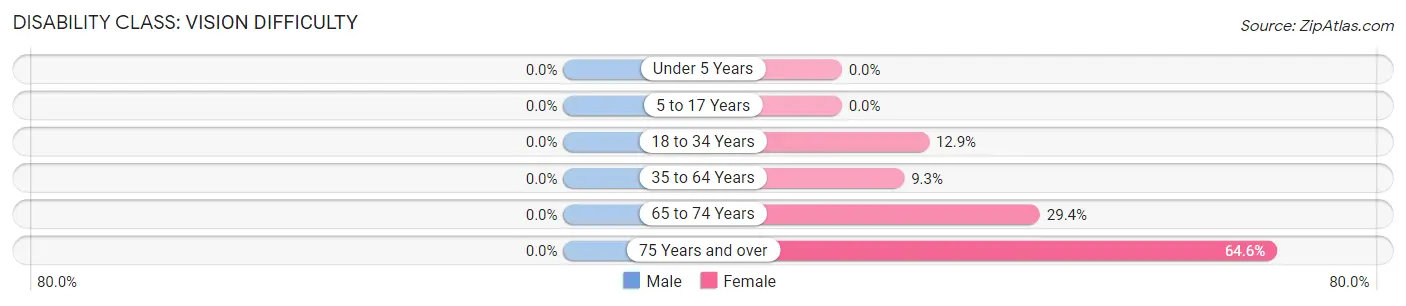
| Age Bracket | Male | Female |
| Under 5 Years | 0 (0.0%) | 0 (0.0%) |
| 5 to 17 Years | 0 (0.0%) | 0 (0.0%) |
| 18 to 34 Years | 0 (0.0%) | 40 (12.9%) |
| 35 to 64 Years | 0 (0.0%) | 28 (9.3%) |
| 65 to 74 Years | 0 (0.0%) | 20 (29.4%) |
| 75 Years and over | 0 (0.0%) | 84 (64.6%) |
Disability Class: Cognitive Difficulty
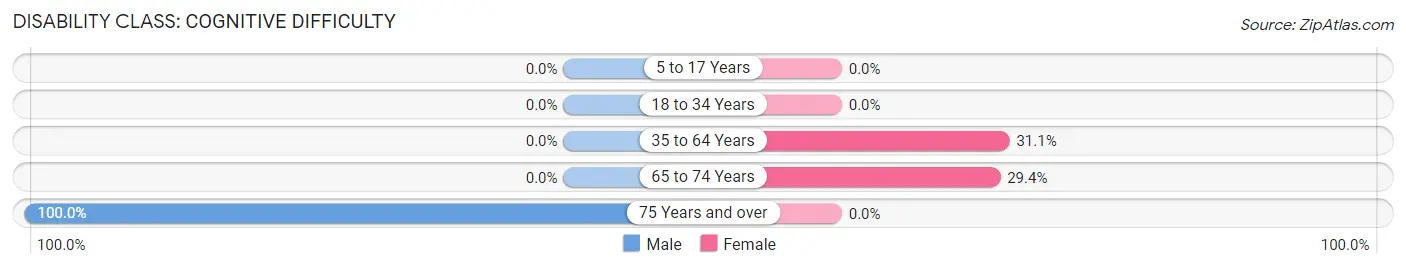
| Age Bracket | Male | Female |
| 5 to 17 Years | 0 (0.0%) | 0 (0.0%) |
| 18 to 34 Years | 0 (0.0%) | 0 (0.0%) |
| 35 to 64 Years | 0 (0.0%) | 94 (31.1%) |
| 65 to 74 Years | 0 (0.0%) | 20 (29.4%) |
| 75 Years and over | 1 (100.0%) | 0 (0.0%) |
Disability Class: Ambulatory Difficulty
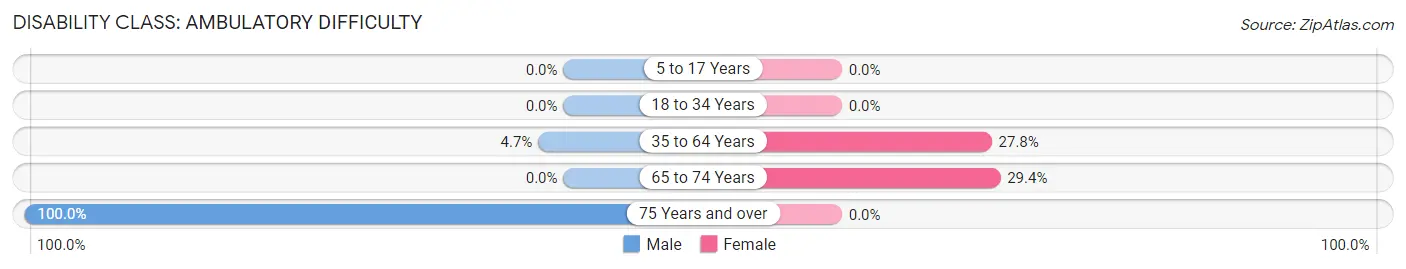
| Age Bracket | Male | Female |
| 5 to 17 Years | 0 (0.0%) | 0 (0.0%) |
| 18 to 34 Years | 0 (0.0%) | 0 (0.0%) |
| 35 to 64 Years | 15 (4.7%) | 84 (27.8%) |
| 65 to 74 Years | 0 (0.0%) | 20 (29.4%) |
| 75 Years and over | 1 (100.0%) | 0 (0.0%) |
Disability Class: Self-Care Difficulty
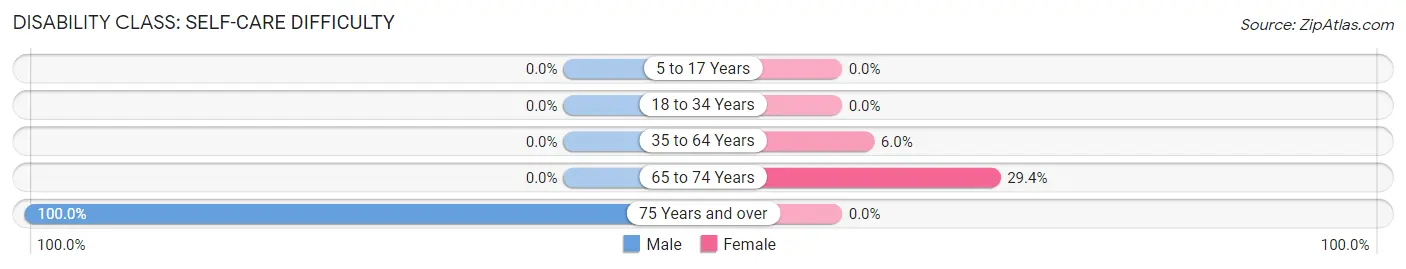
| Age Bracket | Male | Female |
| 5 to 17 Years | 0 (0.0%) | 0 (0.0%) |
| 18 to 34 Years | 0 (0.0%) | 0 (0.0%) |
| 35 to 64 Years | 0 (0.0%) | 18 (6.0%) |
| 65 to 74 Years | 0 (0.0%) | 20 (29.4%) |
| 75 Years and over | 1 (100.0%) | 0 (0.0%) |
Technology Access in Barahona
Computing Device Access in Barahona
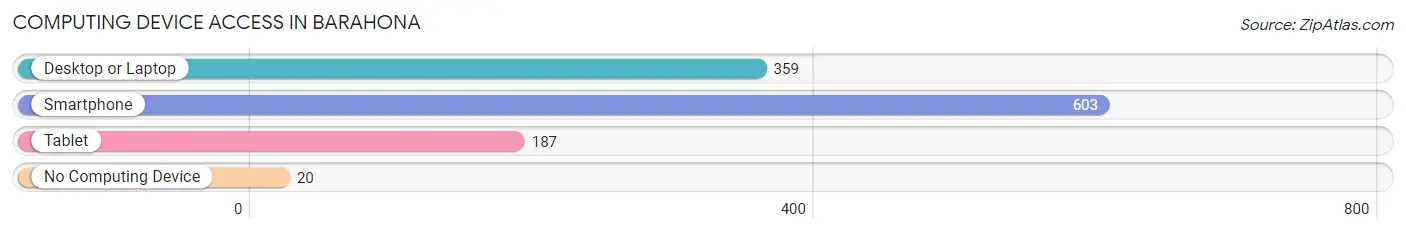
| Device Type | # Households | % Households |
| Desktop or Laptop | 359 | 57.6% |
| Smartphone | 603 | 96.8% |
| Tablet | 187 | 30.0% |
| No Computing Device | 20 | 3.2% |
| Total | 623 | 100.0% |
Internet Access in Barahona
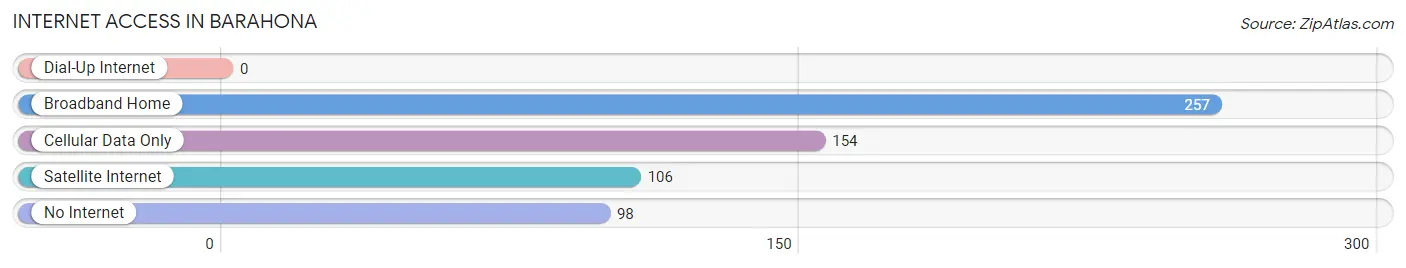
| Internet Type | # Households | % Households |
| Dial-Up Internet | 0 | 0.0% |
| Broadband Home | 257 | 41.2% |
| Cellular Data Only | 154 | 24.7% |
| Satellite Internet | 106 | 17.0% |
| No Internet | 98 | 15.7% |
| Total | 623 | 100.0% |
Barahona Summary
Barahona is a municipality located in the southwestern region of the Dominican Republic. It is the capital of the province of Barahona and is located on the Caribbean Sea. The municipality has a population of approximately 100,000 people and covers an area of 1,845 km2.
History
Barahona was founded in 1510 by the Spanish conquistador Diego Velázquez de Cuéllar. It was originally called Santa Cruz de Barahona and was the first settlement in the province. The city was an important port for the Spanish during the colonial period and was used to transport goods to and from the Caribbean islands.
In 1822, Barahona was the site of a major battle between the forces of the Dominican Republic and Haiti. The battle was part of the Haitian-Dominican War and resulted in a Dominican victory.
In the late 19th century, Barahona was an important center of the coffee industry in the Dominican Republic. The city was also the site of a major revolt in 1912, when workers in the coffee industry protested against low wages and poor working conditions.
Geography
Barahona is located in the southwestern region of the Dominican Republic, on the Caribbean Sea. The municipality covers an area of 1,845 km2 and is bordered by the provinces of Azua, Independencia, Pedernales, and San Juan.
The city is located in a tropical climate zone and has an average temperature of 25°C. The city receives an average of 1,500 mm of rainfall per year.
The municipality is home to several rivers, including the Yaque del Sur, which is the longest river in the Dominican Republic. The city is also home to several lakes, including Lago Enriquillo, which is the largest lake in the Caribbean.
Economy
The economy of Barahona is largely based on agriculture and tourism. The city is home to several agricultural plantations, including coffee, sugar cane, and tobacco. The city is also a major producer of seafood, including lobster, shrimp, and fish.
Tourism is an important part of the economy of Barahona. The city is home to several beaches, including Playa Rincon and Playa Bahoruco. The city is also home to several national parks, including Parque Nacional Jaragua and Parque Nacional Sierra de Bahoruco.
Demographics
As of the 2010 census, the population of Barahona was approximately 100,000 people. The majority of the population is of mixed race, with a significant minority of African descent. The city is also home to a small population of Haitians.
The majority of the population is Roman Catholic, with a small minority of Protestants. Spanish is the official language of the city, although English and French are also spoken.
Barahona is an important cultural center in the Dominican Republic. The city is home to several museums, including the Museo de Barahona and the Museo de la Cultura Taino. The city is also home to several festivals, including the Festival de la Musica and the Festival de la Cultura.
Common Questions
What is Per Capita Income in Barahona?
Per Capita income in Barahona is $11,665.
What is the Median Family Income in Barahona?
Median Family Income in Barahona is $23,821.
What is the Median Household income in Barahona?
Median Household Income in Barahona is $20,175.
What is Income or Wage Gap in Barahona?
Income or Wage Gap in Barahona is 42.2%.
Women in Barahona earn 57.8 cents for every dollar earned by a man.
What is Inequality or Gini Index in Barahona?
Inequality or Gini Index in Barahona is 0.52.
What is the Total Population of Barahona?
Total Population of Barahona is 1,983.
What is the Total Male Population of Barahona?
Total Male Population of Barahona is 748.
What is the Total Female Population of Barahona?
Total Female Population of Barahona is 1,235.
What is the Ratio of Males per 100 Females in Barahona?
There are 60.57 Males per 100 Females in Barahona.
What is the Ratio of Females per 100 Males in Barahona?
There are 165.11 Females per 100 Males in Barahona.
What is the Median Population Age in Barahona?
Median Population Age in Barahona is 31.8 Years.
What is the Average Family Size in Barahona
Average Family Size in Barahona is 3.6 People.
What is the Average Household Size in Barahona
Average Household Size in Barahona is 3.2 People.
How Large is the Labor Force in Barahona?
There are 686 People in the Labor Forcein in Barahona.
What is the Percentage of People in the Labor Force in Barahona?
45.7% of People are in the Labor Force in Barahona.
What is the Unemployment Rate in Barahona?
Unemployment Rate in Barahona is 8.6%.