Yaurel, PR Map & Demographics
Yaurel Map
Yaurel Overview
$11,809
PER CAPITA INCOME
$14,375
AVG FAMILY INCOME
$13,000
AVG HOUSEHOLD INCOME
$10,879
FAMILY INCOME DEFICIT
0.55
INEQUALITY / GINI INDEX
646
TOTAL POPULATION
309
MALE POPULATION
337
FEMALE POPULATION
91.69
MALES / 100 FEMALES
109.06
FEMALES / 100 MALES
56.5
MEDIAN AGE
3.0
AVG FAMILY SIZE
2.2
AVG HOUSEHOLD SIZE
184
LABOR FORCE [ PEOPLE ]
29.5%
PERCENT IN LABOR FORCE
9.8%
UNEMPLOYMENT RATE
Income in Yaurel
Income Overview in Yaurel
Per Capita Income in Yaurel is $11,809, while median incomes of families and households are $14,375 and $13,000 respectively.
| Characteristic | Number | Measure |
| Per Capita Income | 646 | $11,809 |
| Median Family Income | 156 | $14,375 |
| Mean Family Income | 156 | $27,472 |
| Median Household Income | 294 | $13,000 |
| Mean Household Income | 294 | $22,876 |
| Income Deficit | 156 | $10,879 |
| Wage / Income Gap (%) | 646 | 0.00% |
| Wage / Income Gap ($) | 646 | 100.00¢ per $1 |
| Gini / Inequality Index | 646 | 0.55 |
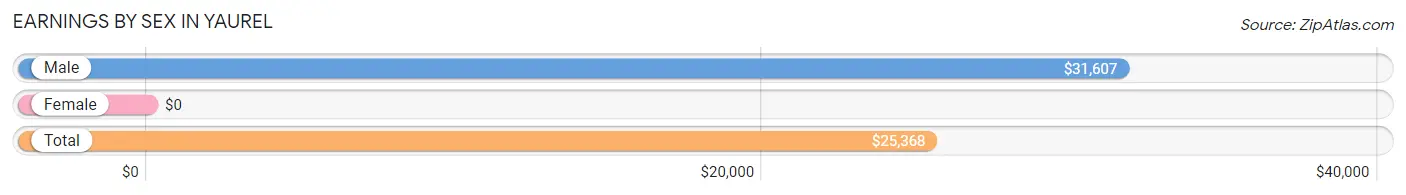
Earnings by Sex in Yaurel
| Sex | Number | Average Earnings |
| Male | 76 (39.6%) | $31,607 |
| Female | 116 (60.4%) | $0 |
| Total | 192 (100.0%) | $25,368 |
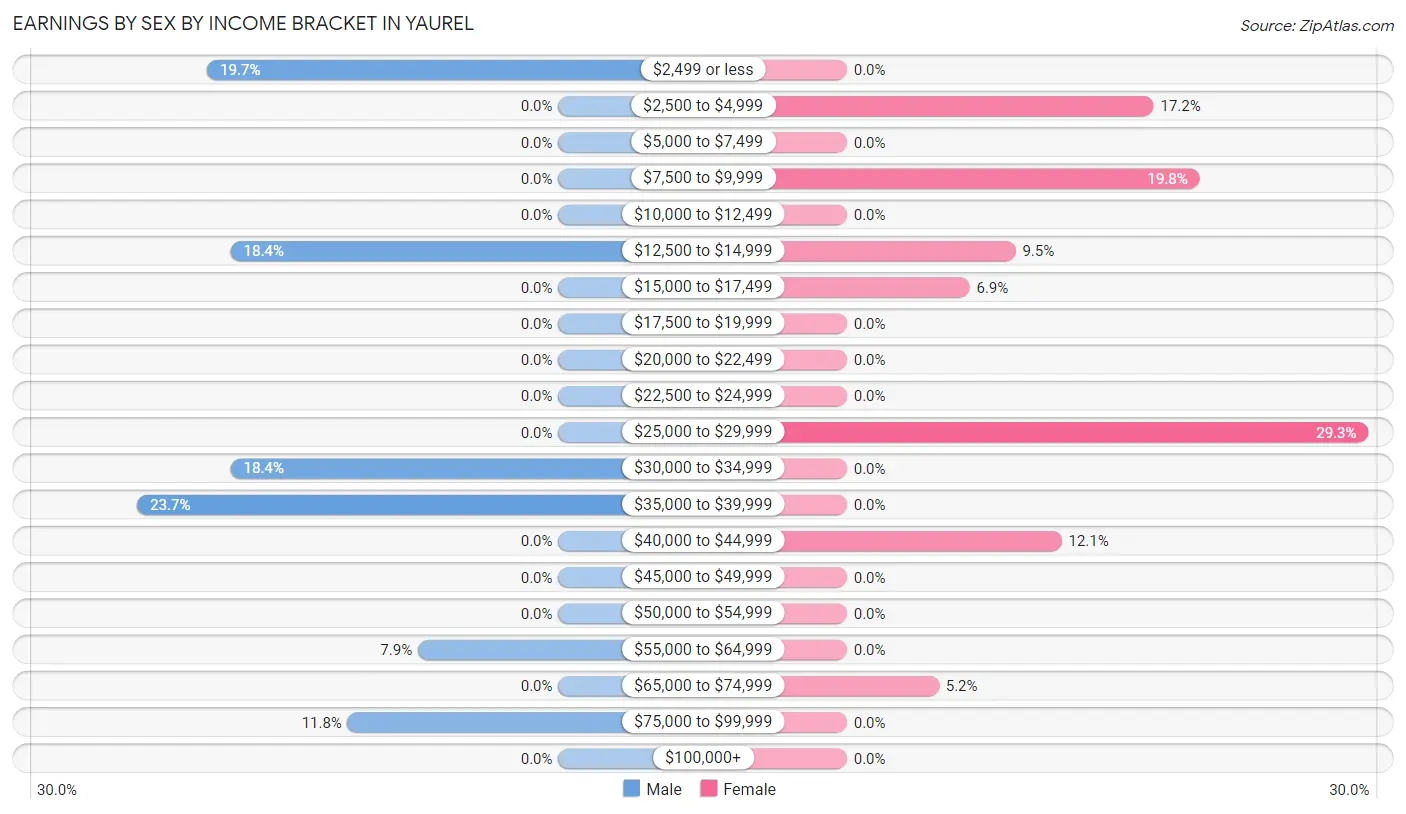
Earnings by Sex by Income Bracket in Yaurel
The most common earnings brackets in Yaurel are $35,000 to $39,999 for men (18 | 23.7%) and $25,000 to $29,999 for women (34 | 29.3%).
| Income | Male | Female |
| $2,499 or less | 15 (19.7%) | 0 (0.0%) |
| $2,500 to $4,999 | 0 (0.0%) | 20 (17.2%) |
| $5,000 to $7,499 | 0 (0.0%) | 0 (0.0%) |
| $7,500 to $9,999 | 0 (0.0%) | 23 (19.8%) |
| $10,000 to $12,499 | 0 (0.0%) | 0 (0.0%) |
| $12,500 to $14,999 | 14 (18.4%) | 11 (9.5%) |
| $15,000 to $17,499 | 0 (0.0%) | 8 (6.9%) |
| $17,500 to $19,999 | 0 (0.0%) | 0 (0.0%) |
| $20,000 to $22,499 | 0 (0.0%) | 0 (0.0%) |
| $22,500 to $24,999 | 0 (0.0%) | 0 (0.0%) |
| $25,000 to $29,999 | 0 (0.0%) | 34 (29.3%) |
| $30,000 to $34,999 | 14 (18.4%) | 0 (0.0%) |
| $35,000 to $39,999 | 18 (23.7%) | 0 (0.0%) |
| $40,000 to $44,999 | 0 (0.0%) | 14 (12.1%) |
| $45,000 to $49,999 | 0 (0.0%) | 0 (0.0%) |
| $50,000 to $54,999 | 0 (0.0%) | 0 (0.0%) |
| $55,000 to $64,999 | 6 (7.9%) | 0 (0.0%) |
| $65,000 to $74,999 | 0 (0.0%) | 6 (5.2%) |
| $75,000 to $99,999 | 9 (11.8%) | 0 (0.0%) |
| $100,000+ | 0 (0.0%) | 0 (0.0%) |
| Total | 76 (100.0%) | 116 (100.0%) |
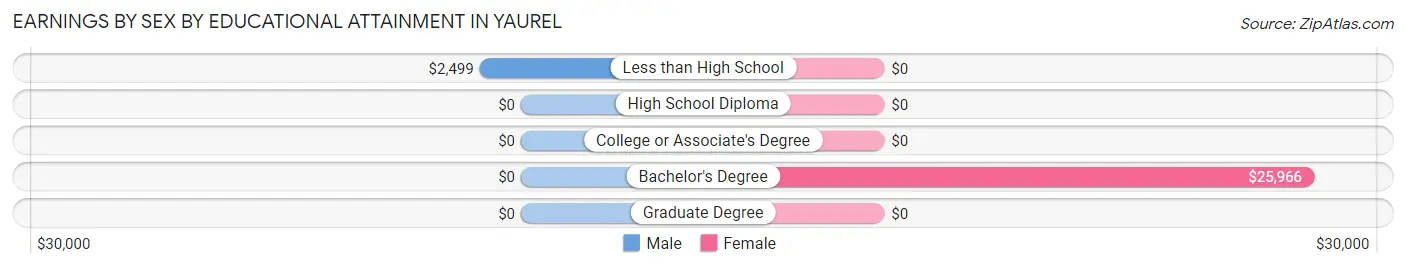
Earnings by Sex by Educational Attainment in Yaurel
| Educational Attainment | Male Income | Female Income |
| Less than High School | $2,499 | $0 |
| High School Diploma | - | - |
| College or Associate's Degree | - | - |
| Bachelor's Degree | - | - |
| Graduate Degree | - | - |
| Total | $31,607 | $0 |
Family Income in Yaurel
Family Income Brackets in Yaurel
According to the Yaurel family income data, there are 51 families falling into the less than $10,000 income range, which is the most common income bracket and makes up 32.7% of all families.
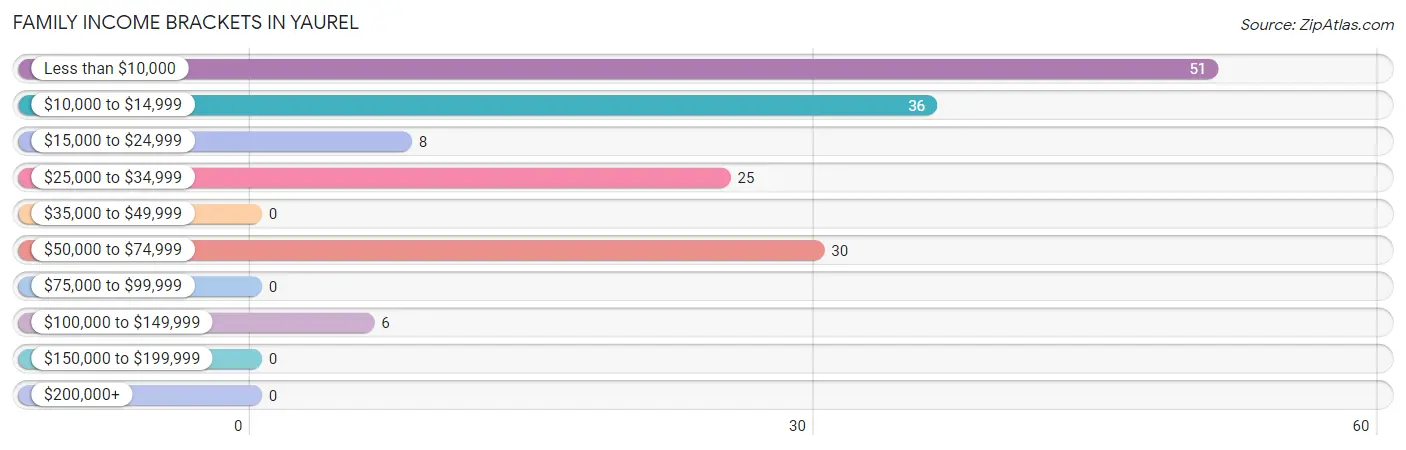
| Income Bracket | # Families | % Families |
| Less than $10,000 | 51 | 32.7% |
| $10,000 to $14,999 | 36 | 23.1% |
| $15,000 to $24,999 | 8 | 5.1% |
| $25,000 to $34,999 | 25 | 16.0% |
| $35,000 to $49,999 | 0 | 0.0% |
| $50,000 to $74,999 | 30 | 19.2% |
| $75,000 to $99,999 | 0 | 0.0% |
| $100,000 to $149,999 | 6 | 3.8% |
| $150,000 to $199,999 | 0 | 0.0% |
| $200,000+ | 0 | 0.0% |
Family Income by Famaliy Size in Yaurel
2-person families (82 | 52.6%) account for the highest median family income in Yaurel with $13,542 per family, while 2-person families (82 | 52.6%) have the highest median income of $6,771 per family member.
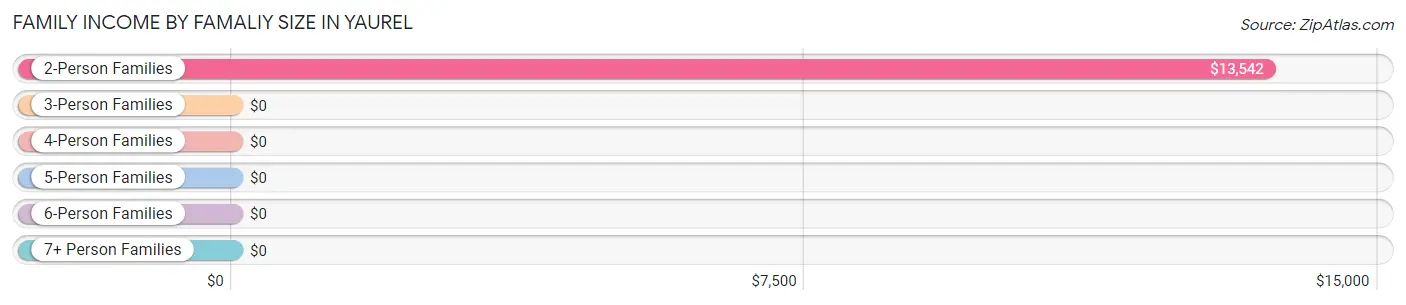
| Income Bracket | # Families | Median Income |
| 2-Person Families | 82 (52.6%) | $13,542 |
| 3-Person Families | 57 (36.5%) | $0 |
| 4-Person Families | 17 (10.9%) | $0 |
| 5-Person Families | 0 (0.0%) | $0 |
| 6-Person Families | 0 (0.0%) | $0 |
| 7+ Person Families | 0 (0.0%) | $0 |
| Total | 156 (100.0%) | $14,375 |
Family Income by Number of Earners in Yaurel
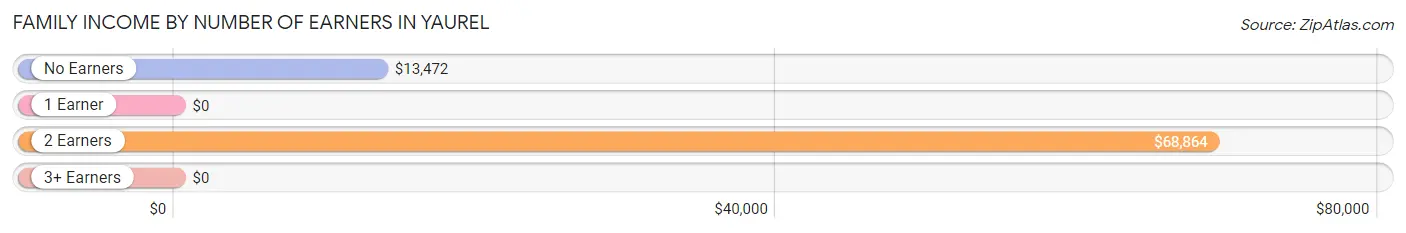
| Number of Earners | # Families | Median Income |
| No Earners | 72 (46.2%) | $13,472 |
| 1 Earner | 62 (39.7%) | $0 |
| 2 Earners | 22 (14.1%) | $68,864 |
| 3+ Earners | 0 (0.0%) | $0 |
| Total | 156 (100.0%) | $14,375 |
Household Income in Yaurel
Household Income Brackets in Yaurel
With 107 households falling in the category, the less than $10,000 income range is the most frequent in Yaurel, accounting for 36.4% of all households.
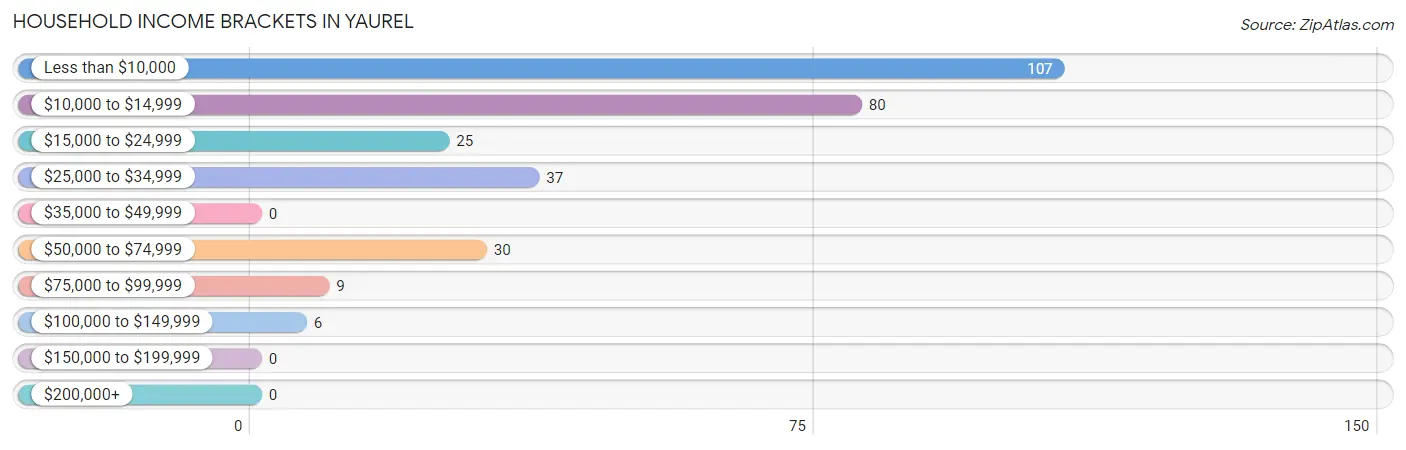
| Income Bracket | # Households | % Households |
| Less than $10,000 | 107 | 36.4% |
| $10,000 to $14,999 | 80 | 27.2% |
| $15,000 to $24,999 | 25 | 8.5% |
| $25,000 to $34,999 | 37 | 12.6% |
| $35,000 to $49,999 | 0 | 0.0% |
| $50,000 to $74,999 | 30 | 10.2% |
| $75,000 to $99,999 | 9 | 3.1% |
| $100,000 to $149,999 | 6 | 2.0% |
| $150,000 to $199,999 | 0 | 0.0% |
| $200,000+ | 0 | 0.0% |
Household Income by Householder Age in Yaurel
The median household income in Yaurel is $13,000, with the highest median household income of $12,857 found in the 45 to 64 years age bracket for the primary householder. A total of 118 households (40.1%) fall into this category. Meanwhile, the 15 to 24 years age bracket for the primary householder has the lowest median household income of $0, with 12 households (4.1%) in this group.
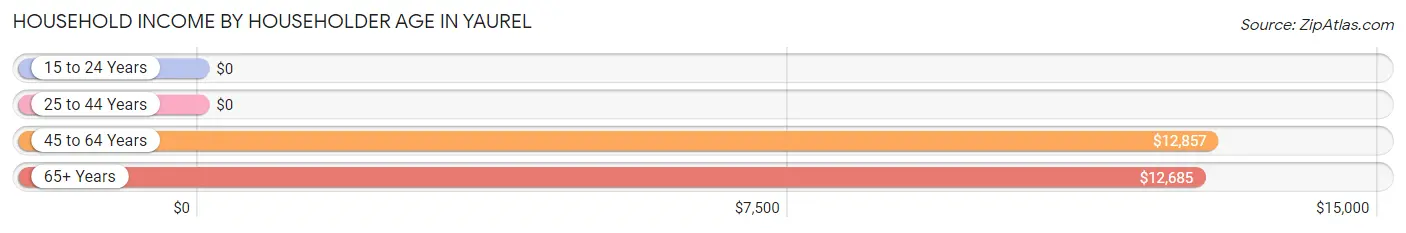
| Income Bracket | # Households | Median Income |
| 15 to 24 Years | 12 (4.1%) | $0 |
| 25 to 44 Years | 48 (16.3%) | $0 |
| 45 to 64 Years | 118 (40.1%) | $12,857 |
| 65+ Years | 116 (39.5%) | $12,685 |
| Total | 294 (100.0%) | $13,000 |
Poverty in Yaurel
Income Below Poverty by Sex and Age in Yaurel
With 57.6% poverty level for males and 57.3% for females among the residents of Yaurel, under 5 year old males and 16 and 17 year old females are the most vulnerable to poverty, with 16 males (100.0%) and 34 females (100.0%) in their respective age groups living below the poverty level.
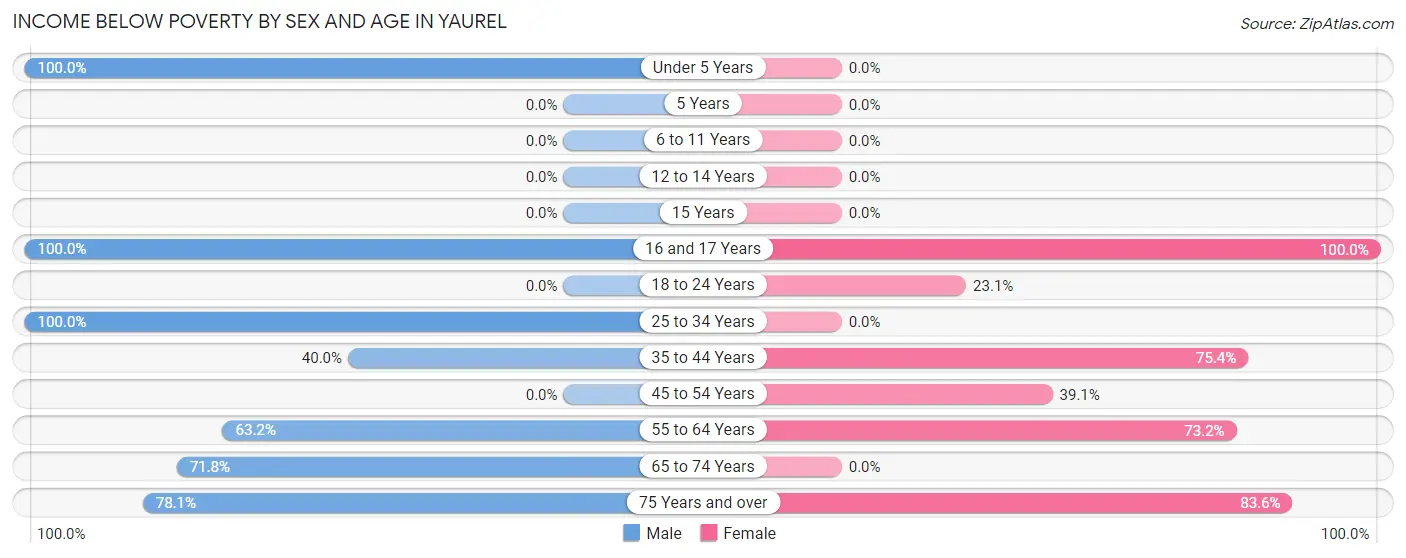
| Age Bracket | Male | Female |
| Under 5 Years | 16 (100.0%) | 0 (0.0%) |
| 5 Years | 0 (0.0%) | 0 (0.0%) |
| 6 to 11 Years | 0 (0.0%) | 0 (0.0%) |
| 12 to 14 Years | 0 (0.0%) | 0 (0.0%) |
| 15 Years | 0 (0.0%) | 0 (0.0%) |
| 16 and 17 Years | 9 (100.0%) | 34 (100.0%) |
| 18 to 24 Years | 0 (0.0%) | 6 (23.1%) |
| 25 to 34 Years | 7 (100.0%) | 0 (0.0%) |
| 35 to 44 Years | 10 (40.0%) | 46 (75.4%) |
| 45 to 54 Years | 0 (0.0%) | 9 (39.1%) |
| 55 to 64 Years | 43 (63.2%) | 52 (73.2%) |
| 65 to 74 Years | 61 (71.8%) | 0 (0.0%) |
| 75 Years and over | 32 (78.0%) | 46 (83.6%) |
| Total | 178 (57.6%) | 193 (57.3%) |
Income Above Poverty by Sex and Age in Yaurel
According to the poverty statistics in Yaurel, males aged 18 to 24 years and females aged 12 to 14 years are the age groups that are most secure financially, with 100.0% of males and 100.0% of females in these age groups living above the poverty line.
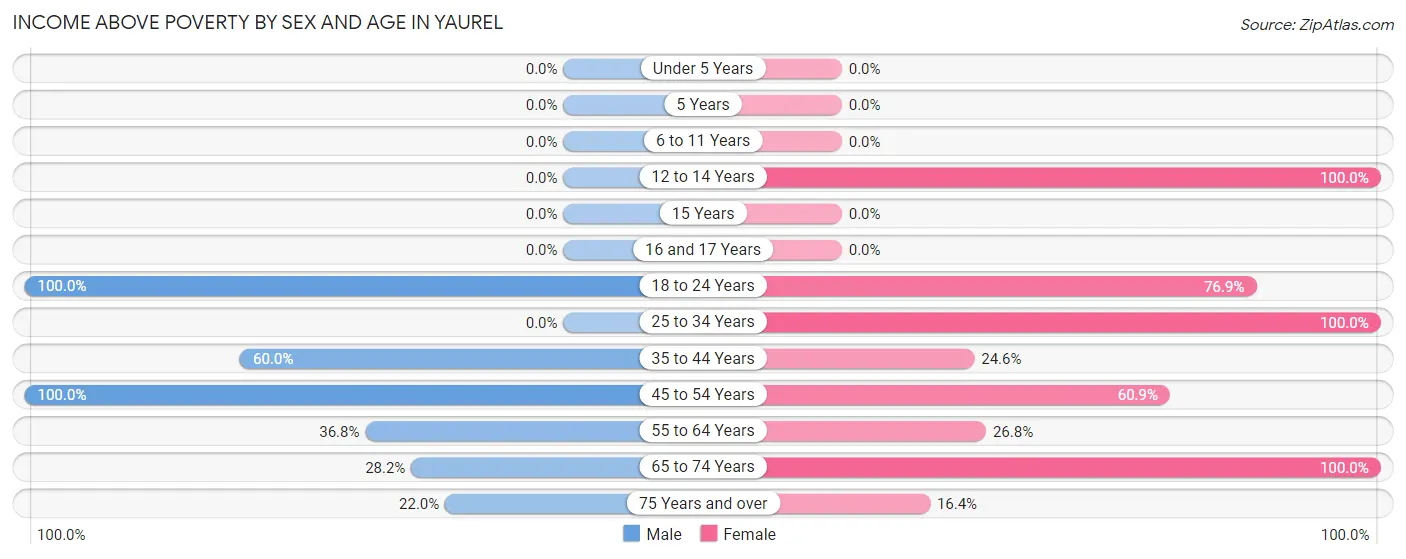
| Age Bracket | Male | Female |
| Under 5 Years | 0 (0.0%) | 0 (0.0%) |
| 5 Years | 0 (0.0%) | 0 (0.0%) |
| 6 to 11 Years | 0 (0.0%) | 0 (0.0%) |
| 12 to 14 Years | 0 (0.0%) | 6 (100.0%) |
| 15 Years | 0 (0.0%) | 0 (0.0%) |
| 16 and 17 Years | 0 (0.0%) | 0 (0.0%) |
| 18 to 24 Years | 18 (100.0%) | 20 (76.9%) |
| 25 to 34 Years | 0 (0.0%) | 33 (100.0%) |
| 35 to 44 Years | 15 (60.0%) | 15 (24.6%) |
| 45 to 54 Years | 40 (100.0%) | 14 (60.9%) |
| 55 to 64 Years | 25 (36.8%) | 19 (26.8%) |
| 65 to 74 Years | 24 (28.2%) | 28 (100.0%) |
| 75 Years and over | 9 (22.0%) | 9 (16.4%) |
| Total | 131 (42.4%) | 144 (42.7%) |
Income Below Poverty Among Married-Couple Families in Yaurel
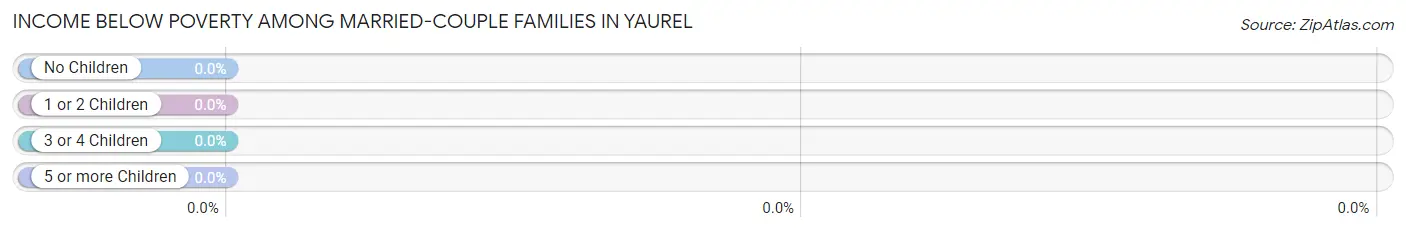
| Children | Above Poverty | Below Poverty |
| No Children | 55 (100.0%) | 0 (0.0%) |
| 1 or 2 Children | 0 (0.0%) | 0 (0.0%) |
| 3 or 4 Children | 0 (0.0%) | 0 (0.0%) |
| 5 or more Children | 0 (0.0%) | 0 (0.0%) |
| Total | 55 (100.0%) | 0 (0.0%) |
Income Below Poverty Among Single-Parent Households in Yaurel
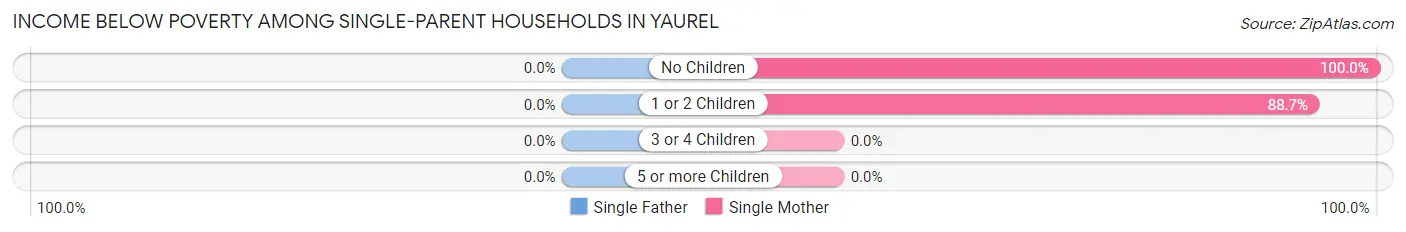
| Children | Single Father | Single Mother |
| No Children | 0 (0.0%) | 40 (100.0%) |
| 1 or 2 Children | 0 (0.0%) | 47 (88.7%) |
| 3 or 4 Children | 0 (0.0%) | 0 (0.0%) |
| 5 or more Children | 0 (0.0%) | 0 (0.0%) |
| Total | 0 (0.0%) | 87 (93.5%) |
Income Below Poverty Among Married-Couple vs Single-Parent Households in Yaurel
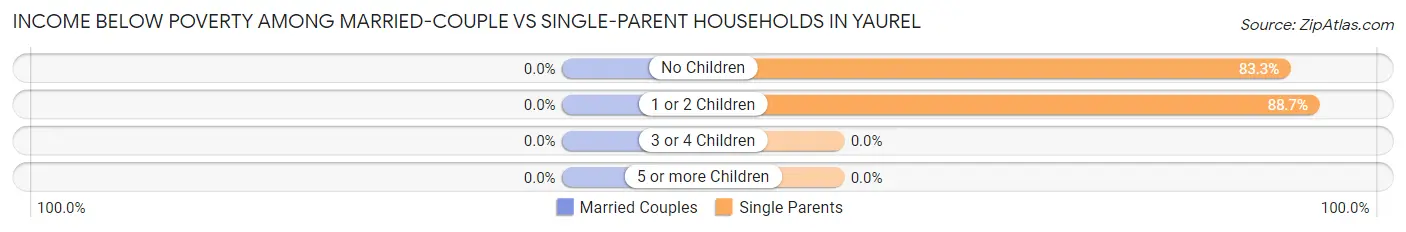
| Children | Married-Couple Families | Single-Parent Households |
| No Children | 0 (0.0%) | 40 (83.3%) |
| 1 or 2 Children | 0 (0.0%) | 47 (88.7%) |
| 3 or 4 Children | 0 (0.0%) | 0 (0.0%) |
| 5 or more Children | 0 (0.0%) | 0 (0.0%) |
| Total | 0 (0.0%) | 87 (86.1%) |
Race in Yaurel
The most populous races in Yaurel are Hispanic or Latino (632 | 97.8%), Black / African American (349 | 54.0%), and White / Caucasian (161 | 24.9%).
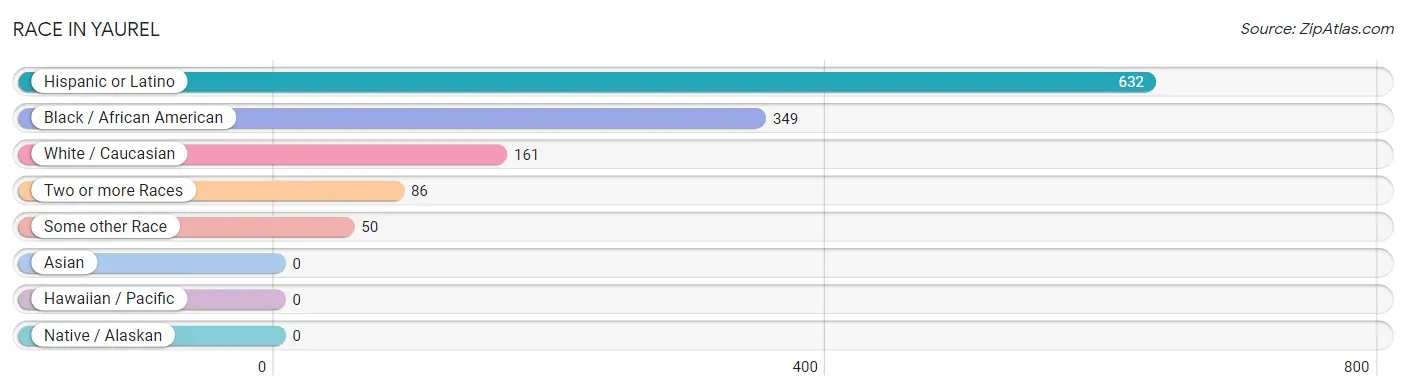
| Race | # Population | % Population |
| Asian | 0 | 0.0% |
| Black / African American | 349 | 54.0% |
| Hawaiian / Pacific | 0 | 0.0% |
| Hispanic or Latino | 632 | 97.8% |
| Native / Alaskan | 0 | 0.0% |
| White / Caucasian | 161 | 24.9% |
| Two or more Races | 86 | 13.3% |
| Some other Race | 50 | 7.7% |
| Total | 646 | 100.0% |
Ancestry in Yaurel
The most populous ancestries reported in Yaurel are , and Puerto Rican (632 | 97.8%), together accounting for 97.8% of all Yaurel residents.

| Ancestry | # Population | % Population |
| Puerto Rican | 632 | 97.8% | View All 1 Rows |
Immigrants in Yaurel

| Immigration Origin | # Population | % Population | View All 0 Rows |
Sex and Age in Yaurel
Sex and Age in Yaurel
The most populous age groups in Yaurel are 65 to 69 Years (70 | 22.7%) for men and 55 to 59 Years (53 | 15.7%) for women.
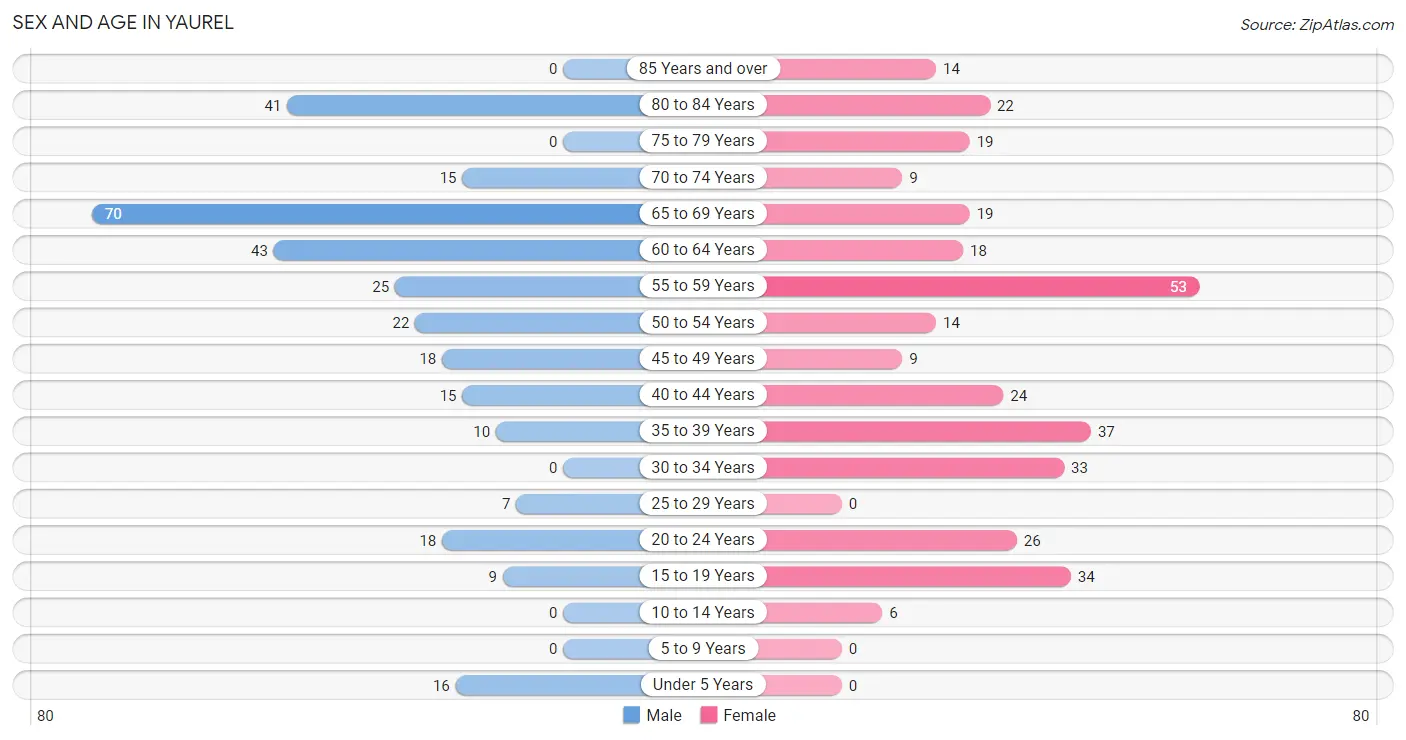
| Age Bracket | Male | Female |
| Under 5 Years | 16 (5.2%) | 0 (0.0%) |
| 5 to 9 Years | 0 (0.0%) | 0 (0.0%) |
| 10 to 14 Years | 0 (0.0%) | 6 (1.8%) |
| 15 to 19 Years | 9 (2.9%) | 34 (10.1%) |
| 20 to 24 Years | 18 (5.8%) | 26 (7.7%) |
| 25 to 29 Years | 7 (2.3%) | 0 (0.0%) |
| 30 to 34 Years | 0 (0.0%) | 33 (9.8%) |
| 35 to 39 Years | 10 (3.2%) | 37 (11.0%) |
| 40 to 44 Years | 15 (4.9%) | 24 (7.1%) |
| 45 to 49 Years | 18 (5.8%) | 9 (2.7%) |
| 50 to 54 Years | 22 (7.1%) | 14 (4.2%) |
| 55 to 59 Years | 25 (8.1%) | 53 (15.7%) |
| 60 to 64 Years | 43 (13.9%) | 18 (5.3%) |
| 65 to 69 Years | 70 (22.7%) | 19 (5.6%) |
| 70 to 74 Years | 15 (4.9%) | 9 (2.7%) |
| 75 to 79 Years | 0 (0.0%) | 19 (5.6%) |
| 80 to 84 Years | 41 (13.3%) | 22 (6.5%) |
| 85 Years and over | 0 (0.0%) | 14 (4.2%) |
| Total | 309 (100.0%) | 337 (100.0%) |
Families and Households in Yaurel
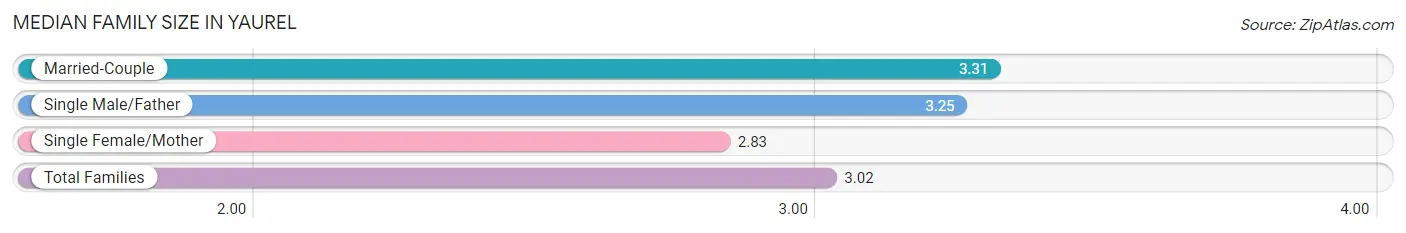
Median Family Size in Yaurel
The median family size in Yaurel is 3.02 persons per family, with married-couple families (55 | 35.3%) accounting for the largest median family size of 3.31 persons per family. On the other hand, single female/mother families (93 | 59.6%) represent the smallest median family size with 2.83 persons per family.
| Family Type | # Families | Family Size |
| Married-Couple | 55 (35.3%) | 3.31 |
| Single Male/Father | 8 (5.1%) | 3.25 |
| Single Female/Mother | 93 (59.6%) | 2.83 |
| Total Families | 156 (100.0%) | 3.02 |
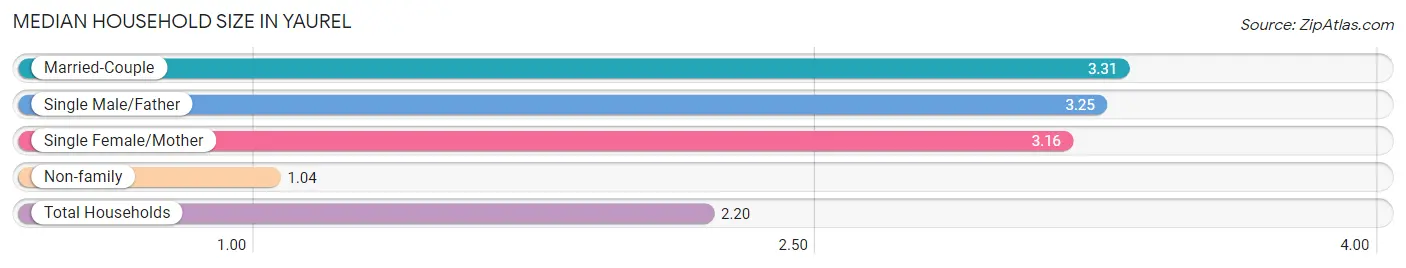
Median Household Size in Yaurel
The median household size in Yaurel is 2.20 persons per household, with married-couple households (55 | 18.7%) accounting for the largest median household size of 3.31 persons per household. non-family households (138 | 46.9%) represent the smallest median household size with 1.04 persons per household.
| Household Type | # Households | Household Size |
| Married-Couple | 55 (18.7%) | 3.31 |
| Single Male/Father | 8 (2.7%) | 3.25 |
| Single Female/Mother | 93 (31.6%) | 3.16 |
| Non-family | 138 (46.9%) | 1.04 |
| Total Households | 294 (100.0%) | 2.20 |
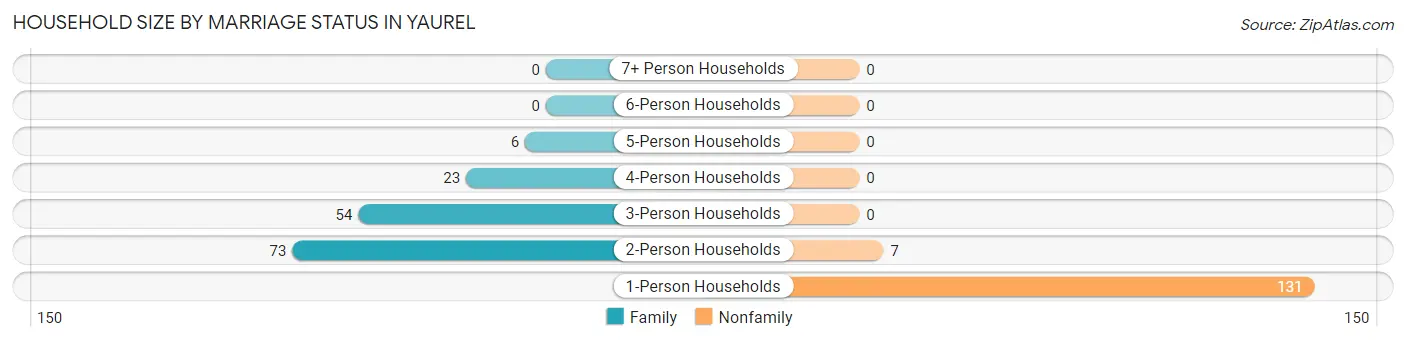
Household Size by Marriage Status in Yaurel
Out of a total of 294 households in Yaurel, 156 (53.1%) are family households, while 138 (46.9%) are nonfamily households. The most numerous type of family households are 2-person households, comprising 73, and the most common type of nonfamily households are 1-person households, comprising 131.
| Household Size | Family Households | Nonfamily Households |
| 1-Person Households | - | 131 (44.6%) |
| 2-Person Households | 73 (24.8%) | 7 (2.4%) |
| 3-Person Households | 54 (18.4%) | 0 (0.0%) |
| 4-Person Households | 23 (7.8%) | 0 (0.0%) |
| 5-Person Households | 6 (2.0%) | 0 (0.0%) |
| 6-Person Households | 0 (0.0%) | 0 (0.0%) |
| 7+ Person Households | 0 (0.0%) | 0 (0.0%) |
| Total | 156 (53.1%) | 138 (46.9%) |
Female Fertility in Yaurel
Fertility by Age in Yaurel
| Age Bracket | Women with Births | Births / 1,000 Women |
| 15 to 19 years | 0 (0.0%) | 0.0 |
| 20 to 34 years | 0 (0.0%) | 0.0 |
| 35 to 50 years | 0 (0.0%) | 0.0 |
| Total | 0 (0.0%) | 0.0 |
Fertility by Age by Marriage Status in Yaurel
| Age Bracket | Married | Unmarried |
| 15 to 19 years | 0 (0.0%) | 0 (0.0%) |
| 20 to 34 years | 0 (0.0%) | 0 (0.0%) |
| 35 to 50 years | 0 (0.0%) | 0 (0.0%) |
| Total | 0 (0.0%) | 0 (0.0%) |
Fertility by Education in Yaurel
| Educational Attainment | Women with Births | Births / 1,000 Women |
| Less than High School | 0 (0.0%) | 0.0 |
| High School Diploma | 0 (0.0%) | 0.0 |
| College or Associate's Degree | 0 (0.0%) | 0.0 |
| Bachelor's Degree | 0 (0.0%) | 0.0 |
| Graduate Degree | 0 (0.0%) | 0.0 |
| Total | 0 (0.0%) | 0.0 |
Fertility by Education by Marriage Status in Yaurel
| Educational Attainment | Married | Unmarried |
| Less than High School | 0 (0.0%) | 0 (0.0%) |
| High School Diploma | 0 (0.0%) | 0 (0.0%) |
| College or Associate's Degree | 0 (0.0%) | 0 (0.0%) |
| Bachelor's Degree | 0 (0.0%) | 0 (0.0%) |
| Graduate Degree | 0 (0.0%) | 0 (0.0%) |
| Total | 0 (0.0%) | 0 (0.0%) |
Employment Characteristics in Yaurel
Employment by Class of Employer in Yaurel
Among the 166 employed individuals in Yaurel, private company employees (117 | 70.5%), self-employed (not incorporated) (30 | 18.1%), and local government employees (19 | 11.5%) make up the most common classes of employment.
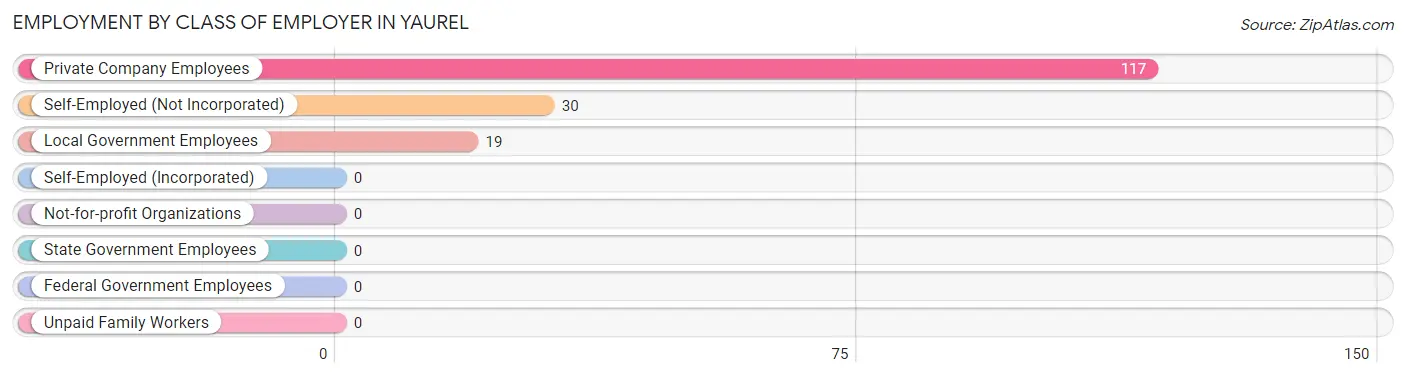
| Employer Class | # Employees | % Employees |
| Private Company Employees | 117 | 70.5% |
| Self-Employed (Incorporated) | 0 | 0.0% |
| Self-Employed (Not Incorporated) | 30 | 18.1% |
| Not-for-profit Organizations | 0 | 0.0% |
| Local Government Employees | 19 | 11.5% |
| State Government Employees | 0 | 0.0% |
| Federal Government Employees | 0 | 0.0% |
| Unpaid Family Workers | 0 | 0.0% |
| Total | 166 | 100.0% |
Employment Status by Age in Yaurel
According to the labor force statistics for Yaurel, out of the total population over 16 years of age (624), 29.5% or 184 individuals are in the labor force, with 9.8% or 18 of them unemployed. The age group with the highest labor force participation rate is 30 to 34 years, with 100.0% or 33 individuals in the labor force. Within the labor force, the 45 to 54 years age range has the highest percentage of unemployed individuals, with 39.1% or 18 of them being unemployed.
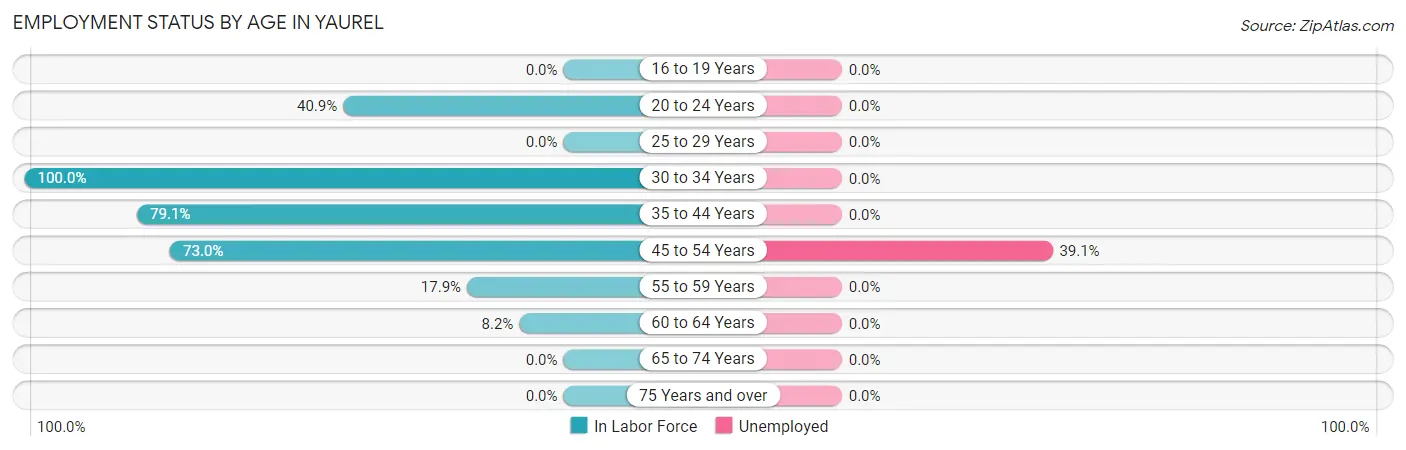
| Age Bracket | In Labor Force | Unemployed |
| 16 to 19 Years | 0 (0.0%) | 0 (0.0%) |
| 20 to 24 Years | 18 (40.9%) | 0 (0.0%) |
| 25 to 29 Years | 0 (0.0%) | 0 (0.0%) |
| 30 to 34 Years | 33 (100.0%) | 0 (0.0%) |
| 35 to 44 Years | 68 (79.1%) | 0 (0.0%) |
| 45 to 54 Years | 46 (73.0%) | 18 (39.1%) |
| 55 to 59 Years | 14 (17.9%) | 0 (0.0%) |
| 60 to 64 Years | 5 (8.2%) | 0 (0.0%) |
| 65 to 74 Years | 0 (0.0%) | 0 (0.0%) |
| 75 Years and over | 0 (0.0%) | 0 (0.0%) |
| Total | 184 (29.5%) | 18 (9.8%) |
Employment Status by Educational Attainment in Yaurel
According to labor force statistics for Yaurel, 50.6% of individuals (166) out of the total population between 25 and 64 years of age (328) are in the labor force, with 10.8% or 18 of them being unemployed. The group with the highest labor force participation rate are those with the educational attainment of bachelor's degree or higher, with 70.1% or 54 individuals in the labor force. Within the labor force, individuals with high school diploma education have the highest percentage of unemployment, with 56.3% or 18 of them being unemployed.
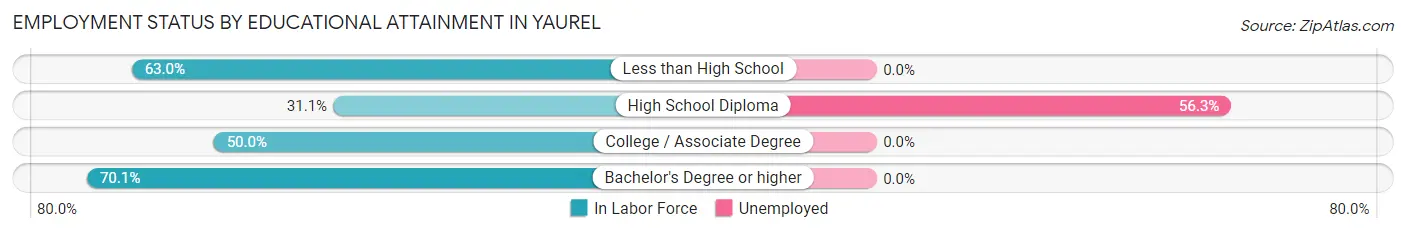
| Educational Attainment | In Labor Force | Unemployed |
| Less than High School | 29 (63.0%) | 0 (0.0%) |
| High School Diploma | 32 (31.1%) | 58 (56.3%) |
| College / Associate Degree | 51 (50.0%) | 0 (0.0%) |
| Bachelor's Degree or higher | 54 (70.1%) | 0 (0.0%) |
| Total | 166 (50.6%) | 35 (10.8%) |
Employment Occupations by Sex in Yaurel
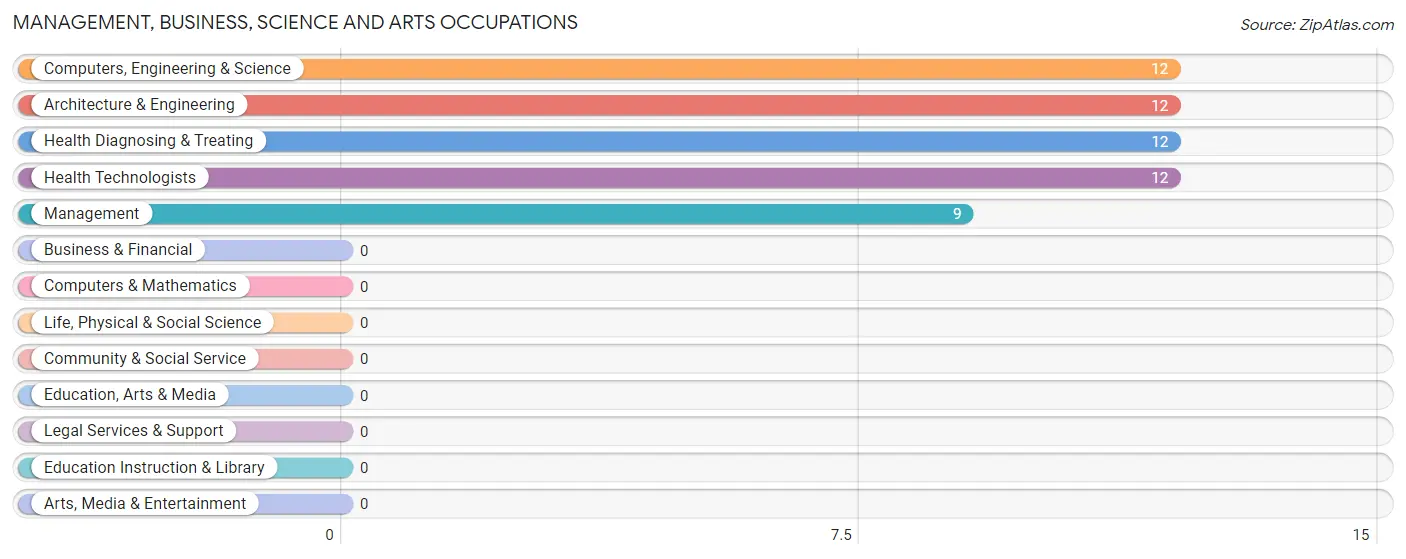
Management, Business, Science and Arts Occupations
The most common Management, Business, Science and Arts occupations in Yaurel are Computers, Engineering & Science (12 | 7.2%), Architecture & Engineering (12 | 7.2%), Health Diagnosing & Treating (12 | 7.2%), Health Technologists (12 | 7.2%), and Management (9 | 5.4%).
Management, Business, Science and Arts Occupations by Sex
Within the Management, Business, Science and Arts occupations in Yaurel, the most male-oriented occupations are Management (100.0%), Computers, Engineering & Science (50.0%), and Architecture & Engineering (50.0%), while the most female-oriented occupations are Health Diagnosing & Treating (100.0%), Health Technologists (100.0%), and Computers, Engineering & Science (50.0%).
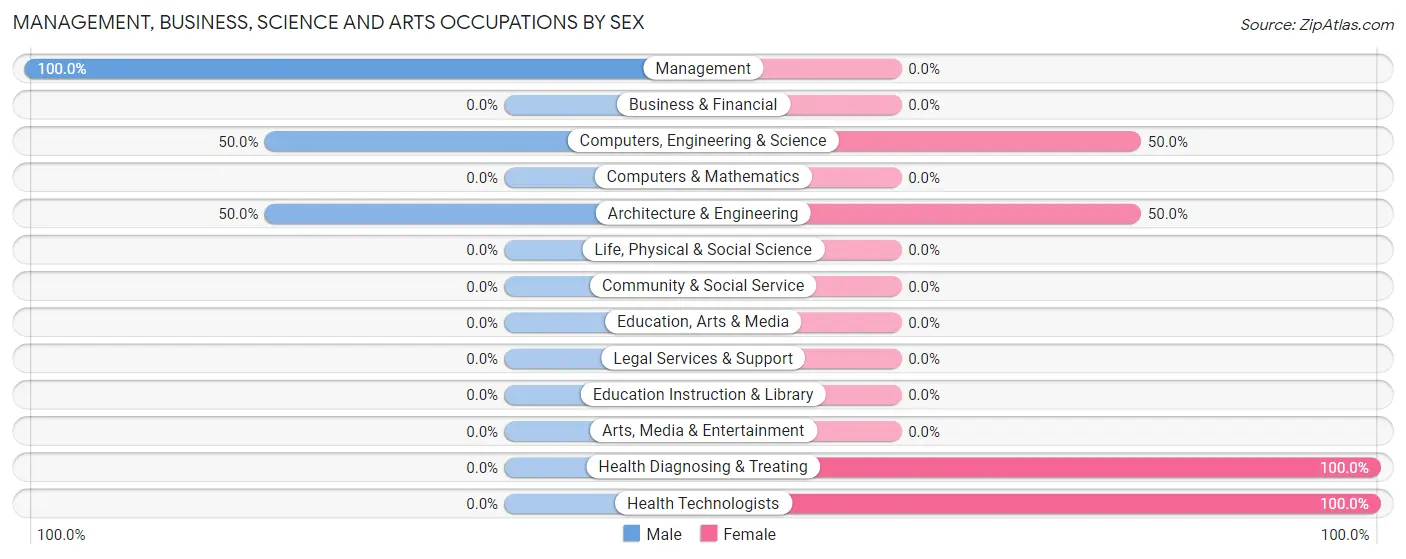
| Occupation | Male | Female |
| Management | 9 (100.0%) | 0 (0.0%) |
| Business & Financial | 0 (0.0%) | 0 (0.0%) |
| Computers, Engineering & Science | 6 (50.0%) | 6 (50.0%) |
| Computers & Mathematics | 0 (0.0%) | 0 (0.0%) |
| Architecture & Engineering | 6 (50.0%) | 6 (50.0%) |
| Life, Physical & Social Science | 0 (0.0%) | 0 (0.0%) |
| Community & Social Service | 0 (0.0%) | 0 (0.0%) |
| Education, Arts & Media | 0 (0.0%) | 0 (0.0%) |
| Legal Services & Support | 0 (0.0%) | 0 (0.0%) |
| Education Instruction & Library | 0 (0.0%) | 0 (0.0%) |
| Arts, Media & Entertainment | 0 (0.0%) | 0 (0.0%) |
| Health Diagnosing & Treating | 0 (0.0%) | 12 (100.0%) |
| Health Technologists | 0 (0.0%) | 12 (100.0%) |
| Total (Category) | 15 (45.5%) | 18 (54.5%) |
| Total (Overall) | 58 (34.9%) | 108 (65.1%) |
Services Occupations
The most common Services occupations in Yaurel are Healthcare Support (20 | 12.0%), Security & Protection (14 | 8.4%), Firefighting & Prevention (14 | 8.4%), and Cleaning & Maintenance (5 | 3.0%).
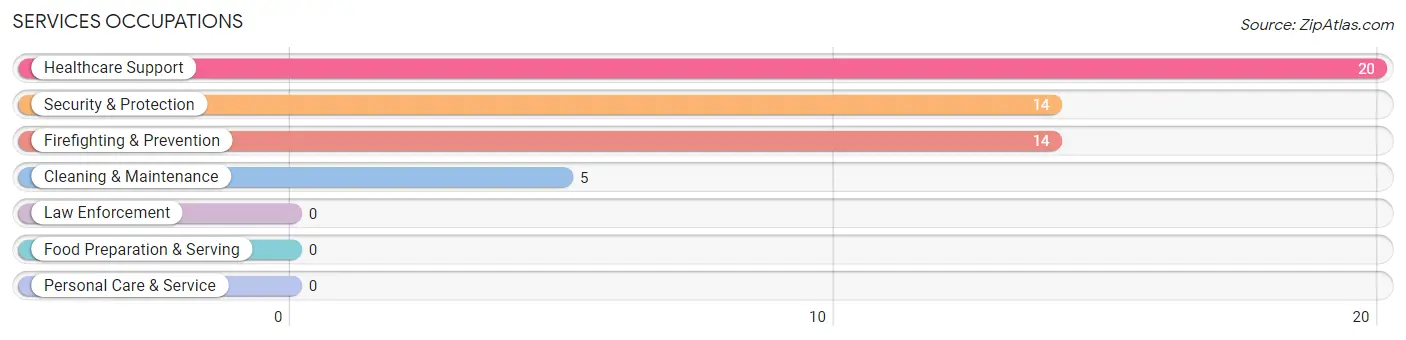
Services Occupations by Sex
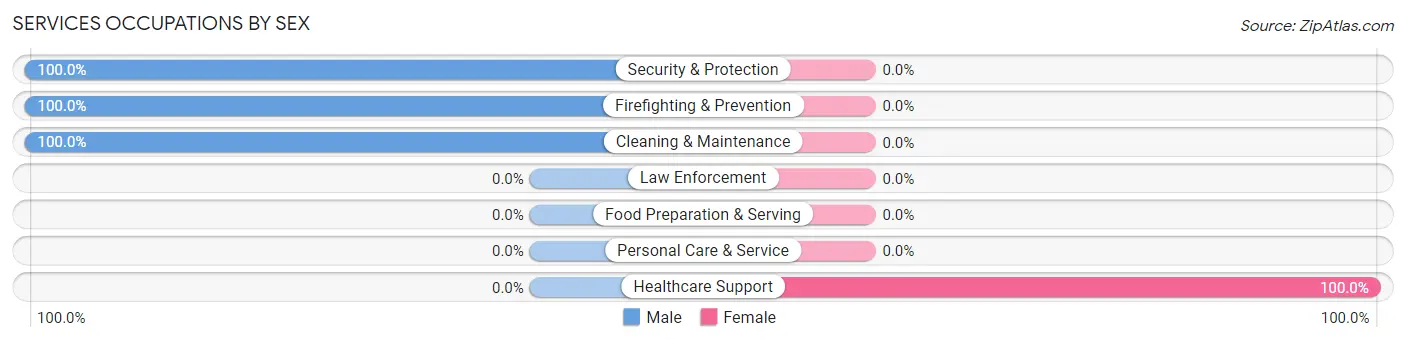
| Occupation | Male | Female |
| Healthcare Support | 0 (0.0%) | 20 (100.0%) |
| Security & Protection | 14 (100.0%) | 0 (0.0%) |
| Firefighting & Prevention | 14 (100.0%) | 0 (0.0%) |
| Law Enforcement | 0 (0.0%) | 0 (0.0%) |
| Food Preparation & Serving | 0 (0.0%) | 0 (0.0%) |
| Cleaning & Maintenance | 5 (100.0%) | 0 (0.0%) |
| Personal Care & Service | 0 (0.0%) | 0 (0.0%) |
| Total (Category) | 19 (48.7%) | 20 (51.3%) |
| Total (Overall) | 58 (34.9%) | 108 (65.1%) |
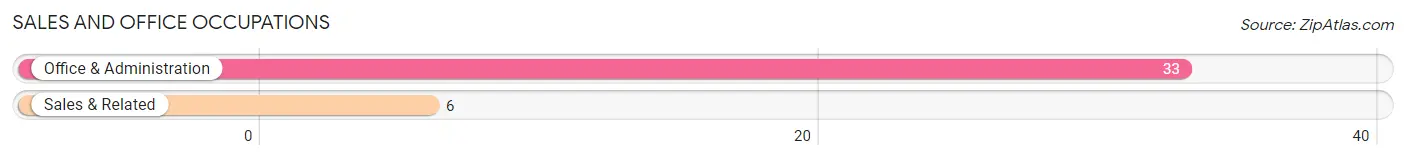
Sales and Office Occupations
The most common Sales and Office occupations in Yaurel are Office & Administration (33 | 19.9%), and Sales & Related (6 | 3.6%).
Sales and Office Occupations by Sex
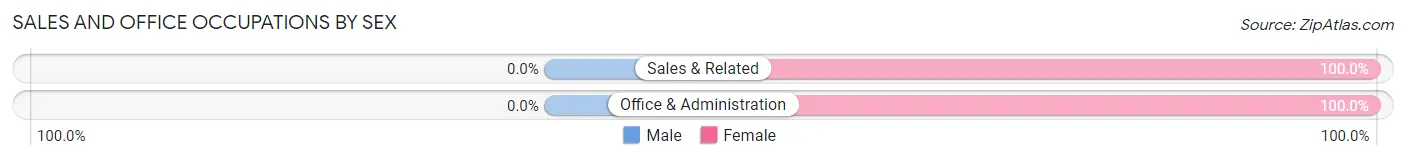
| Occupation | Male | Female |
| Sales & Related | 0 (0.0%) | 6 (100.0%) |
| Office & Administration | 0 (0.0%) | 33 (100.0%) |
| Total (Category) | 0 (0.0%) | 39 (100.0%) |
| Total (Overall) | 58 (34.9%) | 108 (65.1%) |
Natural Resources, Construction and Maintenance Occupations
The most common Natural Resources, Construction and Maintenance occupations in Yaurel are , and Construction & Extraction (10 | 6.0%).
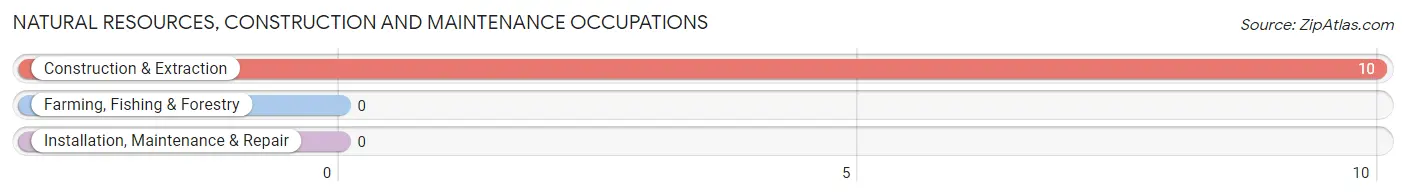
Natural Resources, Construction and Maintenance Occupations by Sex
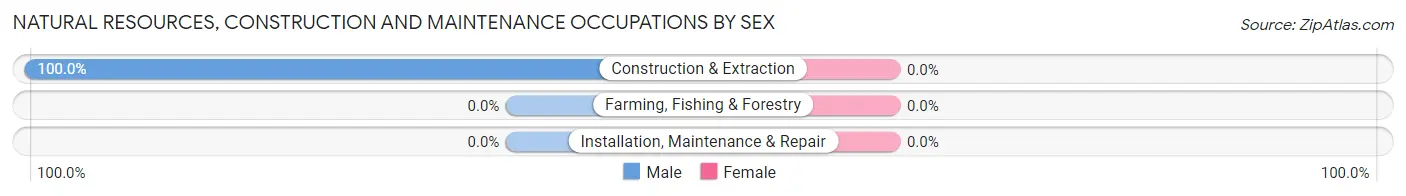
| Occupation | Male | Female |
| Farming, Fishing & Forestry | 0 (0.0%) | 0 (0.0%) |
| Construction & Extraction | 10 (100.0%) | 0 (0.0%) |
| Installation, Maintenance & Repair | 0 (0.0%) | 0 (0.0%) |
| Total (Category) | 10 (100.0%) | 0 (0.0%) |
| Total (Overall) | 58 (34.9%) | 108 (65.1%) |
Production, Transportation and Moving Occupations
The most common Production, Transportation and Moving occupations in Yaurel are Production (31 | 18.7%), and Material Moving (14 | 8.4%).
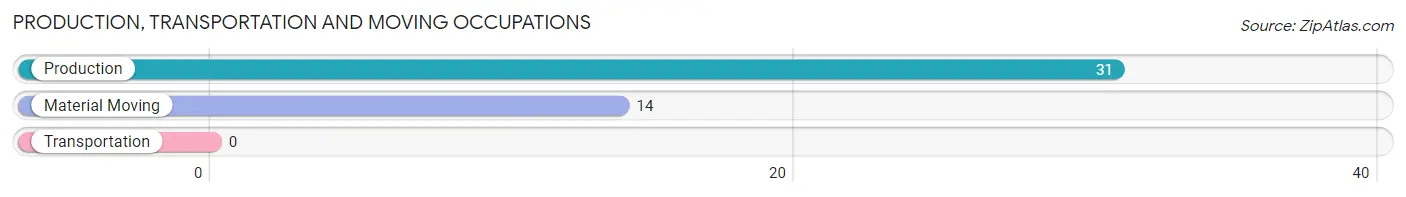
Production, Transportation and Moving Occupations by Sex
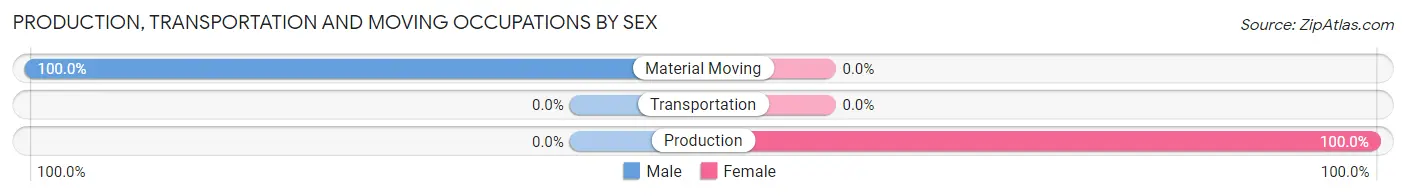
| Occupation | Male | Female |
| Production | 0 (0.0%) | 31 (100.0%) |
| Transportation | 0 (0.0%) | 0 (0.0%) |
| Material Moving | 14 (100.0%) | 0 (0.0%) |
| Total (Category) | 14 (31.1%) | 31 (68.9%) |
| Total (Overall) | 58 (34.9%) | 108 (65.1%) |
Employment Industries by Sex in Yaurel
Employment Industries in Yaurel
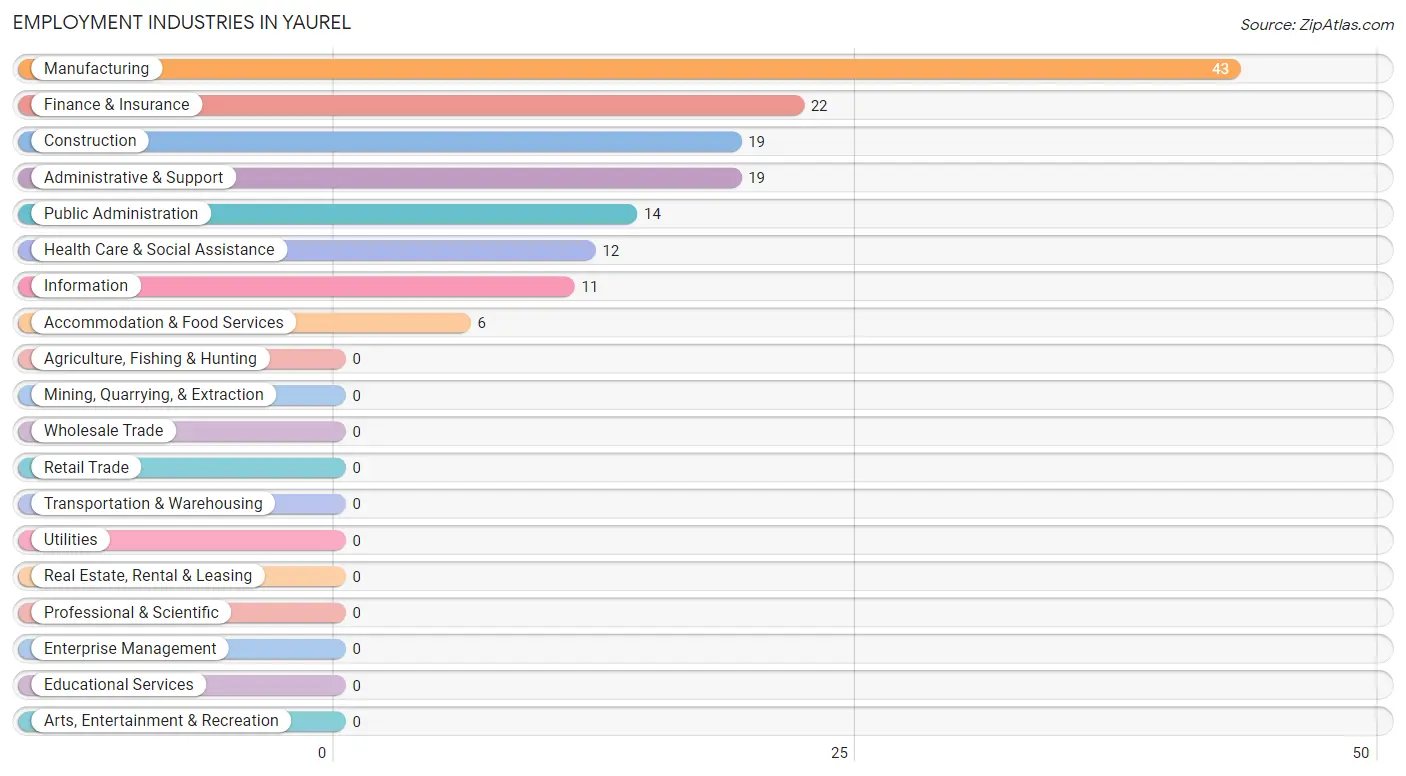
The major employment industries in Yaurel include Manufacturing (43 | 25.9%), Finance & Insurance (22 | 13.3%), Construction (19 | 11.5%), Administrative & Support (19 | 11.5%), and Public Administration (14 | 8.4%).
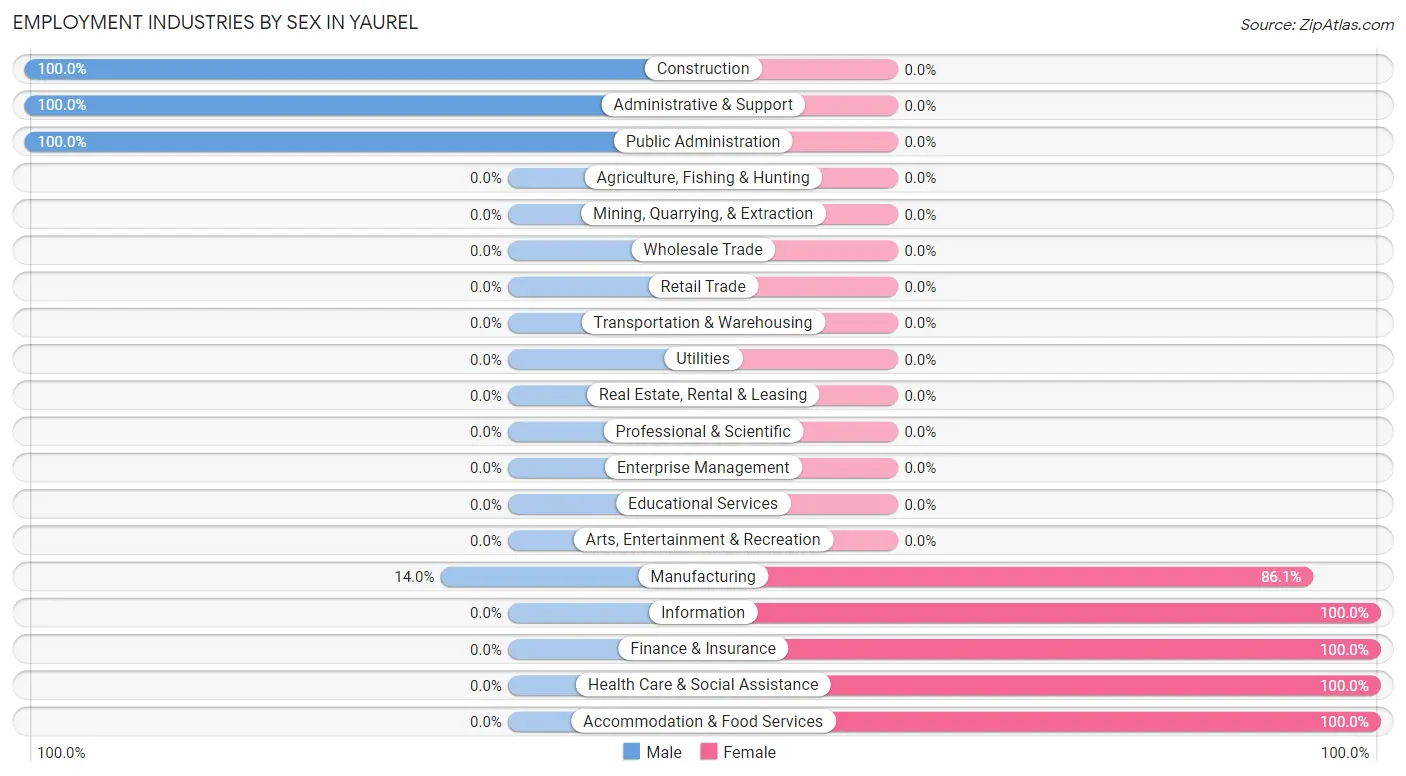
Employment Industries by Sex in Yaurel
The Yaurel industries that see more men than women are Construction (100.0%), Administrative & Support (100.0%), and Public Administration (100.0%), whereas the industries that tend to have a higher number of women are Information (100.0%), Finance & Insurance (100.0%), and Health Care & Social Assistance (100.0%).
| Industry | Male | Female |
| Agriculture, Fishing & Hunting | 0 (0.0%) | 0 (0.0%) |
| Mining, Quarrying, & Extraction | 0 (0.0%) | 0 (0.0%) |
| Construction | 19 (100.0%) | 0 (0.0%) |
| Manufacturing | 6 (14.0%) | 37 (86.1%) |
| Wholesale Trade | 0 (0.0%) | 0 (0.0%) |
| Retail Trade | 0 (0.0%) | 0 (0.0%) |
| Transportation & Warehousing | 0 (0.0%) | 0 (0.0%) |
| Utilities | 0 (0.0%) | 0 (0.0%) |
| Information | 0 (0.0%) | 11 (100.0%) |
| Finance & Insurance | 0 (0.0%) | 22 (100.0%) |
| Real Estate, Rental & Leasing | 0 (0.0%) | 0 (0.0%) |
| Professional & Scientific | 0 (0.0%) | 0 (0.0%) |
| Enterprise Management | 0 (0.0%) | 0 (0.0%) |
| Administrative & Support | 19 (100.0%) | 0 (0.0%) |
| Educational Services | 0 (0.0%) | 0 (0.0%) |
| Health Care & Social Assistance | 0 (0.0%) | 12 (100.0%) |
| Arts, Entertainment & Recreation | 0 (0.0%) | 0 (0.0%) |
| Accommodation & Food Services | 0 (0.0%) | 6 (100.0%) |
| Public Administration | 14 (100.0%) | 0 (0.0%) |
| Total | 58 (34.9%) | 108 (65.1%) |
Education in Yaurel
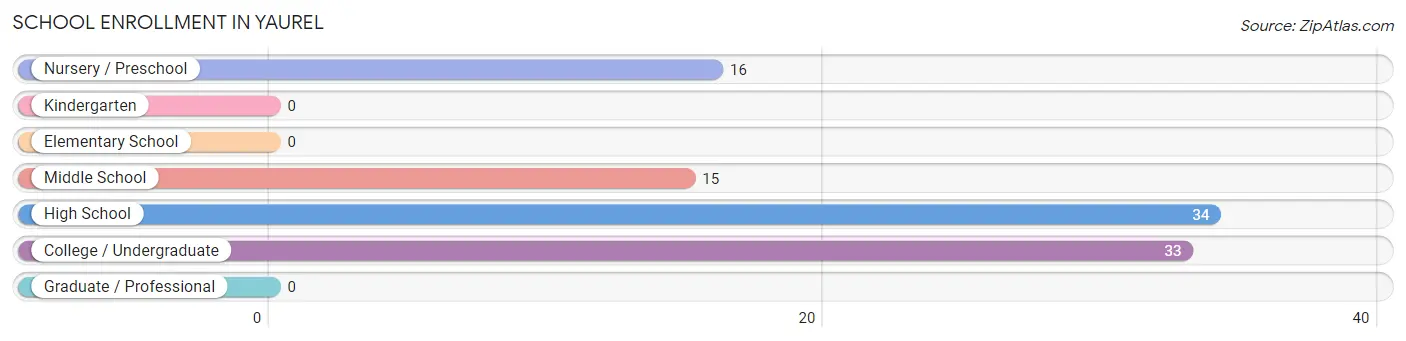
School Enrollment in Yaurel
The most common levels of schooling among the 98 students in Yaurel are high school (34 | 34.7%), college / undergraduate (33 | 33.7%), and nursery / preschool (16 | 16.3%).
| School Level | # Students | % Students |
| Nursery / Preschool | 16 | 16.3% |
| Kindergarten | 0 | 0.0% |
| Elementary School | 0 | 0.0% |
| Middle School | 15 | 15.3% |
| High School | 34 | 34.7% |
| College / Undergraduate | 33 | 33.7% |
| Graduate / Professional | 0 | 0.0% |
| Total | 98 | 100.0% |
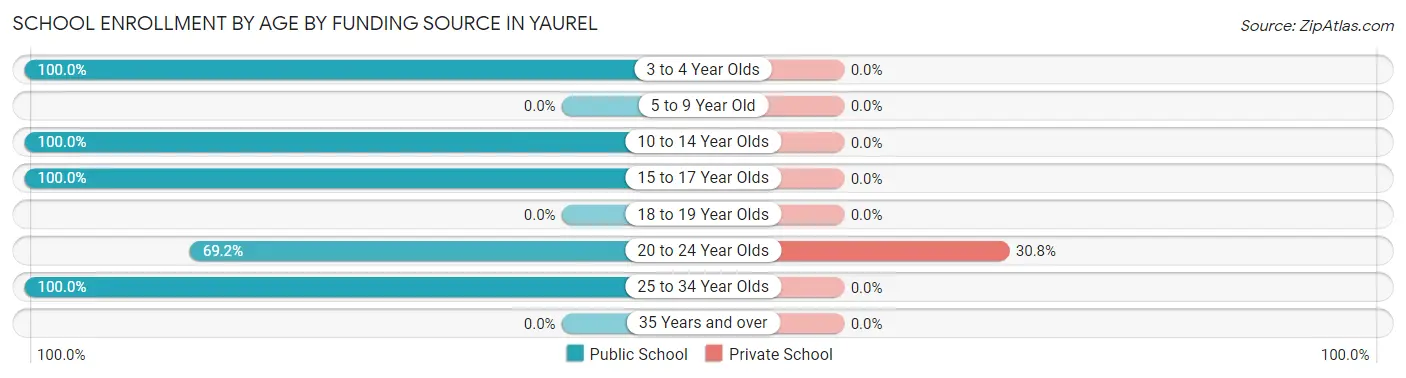
School Enrollment by Age by Funding Source in Yaurel
Out of a total of 98 students who are enrolled in schools in Yaurel, 8 (8.2%) attend a private institution, while the remaining 90 (91.8%) are enrolled in public schools. The age group of 20 to 24 year olds has the highest likelihood of being enrolled in private schools, with 8 (30.8% in the age bracket) enrolled. Conversely, the age group of 3 to 4 year olds has the lowest likelihood of being enrolled in a private school, with 16 (100.0% in the age bracket) attending a public institution.
| Age Bracket | Public School | Private School |
| 3 to 4 Year Olds | 16 (100.0%) | 0 (0.0%) |
| 5 to 9 Year Old | 0 (0.0%) | 0 (0.0%) |
| 10 to 14 Year Olds | 6 (100.0%) | 0 (0.0%) |
| 15 to 17 Year Olds | 43 (100.0%) | 0 (0.0%) |
| 18 to 19 Year Olds | 0 (0.0%) | 0 (0.0%) |
| 20 to 24 Year Olds | 18 (69.2%) | 8 (30.8%) |
| 25 to 34 Year Olds | 7 (100.0%) | 0 (0.0%) |
| 35 Years and over | 0 (0.0%) | 0 (0.0%) |
| Total | 90 (91.8%) | 8 (8.2%) |
Educational Attainment by Field of Study in Yaurel
Science & technology (41 | 34.7%), business (32 | 27.1%), engineering (21 | 17.8%), social sciences (18 | 15.2%), and education (6 | 5.1%) are the most common fields of study among 118 individuals in Yaurel who have obtained a bachelor's degree or higher.
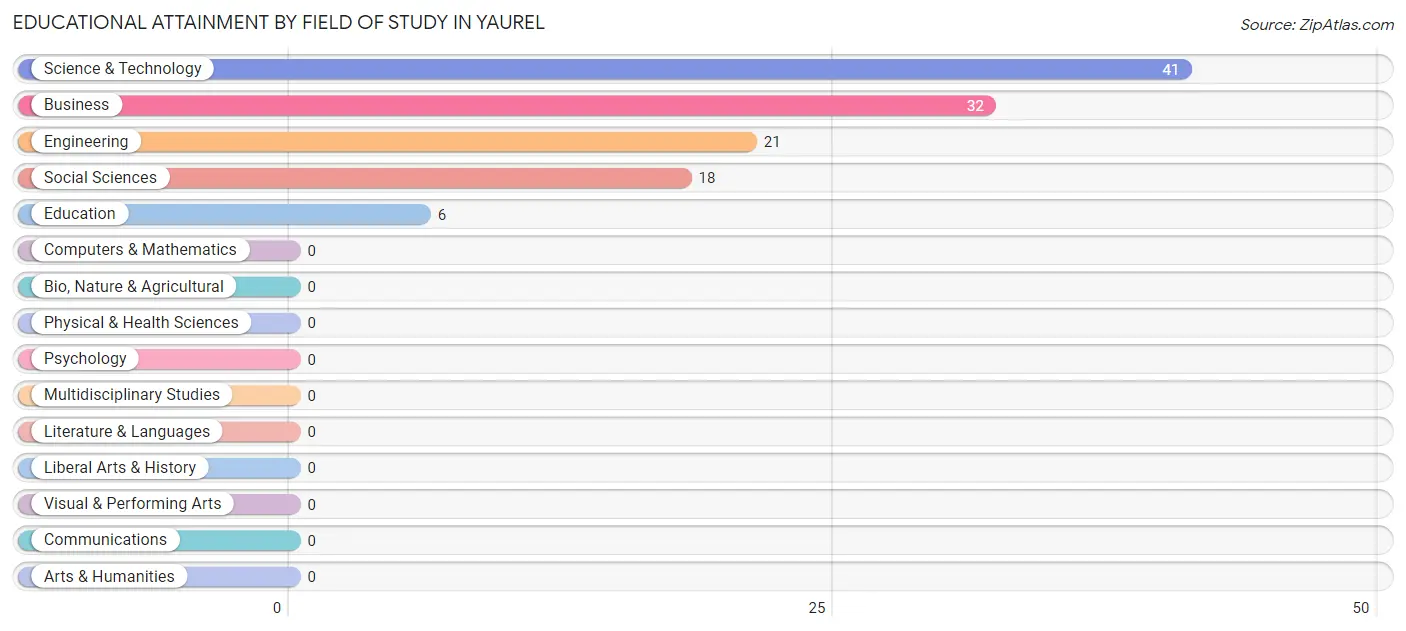
| Field of Study | # Graduates | % Graduates |
| Computers & Mathematics | 0 | 0.0% |
| Bio, Nature & Agricultural | 0 | 0.0% |
| Physical & Health Sciences | 0 | 0.0% |
| Psychology | 0 | 0.0% |
| Social Sciences | 18 | 15.2% |
| Engineering | 21 | 17.8% |
| Multidisciplinary Studies | 0 | 0.0% |
| Science & Technology | 41 | 34.7% |
| Business | 32 | 27.1% |
| Education | 6 | 5.1% |
| Literature & Languages | 0 | 0.0% |
| Liberal Arts & History | 0 | 0.0% |
| Visual & Performing Arts | 0 | 0.0% |
| Communications | 0 | 0.0% |
| Arts & Humanities | 0 | 0.0% |
| Total | 118 | 100.0% |
Transportation & Commute in Yaurel
Vehicle Availability by Sex in Yaurel
The most prevalent vehicle ownership categories in Yaurel are males with 1 vehicle (33, accounting for 56.9%) and females with 1 vehicle (55, making up 30.6%).
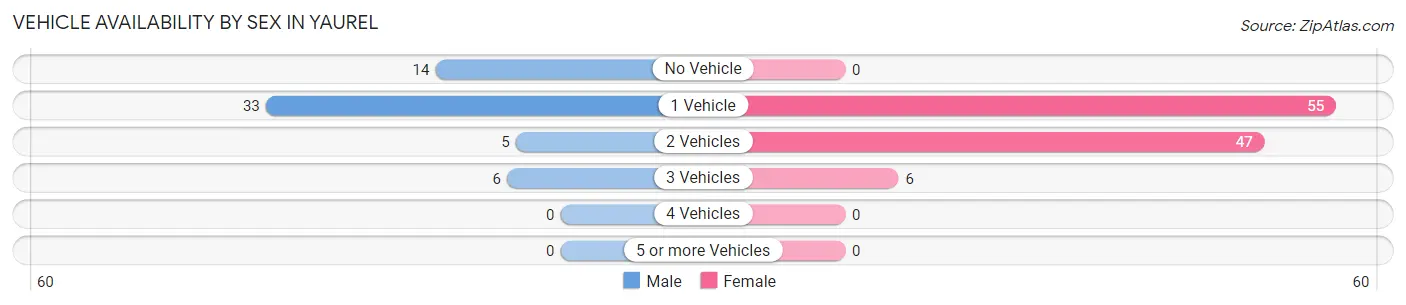
| Vehicles Available | Male | Female |
| No Vehicle | 14 (24.1%) | 0 (0.0%) |
| 1 Vehicle | 33 (56.9%) | 55 (50.9%) |
| 2 Vehicles | 5 (8.6%) | 47 (43.5%) |
| 3 Vehicles | 6 (10.3%) | 6 (5.6%) |
| 4 Vehicles | 0 (0.0%) | 0 (0.0%) |
| 5 or more Vehicles | 0 (0.0%) | 0 (0.0%) |
| Total | 58 (100.0%) | 108 (100.0%) |
Commute Time in Yaurel
The most frequently occuring commute durations in Yaurel are 30 to 34 minutes (58 commuters, 34.9%), 60 to 89 minutes (49 commuters, 29.5%), and 15 to 19 minutes (36 commuters, 21.7%).
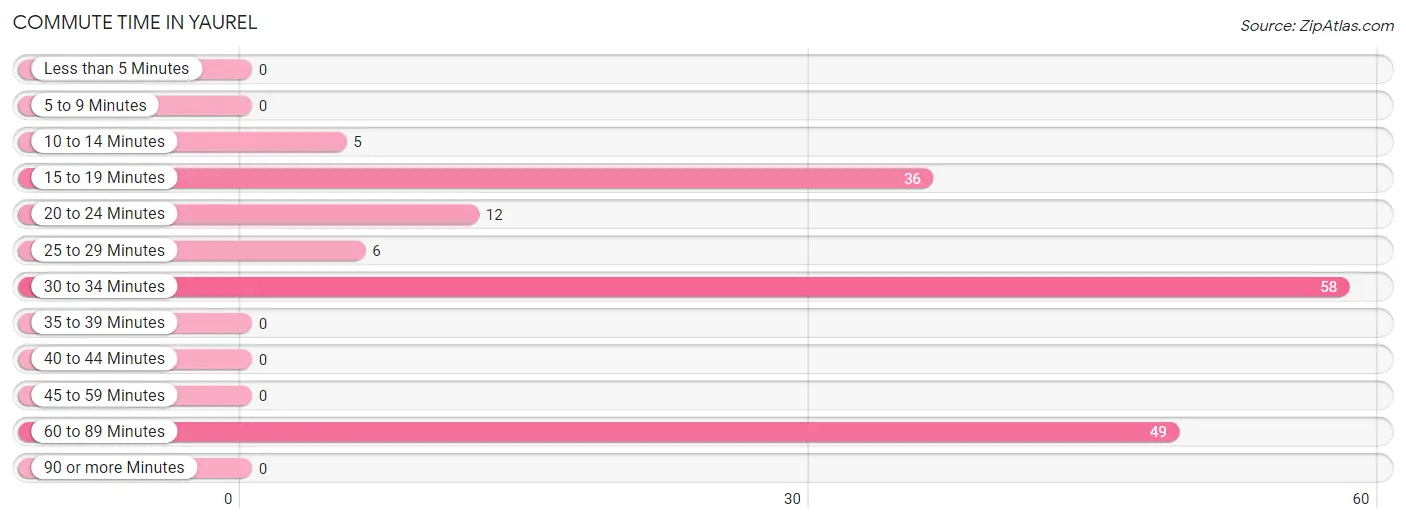
| Commute Time | # Commuters | % Commuters |
| Less than 5 Minutes | 0 | 0.0% |
| 5 to 9 Minutes | 0 | 0.0% |
| 10 to 14 Minutes | 5 | 3.0% |
| 15 to 19 Minutes | 36 | 21.7% |
| 20 to 24 Minutes | 12 | 7.2% |
| 25 to 29 Minutes | 6 | 3.6% |
| 30 to 34 Minutes | 58 | 34.9% |
| 35 to 39 Minutes | 0 | 0.0% |
| 40 to 44 Minutes | 0 | 0.0% |
| 45 to 59 Minutes | 0 | 0.0% |
| 60 to 89 Minutes | 49 | 29.5% |
| 90 or more Minutes | 0 | 0.0% |
Commute Time by Sex in Yaurel
The most common commute times in Yaurel are 30 to 34 minutes (38 commuters, 65.5%) for males and 15 to 19 minutes (36 commuters, 33.3%) for females.
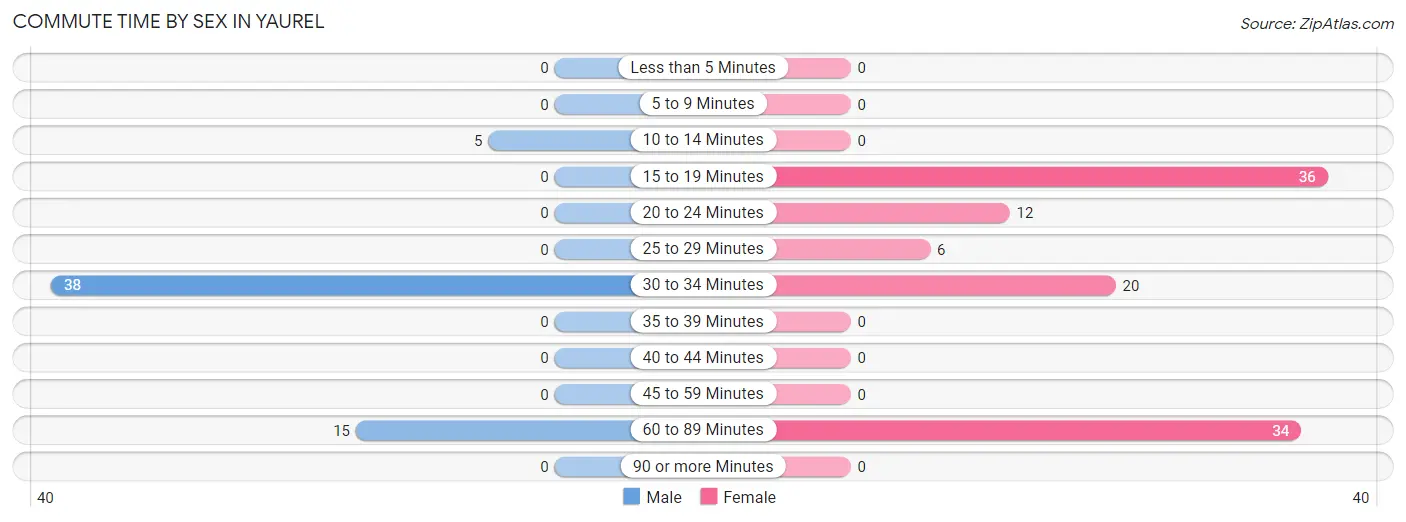
| Commute Time | Male | Female |
| Less than 5 Minutes | 0 (0.0%) | 0 (0.0%) |
| 5 to 9 Minutes | 0 (0.0%) | 0 (0.0%) |
| 10 to 14 Minutes | 5 (8.6%) | 0 (0.0%) |
| 15 to 19 Minutes | 0 (0.0%) | 36 (33.3%) |
| 20 to 24 Minutes | 0 (0.0%) | 12 (11.1%) |
| 25 to 29 Minutes | 0 (0.0%) | 6 (5.6%) |
| 30 to 34 Minutes | 38 (65.5%) | 20 (18.5%) |
| 35 to 39 Minutes | 0 (0.0%) | 0 (0.0%) |
| 40 to 44 Minutes | 0 (0.0%) | 0 (0.0%) |
| 45 to 59 Minutes | 0 (0.0%) | 0 (0.0%) |
| 60 to 89 Minutes | 15 (25.9%) | 34 (31.5%) |
| 90 or more Minutes | 0 (0.0%) | 0 (0.0%) |
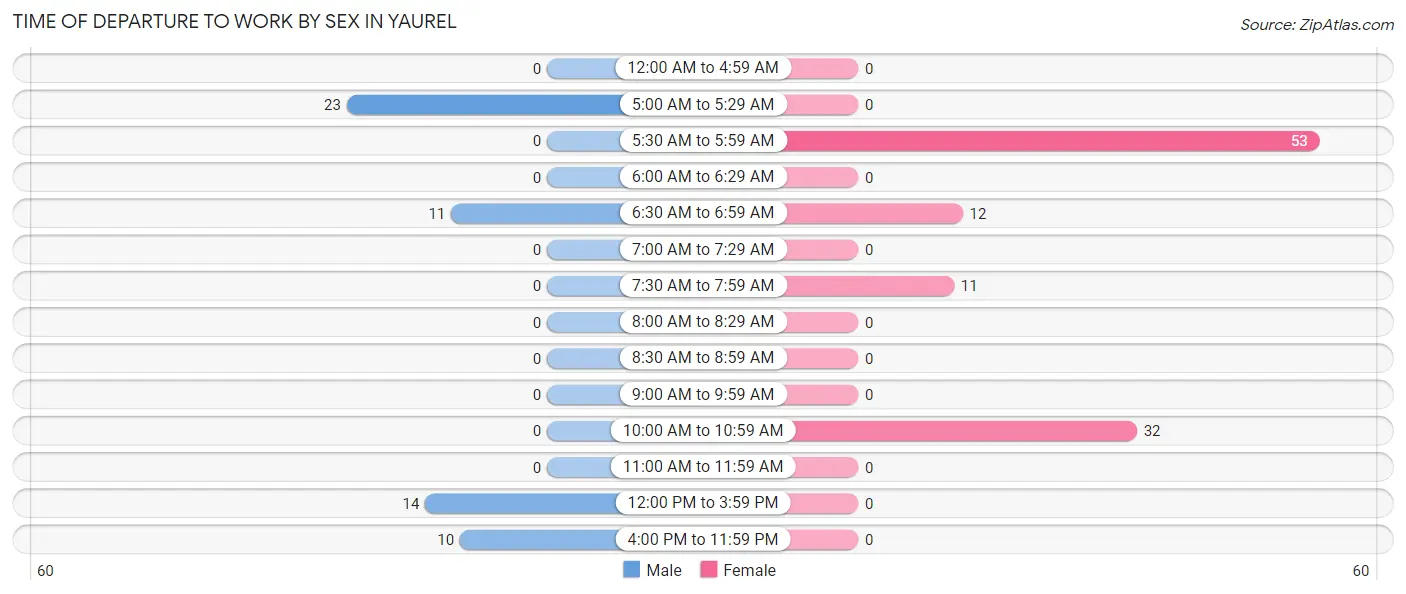
Time of Departure to Work by Sex in Yaurel
The most frequent times of departure to work in Yaurel are 5:00 AM to 5:29 AM (23, 39.7%) for males and 5:30 AM to 5:59 AM (53, 49.1%) for females.
| Time of Departure | Male | Female |
| 12:00 AM to 4:59 AM | 0 (0.0%) | 0 (0.0%) |
| 5:00 AM to 5:29 AM | 23 (39.7%) | 0 (0.0%) |
| 5:30 AM to 5:59 AM | 0 (0.0%) | 53 (49.1%) |
| 6:00 AM to 6:29 AM | 0 (0.0%) | 0 (0.0%) |
| 6:30 AM to 6:59 AM | 11 (19.0%) | 12 (11.1%) |
| 7:00 AM to 7:29 AM | 0 (0.0%) | 0 (0.0%) |
| 7:30 AM to 7:59 AM | 0 (0.0%) | 11 (10.2%) |
| 8:00 AM to 8:29 AM | 0 (0.0%) | 0 (0.0%) |
| 8:30 AM to 8:59 AM | 0 (0.0%) | 0 (0.0%) |
| 9:00 AM to 9:59 AM | 0 (0.0%) | 0 (0.0%) |
| 10:00 AM to 10:59 AM | 0 (0.0%) | 32 (29.6%) |
| 11:00 AM to 11:59 AM | 0 (0.0%) | 0 (0.0%) |
| 12:00 PM to 3:59 PM | 14 (24.1%) | 0 (0.0%) |
| 4:00 PM to 11:59 PM | 10 (17.2%) | 0 (0.0%) |
| Total | 58 (100.0%) | 108 (100.0%) |
Housing Occupancy in Yaurel
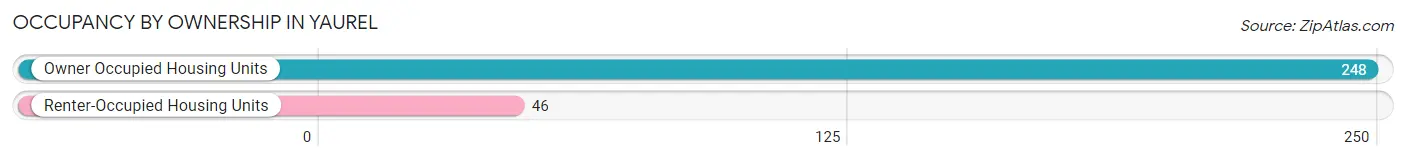
Occupancy by Ownership in Yaurel
Of the total 294 dwellings in Yaurel, owner-occupied units account for 248 (84.4%), while renter-occupied units make up 46 (15.7%).
| Occupancy | # Housing Units | % Housing Units |
| Owner Occupied Housing Units | 248 | 84.4% |
| Renter-Occupied Housing Units | 46 | 15.7% |
| Total Occupied Housing Units | 294 | 100.0% |
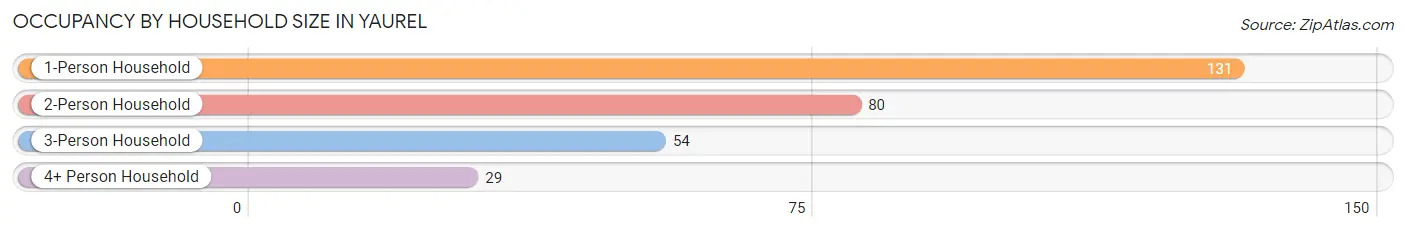
Occupancy by Household Size in Yaurel
| Household Size | # Housing Units | % Housing Units |
| 1-Person Household | 131 | 44.6% |
| 2-Person Household | 80 | 27.2% |
| 3-Person Household | 54 | 18.4% |
| 4+ Person Household | 29 | 9.9% |
| Total Housing Units | 294 | 100.0% |
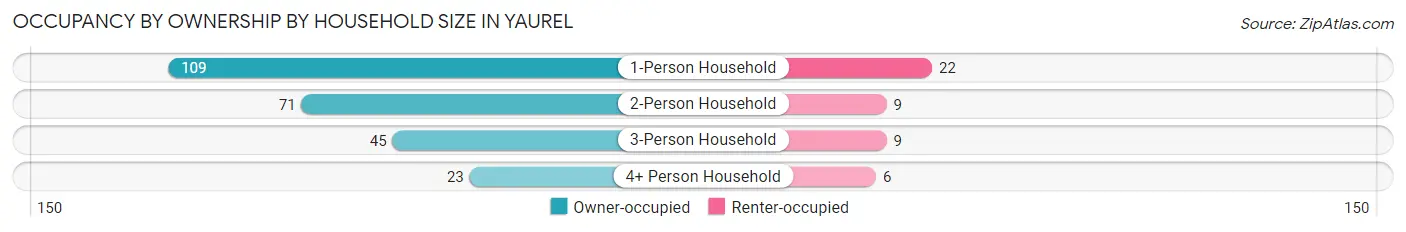
Occupancy by Ownership by Household Size in Yaurel
| Household Size | Owner-occupied | Renter-occupied |
| 1-Person Household | 109 (83.2%) | 22 (16.8%) |
| 2-Person Household | 71 (88.7%) | 9 (11.3%) |
| 3-Person Household | 45 (83.3%) | 9 (16.7%) |
| 4+ Person Household | 23 (79.3%) | 6 (20.7%) |
| Total Housing Units | 248 (84.4%) | 46 (15.7%) |
Occupancy by Educational Attainment in Yaurel
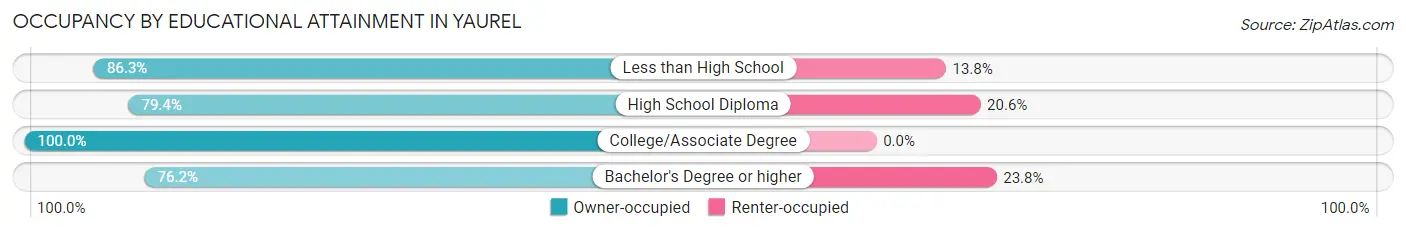
| Household Size | Owner-occupied | Renter-occupied |
| Less than High School | 69 (86.3%) | 11 (13.8%) |
| High School Diploma | 77 (79.4%) | 20 (20.6%) |
| College/Associate Degree | 54 (100.0%) | 0 (0.0%) |
| Bachelor's Degree or higher | 48 (76.2%) | 15 (23.8%) |
Occupancy by Age of Householder in Yaurel
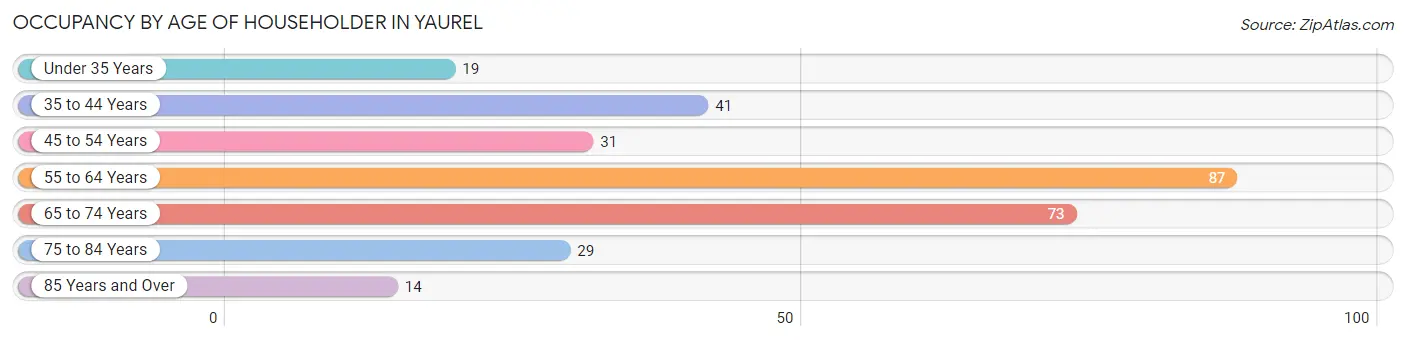
| Age Bracket | # Households | % Households |
| Under 35 Years | 19 | 6.5% |
| 35 to 44 Years | 41 | 14.0% |
| 45 to 54 Years | 31 | 10.5% |
| 55 to 64 Years | 87 | 29.6% |
| 65 to 74 Years | 73 | 24.8% |
| 75 to 84 Years | 29 | 9.9% |
| 85 Years and Over | 14 | 4.8% |
| Total | 294 | 100.0% |
Housing Finances in Yaurel
Median Income by Occupancy in Yaurel
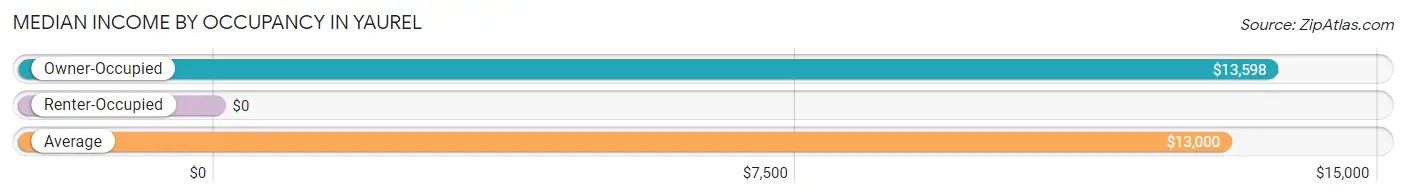
| Occupancy Type | # Households | Median Income |
| Owner-Occupied | 248 (84.4%) | $13,598 |
| Renter-Occupied | 46 (15.7%) | $0 |
| Average | 294 (100.0%) | $13,000 |
Occupancy by Householder Income Bracket in Yaurel
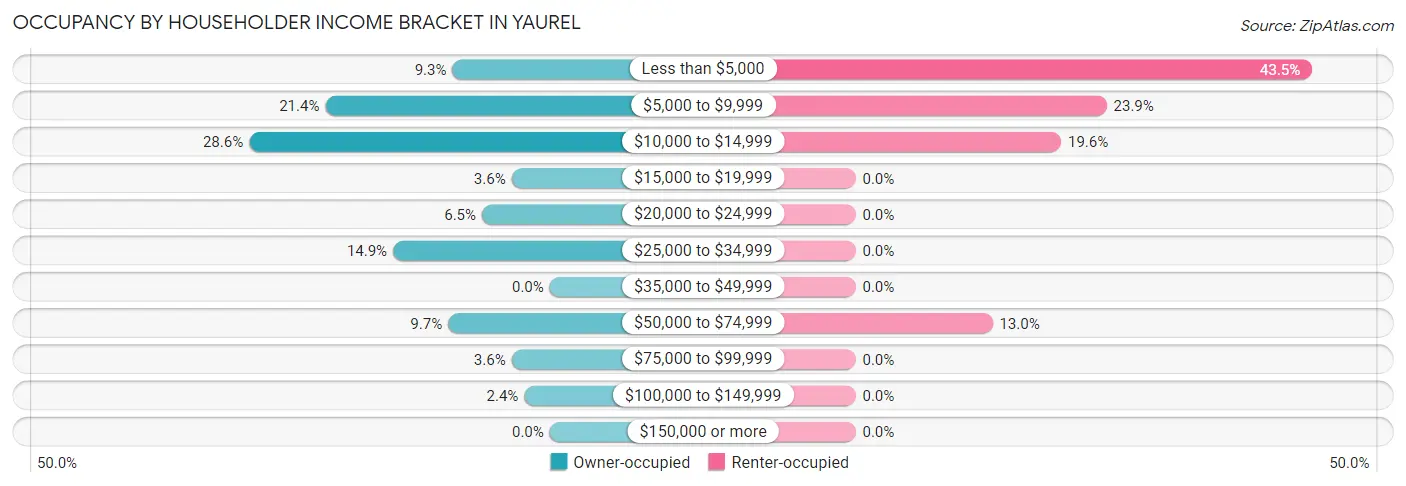
| Income Bracket | Owner-occupied | Renter-occupied |
| Less than $5,000 | 23 (9.3%) | 20 (43.5%) |
| $5,000 to $9,999 | 53 (21.4%) | 11 (23.9%) |
| $10,000 to $14,999 | 71 (28.6%) | 9 (19.6%) |
| $15,000 to $19,999 | 9 (3.6%) | 0 (0.0%) |
| $20,000 to $24,999 | 16 (6.5%) | 0 (0.0%) |
| $25,000 to $34,999 | 37 (14.9%) | 0 (0.0%) |
| $35,000 to $49,999 | 0 (0.0%) | 0 (0.0%) |
| $50,000 to $74,999 | 24 (9.7%) | 6 (13.0%) |
| $75,000 to $99,999 | 9 (3.6%) | 0 (0.0%) |
| $100,000 to $149,999 | 6 (2.4%) | 0 (0.0%) |
| $150,000 or more | 0 (0.0%) | 0 (0.0%) |
| Total | 248 (100.0%) | 46 (100.0%) |
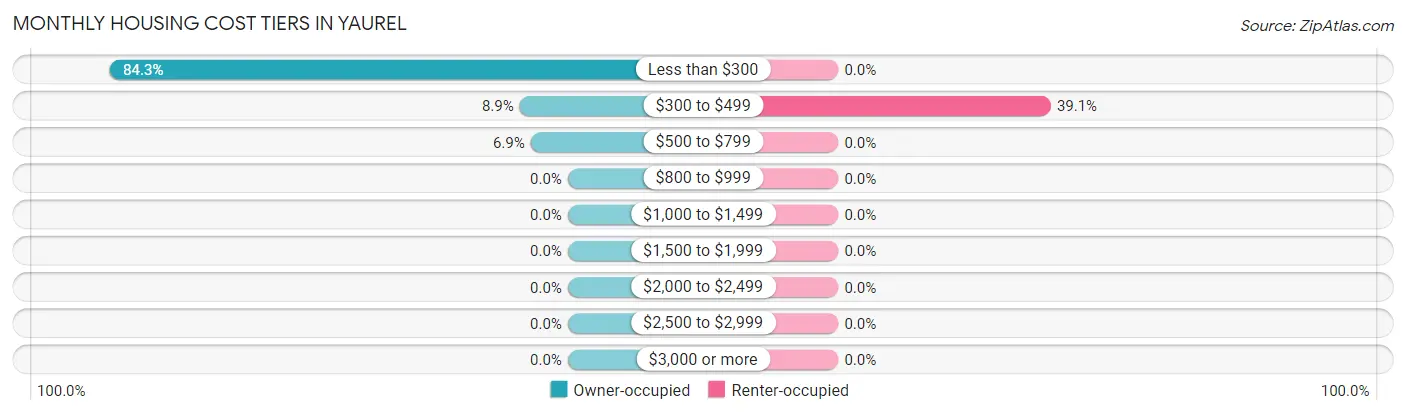
Monthly Housing Cost Tiers in Yaurel
| Monthly Cost | Owner-occupied | Renter-occupied |
| Less than $300 | 209 (84.3%) | 0 (0.0%) |
| $300 to $499 | 22 (8.9%) | 18 (39.1%) |
| $500 to $799 | 17 (6.9%) | 0 (0.0%) |
| $800 to $999 | 0 (0.0%) | 0 (0.0%) |
| $1,000 to $1,499 | 0 (0.0%) | 0 (0.0%) |
| $1,500 to $1,999 | 0 (0.0%) | 0 (0.0%) |
| $2,000 to $2,499 | 0 (0.0%) | 0 (0.0%) |
| $2,500 to $2,999 | 0 (0.0%) | 0 (0.0%) |
| $3,000 or more | 0 (0.0%) | 0 (0.0%) |
| Total | 248 (100.0%) | 46 (100.0%) |
Physical Housing Characteristics in Yaurel
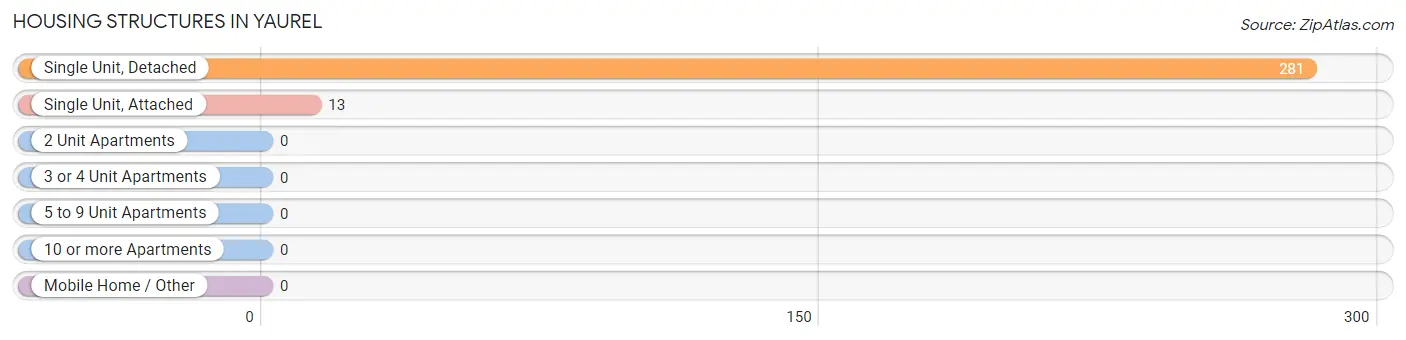
Housing Structures in Yaurel
| Structure Type | # Housing Units | % Housing Units |
| Single Unit, Detached | 281 | 95.6% |
| Single Unit, Attached | 13 | 4.4% |
| 2 Unit Apartments | 0 | 0.0% |
| 3 or 4 Unit Apartments | 0 | 0.0% |
| 5 to 9 Unit Apartments | 0 | 0.0% |
| 10 or more Apartments | 0 | 0.0% |
| Mobile Home / Other | 0 | 0.0% |
| Total | 294 | 100.0% |
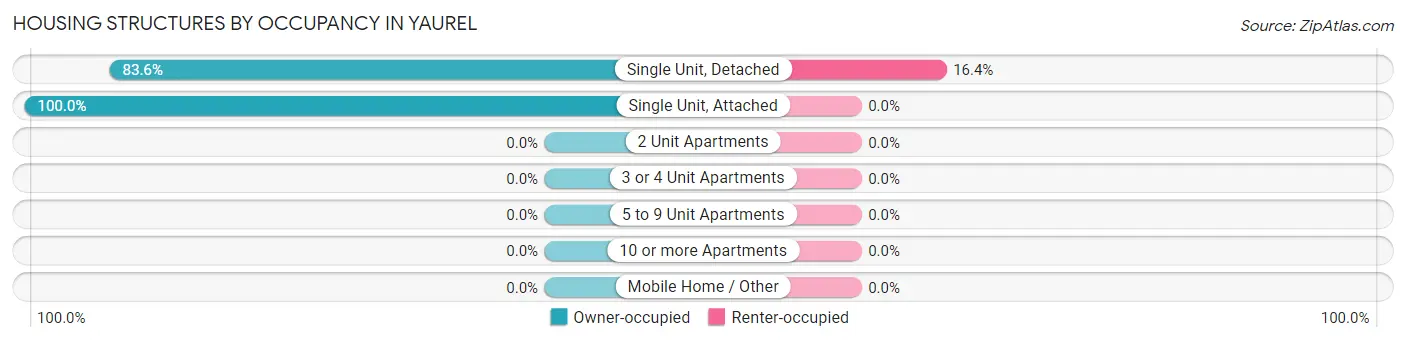
Housing Structures by Occupancy in Yaurel
| Structure Type | Owner-occupied | Renter-occupied |
| Single Unit, Detached | 235 (83.6%) | 46 (16.4%) |
| Single Unit, Attached | 13 (100.0%) | 0 (0.0%) |
| 2 Unit Apartments | 0 (0.0%) | 0 (0.0%) |
| 3 or 4 Unit Apartments | 0 (0.0%) | 0 (0.0%) |
| 5 to 9 Unit Apartments | 0 (0.0%) | 0 (0.0%) |
| 10 or more Apartments | 0 (0.0%) | 0 (0.0%) |
| Mobile Home / Other | 0 (0.0%) | 0 (0.0%) |
| Total | 248 (84.4%) | 46 (15.7%) |
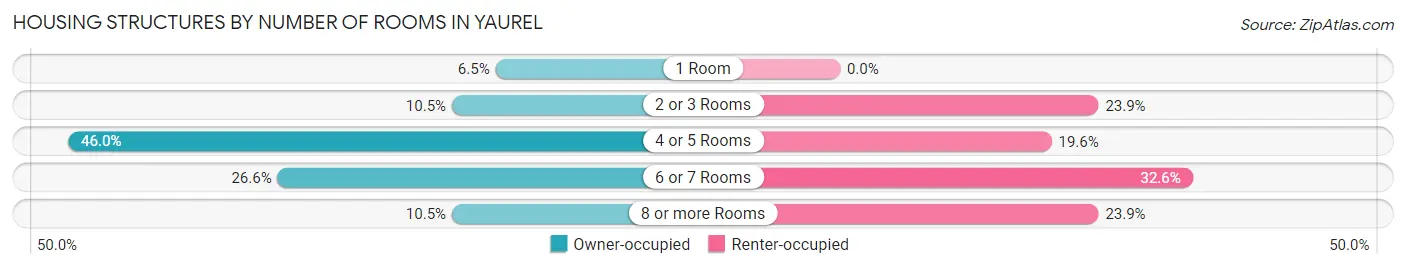
Housing Structures by Number of Rooms in Yaurel
| Number of Rooms | Owner-occupied | Renter-occupied |
| 1 Room | 16 (6.5%) | 0 (0.0%) |
| 2 or 3 Rooms | 26 (10.5%) | 11 (23.9%) |
| 4 or 5 Rooms | 114 (46.0%) | 9 (19.6%) |
| 6 or 7 Rooms | 66 (26.6%) | 15 (32.6%) |
| 8 or more Rooms | 26 (10.5%) | 11 (23.9%) |
| Total | 248 (100.0%) | 46 (100.0%) |
Housing Structure by Heating Type in Yaurel
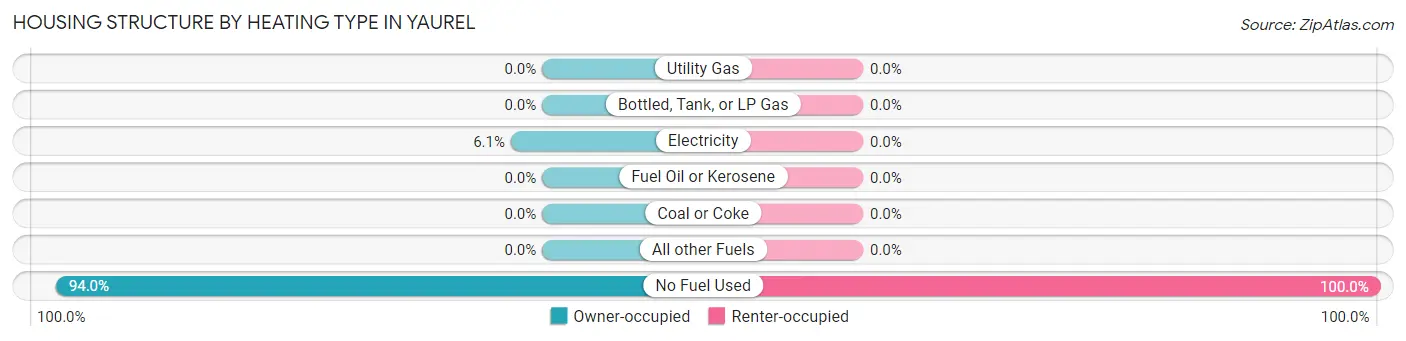
| Heating Type | Owner-occupied | Renter-occupied |
| Utility Gas | 0 (0.0%) | 0 (0.0%) |
| Bottled, Tank, or LP Gas | 0 (0.0%) | 0 (0.0%) |
| Electricity | 15 (6.0%) | 0 (0.0%) |
| Fuel Oil or Kerosene | 0 (0.0%) | 0 (0.0%) |
| Coal or Coke | 0 (0.0%) | 0 (0.0%) |
| All other Fuels | 0 (0.0%) | 0 (0.0%) |
| No Fuel Used | 233 (94.0%) | 46 (100.0%) |
| Total | 248 (100.0%) | 46 (100.0%) |
Household Vehicle Usage in Yaurel
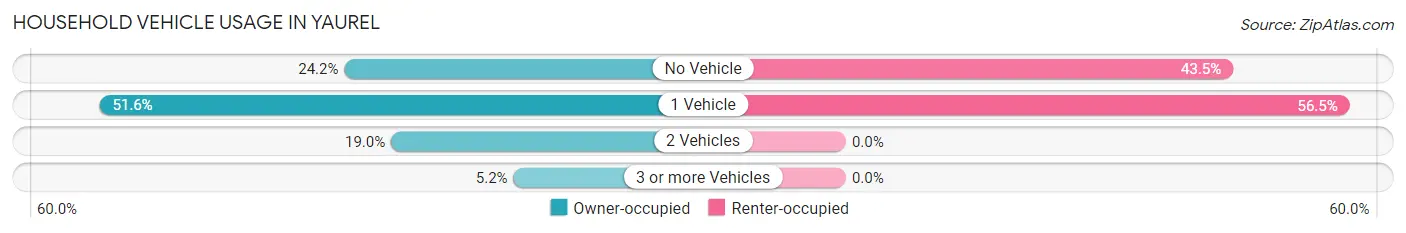
| Vehicles per Household | Owner-occupied | Renter-occupied |
| No Vehicle | 60 (24.2%) | 20 (43.5%) |
| 1 Vehicle | 128 (51.6%) | 26 (56.5%) |
| 2 Vehicles | 47 (19.0%) | 0 (0.0%) |
| 3 or more Vehicles | 13 (5.2%) | 0 (0.0%) |
| Total | 248 (100.0%) | 46 (100.0%) |
Real Estate & Mortgages in Yaurel
Real Estate and Mortgage Overview in Yaurel
| Characteristic | Without Mortgage | With Mortgage |
| Housing Units | 231 | 17 |
| Median Property Value | $72,700 | $0 |
| Median Household Income | $13,750 | $0 |
| Monthly Housing Costs | $181 | $0 |
| Real Estate Taxes | - | - |
Property Value by Mortgage Status in Yaurel
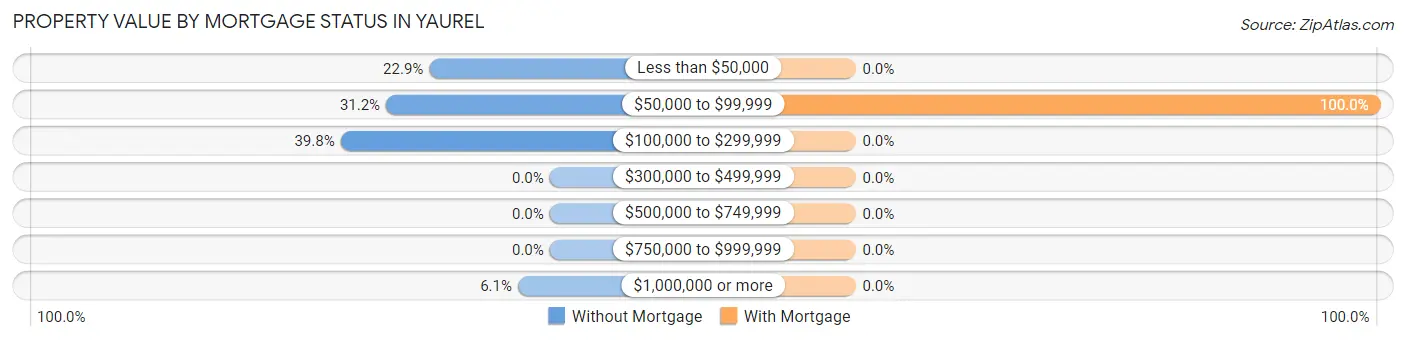
| Property Value | Without Mortgage | With Mortgage |
| Less than $50,000 | 53 (22.9%) | 0 (0.0%) |
| $50,000 to $99,999 | 72 (31.2%) | 17 (100.0%) |
| $100,000 to $299,999 | 92 (39.8%) | 0 (0.0%) |
| $300,000 to $499,999 | 0 (0.0%) | 0 (0.0%) |
| $500,000 to $749,999 | 0 (0.0%) | 0 (0.0%) |
| $750,000 to $999,999 | 0 (0.0%) | 0 (0.0%) |
| $1,000,000 or more | 14 (6.1%) | 0 (0.0%) |
| Total | 231 (100.0%) | 17 (100.0%) |
Household Income by Mortgage Status in Yaurel
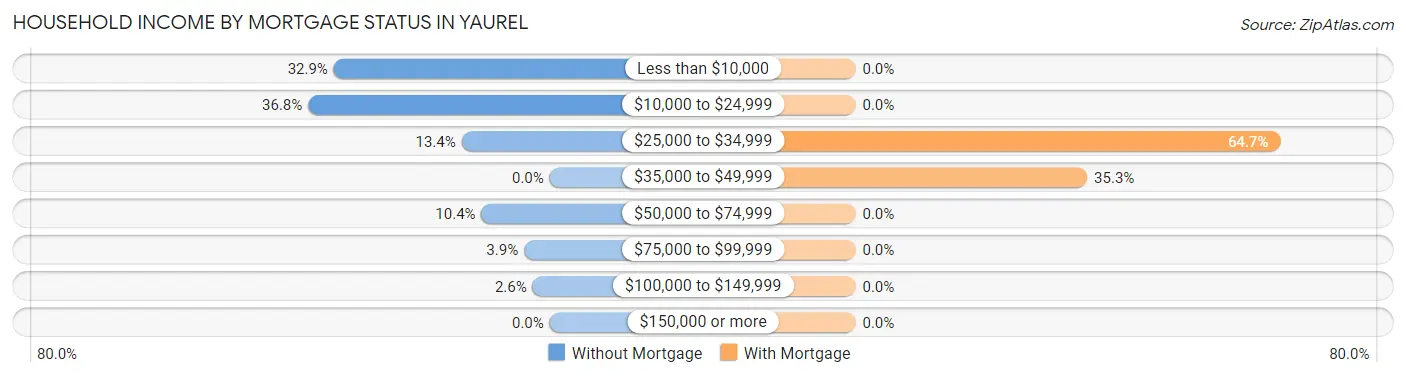
| Household Income | Without Mortgage | With Mortgage |
| Less than $10,000 | 76 (32.9%) | 0 (0.0%) |
| $10,000 to $24,999 | 85 (36.8%) | 0 (0.0%) |
| $25,000 to $34,999 | 31 (13.4%) | 11 (64.7%) |
| $35,000 to $49,999 | 0 (0.0%) | 6 (35.3%) |
| $50,000 to $74,999 | 24 (10.4%) | 0 (0.0%) |
| $75,000 to $99,999 | 9 (3.9%) | 0 (0.0%) |
| $100,000 to $149,999 | 6 (2.6%) | 0 (0.0%) |
| $150,000 or more | 0 (0.0%) | 0 (0.0%) |
| Total | 231 (100.0%) | 17 (100.0%) |
Property Value to Household Income Ratio in Yaurel
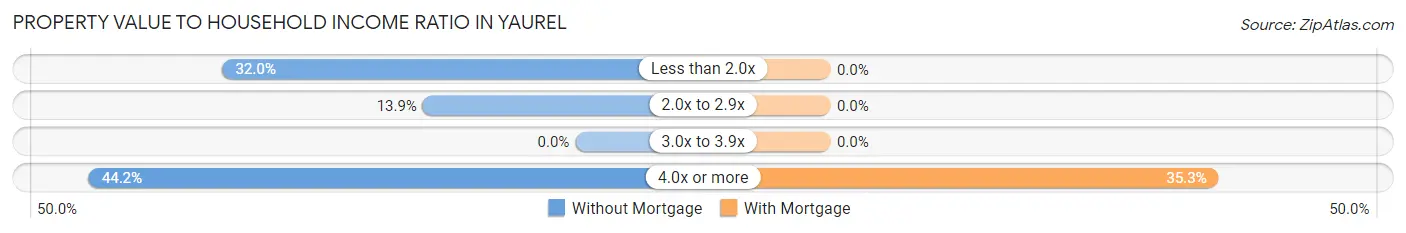
| Value-to-Income Ratio | Without Mortgage | With Mortgage |
| Less than 2.0x | 74 (32.0%) | 0 (0.0%) |
| 2.0x to 2.9x | 32 (13.9%) | 0 (0.0%) |
| 3.0x to 3.9x | 0 (0.0%) | 0 (0.0%) |
| 4.0x or more | 102 (44.2%) | 6 (35.3%) |
| Total | 231 (100.0%) | 17 (100.0%) |
Real Estate Taxes by Mortgage Status in Yaurel
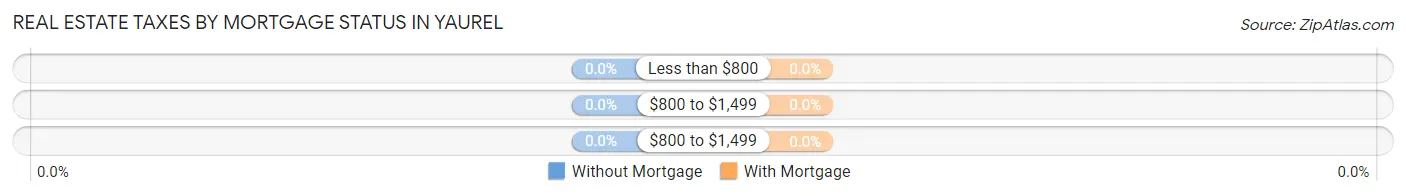
| Property Taxes | Without Mortgage | With Mortgage |
| Less than $800 | 0 (0.0%) | 0 (0.0%) |
| $800 to $1,499 | 0 (0.0%) | 0 (0.0%) |
| $800 to $1,499 | 0 (0.0%) | 0 (0.0%) |
| Total | 231 (100.0%) | 17 (100.0%) |
Health & Disability in Yaurel
Health Insurance Coverage by Age in Yaurel
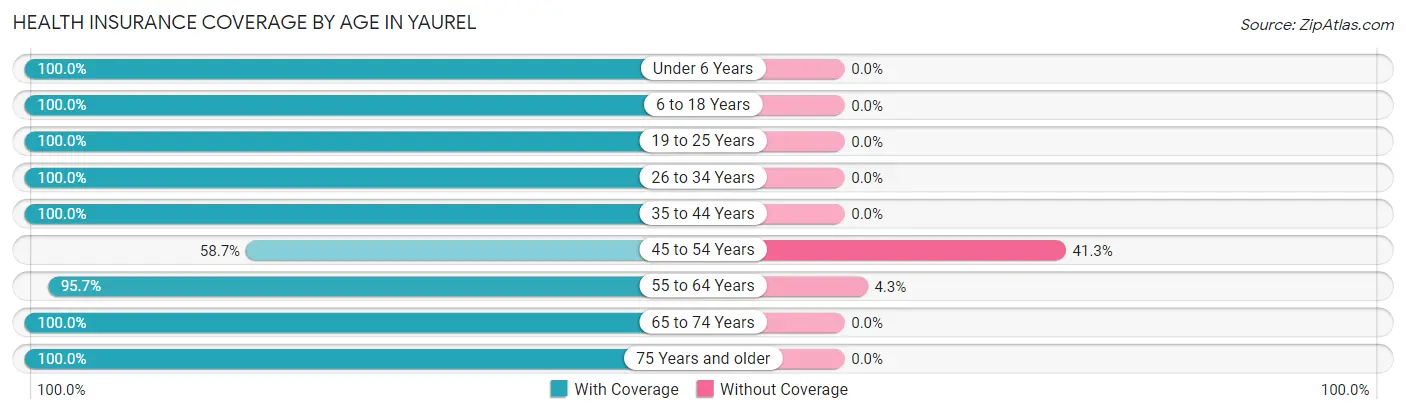
| Age Bracket | With Coverage | Without Coverage |
| Under 6 Years | 16 (100.0%) | 0 (0.0%) |
| 6 to 18 Years | 49 (100.0%) | 0 (0.0%) |
| 19 to 25 Years | 44 (100.0%) | 0 (0.0%) |
| 26 to 34 Years | 40 (100.0%) | 0 (0.0%) |
| 35 to 44 Years | 86 (100.0%) | 0 (0.0%) |
| 45 to 54 Years | 37 (58.7%) | 26 (41.3%) |
| 55 to 64 Years | 133 (95.7%) | 6 (4.3%) |
| 65 to 74 Years | 113 (100.0%) | 0 (0.0%) |
| 75 Years and older | 96 (100.0%) | 0 (0.0%) |
| Total | 614 (95.1%) | 32 (5.0%) |
Health Insurance Coverage by Citizenship Status in Yaurel

| Citizenship Status | With Coverage | Without Coverage |
| Native Born | 16 (100.0%) | 0 (0.0%) |
| Foreign Born, Citizen | 49 (100.0%) | 0 (0.0%) |
| Foreign Born, not a Citizen | 44 (100.0%) | 0 (0.0%) |
Health Insurance Coverage by Household Income in Yaurel
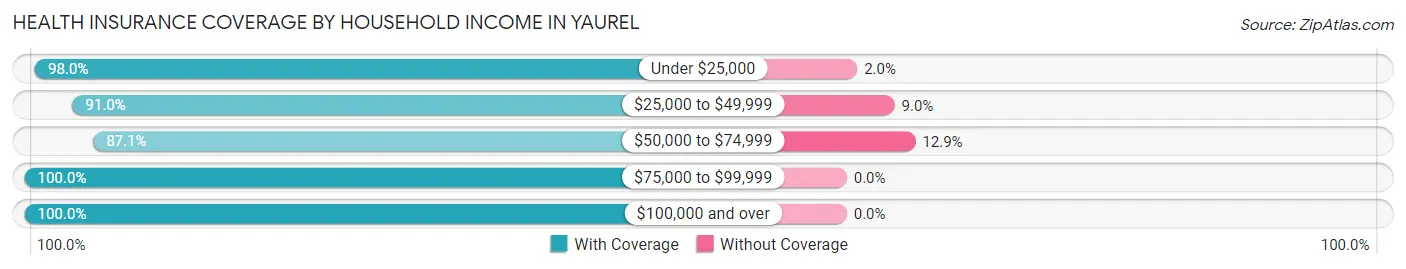
| Household Income | With Coverage | Without Coverage |
| Under $25,000 | 401 (98.0%) | 8 (2.0%) |
| $25,000 to $49,999 | 61 (91.0%) | 6 (9.0%) |
| $50,000 to $74,999 | 122 (87.1%) | 18 (12.9%) |
| $75,000 to $99,999 | 9 (100.0%) | 0 (0.0%) |
| $100,000 and over | 21 (100.0%) | 0 (0.0%) |
Public vs Private Health Insurance Coverage by Age in Yaurel
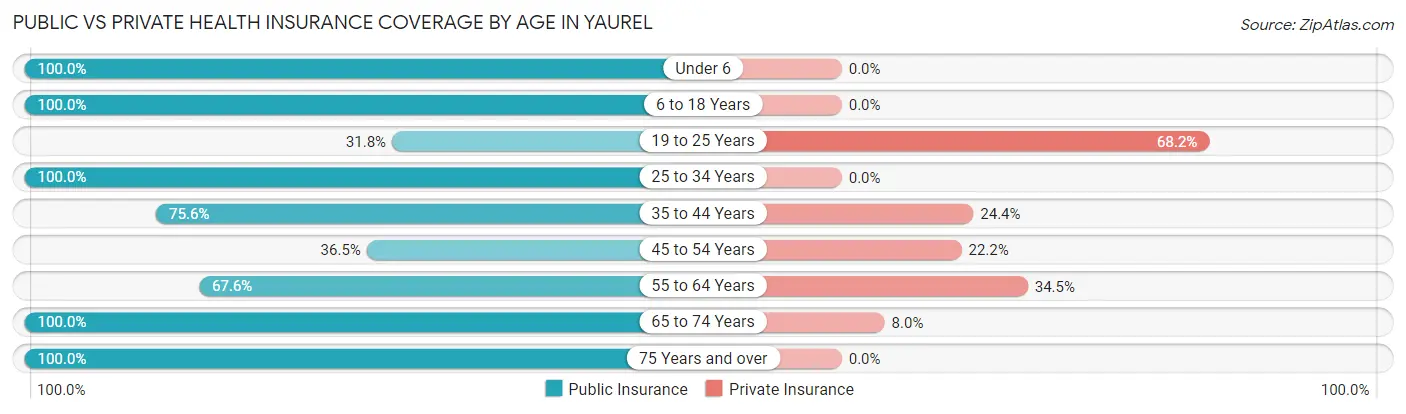
| Age Bracket | Public Insurance | Private Insurance |
| Under 6 | 16 (100.0%) | 0 (0.0%) |
| 6 to 18 Years | 49 (100.0%) | 0 (0.0%) |
| 19 to 25 Years | 14 (31.8%) | 30 (68.2%) |
| 25 to 34 Years | 40 (100.0%) | 0 (0.0%) |
| 35 to 44 Years | 65 (75.6%) | 21 (24.4%) |
| 45 to 54 Years | 23 (36.5%) | 14 (22.2%) |
| 55 to 64 Years | 94 (67.6%) | 48 (34.5%) |
| 65 to 74 Years | 113 (100.0%) | 9 (8.0%) |
| 75 Years and over | 96 (100.0%) | 0 (0.0%) |
| Total | 510 (78.9%) | 122 (18.9%) |
Disability Status by Sex by Age in Yaurel
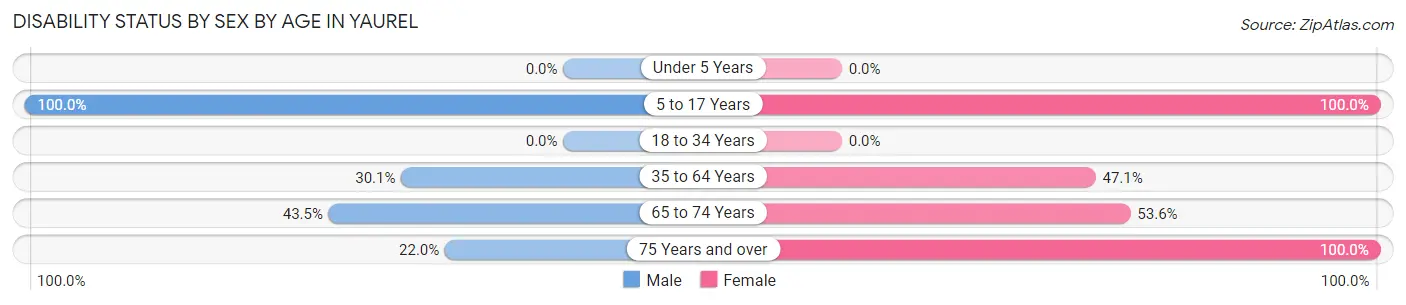
| Age Bracket | Male | Female |
| Under 5 Years | 0 (0.0%) | 0 (0.0%) |
| 5 to 17 Years | 9 (100.0%) | 40 (100.0%) |
| 18 to 34 Years | 0 (0.0%) | 0 (0.0%) |
| 35 to 64 Years | 40 (30.1%) | 73 (47.1%) |
| 65 to 74 Years | 37 (43.5%) | 15 (53.6%) |
| 75 Years and over | 9 (22.0%) | 55 (100.0%) |
Disability Class by Sex by Age in Yaurel
Disability Class: Hearing Difficulty
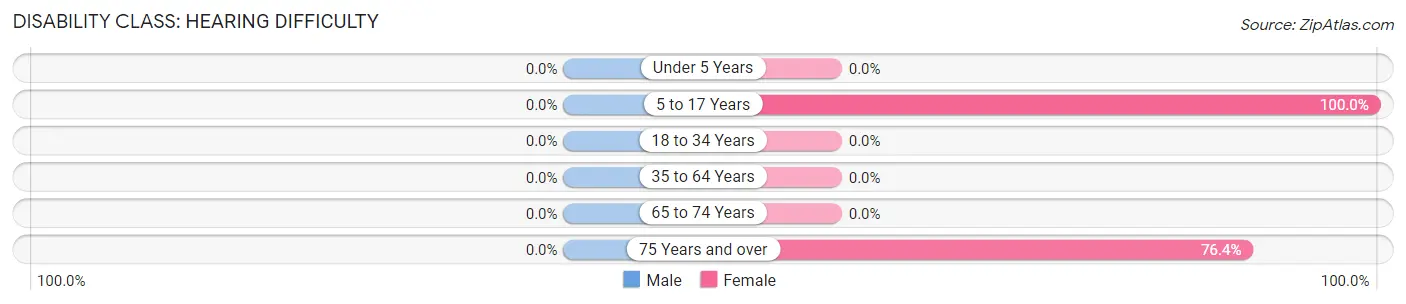
| Age Bracket | Male | Female |
| Under 5 Years | 0 (0.0%) | 0 (0.0%) |
| 5 to 17 Years | 0 (0.0%) | 40 (100.0%) |
| 18 to 34 Years | 0 (0.0%) | 0 (0.0%) |
| 35 to 64 Years | 0 (0.0%) | 0 (0.0%) |
| 65 to 74 Years | 0 (0.0%) | 0 (0.0%) |
| 75 Years and over | 0 (0.0%) | 42 (76.4%) |
Disability Class: Vision Difficulty
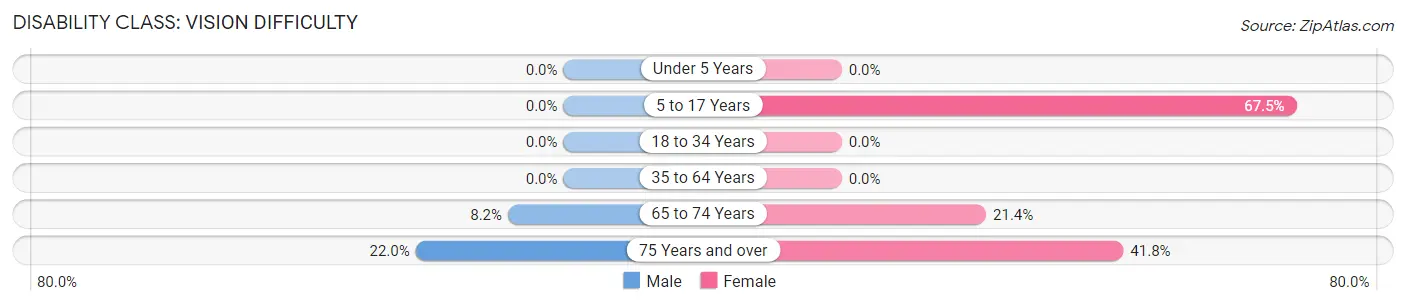
| Age Bracket | Male | Female |
| Under 5 Years | 0 (0.0%) | 0 (0.0%) |
| 5 to 17 Years | 0 (0.0%) | 27 (67.5%) |
| 18 to 34 Years | 0 (0.0%) | 0 (0.0%) |
| 35 to 64 Years | 0 (0.0%) | 0 (0.0%) |
| 65 to 74 Years | 7 (8.2%) | 6 (21.4%) |
| 75 Years and over | 9 (22.0%) | 23 (41.8%) |
Disability Class: Cognitive Difficulty
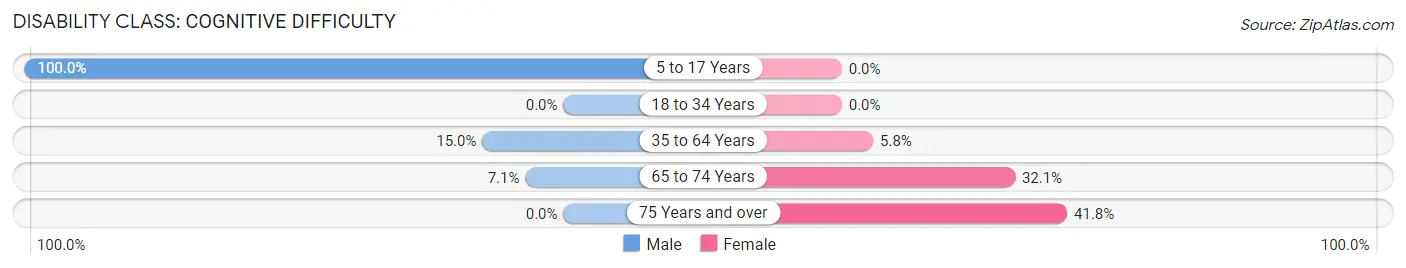
| Age Bracket | Male | Female |
| 5 to 17 Years | 9 (100.0%) | 0 (0.0%) |
| 18 to 34 Years | 0 (0.0%) | 0 (0.0%) |
| 35 to 64 Years | 20 (15.0%) | 9 (5.8%) |
| 65 to 74 Years | 6 (7.1%) | 9 (32.1%) |
| 75 Years and over | 0 (0.0%) | 23 (41.8%) |
Disability Class: Ambulatory Difficulty
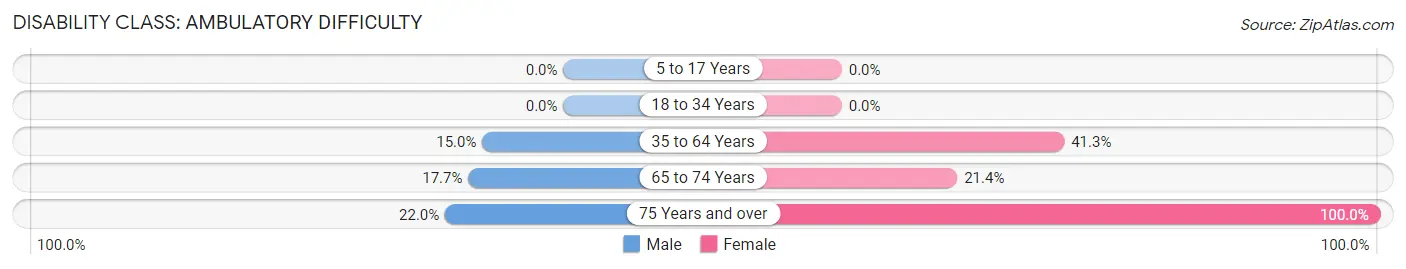
| Age Bracket | Male | Female |
| 5 to 17 Years | 0 (0.0%) | 0 (0.0%) |
| 18 to 34 Years | 0 (0.0%) | 0 (0.0%) |
| 35 to 64 Years | 20 (15.0%) | 64 (41.3%) |
| 65 to 74 Years | 15 (17.6%) | 6 (21.4%) |
| 75 Years and over | 9 (22.0%) | 55 (100.0%) |
Disability Class: Self-Care Difficulty
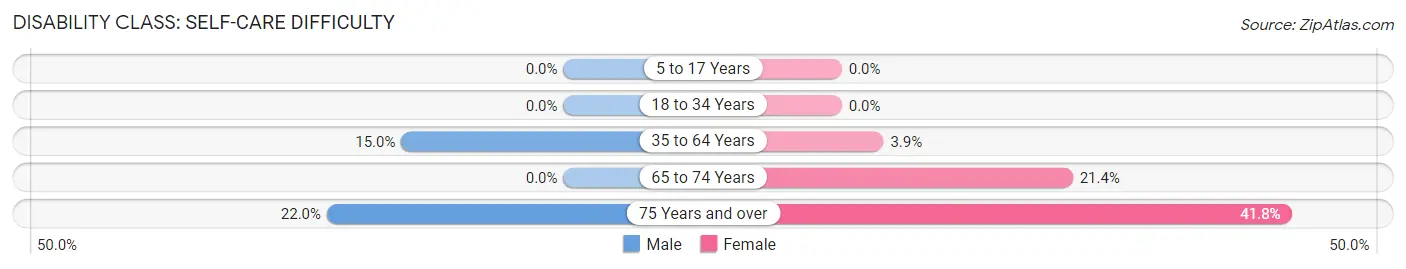
| Age Bracket | Male | Female |
| 5 to 17 Years | 0 (0.0%) | 0 (0.0%) |
| 18 to 34 Years | 0 (0.0%) | 0 (0.0%) |
| 35 to 64 Years | 20 (15.0%) | 6 (3.9%) |
| 65 to 74 Years | 0 (0.0%) | 6 (21.4%) |
| 75 Years and over | 9 (22.0%) | 23 (41.8%) |
Technology Access in Yaurel
Computing Device Access in Yaurel
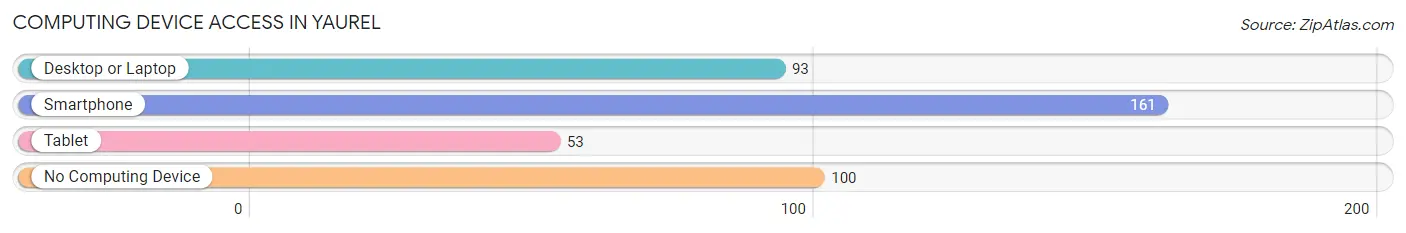
| Device Type | # Households | % Households |
| Desktop or Laptop | 93 | 31.6% |
| Smartphone | 161 | 54.8% |
| Tablet | 53 | 18.0% |
| No Computing Device | 100 | 34.0% |
| Total | 294 | 100.0% |
Internet Access in Yaurel
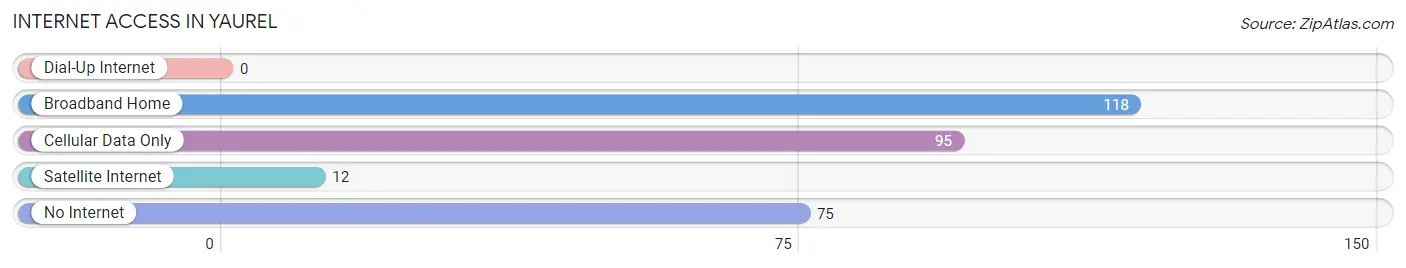
| Internet Type | # Households | % Households |
| Dial-Up Internet | 0 | 0.0% |
| Broadband Home | 118 | 40.1% |
| Cellular Data Only | 95 | 32.3% |
| Satellite Internet | 12 | 4.1% |
| No Internet | 75 | 25.5% |
| Total | 294 | 100.0% |
Yaurel Summary
Yaurel is a municipality located in the northern region of Puerto Rico. It is part of the San Juan-Caguas-Guaynabo Metropolitan Statistical Area. As of the 2010 census, the population of Yaurel was 8,845.
History
Yaurel was founded in 1824 by Don Juan de Yaurel, a Spanish soldier who was granted the land by the Spanish Crown. The town was originally called San Juan de Yaurel, but the name was later shortened to Yaurel.
Yaurel was an important agricultural center during the 19th century, producing coffee, sugar cane, and tobacco. The town was also known for its production of leather goods, such as saddles and harnesses.
Geography
Yaurel is located in the northern region of Puerto Rico, in the municipality of San Juan. It is bordered by the municipalities of San Juan, Toa Baja, and Bayamón. The town is situated in the northern coastal plain, and is surrounded by mountains.
The terrain of Yaurel is mostly flat, with some hills in the northern part of the municipality. The highest point in Yaurel is Cerro de la Cruz, which has an elevation of 1,065 feet (325 meters).
Economy
Yaurel’s economy is largely based on agriculture and tourism. The town is known for its production of coffee, sugar cane, and tobacco. It is also home to several small businesses, such as restaurants, bars, and shops.
Tourism is an important part of Yaurel’s economy. The town is home to several attractions, such as the Yaurel Beach, the Yaurel Lighthouse, and the Yaurel Museum.
Demographics
As of the 2010 census, the population of Yaurel was 8,845. The population is mostly of Hispanic origin, with a small percentage of African and European descent. The median age in Yaurel is 37.7 years, and the median household income is $17,845.
Yaurel is served by the San Juan-Caguas-Guaynabo Metropolitan Statistical Area. The town is part of the San Juan-Caguas-Guaynabo Metropolitan Statistical Area, which has a population of 1,719,000.
Conclusion
Yaurel is a municipality located in the northern region of Puerto Rico. It was founded in 1824 by Don Juan de Yaurel, and is known for its production of coffee, sugar cane, and tobacco. The town is also home to several attractions, such as the Yaurel Beach, the Yaurel Lighthouse, and the Yaurel Museum. As of the 2010 census, the population of Yaurel was 8,845. The town is part of the San Juan-Caguas-Guaynabo Metropolitan Statistical Area, which has a population of 1,719,000.
Common Questions
What is Per Capita Income in Yaurel?
Per Capita income in Yaurel is $11,809.
What is the Median Family Income in Yaurel?
Median Family Income in Yaurel is $14,375.
What is the Median Household income in Yaurel?
Median Household Income in Yaurel is $13,000.
What is Family Income Deficit in Yaurel?
Family Income Deficit in Yaurel is $10,879.
Families that are below poverty line in Yaurel earn $10,879 less on average than the poverty threshold level.
What is Inequality or Gini Index in Yaurel?
Inequality or Gini Index in Yaurel is 0.55.
What is the Total Population of Yaurel?
Total Population of Yaurel is 646.
What is the Total Male Population of Yaurel?
Total Male Population of Yaurel is 309.
What is the Total Female Population of Yaurel?
Total Female Population of Yaurel is 337.
What is the Ratio of Males per 100 Females in Yaurel?
There are 91.69 Males per 100 Females in Yaurel.
What is the Ratio of Females per 100 Males in Yaurel?
There are 109.06 Females per 100 Males in Yaurel.
What is the Median Population Age in Yaurel?
Median Population Age in Yaurel is 56.5 Years.
What is the Average Family Size in Yaurel
Average Family Size in Yaurel is 3.0 People.
What is the Average Household Size in Yaurel
Average Household Size in Yaurel is 2.2 People.
How Large is the Labor Force in Yaurel?
There are 184 People in the Labor Forcein in Yaurel.
What is the Percentage of People in the Labor Force in Yaurel?
29.5% of People are in the Labor Force in Yaurel.
What is the Unemployment Rate in Yaurel?
Unemployment Rate in Yaurel is 9.8%.