Las Piedras, PR Map & Demographics
Las Piedras Map
Las Piedras Overview
$12,399
PER CAPITA INCOME
$21,250
AVG FAMILY INCOME
$16,631
AVG HOUSEHOLD INCOME
39.0%
WAGE / INCOME GAP [ % ]
61.0¢/ $1
WAGE / INCOME GAP [ $ ]
$11,878
FAMILY INCOME DEFICIT
0.58
INEQUALITY / GINI INDEX
4,996
TOTAL POPULATION
2,255
MALE POPULATION
2,741
FEMALE POPULATION
82.27
MALES / 100 FEMALES
121.55
FEMALES / 100 MALES
42.3
MEDIAN AGE
3.6
AVG FAMILY SIZE
2.7
AVG HOUSEHOLD SIZE
1,717
LABOR FORCE [ PEOPLE ]
41.6%
PERCENT IN LABOR FORCE
13.4%
UNEMPLOYMENT RATE
Las Piedras Zip Codes
Las Piedras Area Codes
Income in Las Piedras
Income Overview in Las Piedras
Per Capita Income in Las Piedras is $12,399, while median incomes of families and households are $21,250 and $16,631 respectively.
| Characteristic | Number | Measure |
| Per Capita Income | 4,996 | $12,399 |
| Median Family Income | 1,106 | $21,250 |
| Mean Family Income | 1,106 | $37,651 |
| Median Household Income | 1,849 | $16,631 |
| Mean Household Income | 1,849 | $30,241 |
| Income Deficit | 1,106 | $11,878 |
| Wage / Income Gap (%) | 4,996 | 38.96% |
| Wage / Income Gap ($) | 4,996 | 61.04¢ per $1 |
| Gini / Inequality Index | 4,996 | 0.58 |
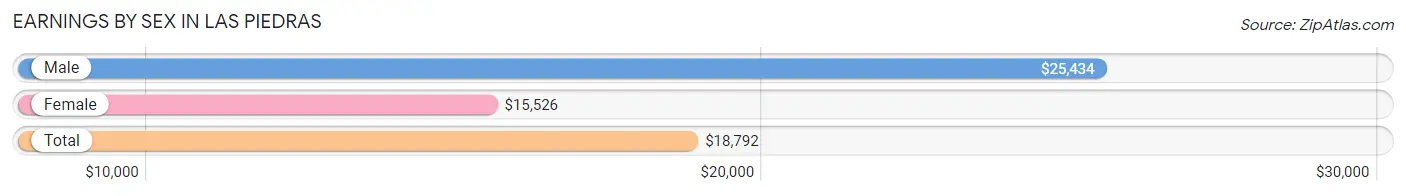
Earnings by Sex in Las Piedras
Average Earnings in Las Piedras are $18,792, $25,434 for men and $15,526 for women, a difference of 39.0%.
| Sex | Number | Average Earnings |
| Male | 757 (48.5%) | $25,434 |
| Female | 803 (51.5%) | $15,526 |
| Total | 1,560 (100.0%) | $18,792 |
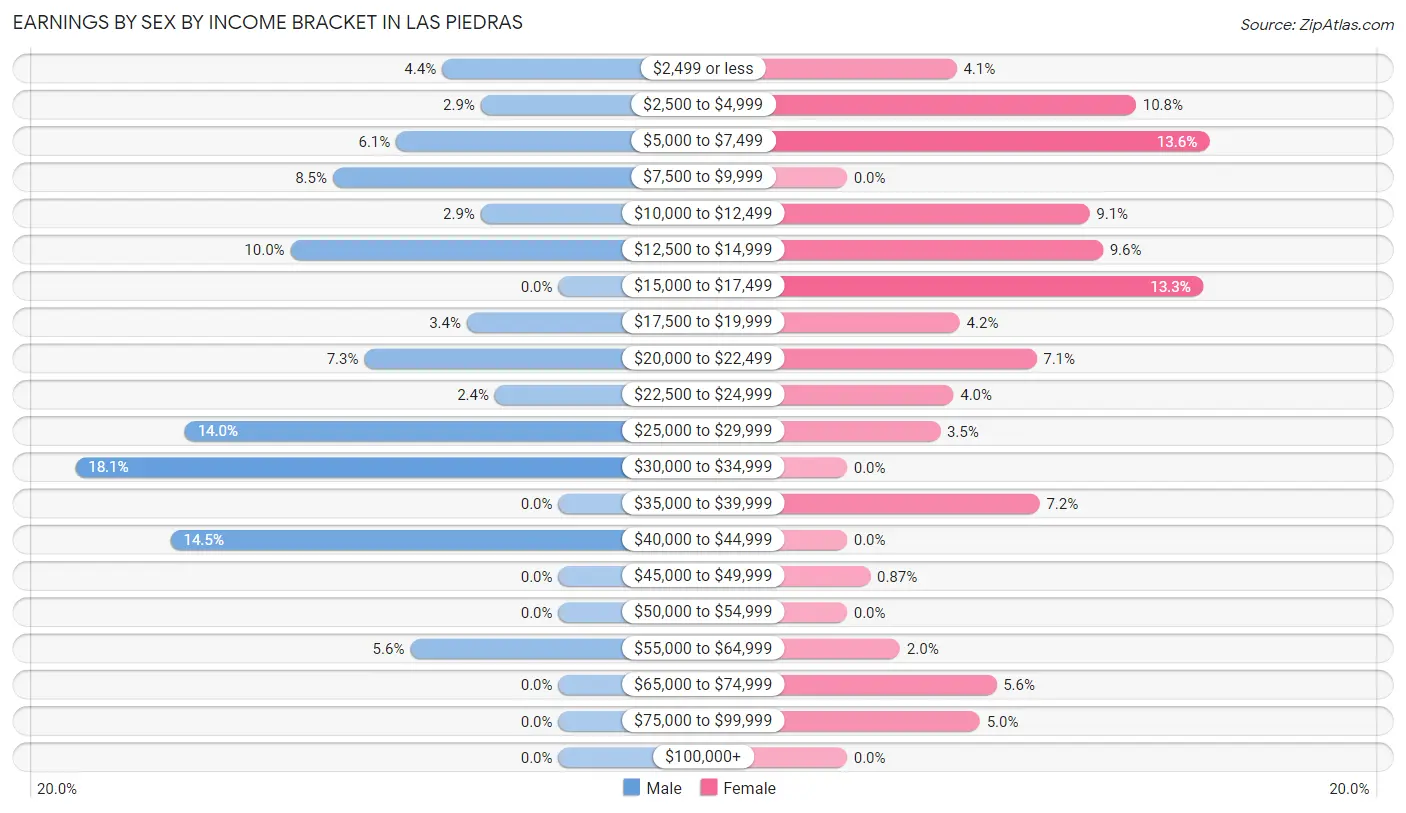
Earnings by Sex by Income Bracket in Las Piedras
The most common earnings brackets in Las Piedras are $30,000 to $34,999 for men (137 | 18.1%) and $5,000 to $7,499 for women (109 | 13.6%).
| Income | Male | Female |
| $2,499 or less | 33 (4.4%) | 33 (4.1%) |
| $2,500 to $4,999 | 22 (2.9%) | 87 (10.8%) |
| $5,000 to $7,499 | 46 (6.1%) | 109 (13.6%) |
| $7,500 to $9,999 | 64 (8.5%) | 0 (0.0%) |
| $10,000 to $12,499 | 22 (2.9%) | 73 (9.1%) |
| $12,500 to $14,999 | 76 (10.0%) | 77 (9.6%) |
| $15,000 to $17,499 | 0 (0.0%) | 107 (13.3%) |
| $17,500 to $19,999 | 26 (3.4%) | 34 (4.2%) |
| $20,000 to $22,499 | 55 (7.3%) | 57 (7.1%) |
| $22,500 to $24,999 | 18 (2.4%) | 32 (4.0%) |
| $25,000 to $29,999 | 106 (14.0%) | 28 (3.5%) |
| $30,000 to $34,999 | 137 (18.1%) | 0 (0.0%) |
| $35,000 to $39,999 | 0 (0.0%) | 58 (7.2%) |
| $40,000 to $44,999 | 110 (14.5%) | 0 (0.0%) |
| $45,000 to $49,999 | 0 (0.0%) | 7 (0.9%) |
| $50,000 to $54,999 | 0 (0.0%) | 0 (0.0%) |
| $55,000 to $64,999 | 42 (5.6%) | 16 (2.0%) |
| $65,000 to $74,999 | 0 (0.0%) | 45 (5.6%) |
| $75,000 to $99,999 | 0 (0.0%) | 40 (5.0%) |
| $100,000+ | 0 (0.0%) | 0 (0.0%) |
| Total | 757 (100.0%) | 803 (100.0%) |
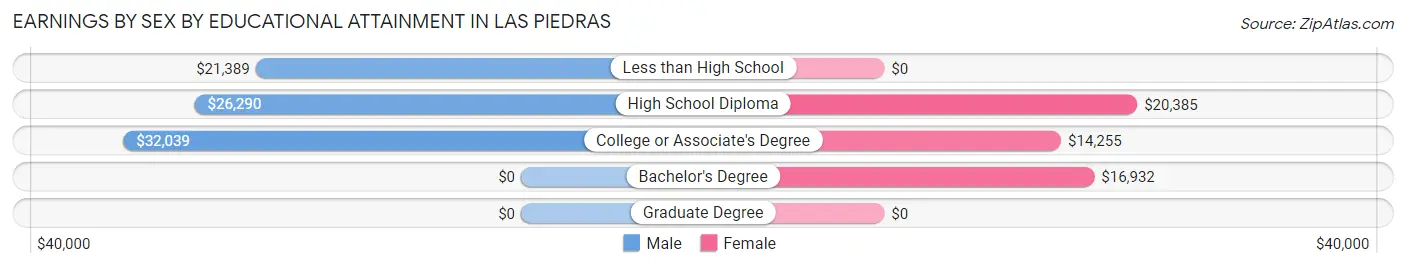
Earnings by Sex by Educational Attainment in Las Piedras
Average earnings in Las Piedras are $27,303 for men and $16,741 for women, a difference of 38.7%. Men with an educational attainment of college or associate's degree enjoy the highest average annual earnings of $32,039, while those with less than high school education earn the least with $21,389. Women with an educational attainment of high school diploma earn the most with the average annual earnings of $20,385, while those with college or associate's degree education have the smallest earnings of $14,255.
| Educational Attainment | Male Income | Female Income |
| Less than High School | $21,389 | $0 |
| High School Diploma | $26,290 | $20,385 |
| College or Associate's Degree | $32,039 | $14,255 |
| Bachelor's Degree | - | - |
| Graduate Degree | - | - |
| Total | $27,303 | $16,741 |
Family Income in Las Piedras
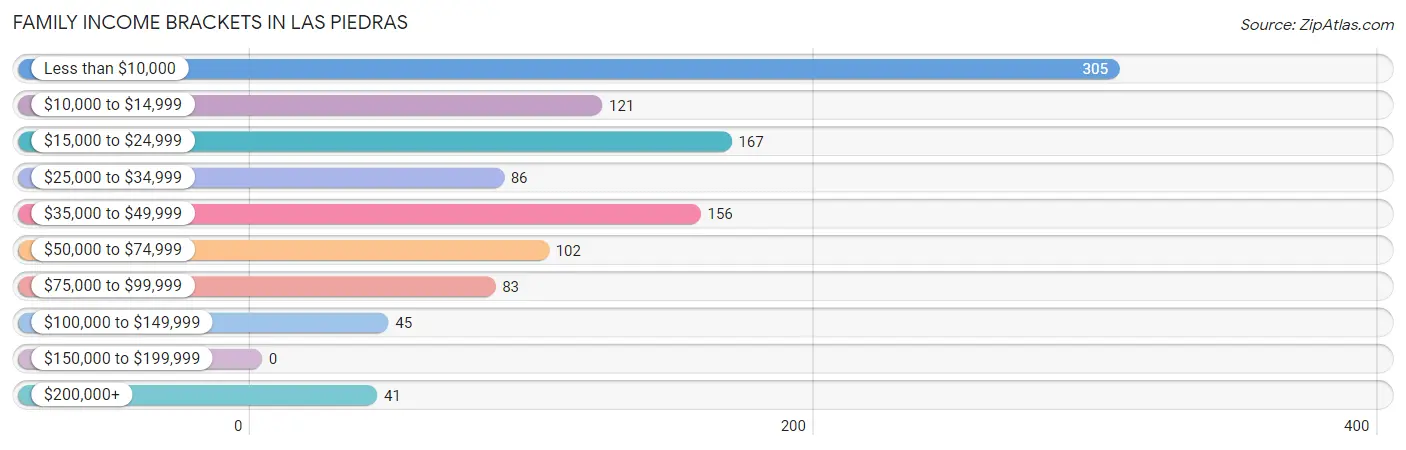
Family Income Brackets in Las Piedras
According to the Las Piedras family income data, there are 305 families falling into the less than $10,000 income range, which is the most common income bracket and makes up 27.6% of all families.
| Income Bracket | # Families | % Families |
| Less than $10,000 | 305 | 27.6% |
| $10,000 to $14,999 | 121 | 10.9% |
| $15,000 to $24,999 | 167 | 15.1% |
| $25,000 to $34,999 | 86 | 7.8% |
| $35,000 to $49,999 | 156 | 14.1% |
| $50,000 to $74,999 | 102 | 9.2% |
| $75,000 to $99,999 | 83 | 7.5% |
| $100,000 to $149,999 | 45 | 4.1% |
| $150,000 to $199,999 | 0 | 0.0% |
| $200,000+ | 41 | 3.7% |
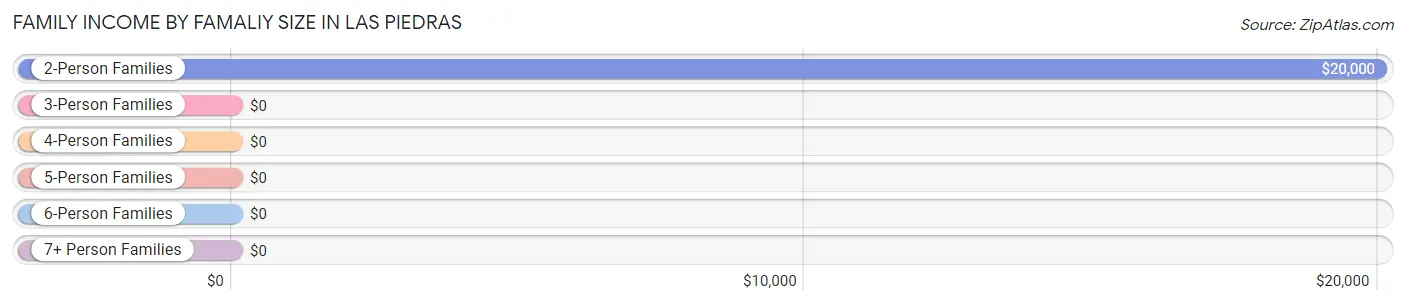
Family Income by Famaliy Size in Las Piedras
2-person families (486 | 43.9%) account for the highest median family income in Las Piedras with $20,000 per family, while 2-person families (486 | 43.9%) have the highest median income of $10,000 per family member.
| Income Bracket | # Families | Median Income |
| 2-Person Families | 486 (43.9%) | $20,000 |
| 3-Person Families | 385 (34.8%) | $0 |
| 4-Person Families | 156 (14.1%) | $0 |
| 5-Person Families | 18 (1.6%) | $0 |
| 6-Person Families | 46 (4.2%) | $0 |
| 7+ Person Families | 15 (1.4%) | $0 |
| Total | 1,106 (100.0%) | $21,250 |
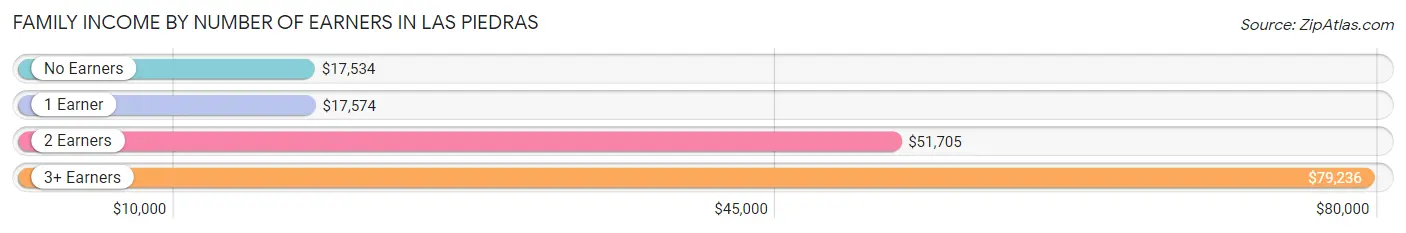
Family Income by Number of Earners in Las Piedras
The median family income in Las Piedras is $21,250, with families comprising 3+ earners (87) having the highest median family income of $79,236, while families with no earners (399) have the lowest median family income of $17,534, accounting for 7.9% and 36.1% of families, respectively.
| Number of Earners | # Families | Median Income |
| No Earners | 399 (36.1%) | $17,534 |
| 1 Earner | 496 (44.9%) | $17,574 |
| 2 Earners | 124 (11.2%) | $51,705 |
| 3+ Earners | 87 (7.9%) | $79,236 |
| Total | 1,106 (100.0%) | $21,250 |
Household Income in Las Piedras
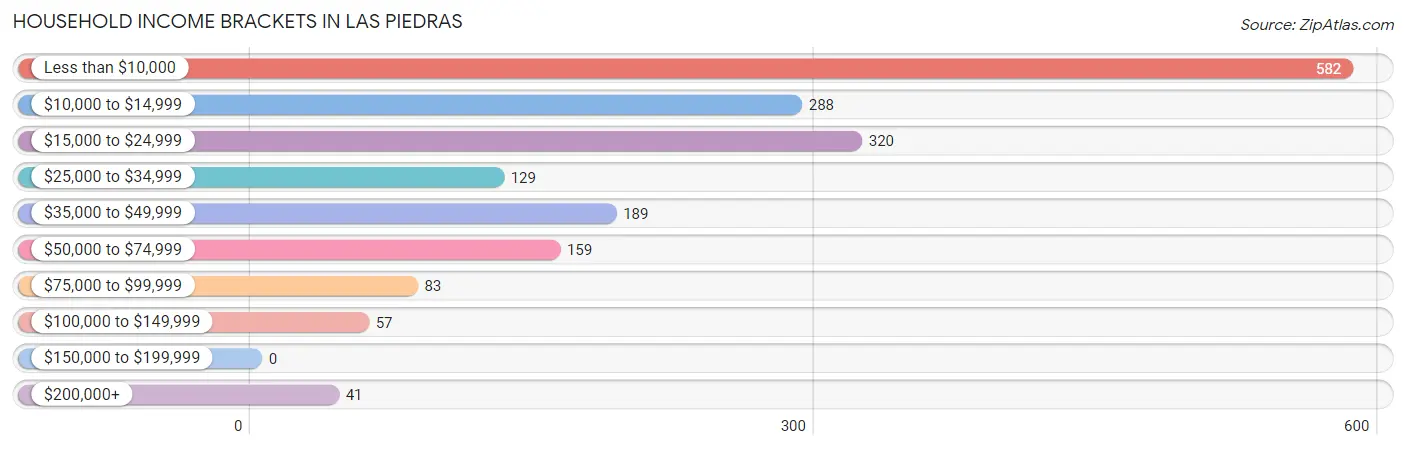
Household Income Brackets in Las Piedras
With 582 households falling in the category, the less than $10,000 income range is the most frequent in Las Piedras, accounting for 31.5% of all households.
| Income Bracket | # Households | % Households |
| Less than $10,000 | 582 | 31.5% |
| $10,000 to $14,999 | 288 | 15.6% |
| $15,000 to $24,999 | 320 | 17.3% |
| $25,000 to $34,999 | 129 | 7.0% |
| $35,000 to $49,999 | 189 | 10.2% |
| $50,000 to $74,999 | 159 | 8.6% |
| $75,000 to $99,999 | 83 | 4.5% |
| $100,000 to $149,999 | 57 | 3.1% |
| $150,000 to $199,999 | 0 | 0.0% |
| $200,000+ | 41 | 2.2% |
Household Income by Householder Age in Las Piedras
The median household income in Las Piedras is $16,631, with the highest median household income of $17,886 found in the 45 to 64 years age bracket for the primary householder. A total of 805 households (43.5%) fall into this category. Meanwhile, the 15 to 24 years age bracket for the primary householder has the lowest median household income of $0, with 24 households (1.3%) in this group.
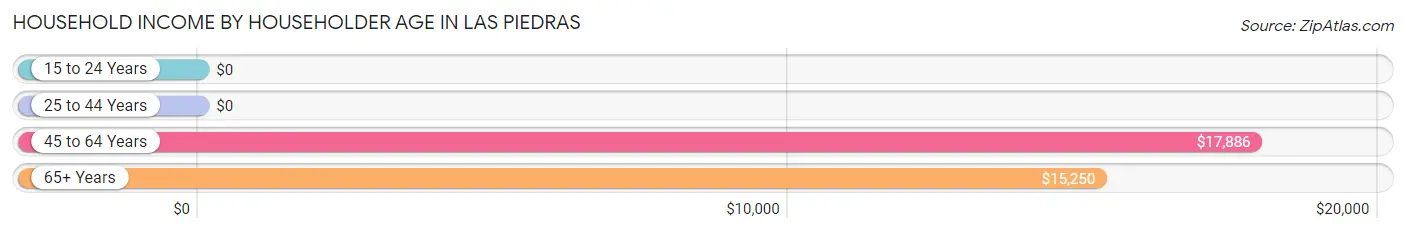
| Income Bracket | # Households | Median Income |
| 15 to 24 Years | 24 (1.3%) | $0 |
| 25 to 44 Years | 380 (20.5%) | $0 |
| 45 to 64 Years | 805 (43.5%) | $17,886 |
| 65+ Years | 640 (34.6%) | $15,250 |
| Total | 1,849 (100.0%) | $16,631 |
Poverty in Las Piedras
Income Below Poverty by Sex and Age in Las Piedras
With 46.5% poverty level for males and 60.6% for females among the residents of Las Piedras, 15 year old males and 5 year old females are the most vulnerable to poverty, with 27 males (100.0%) and 25 females (100.0%) in their respective age groups living below the poverty level.
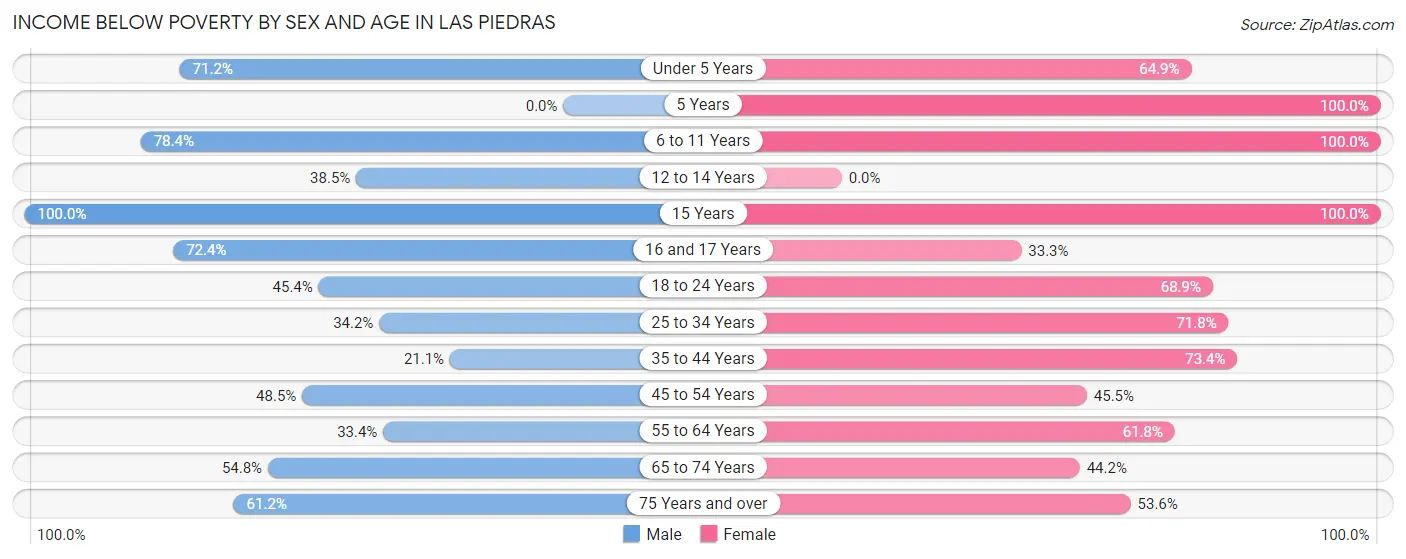
| Age Bracket | Male | Female |
| Under 5 Years | 47 (71.2%) | 109 (64.9%) |
| 5 Years | 0 (0.0%) | 25 (100.0%) |
| 6 to 11 Years | 131 (78.4%) | 147 (100.0%) |
| 12 to 14 Years | 50 (38.5%) | 0 (0.0%) |
| 15 Years | 27 (100.0%) | 26 (100.0%) |
| 16 and 17 Years | 42 (72.4%) | 16 (33.3%) |
| 18 to 24 Years | 164 (45.4%) | 188 (68.9%) |
| 25 to 34 Years | 67 (34.2%) | 272 (71.8%) |
| 35 to 44 Years | 52 (21.0%) | 185 (73.4%) |
| 45 to 54 Years | 144 (48.5%) | 121 (45.5%) |
| 55 to 64 Years | 100 (33.4%) | 275 (61.8%) |
| 65 to 74 Years | 142 (54.8%) | 155 (44.2%) |
| 75 Years and over | 82 (61.2%) | 141 (53.6%) |
| Total | 1,048 (46.5%) | 1,660 (60.6%) |
Income Above Poverty by Sex and Age in Las Piedras
According to the poverty statistics in Las Piedras, males aged 5 years and females aged 12 to 14 years are the age groups that are most secure financially, with 100.0% of males and 100.0% of females in these age groups living above the poverty line.
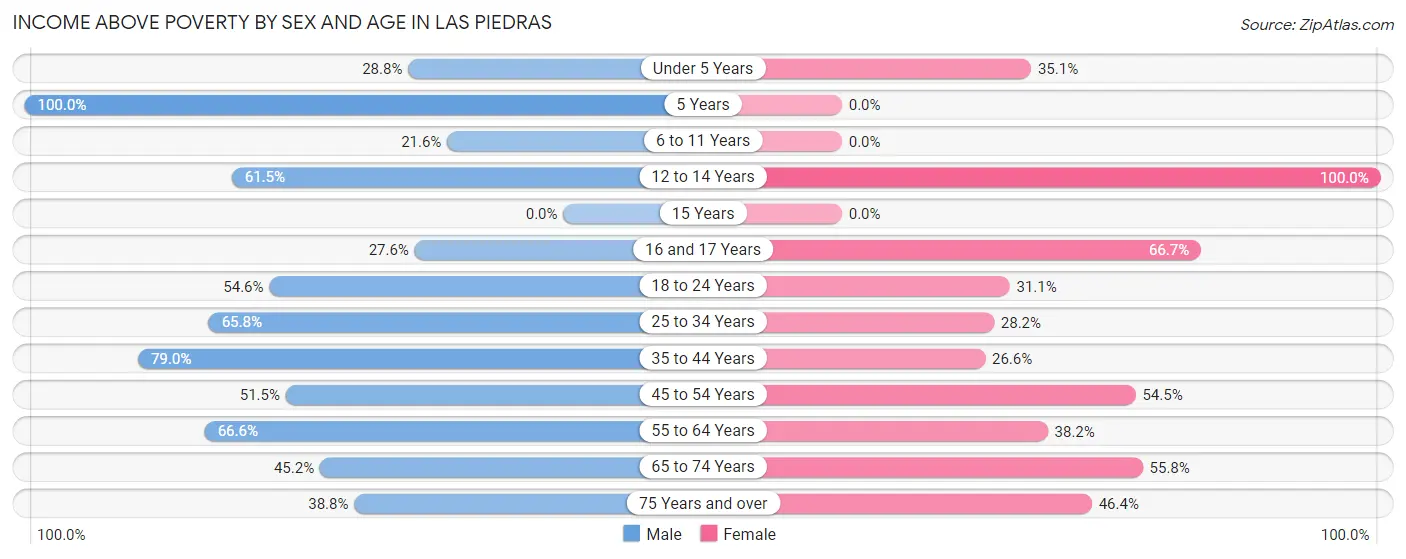
| Age Bracket | Male | Female |
| Under 5 Years | 19 (28.8%) | 59 (35.1%) |
| 5 Years | 14 (100.0%) | 0 (0.0%) |
| 6 to 11 Years | 36 (21.6%) | 0 (0.0%) |
| 12 to 14 Years | 80 (61.5%) | 98 (100.0%) |
| 15 Years | 0 (0.0%) | 0 (0.0%) |
| 16 and 17 Years | 16 (27.6%) | 32 (66.7%) |
| 18 to 24 Years | 197 (54.6%) | 85 (31.1%) |
| 25 to 34 Years | 129 (65.8%) | 107 (28.2%) |
| 35 to 44 Years | 195 (78.9%) | 67 (26.6%) |
| 45 to 54 Years | 153 (51.5%) | 145 (54.5%) |
| 55 to 64 Years | 199 (66.6%) | 170 (38.2%) |
| 65 to 74 Years | 117 (45.2%) | 196 (55.8%) |
| 75 Years and over | 52 (38.8%) | 122 (46.4%) |
| Total | 1,207 (53.5%) | 1,081 (39.4%) |
Income Below Poverty Among Married-Couple Families in Las Piedras
The poverty statistics for married-couple families in Las Piedras show that 29.1% or 133 of the total 457 families live below the poverty line. Families with no children have the highest poverty rate of 31.5%, comprising of 80 families. On the other hand, families with 3 or 4 children have the lowest poverty rate of 0.0%, which includes 0 families.
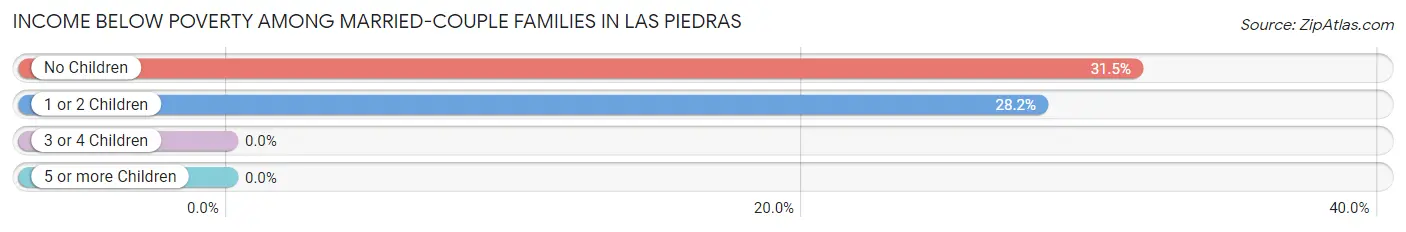
| Children | Above Poverty | Below Poverty |
| No Children | 174 (68.5%) | 80 (31.5%) |
| 1 or 2 Children | 135 (71.8%) | 53 (28.2%) |
| 3 or 4 Children | 15 (100.0%) | 0 (0.0%) |
| 5 or more Children | 0 (0.0%) | 0 (0.0%) |
| Total | 324 (70.9%) | 133 (29.1%) |
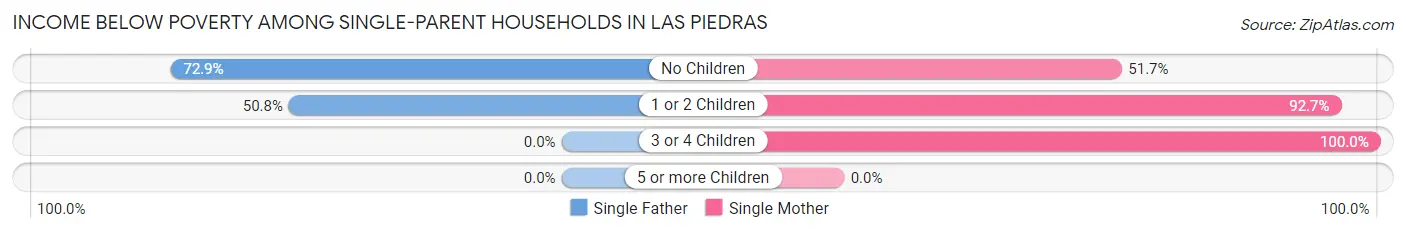
Income Below Poverty Among Single-Parent Households in Las Piedras
According to the poverty data in Las Piedras, 62.4% or 83 single-father households and 70.0% or 361 single-mother households are living below the poverty line. Among single-father households, those with no children have the highest poverty rate, with 51 households (72.9%) experiencing poverty. Likewise, among single-mother households, those with 3 or 4 children have the highest poverty rate, with 21 households (100.0%) falling below the poverty line.
| Children | Single Father | Single Mother |
| No Children | 51 (72.9%) | 150 (51.7%) |
| 1 or 2 Children | 32 (50.8%) | 190 (92.7%) |
| 3 or 4 Children | 0 (0.0%) | 21 (100.0%) |
| 5 or more Children | 0 (0.0%) | 0 (0.0%) |
| Total | 83 (62.4%) | 361 (70.0%) |
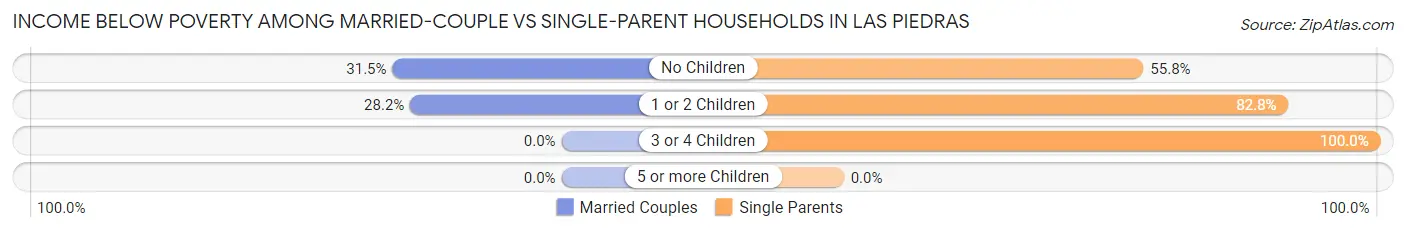
Income Below Poverty Among Married-Couple vs Single-Parent Households in Las Piedras
The poverty data for Las Piedras shows that 133 of the married-couple family households (29.1%) and 444 of the single-parent households (68.4%) are living below the poverty level. Within the married-couple family households, those with no children have the highest poverty rate, with 80 households (31.5%) falling below the poverty line. Among the single-parent households, those with 3 or 4 children have the highest poverty rate, with 21 household (100.0%) living below poverty.
| Children | Married-Couple Families | Single-Parent Households |
| No Children | 80 (31.5%) | 201 (55.8%) |
| 1 or 2 Children | 53 (28.2%) | 222 (82.8%) |
| 3 or 4 Children | 0 (0.0%) | 21 (100.0%) |
| 5 or more Children | 0 (0.0%) | 0 (0.0%) |
| Total | 133 (29.1%) | 444 (68.4%) |
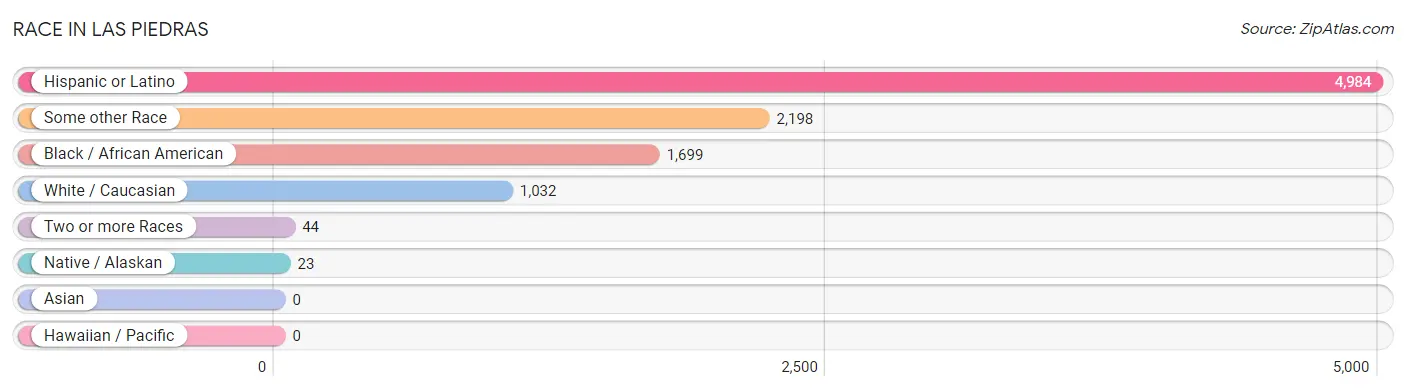
Race in Las Piedras
The most populous races in Las Piedras are Hispanic or Latino (4,984 | 99.8%), Some other Race (2,198 | 44.0%), and Black / African American (1,699 | 34.0%).
| Race | # Population | % Population |
| Asian | 0 | 0.0% |
| Black / African American | 1,699 | 34.0% |
| Hawaiian / Pacific | 0 | 0.0% |
| Hispanic or Latino | 4,984 | 99.8% |
| Native / Alaskan | 23 | 0.5% |
| White / Caucasian | 1,032 | 20.7% |
| Two or more Races | 44 | 0.9% |
| Some other Race | 2,198 | 44.0% |
| Total | 4,996 | 100.0% |
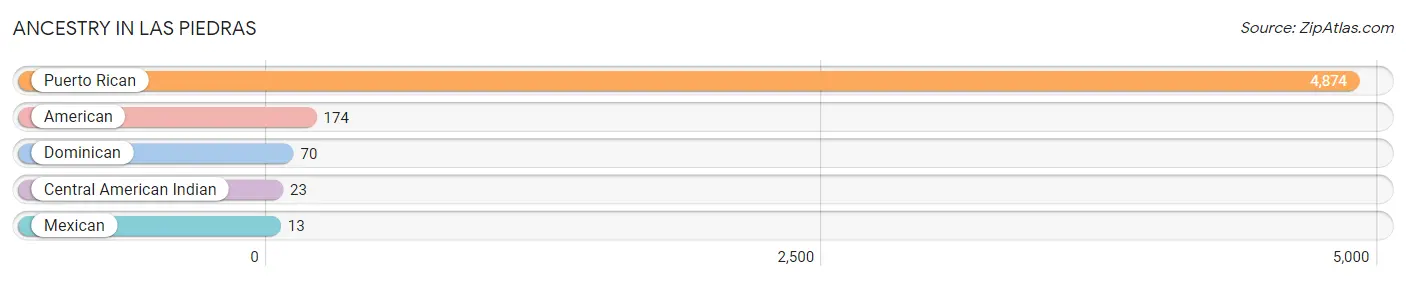
Ancestry in Las Piedras
The most populous ancestries reported in Las Piedras are Puerto Rican (4,874 | 97.6%), American (174 | 3.5%), Dominican (70 | 1.4%), Central American Indian (23 | 0.5%), and Mexican (13 | 0.3%), together accounting for 103.2% of all Las Piedras residents.
| Ancestry | # Population | % Population |
| American | 174 | 3.5% |
| Central American Indian | 23 | 0.5% |
| Dominican | 70 | 1.4% |
| Mexican | 13 | 0.3% |
| Puerto Rican | 4,874 | 97.6% | View All 5 Rows |
Immigrants in Las Piedras

| Immigration Origin | # Population | % Population | View All 0 Rows |
Sex and Age in Las Piedras
Sex and Age in Las Piedras
The most populous age groups in Las Piedras are 20 to 24 Years (234 | 10.4%) for men and 30 to 34 Years (258 | 9.4%) for women.
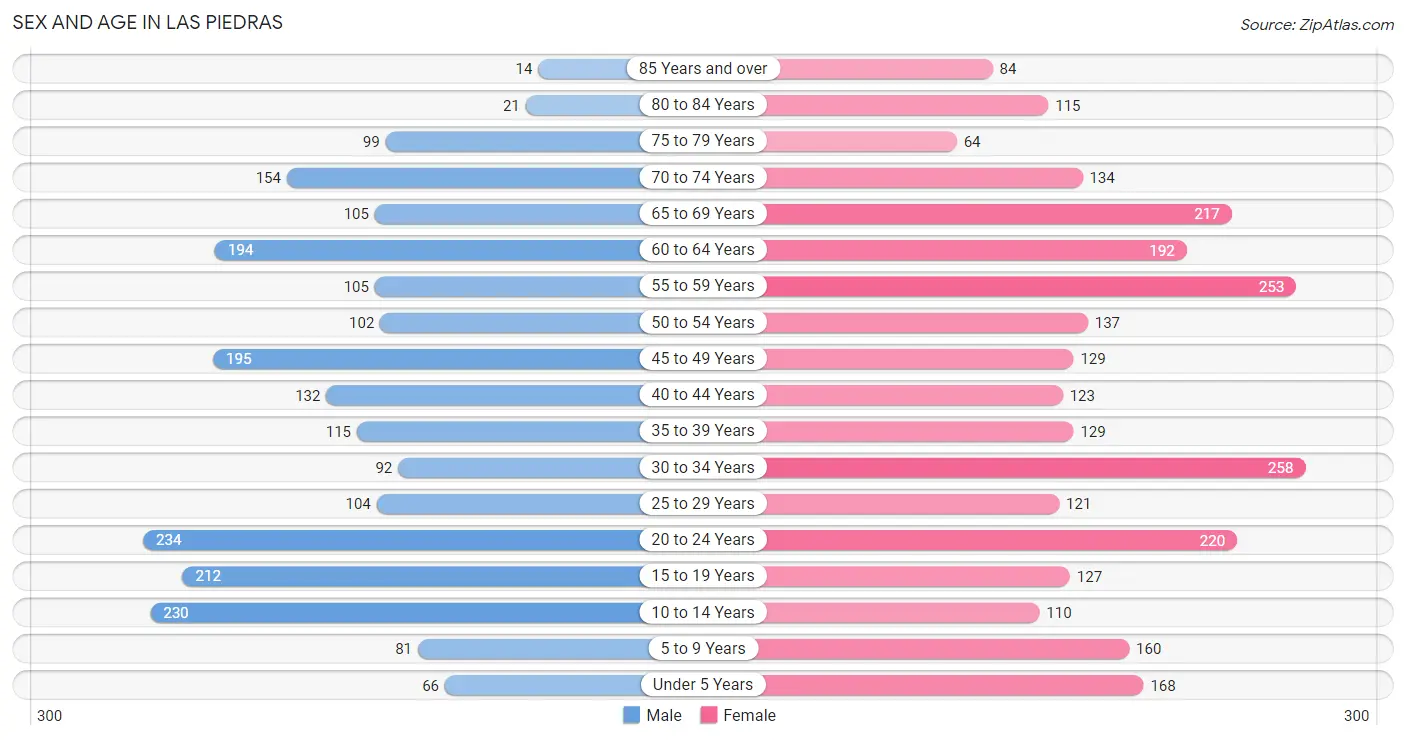
| Age Bracket | Male | Female |
| Under 5 Years | 66 (2.9%) | 168 (6.1%) |
| 5 to 9 Years | 81 (3.6%) | 160 (5.8%) |
| 10 to 14 Years | 230 (10.2%) | 110 (4.0%) |
| 15 to 19 Years | 212 (9.4%) | 127 (4.6%) |
| 20 to 24 Years | 234 (10.4%) | 220 (8.0%) |
| 25 to 29 Years | 104 (4.6%) | 121 (4.4%) |
| 30 to 34 Years | 92 (4.1%) | 258 (9.4%) |
| 35 to 39 Years | 115 (5.1%) | 129 (4.7%) |
| 40 to 44 Years | 132 (5.9%) | 123 (4.5%) |
| 45 to 49 Years | 195 (8.6%) | 129 (4.7%) |
| 50 to 54 Years | 102 (4.5%) | 137 (5.0%) |
| 55 to 59 Years | 105 (4.7%) | 253 (9.2%) |
| 60 to 64 Years | 194 (8.6%) | 192 (7.0%) |
| 65 to 69 Years | 105 (4.7%) | 217 (7.9%) |
| 70 to 74 Years | 154 (6.8%) | 134 (4.9%) |
| 75 to 79 Years | 99 (4.4%) | 64 (2.3%) |
| 80 to 84 Years | 21 (0.9%) | 115 (4.2%) |
| 85 Years and over | 14 (0.6%) | 84 (3.1%) |
| Total | 2,255 (100.0%) | 2,741 (100.0%) |
Families and Households in Las Piedras
Median Family Size in Las Piedras
The median family size in Las Piedras is 3.60 persons per family, with married-couple families (457 | 41.3%) accounting for the largest median family size of 3.98 persons per family. On the other hand, single male/father families (133 | 12.0%) represent the smallest median family size with 3.09 persons per family.
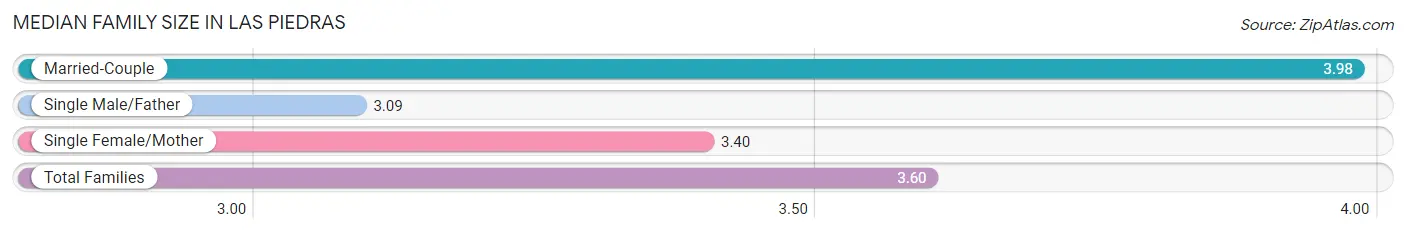
| Family Type | # Families | Family Size |
| Married-Couple | 457 (41.3%) | 3.98 |
| Single Male/Father | 133 (12.0%) | 3.09 |
| Single Female/Mother | 516 (46.7%) | 3.40 |
| Total Families | 1,106 (100.0%) | 3.60 |
Median Household Size in Las Piedras
The median household size in Las Piedras is 2.69 persons per household, with married-couple households (457 | 24.7%) accounting for the largest median household size of 4.14 persons per household. non-family households (743 | 40.2%) represent the smallest median household size with 1.11 persons per household.
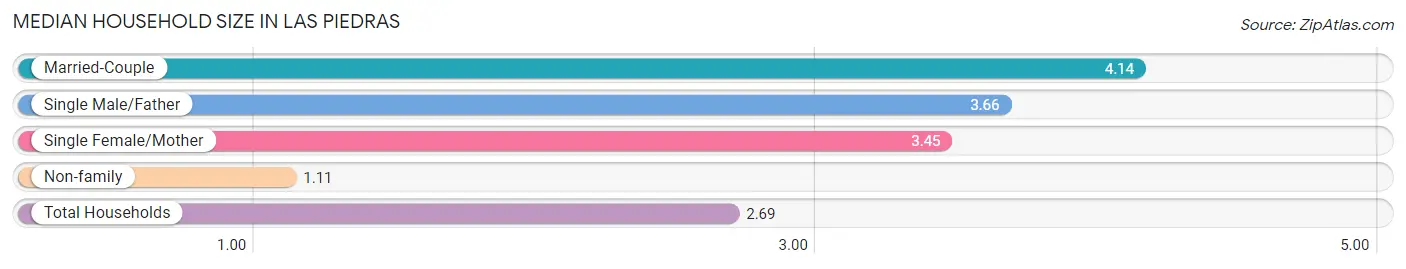
| Household Type | # Households | Household Size |
| Married-Couple | 457 (24.7%) | 4.14 |
| Single Male/Father | 133 (7.2%) | 3.66 |
| Single Female/Mother | 516 (27.9%) | 3.45 |
| Non-family | 743 (40.2%) | 1.11 |
| Total Households | 1,849 (100.0%) | 2.69 |
Household Size by Marriage Status in Las Piedras
Out of a total of 1,849 households in Las Piedras, 1,106 (59.8%) are family households, while 743 (40.2%) are nonfamily households. The most numerous type of family households are 3-person households, comprising 440, and the most common type of nonfamily households are 1-person households, comprising 669.
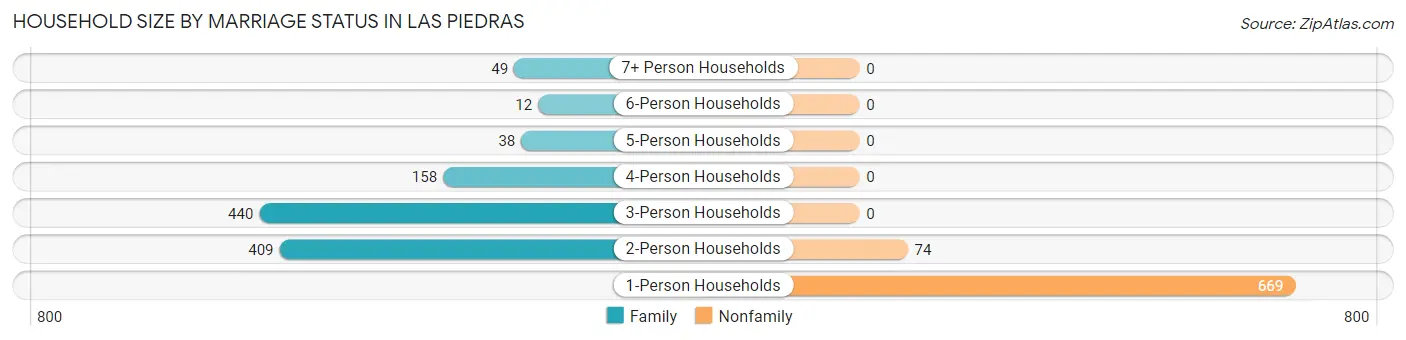
| Household Size | Family Households | Nonfamily Households |
| 1-Person Households | - | 669 (36.2%) |
| 2-Person Households | 409 (22.1%) | 74 (4.0%) |
| 3-Person Households | 440 (23.8%) | 0 (0.0%) |
| 4-Person Households | 158 (8.6%) | 0 (0.0%) |
| 5-Person Households | 38 (2.1%) | 0 (0.0%) |
| 6-Person Households | 12 (0.6%) | 0 (0.0%) |
| 7+ Person Households | 49 (2.6%) | 0 (0.0%) |
| Total | 1,106 (59.8%) | 743 (40.2%) |
Female Fertility in Las Piedras
Fertility by Age in Las Piedras
Average fertility rate in Las Piedras is 33.0 births per 1,000 women. Women in the age bracket of 20 to 34 years have the highest fertility rate with 62.0 births per 1,000 women. Women in the age bracket of 20 to 34 years acount for 100.0% of all women with births.
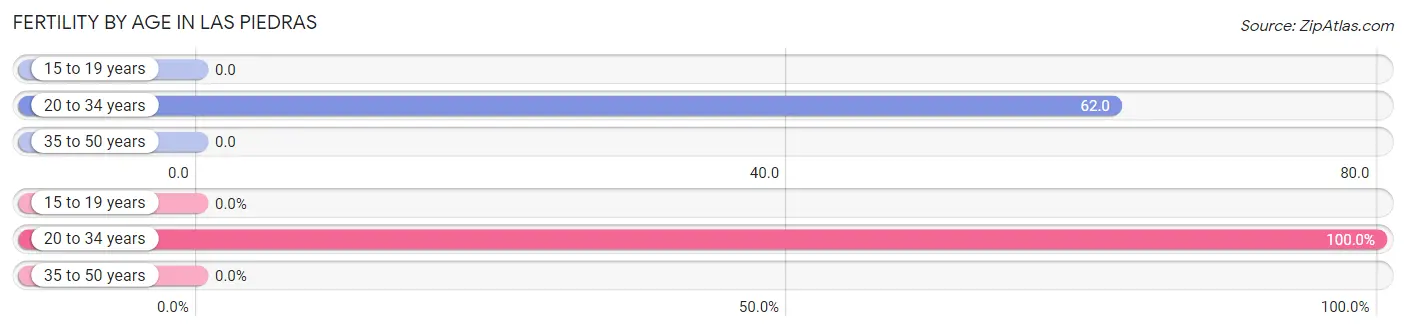
| Age Bracket | Women with Births | Births / 1,000 Women |
| 15 to 19 years | 0 (0.0%) | 0.0 |
| 20 to 34 years | 37 (100.0%) | 62.0 |
| 35 to 50 years | 0 (0.0%) | 0.0 |
| Total | 37 (100.0%) | 33.0 |
Fertility by Age by Marriage Status in Las Piedras
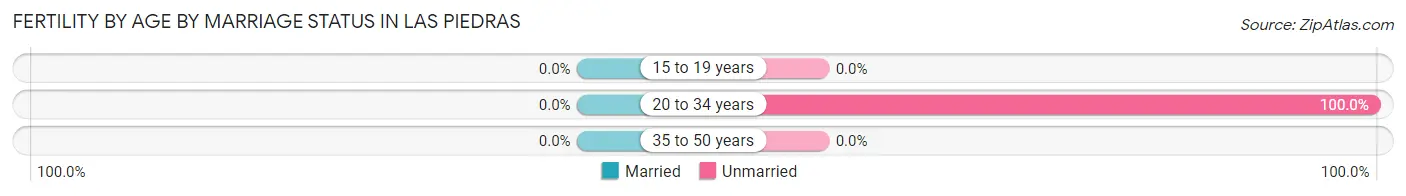
| Age Bracket | Married | Unmarried |
| 15 to 19 years | 0 (0.0%) | 0 (0.0%) |
| 20 to 34 years | 0 (0.0%) | 37 (100.0%) |
| 35 to 50 years | 0 (0.0%) | 0 (0.0%) |
| Total | 0 (0.0%) | 37 (100.0%) |
Fertility by Education in Las Piedras
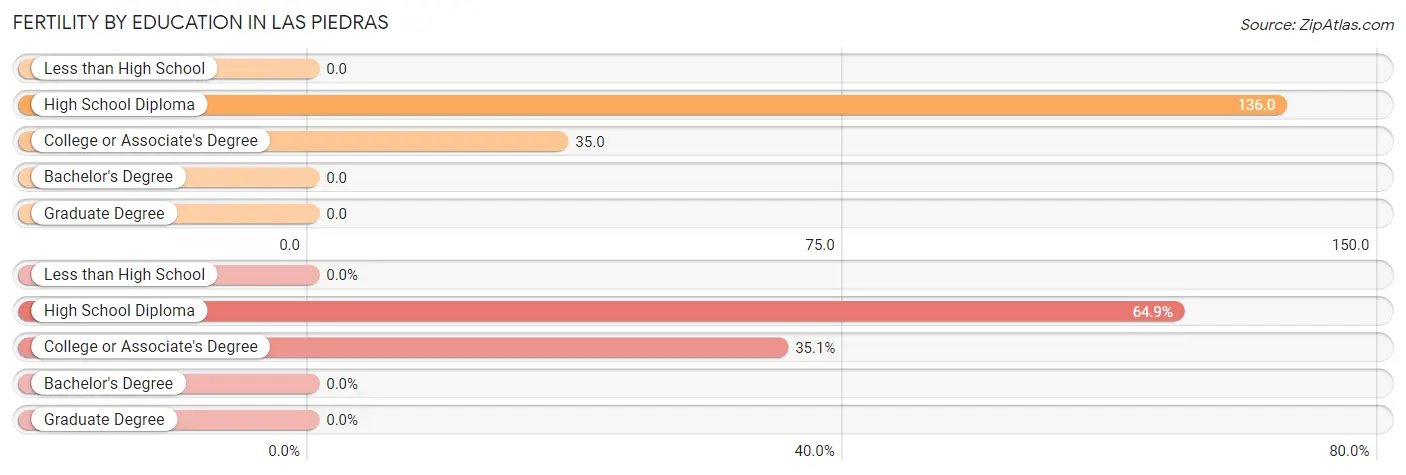
| Educational Attainment | Women with Births | Births / 1,000 Women |
| Less than High School | 0 (0.0%) | 0.0 |
| High School Diploma | 24 (64.9%) | 136.0 |
| College or Associate's Degree | 13 (35.1%) | 35.0 |
| Bachelor's Degree | 0 (0.0%) | 0.0 |
| Graduate Degree | 0 (0.0%) | 0.0 |
| Total | 37 (100.0%) | 33.0 |
Fertility by Education by Marriage Status in Las Piedras
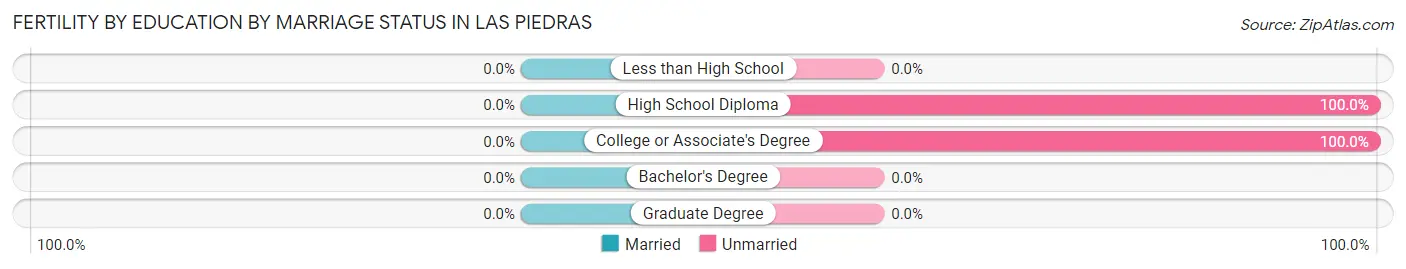
| Educational Attainment | Married | Unmarried |
| Less than High School | 0 (0.0%) | 0 (0.0%) |
| High School Diploma | 0 (0.0%) | 24 (100.0%) |
| College or Associate's Degree | 0 (0.0%) | 13 (100.0%) |
| Bachelor's Degree | 0 (0.0%) | 0 (0.0%) |
| Graduate Degree | 0 (0.0%) | 0 (0.0%) |
| Total | 0 (0.0%) | 37 (100.0%) |
Employment Characteristics in Las Piedras
Employment by Class of Employer in Las Piedras
Among the 1,407 employed individuals in Las Piedras, private company employees (802 | 57.0%), state government employees (266 | 18.9%), and self-employed (not incorporated) (137 | 9.7%) make up the most common classes of employment.
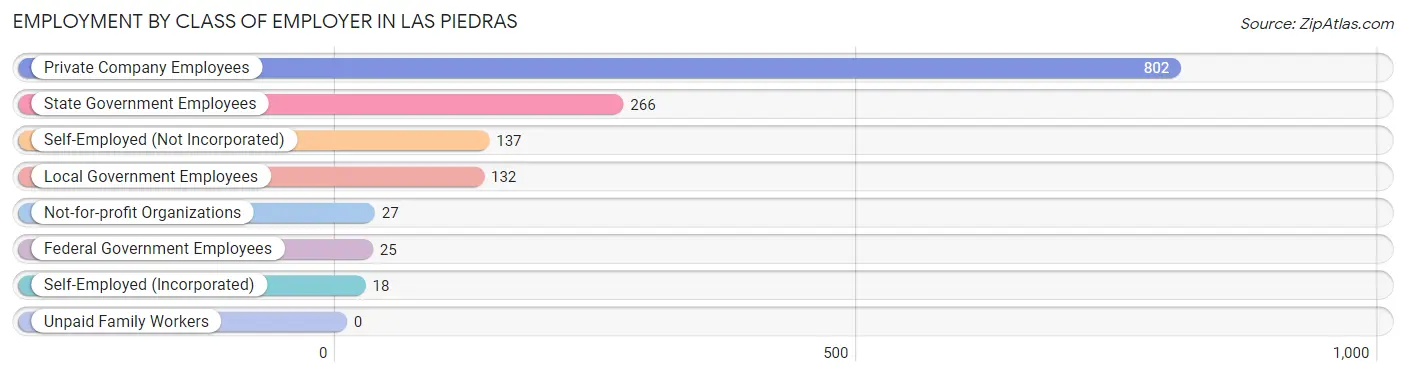
| Employer Class | # Employees | % Employees |
| Private Company Employees | 802 | 57.0% |
| Self-Employed (Incorporated) | 18 | 1.3% |
| Self-Employed (Not Incorporated) | 137 | 9.7% |
| Not-for-profit Organizations | 27 | 1.9% |
| Local Government Employees | 132 | 9.4% |
| State Government Employees | 266 | 18.9% |
| Federal Government Employees | 25 | 1.8% |
| Unpaid Family Workers | 0 | 0.0% |
| Total | 1,407 | 100.0% |
Employment Status by Age in Las Piedras
According to the labor force statistics for Las Piedras, out of the total population over 16 years of age (4,128), 41.6% or 1,717 individuals are in the labor force, with 13.4% or 230 of them unemployed. The age group with the highest labor force participation rate is 30 to 34 years, with 94.6% or 331 individuals in the labor force. Within the labor force, the 16 to 19 years age range has the highest percentage of unemployed individuals, with 100.0% or 59 of them being unemployed.
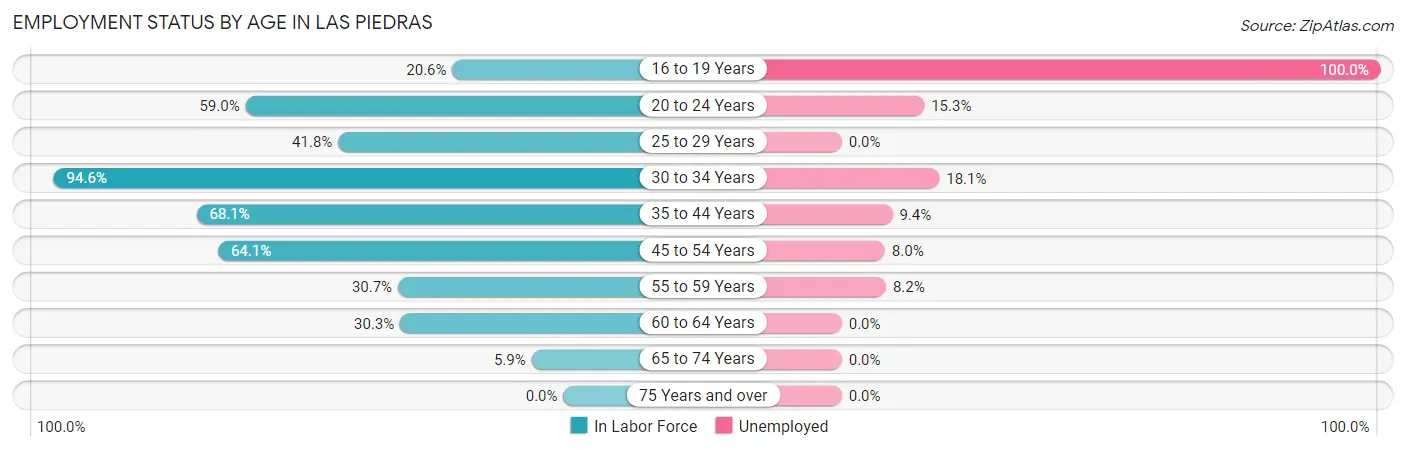
| Age Bracket | In Labor Force | Unemployed |
| 16 to 19 Years | 59 (20.6%) | 59 (100.0%) |
| 20 to 24 Years | 268 (59.0%) | 41 (15.3%) |
| 25 to 29 Years | 94 (41.8%) | 0 (0.0%) |
| 30 to 34 Years | 331 (94.6%) | 60 (18.1%) |
| 35 to 44 Years | 340 (68.1%) | 32 (9.4%) |
| 45 to 54 Years | 361 (64.1%) | 29 (8.0%) |
| 55 to 59 Years | 110 (30.7%) | 9 (8.2%) |
| 60 to 64 Years | 117 (30.3%) | 0 (0.0%) |
| 65 to 74 Years | 36 (5.9%) | 0 (0.0%) |
| 75 Years and over | 0 (0.0%) | 0 (0.0%) |
| Total | 1,717 (41.6%) | 230 (13.4%) |
Employment Status by Educational Attainment in Las Piedras
According to labor force statistics for Las Piedras, 56.8% of individuals (1,352) out of the total population between 25 and 64 years of age (2,381) are in the labor force, with 9.6% or 130 of them being unemployed. The group with the highest labor force participation rate are those with the educational attainment of bachelor's degree or higher, with 72.6% or 590 individuals in the labor force. Within the labor force, individuals with high school diploma education have the highest percentage of unemployment, with 26.4% or 48 of them being unemployed.
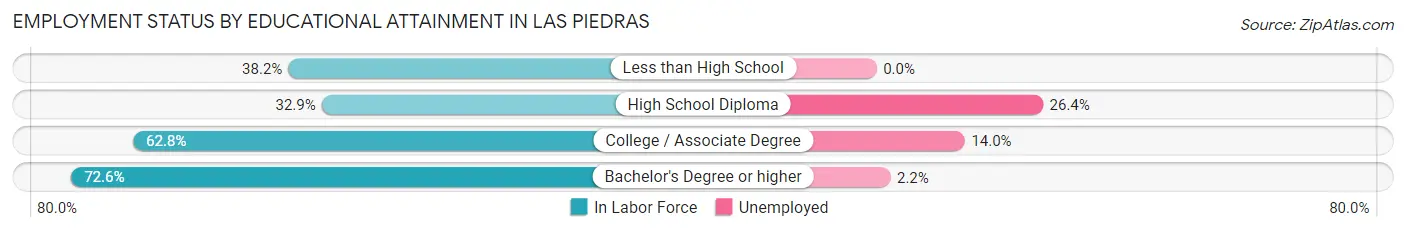
| Educational Attainment | In Labor Force | Unemployed |
| Less than High School | 87 (38.2%) | 0 (0.0%) |
| High School Diploma | 182 (32.9%) | 146 (26.4%) |
| College / Associate Degree | 494 (62.8%) | 110 (14.0%) |
| Bachelor's Degree or higher | 590 (72.6%) | 18 (2.2%) |
| Total | 1,352 (56.8%) | 229 (9.6%) |
Employment Occupations by Sex in Las Piedras
Management, Business, Science and Arts Occupations
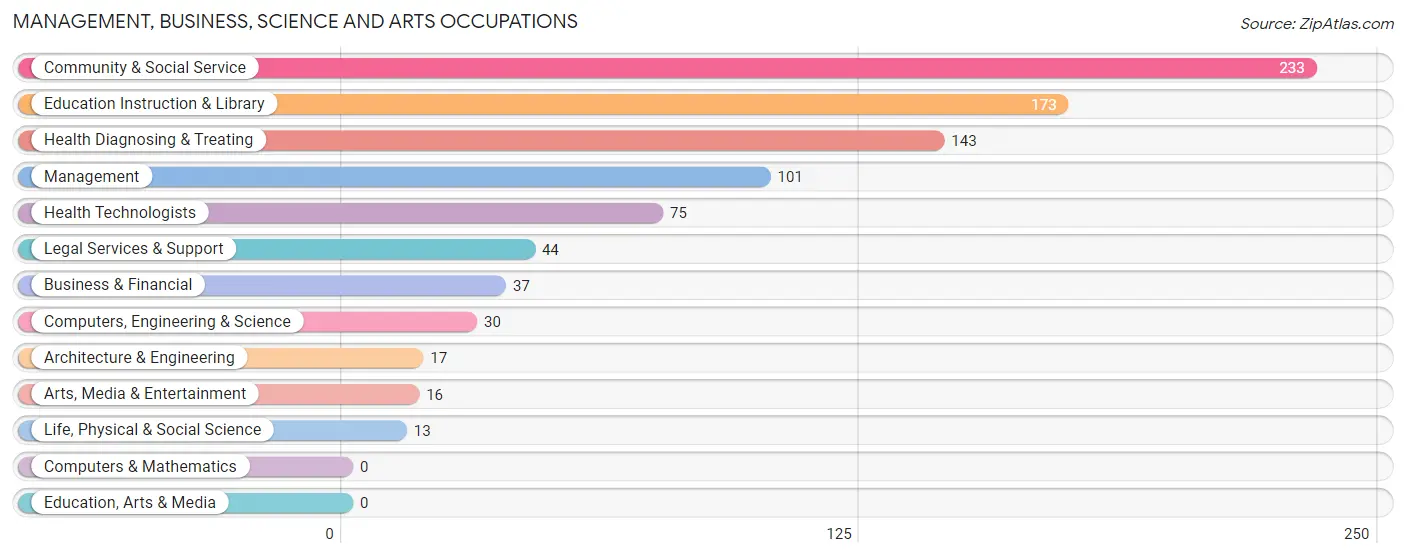
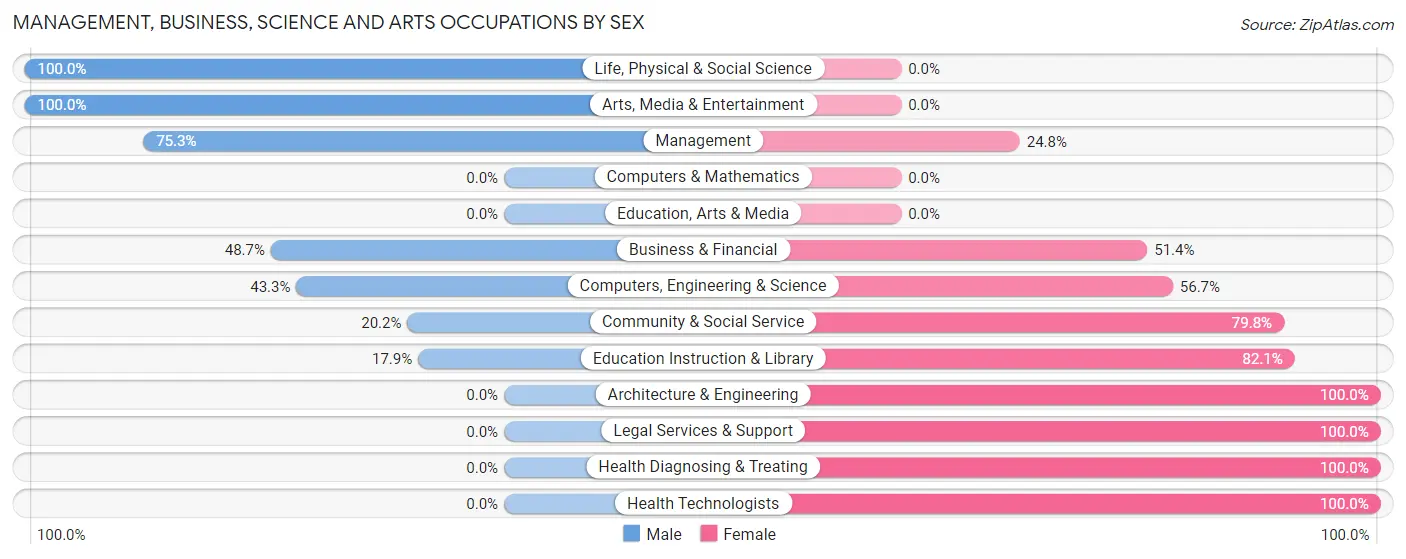
The most common Management, Business, Science and Arts occupations in Las Piedras are Community & Social Service (233 | 15.7%), Education Instruction & Library (173 | 11.6%), Health Diagnosing & Treating (143 | 9.6%), Management (101 | 6.8%), and Health Technologists (75 | 5.1%).
Management, Business, Science and Arts Occupations by Sex
Within the Management, Business, Science and Arts occupations in Las Piedras, the most male-oriented occupations are Life, Physical & Social Science (100.0%), Arts, Media & Entertainment (100.0%), and Management (75.2%), while the most female-oriented occupations are Architecture & Engineering (100.0%), Legal Services & Support (100.0%), and Health Diagnosing & Treating (100.0%).
| Occupation | Male | Female |
| Management | 76 (75.2%) | 25 (24.7%) |
| Business & Financial | 18 (48.6%) | 19 (51.3%) |
| Computers, Engineering & Science | 13 (43.3%) | 17 (56.7%) |
| Computers & Mathematics | 0 (0.0%) | 0 (0.0%) |
| Architecture & Engineering | 0 (0.0%) | 17 (100.0%) |
| Life, Physical & Social Science | 13 (100.0%) | 0 (0.0%) |
| Community & Social Service | 47 (20.2%) | 186 (79.8%) |
| Education, Arts & Media | 0 (0.0%) | 0 (0.0%) |
| Legal Services & Support | 0 (0.0%) | 44 (100.0%) |
| Education Instruction & Library | 31 (17.9%) | 142 (82.1%) |
| Arts, Media & Entertainment | 16 (100.0%) | 0 (0.0%) |
| Health Diagnosing & Treating | 0 (0.0%) | 143 (100.0%) |
| Health Technologists | 0 (0.0%) | 75 (100.0%) |
| Total (Category) | 154 (28.3%) | 390 (71.7%) |
| Total (Overall) | 696 (46.8%) | 790 (53.2%) |
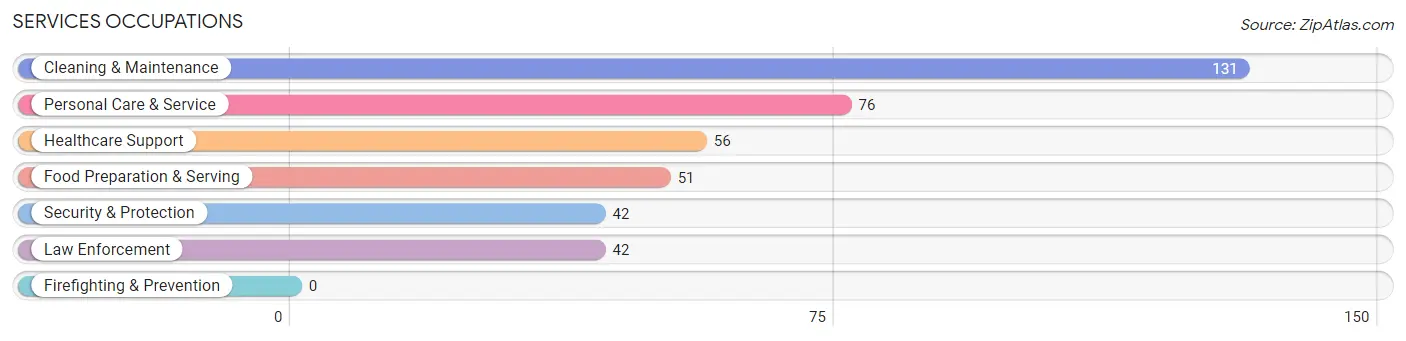
Services Occupations
The most common Services occupations in Las Piedras are Cleaning & Maintenance (131 | 8.8%), Personal Care & Service (76 | 5.1%), Healthcare Support (56 | 3.8%), Food Preparation & Serving (51 | 3.4%), and Security & Protection (42 | 2.8%).
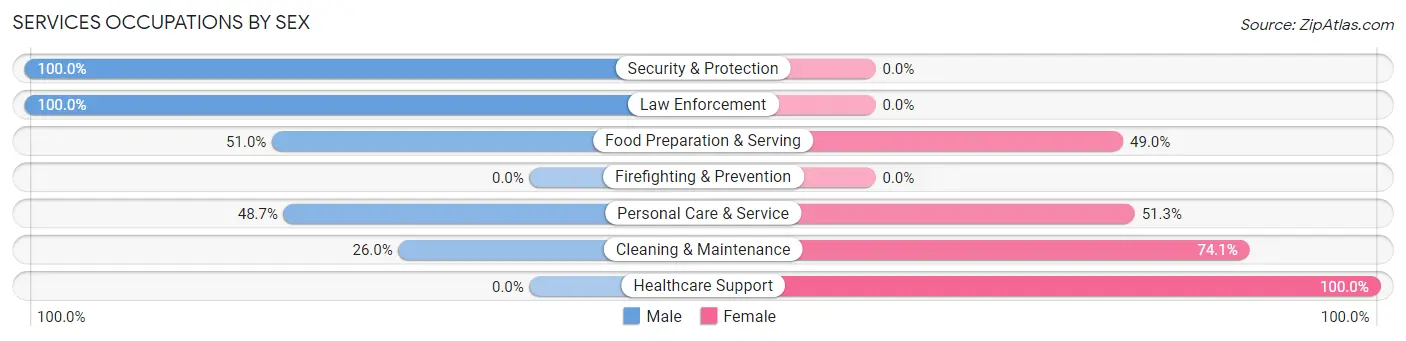
Services Occupations by Sex
Within the Services occupations in Las Piedras, the most male-oriented occupations are Security & Protection (100.0%), Law Enforcement (100.0%), and Food Preparation & Serving (51.0%), while the most female-oriented occupations are Healthcare Support (100.0%), Cleaning & Maintenance (74.1%), and Personal Care & Service (51.3%).
| Occupation | Male | Female |
| Healthcare Support | 0 (0.0%) | 56 (100.0%) |
| Security & Protection | 42 (100.0%) | 0 (0.0%) |
| Firefighting & Prevention | 0 (0.0%) | 0 (0.0%) |
| Law Enforcement | 42 (100.0%) | 0 (0.0%) |
| Food Preparation & Serving | 26 (51.0%) | 25 (49.0%) |
| Cleaning & Maintenance | 34 (26.0%) | 97 (74.1%) |
| Personal Care & Service | 37 (48.7%) | 39 (51.3%) |
| Total (Category) | 139 (39.0%) | 217 (61.0%) |
| Total (Overall) | 696 (46.8%) | 790 (53.2%) |
Sales and Office Occupations
The most common Sales and Office occupations in Las Piedras are Sales & Related (135 | 9.1%), and Office & Administration (96 | 6.5%).

Sales and Office Occupations by Sex

| Occupation | Male | Female |
| Sales & Related | 85 (63.0%) | 50 (37.0%) |
| Office & Administration | 12 (12.5%) | 84 (87.5%) |
| Total (Category) | 97 (42.0%) | 134 (58.0%) |
| Total (Overall) | 696 (46.8%) | 790 (53.2%) |
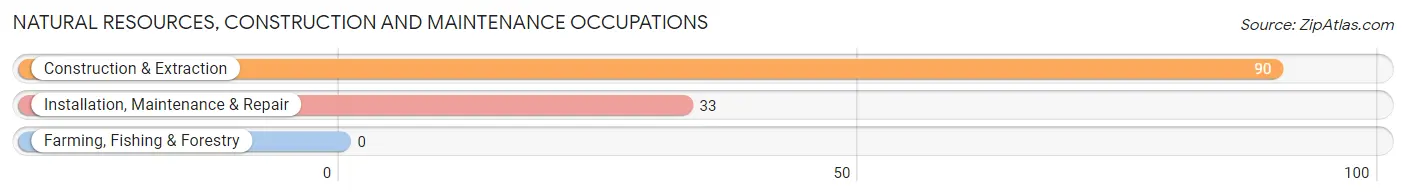
Natural Resources, Construction and Maintenance Occupations
The most common Natural Resources, Construction and Maintenance occupations in Las Piedras are Construction & Extraction (90 | 6.1%), and Installation, Maintenance & Repair (33 | 2.2%).
Natural Resources, Construction and Maintenance Occupations by Sex

| Occupation | Male | Female |
| Farming, Fishing & Forestry | 0 (0.0%) | 0 (0.0%) |
| Construction & Extraction | 90 (100.0%) | 0 (0.0%) |
| Installation, Maintenance & Repair | 33 (100.0%) | 0 (0.0%) |
| Total (Category) | 123 (100.0%) | 0 (0.0%) |
| Total (Overall) | 696 (46.8%) | 790 (53.2%) |
Production, Transportation and Moving Occupations
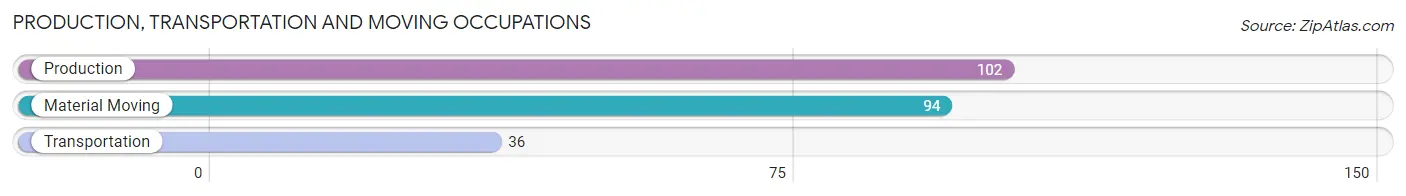
The most common Production, Transportation and Moving occupations in Las Piedras are Production (102 | 6.9%), Material Moving (94 | 6.3%), and Transportation (36 | 2.4%).
Production, Transportation and Moving Occupations by Sex
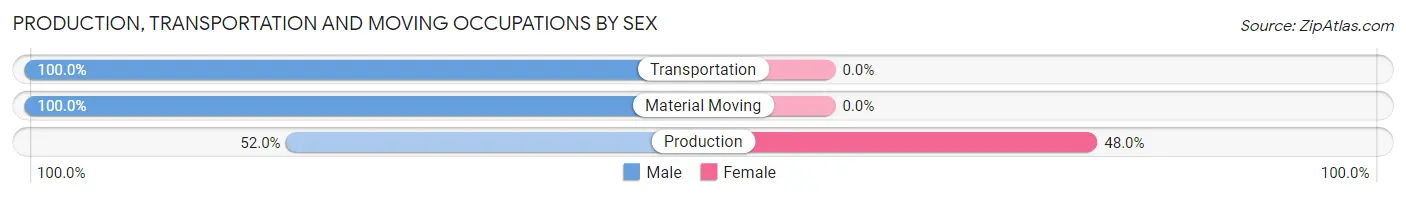
| Occupation | Male | Female |
| Production | 53 (52.0%) | 49 (48.0%) |
| Transportation | 36 (100.0%) | 0 (0.0%) |
| Material Moving | 94 (100.0%) | 0 (0.0%) |
| Total (Category) | 183 (78.9%) | 49 (21.1%) |
| Total (Overall) | 696 (46.8%) | 790 (53.2%) |
Employment Industries by Sex in Las Piedras
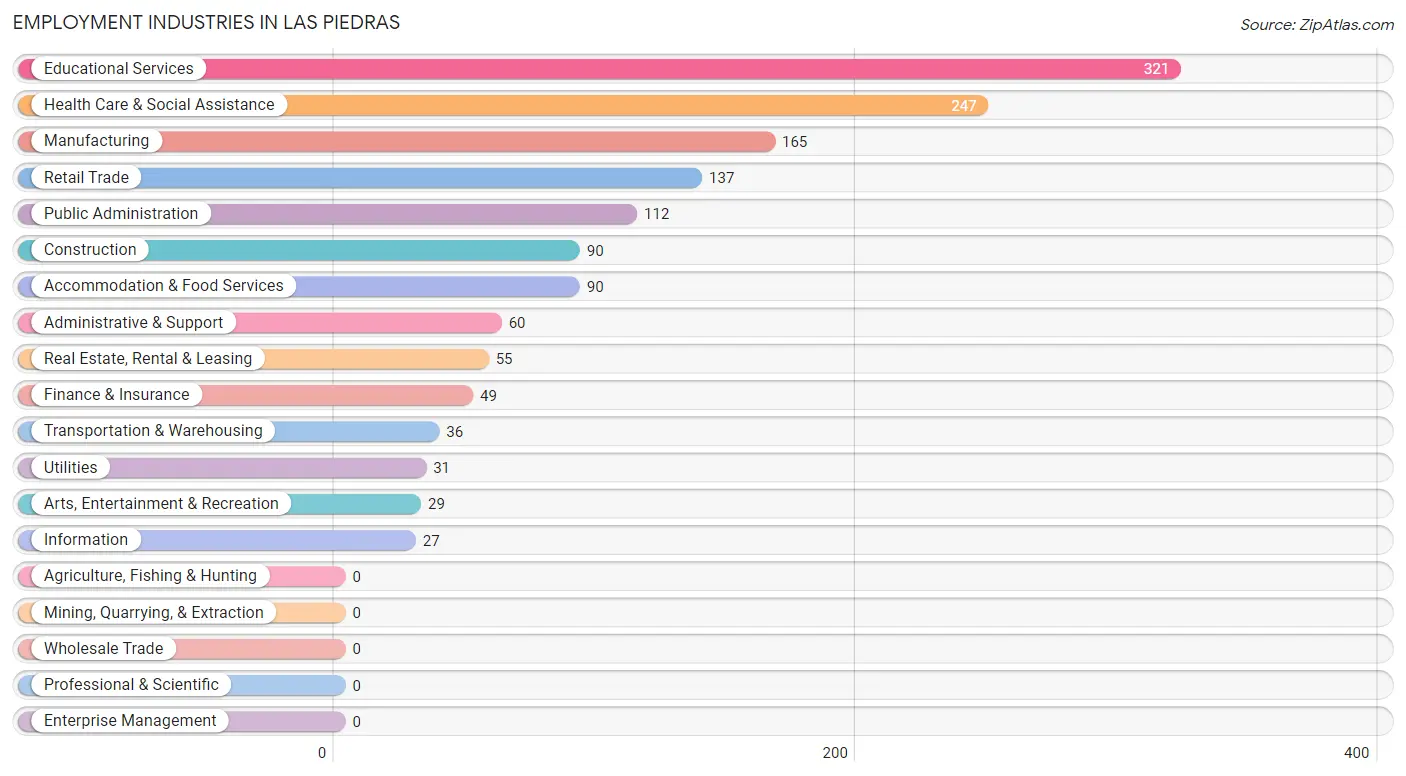
Employment Industries in Las Piedras
The major employment industries in Las Piedras include Educational Services (321 | 21.6%), Health Care & Social Assistance (247 | 16.6%), Manufacturing (165 | 11.1%), Retail Trade (137 | 9.2%), and Public Administration (112 | 7.5%).
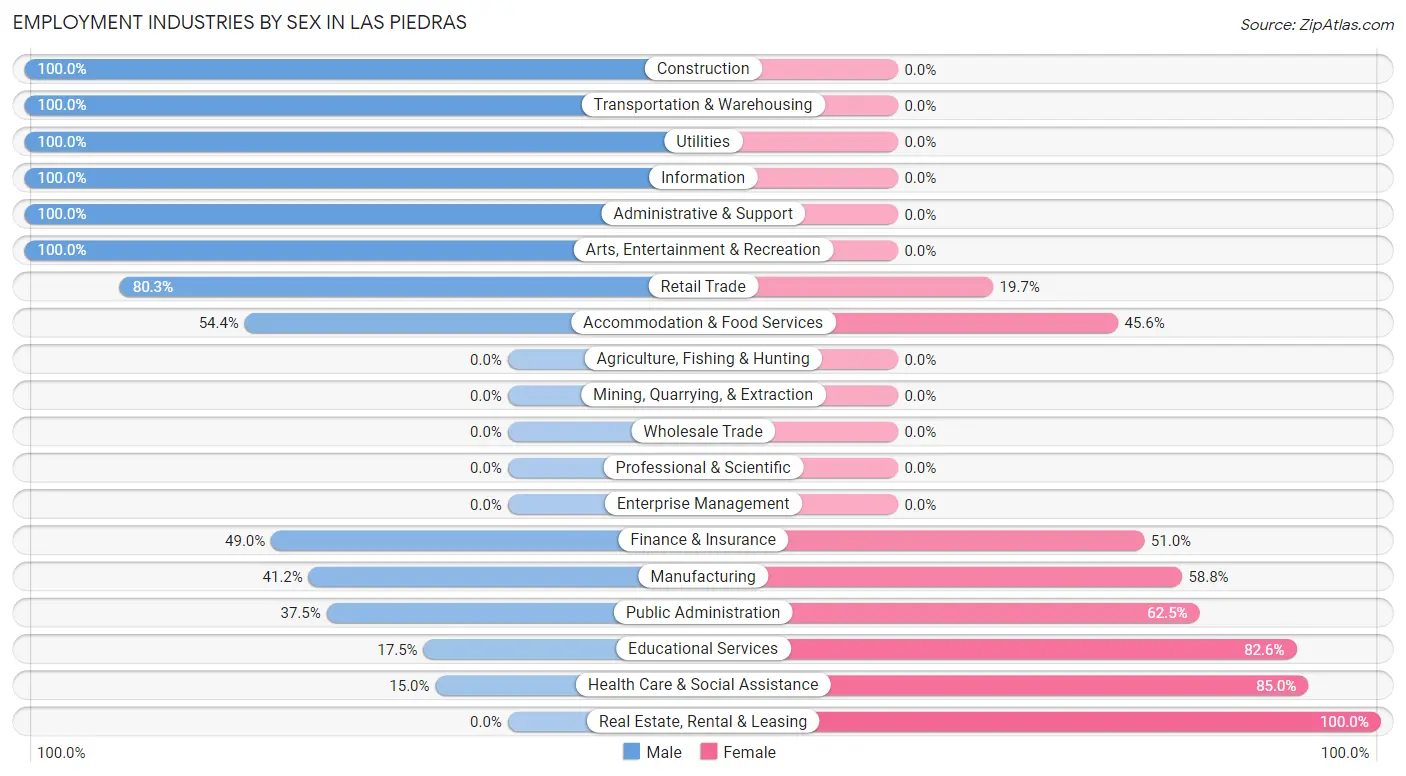
Employment Industries by Sex in Las Piedras
The Las Piedras industries that see more men than women are Construction (100.0%), Transportation & Warehousing (100.0%), and Utilities (100.0%), whereas the industries that tend to have a higher number of women are Real Estate, Rental & Leasing (100.0%), Health Care & Social Assistance (85.0%), and Educational Services (82.6%).
| Industry | Male | Female |
| Agriculture, Fishing & Hunting | 0 (0.0%) | 0 (0.0%) |
| Mining, Quarrying, & Extraction | 0 (0.0%) | 0 (0.0%) |
| Construction | 90 (100.0%) | 0 (0.0%) |
| Manufacturing | 68 (41.2%) | 97 (58.8%) |
| Wholesale Trade | 0 (0.0%) | 0 (0.0%) |
| Retail Trade | 110 (80.3%) | 27 (19.7%) |
| Transportation & Warehousing | 36 (100.0%) | 0 (0.0%) |
| Utilities | 31 (100.0%) | 0 (0.0%) |
| Information | 27 (100.0%) | 0 (0.0%) |
| Finance & Insurance | 24 (49.0%) | 25 (51.0%) |
| Real Estate, Rental & Leasing | 0 (0.0%) | 55 (100.0%) |
| Professional & Scientific | 0 (0.0%) | 0 (0.0%) |
| Enterprise Management | 0 (0.0%) | 0 (0.0%) |
| Administrative & Support | 60 (100.0%) | 0 (0.0%) |
| Educational Services | 56 (17.4%) | 265 (82.6%) |
| Health Care & Social Assistance | 37 (15.0%) | 210 (85.0%) |
| Arts, Entertainment & Recreation | 29 (100.0%) | 0 (0.0%) |
| Accommodation & Food Services | 49 (54.4%) | 41 (45.6%) |
| Public Administration | 42 (37.5%) | 70 (62.5%) |
| Total | 696 (46.8%) | 790 (53.2%) |
Education in Las Piedras
School Enrollment in Las Piedras
The most common levels of schooling among the 1,271 students in Las Piedras are college / undergraduate (316 | 24.9%), middle school (264 | 20.8%), and high school (244 | 19.2%).
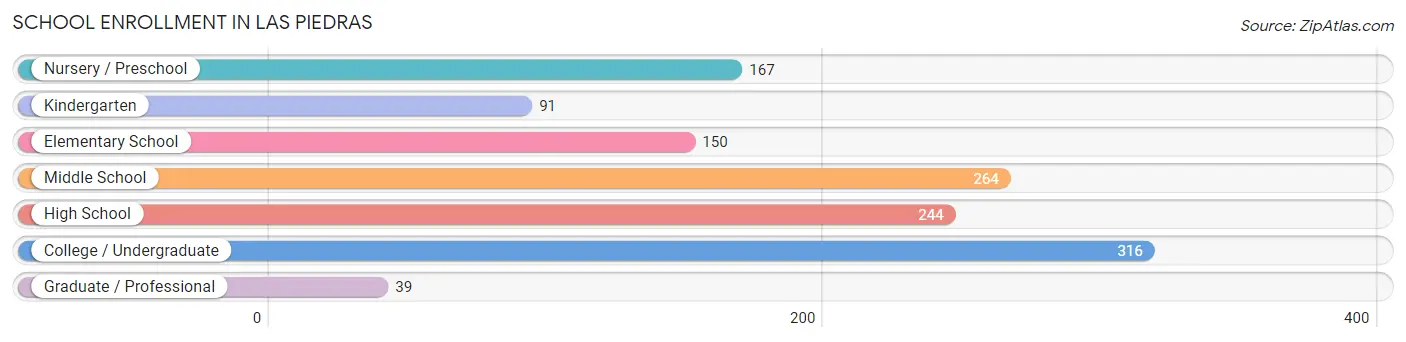
| School Level | # Students | % Students |
| Nursery / Preschool | 167 | 13.1% |
| Kindergarten | 91 | 7.2% |
| Elementary School | 150 | 11.8% |
| Middle School | 264 | 20.8% |
| High School | 244 | 19.2% |
| College / Undergraduate | 316 | 24.9% |
| Graduate / Professional | 39 | 3.1% |
| Total | 1,271 | 100.0% |
School Enrollment by Age by Funding Source in Las Piedras
Out of a total of 1,271 students who are enrolled in schools in Las Piedras, 502 (39.5%) attend a private institution, while the remaining 769 (60.5%) are enrolled in public schools. The age group of 25 to 34 year olds has the highest likelihood of being enrolled in private schools, with 18 (100.0% in the age bracket) enrolled. Conversely, the age group of 5 to 9 year old has the lowest likelihood of being enrolled in a private school, with 200 (83.0% in the age bracket) attending a public institution.
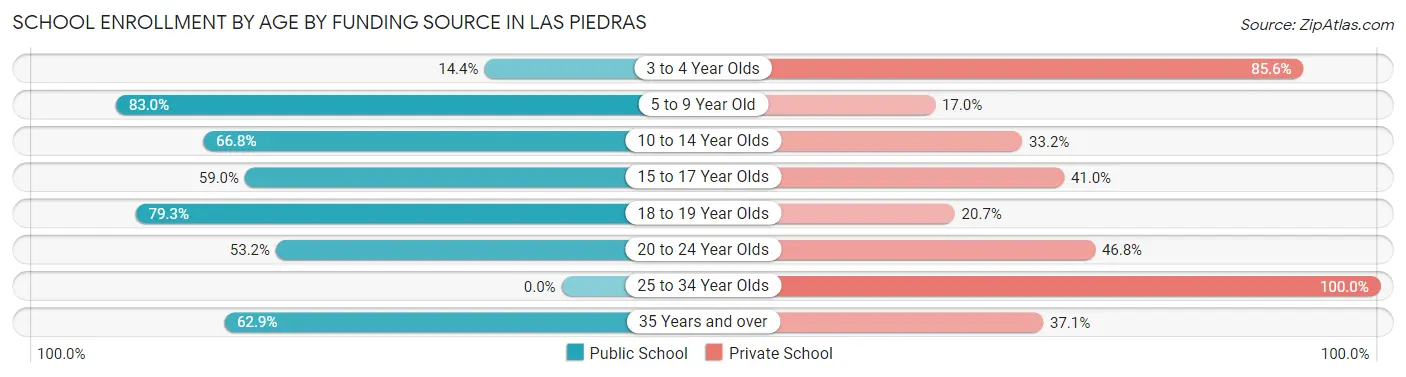
| Age Bracket | Public School | Private School |
| 3 to 4 Year Olds | 24 (14.4%) | 143 (85.6%) |
| 5 to 9 Year Old | 200 (83.0%) | 41 (17.0%) |
| 10 to 14 Year Olds | 227 (66.8%) | 113 (33.2%) |
| 15 to 17 Year Olds | 69 (59.0%) | 48 (41.0%) |
| 18 to 19 Year Olds | 119 (79.3%) | 31 (20.7%) |
| 20 to 24 Year Olds | 108 (53.2%) | 95 (46.8%) |
| 25 to 34 Year Olds | 0 (0.0%) | 18 (100.0%) |
| 35 Years and over | 22 (62.9%) | 13 (37.1%) |
| Total | 769 (60.5%) | 502 (39.5%) |
Educational Attainment by Field of Study in Las Piedras
Business (215 | 22.0%), education (183 | 18.7%), science & technology (165 | 16.9%), psychology (145 | 14.8%), and arts & humanities (84 | 8.6%) are the most common fields of study among 979 individuals in Las Piedras who have obtained a bachelor's degree or higher.
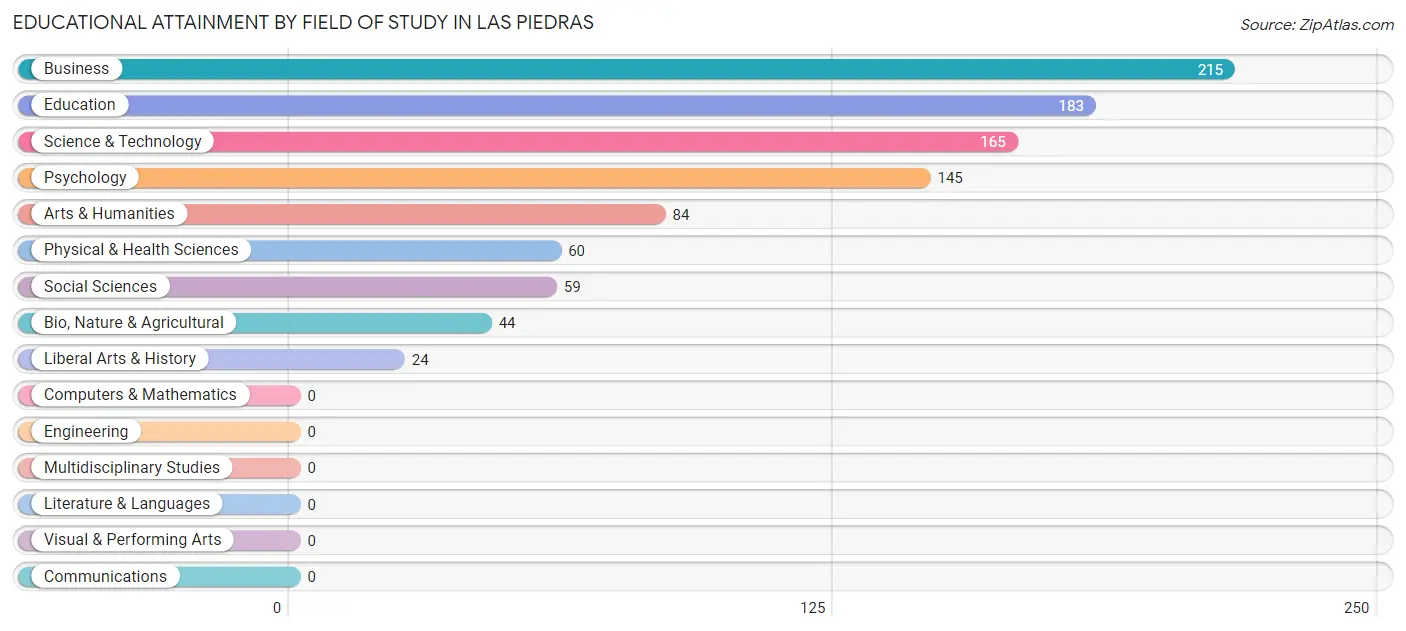
| Field of Study | # Graduates | % Graduates |
| Computers & Mathematics | 0 | 0.0% |
| Bio, Nature & Agricultural | 44 | 4.5% |
| Physical & Health Sciences | 60 | 6.1% |
| Psychology | 145 | 14.8% |
| Social Sciences | 59 | 6.0% |
| Engineering | 0 | 0.0% |
| Multidisciplinary Studies | 0 | 0.0% |
| Science & Technology | 165 | 16.9% |
| Business | 215 | 22.0% |
| Education | 183 | 18.7% |
| Literature & Languages | 0 | 0.0% |
| Liberal Arts & History | 24 | 2.5% |
| Visual & Performing Arts | 0 | 0.0% |
| Communications | 0 | 0.0% |
| Arts & Humanities | 84 | 8.6% |
| Total | 979 | 100.0% |
Transportation & Commute in Las Piedras
Vehicle Availability by Sex in Las Piedras
The most prevalent vehicle ownership categories in Las Piedras are males with 2 vehicles (286, accounting for 41.1%) and females with 2 vehicles (147, making up 40.2%).
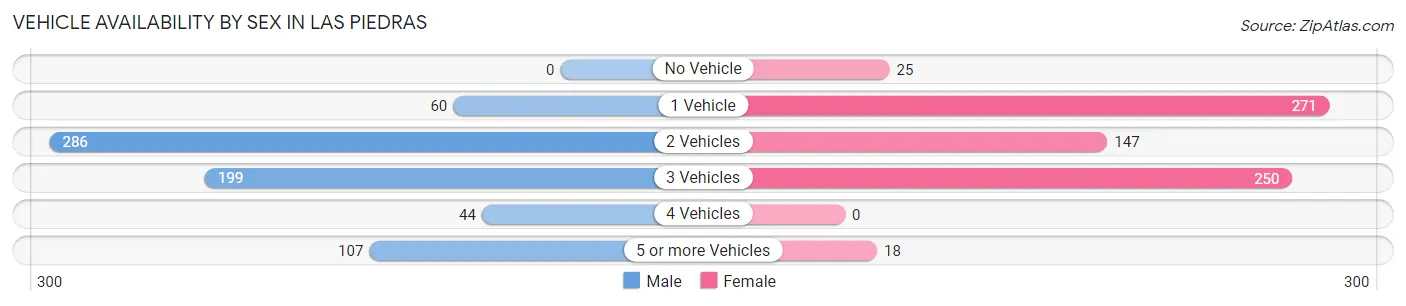
| Vehicles Available | Male | Female |
| No Vehicle | 0 (0.0%) | 25 (3.5%) |
| 1 Vehicle | 60 (8.6%) | 271 (38.1%) |
| 2 Vehicles | 286 (41.1%) | 147 (20.7%) |
| 3 Vehicles | 199 (28.6%) | 250 (35.2%) |
| 4 Vehicles | 44 (6.3%) | 0 (0.0%) |
| 5 or more Vehicles | 107 (15.4%) | 18 (2.5%) |
| Total | 696 (100.0%) | 711 (100.0%) |
Commute Time in Las Piedras
The most frequently occuring commute durations in Las Piedras are 5 to 9 minutes (299 commuters, 21.2%), 30 to 34 minutes (234 commuters, 16.6%), and 20 to 24 minutes (175 commuters, 12.4%).
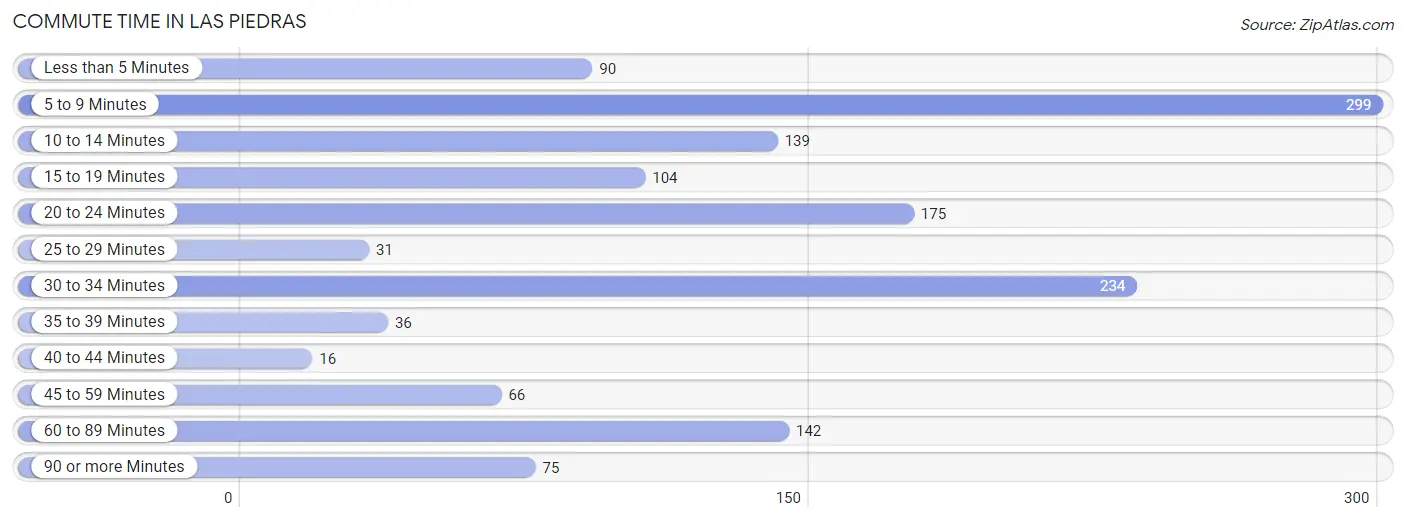
| Commute Time | # Commuters | % Commuters |
| Less than 5 Minutes | 90 | 6.4% |
| 5 to 9 Minutes | 299 | 21.2% |
| 10 to 14 Minutes | 139 | 9.9% |
| 15 to 19 Minutes | 104 | 7.4% |
| 20 to 24 Minutes | 175 | 12.4% |
| 25 to 29 Minutes | 31 | 2.2% |
| 30 to 34 Minutes | 234 | 16.6% |
| 35 to 39 Minutes | 36 | 2.6% |
| 40 to 44 Minutes | 16 | 1.1% |
| 45 to 59 Minutes | 66 | 4.7% |
| 60 to 89 Minutes | 142 | 10.1% |
| 90 or more Minutes | 75 | 5.3% |
Commute Time by Sex in Las Piedras
The most common commute times in Las Piedras are 30 to 34 minutes (211 commuters, 30.3%) for males and 5 to 9 minutes (245 commuters, 34.5%) for females.
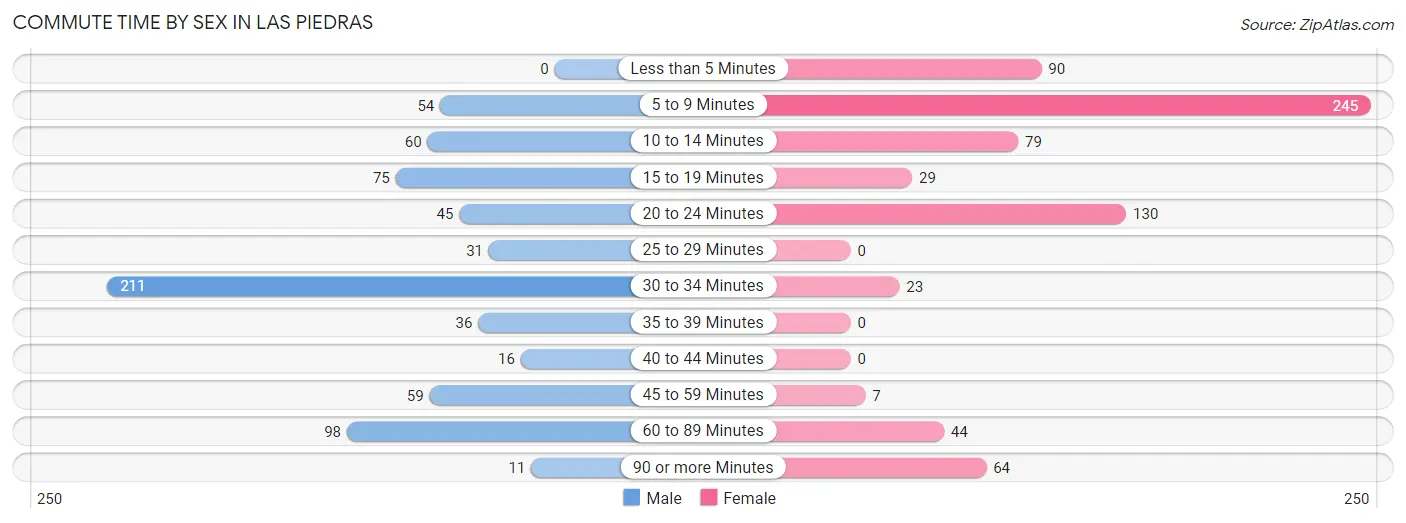
| Commute Time | Male | Female |
| Less than 5 Minutes | 0 (0.0%) | 90 (12.7%) |
| 5 to 9 Minutes | 54 (7.8%) | 245 (34.5%) |
| 10 to 14 Minutes | 60 (8.6%) | 79 (11.1%) |
| 15 to 19 Minutes | 75 (10.8%) | 29 (4.1%) |
| 20 to 24 Minutes | 45 (6.5%) | 130 (18.3%) |
| 25 to 29 Minutes | 31 (4.4%) | 0 (0.0%) |
| 30 to 34 Minutes | 211 (30.3%) | 23 (3.2%) |
| 35 to 39 Minutes | 36 (5.2%) | 0 (0.0%) |
| 40 to 44 Minutes | 16 (2.3%) | 0 (0.0%) |
| 45 to 59 Minutes | 59 (8.5%) | 7 (1.0%) |
| 60 to 89 Minutes | 98 (14.1%) | 44 (6.2%) |
| 90 or more Minutes | 11 (1.6%) | 64 (9.0%) |
Time of Departure to Work by Sex in Las Piedras
The most frequent times of departure to work in Las Piedras are 12:00 AM to 4:59 AM (192, 27.6%) for males and 7:00 AM to 7:29 AM (133, 18.7%) for females.
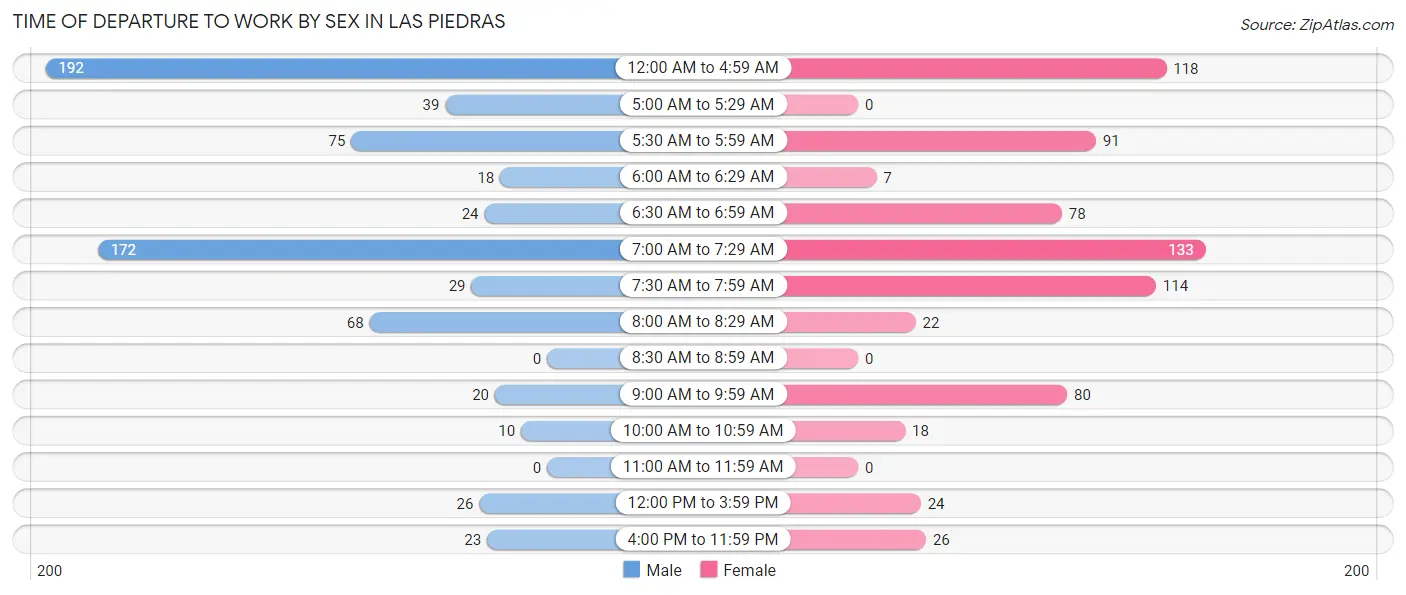
| Time of Departure | Male | Female |
| 12:00 AM to 4:59 AM | 192 (27.6%) | 118 (16.6%) |
| 5:00 AM to 5:29 AM | 39 (5.6%) | 0 (0.0%) |
| 5:30 AM to 5:59 AM | 75 (10.8%) | 91 (12.8%) |
| 6:00 AM to 6:29 AM | 18 (2.6%) | 7 (1.0%) |
| 6:30 AM to 6:59 AM | 24 (3.5%) | 78 (11.0%) |
| 7:00 AM to 7:29 AM | 172 (24.7%) | 133 (18.7%) |
| 7:30 AM to 7:59 AM | 29 (4.2%) | 114 (16.0%) |
| 8:00 AM to 8:29 AM | 68 (9.8%) | 22 (3.1%) |
| 8:30 AM to 8:59 AM | 0 (0.0%) | 0 (0.0%) |
| 9:00 AM to 9:59 AM | 20 (2.9%) | 80 (11.3%) |
| 10:00 AM to 10:59 AM | 10 (1.4%) | 18 (2.5%) |
| 11:00 AM to 11:59 AM | 0 (0.0%) | 0 (0.0%) |
| 12:00 PM to 3:59 PM | 26 (3.7%) | 24 (3.4%) |
| 4:00 PM to 11:59 PM | 23 (3.3%) | 26 (3.7%) |
| Total | 696 (100.0%) | 711 (100.0%) |
Housing Occupancy in Las Piedras
Occupancy by Ownership in Las Piedras
Of the total 1,849 dwellings in Las Piedras, owner-occupied units account for 1,093 (59.1%), while renter-occupied units make up 756 (40.9%).
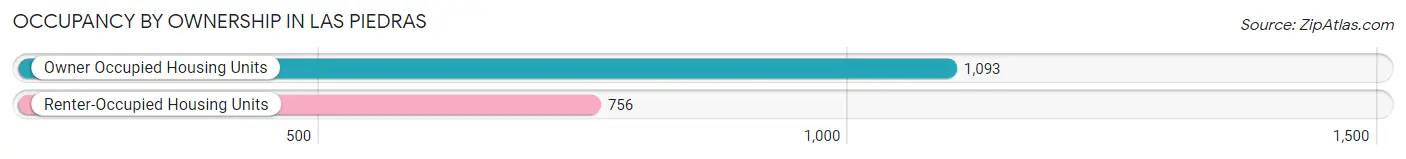
| Occupancy | # Housing Units | % Housing Units |
| Owner Occupied Housing Units | 1,093 | 59.1% |
| Renter-Occupied Housing Units | 756 | 40.9% |
| Total Occupied Housing Units | 1,849 | 100.0% |
Occupancy by Household Size in Las Piedras
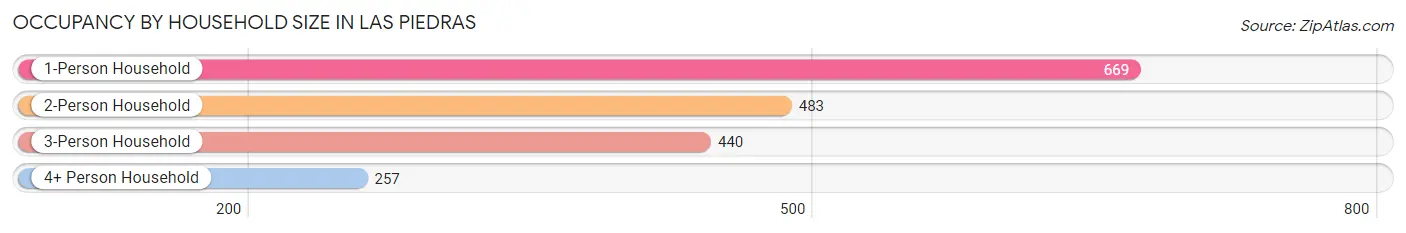
| Household Size | # Housing Units | % Housing Units |
| 1-Person Household | 669 | 36.2% |
| 2-Person Household | 483 | 26.1% |
| 3-Person Household | 440 | 23.8% |
| 4+ Person Household | 257 | 13.9% |
| Total Housing Units | 1,849 | 100.0% |
Occupancy by Ownership by Household Size in Las Piedras
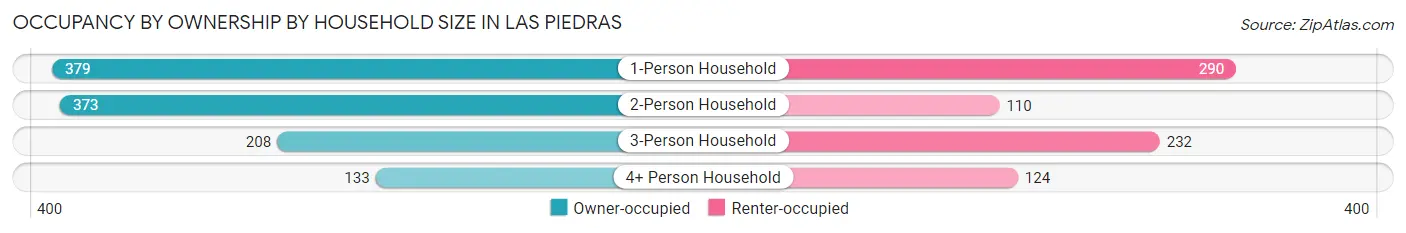
| Household Size | Owner-occupied | Renter-occupied |
| 1-Person Household | 379 (56.7%) | 290 (43.3%) |
| 2-Person Household | 373 (77.2%) | 110 (22.8%) |
| 3-Person Household | 208 (47.3%) | 232 (52.7%) |
| 4+ Person Household | 133 (51.7%) | 124 (48.2%) |
| Total Housing Units | 1,093 (59.1%) | 756 (40.9%) |
Occupancy by Educational Attainment in Las Piedras
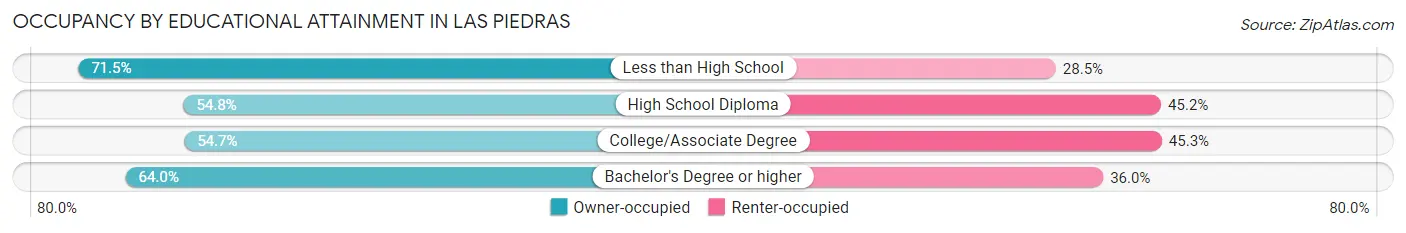
| Household Size | Owner-occupied | Renter-occupied |
| Less than High School | 173 (71.5%) | 69 (28.5%) |
| High School Diploma | 314 (54.8%) | 259 (45.2%) |
| College/Associate Degree | 327 (54.7%) | 271 (45.3%) |
| Bachelor's Degree or higher | 279 (64.0%) | 157 (36.0%) |
Occupancy by Age of Householder in Las Piedras
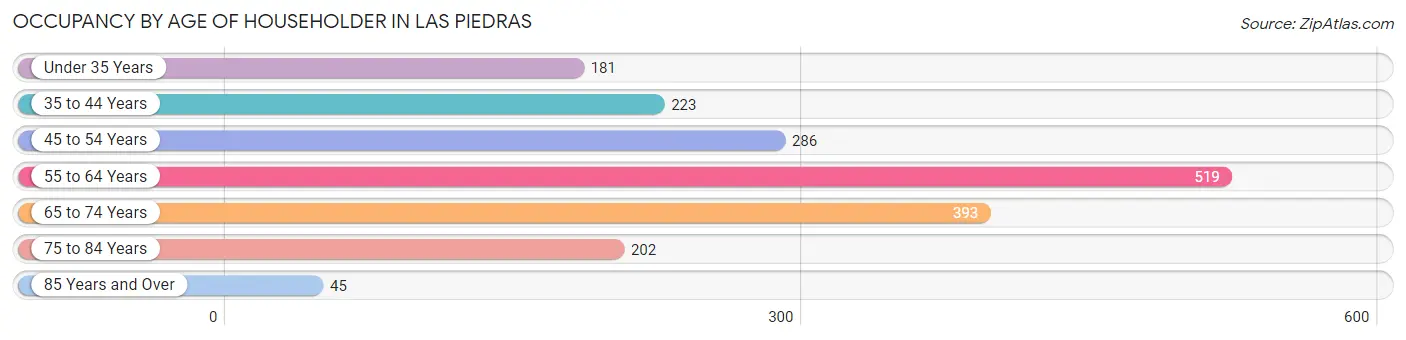
| Age Bracket | # Households | % Households |
| Under 35 Years | 181 | 9.8% |
| 35 to 44 Years | 223 | 12.1% |
| 45 to 54 Years | 286 | 15.5% |
| 55 to 64 Years | 519 | 28.1% |
| 65 to 74 Years | 393 | 21.2% |
| 75 to 84 Years | 202 | 10.9% |
| 85 Years and Over | 45 | 2.4% |
| Total | 1,849 | 100.0% |
Housing Finances in Las Piedras
Median Income by Occupancy in Las Piedras
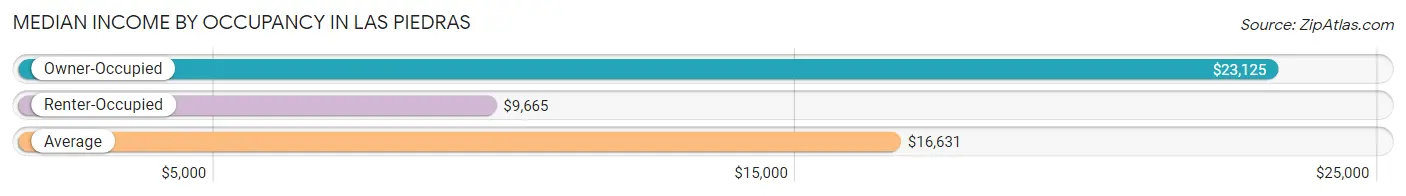
| Occupancy Type | # Households | Median Income |
| Owner-Occupied | 1,093 (59.1%) | $23,125 |
| Renter-Occupied | 756 (40.9%) | $9,665 |
| Average | 1,849 (100.0%) | $16,631 |
Occupancy by Householder Income Bracket in Las Piedras
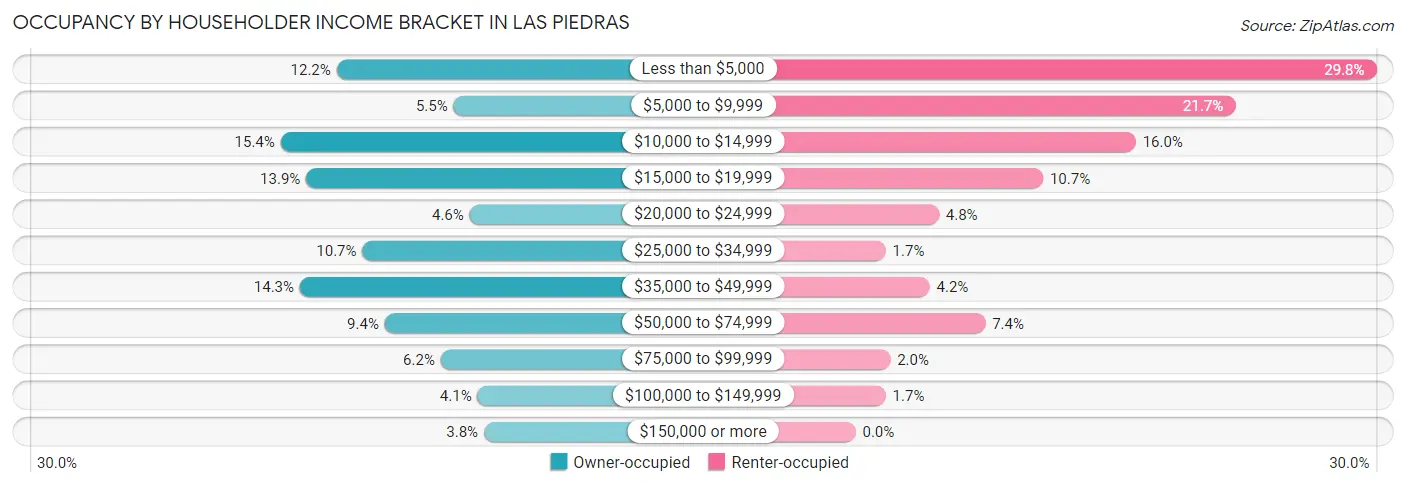
| Income Bracket | Owner-occupied | Renter-occupied |
| Less than $5,000 | 133 (12.2%) | 225 (29.8%) |
| $5,000 to $9,999 | 60 (5.5%) | 164 (21.7%) |
| $10,000 to $14,999 | 168 (15.4%) | 121 (16.0%) |
| $15,000 to $19,999 | 152 (13.9%) | 81 (10.7%) |
| $20,000 to $24,999 | 50 (4.6%) | 36 (4.8%) |
| $25,000 to $34,999 | 117 (10.7%) | 13 (1.7%) |
| $35,000 to $49,999 | 156 (14.3%) | 32 (4.2%) |
| $50,000 to $74,999 | 103 (9.4%) | 56 (7.4%) |
| $75,000 to $99,999 | 68 (6.2%) | 15 (2.0%) |
| $100,000 to $149,999 | 45 (4.1%) | 13 (1.7%) |
| $150,000 or more | 41 (3.7%) | 0 (0.0%) |
| Total | 1,093 (100.0%) | 756 (100.0%) |
Monthly Housing Cost Tiers in Las Piedras
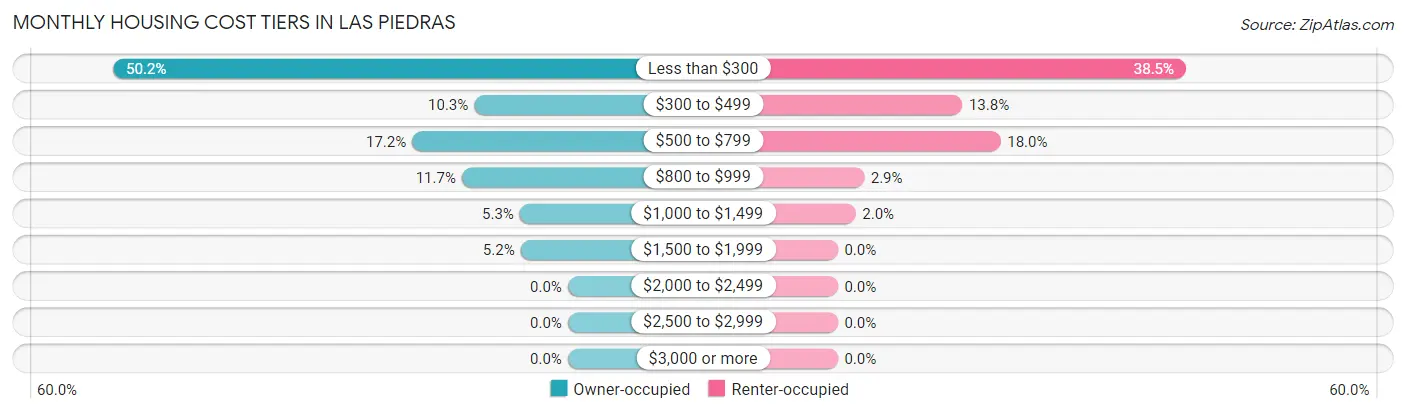
| Monthly Cost | Owner-occupied | Renter-occupied |
| Less than $300 | 549 (50.2%) | 291 (38.5%) |
| $300 to $499 | 113 (10.3%) | 104 (13.8%) |
| $500 to $799 | 188 (17.2%) | 136 (18.0%) |
| $800 to $999 | 128 (11.7%) | 22 (2.9%) |
| $1,000 to $1,499 | 58 (5.3%) | 15 (2.0%) |
| $1,500 to $1,999 | 57 (5.2%) | 0 (0.0%) |
| $2,000 to $2,499 | 0 (0.0%) | 0 (0.0%) |
| $2,500 to $2,999 | 0 (0.0%) | 0 (0.0%) |
| $3,000 or more | 0 (0.0%) | 0 (0.0%) |
| Total | 1,093 (100.0%) | 756 (100.0%) |
Physical Housing Characteristics in Las Piedras
Housing Structures in Las Piedras
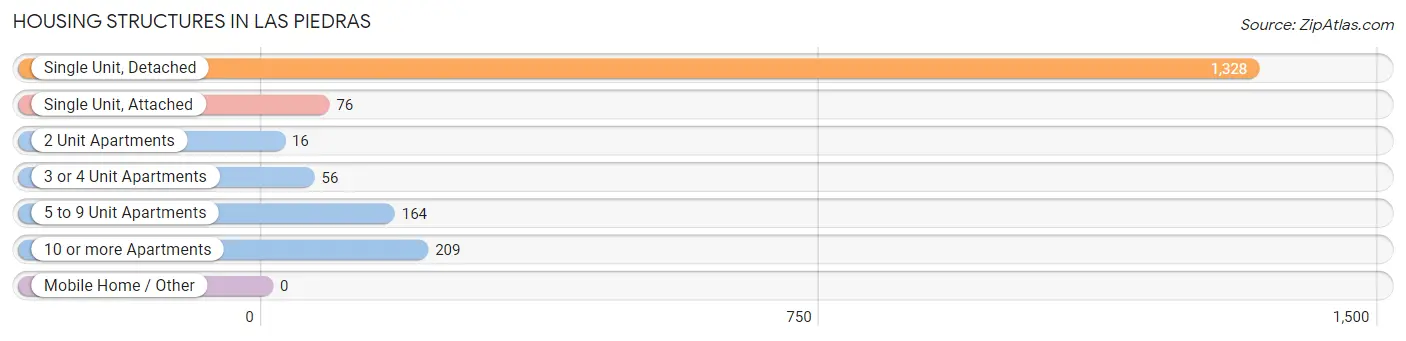
| Structure Type | # Housing Units | % Housing Units |
| Single Unit, Detached | 1,328 | 71.8% |
| Single Unit, Attached | 76 | 4.1% |
| 2 Unit Apartments | 16 | 0.9% |
| 3 or 4 Unit Apartments | 56 | 3.0% |
| 5 to 9 Unit Apartments | 164 | 8.9% |
| 10 or more Apartments | 209 | 11.3% |
| Mobile Home / Other | 0 | 0.0% |
| Total | 1,849 | 100.0% |
Housing Structures by Occupancy in Las Piedras
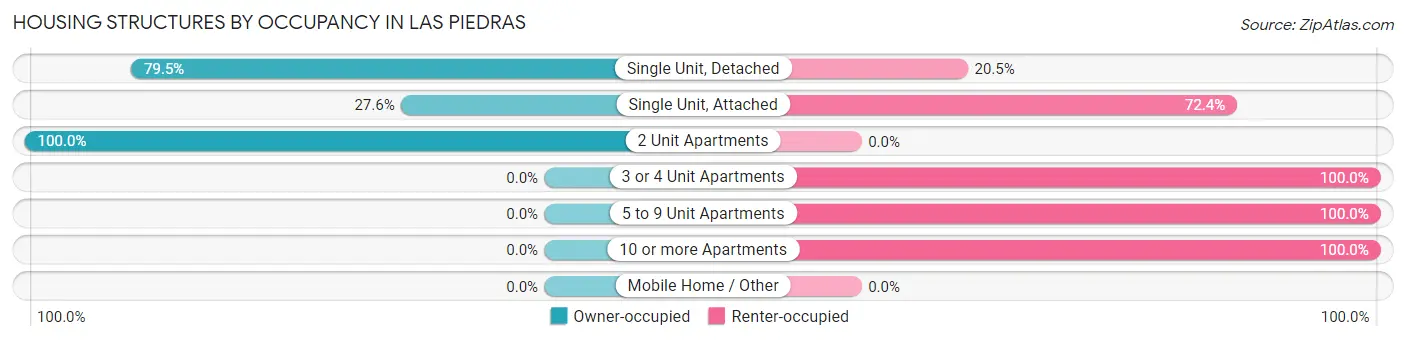
| Structure Type | Owner-occupied | Renter-occupied |
| Single Unit, Detached | 1,056 (79.5%) | 272 (20.5%) |
| Single Unit, Attached | 21 (27.6%) | 55 (72.4%) |
| 2 Unit Apartments | 16 (100.0%) | 0 (0.0%) |
| 3 or 4 Unit Apartments | 0 (0.0%) | 56 (100.0%) |
| 5 to 9 Unit Apartments | 0 (0.0%) | 164 (100.0%) |
| 10 or more Apartments | 0 (0.0%) | 209 (100.0%) |
| Mobile Home / Other | 0 (0.0%) | 0 (0.0%) |
| Total | 1,093 (59.1%) | 756 (40.9%) |
Housing Structures by Number of Rooms in Las Piedras
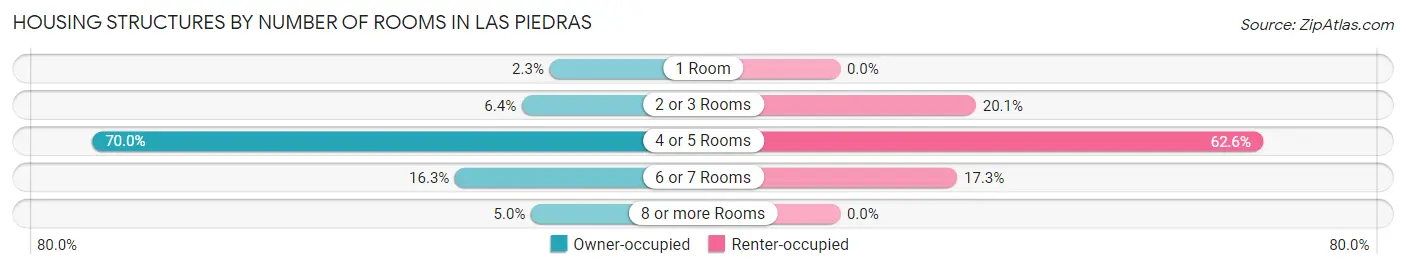
| Number of Rooms | Owner-occupied | Renter-occupied |
| 1 Room | 25 (2.3%) | 0 (0.0%) |
| 2 or 3 Rooms | 70 (6.4%) | 152 (20.1%) |
| 4 or 5 Rooms | 765 (70.0%) | 473 (62.6%) |
| 6 or 7 Rooms | 178 (16.3%) | 131 (17.3%) |
| 8 or more Rooms | 55 (5.0%) | 0 (0.0%) |
| Total | 1,093 (100.0%) | 756 (100.0%) |
Housing Structure by Heating Type in Las Piedras
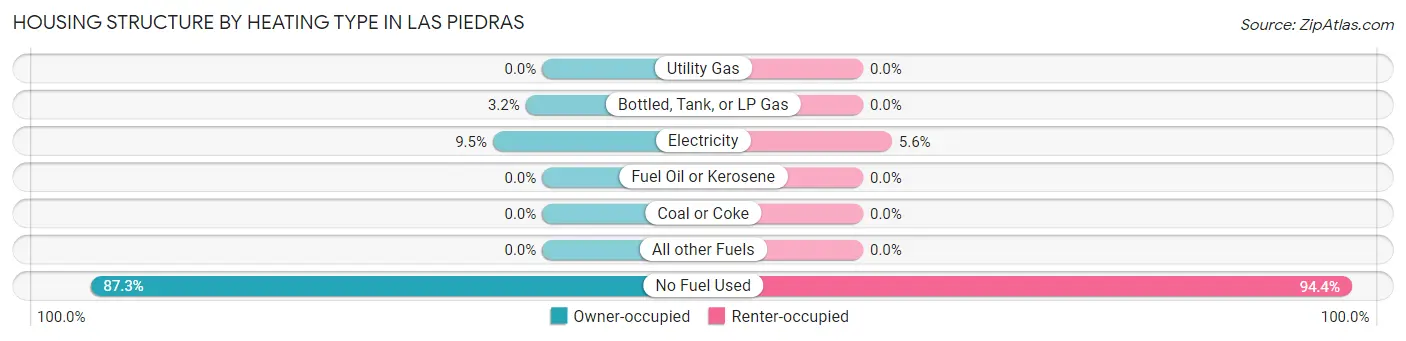
| Heating Type | Owner-occupied | Renter-occupied |
| Utility Gas | 0 (0.0%) | 0 (0.0%) |
| Bottled, Tank, or LP Gas | 35 (3.2%) | 0 (0.0%) |
| Electricity | 104 (9.5%) | 42 (5.6%) |
| Fuel Oil or Kerosene | 0 (0.0%) | 0 (0.0%) |
| Coal or Coke | 0 (0.0%) | 0 (0.0%) |
| All other Fuels | 0 (0.0%) | 0 (0.0%) |
| No Fuel Used | 954 (87.3%) | 714 (94.4%) |
| Total | 1,093 (100.0%) | 756 (100.0%) |
Household Vehicle Usage in Las Piedras
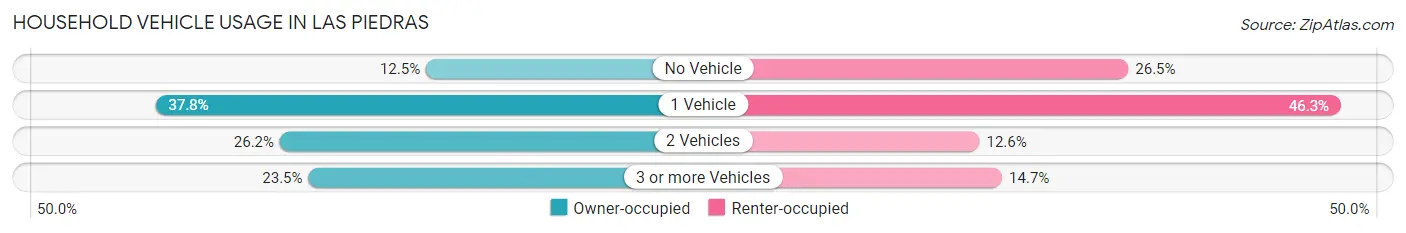
| Vehicles per Household | Owner-occupied | Renter-occupied |
| No Vehicle | 137 (12.5%) | 200 (26.5%) |
| 1 Vehicle | 413 (37.8%) | 350 (46.3%) |
| 2 Vehicles | 286 (26.2%) | 95 (12.6%) |
| 3 or more Vehicles | 257 (23.5%) | 111 (14.7%) |
| Total | 1,093 (100.0%) | 756 (100.0%) |
Real Estate & Mortgages in Las Piedras
Real Estate and Mortgage Overview in Las Piedras
| Characteristic | Without Mortgage | With Mortgage |
| Housing Units | 664 | 429 |
| Median Property Value | $107,000 | $124,300 |
| Median Household Income | $18,837 | $0 |
| Monthly Housing Costs | $168 | $0 |
| Real Estate Taxes | - | - |
Property Value by Mortgage Status in Las Piedras
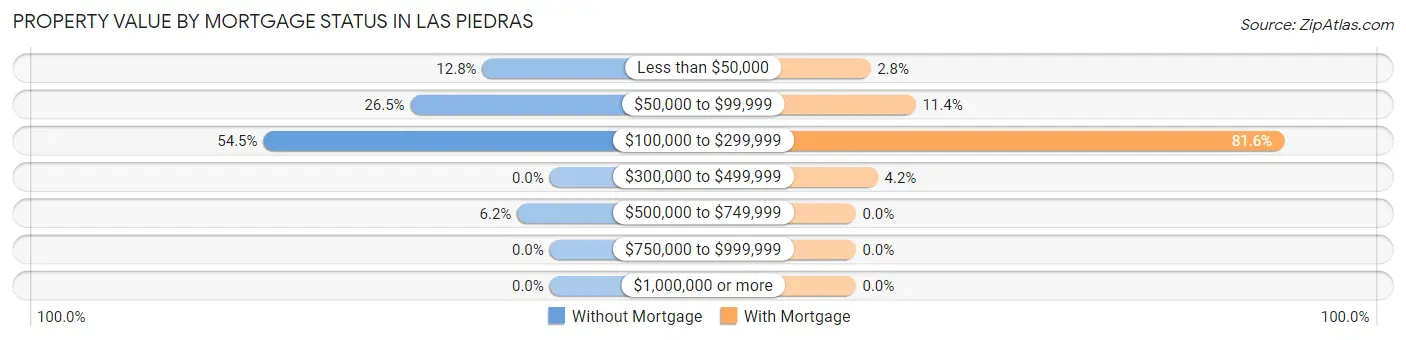
| Property Value | Without Mortgage | With Mortgage |
| Less than $50,000 | 85 (12.8%) | 12 (2.8%) |
| $50,000 to $99,999 | 176 (26.5%) | 49 (11.4%) |
| $100,000 to $299,999 | 362 (54.5%) | 350 (81.6%) |
| $300,000 to $499,999 | 0 (0.0%) | 18 (4.2%) |
| $500,000 to $749,999 | 41 (6.2%) | 0 (0.0%) |
| $750,000 to $999,999 | 0 (0.0%) | 0 (0.0%) |
| $1,000,000 or more | 0 (0.0%) | 0 (0.0%) |
| Total | 664 (100.0%) | 429 (100.0%) |
Household Income by Mortgage Status in Las Piedras
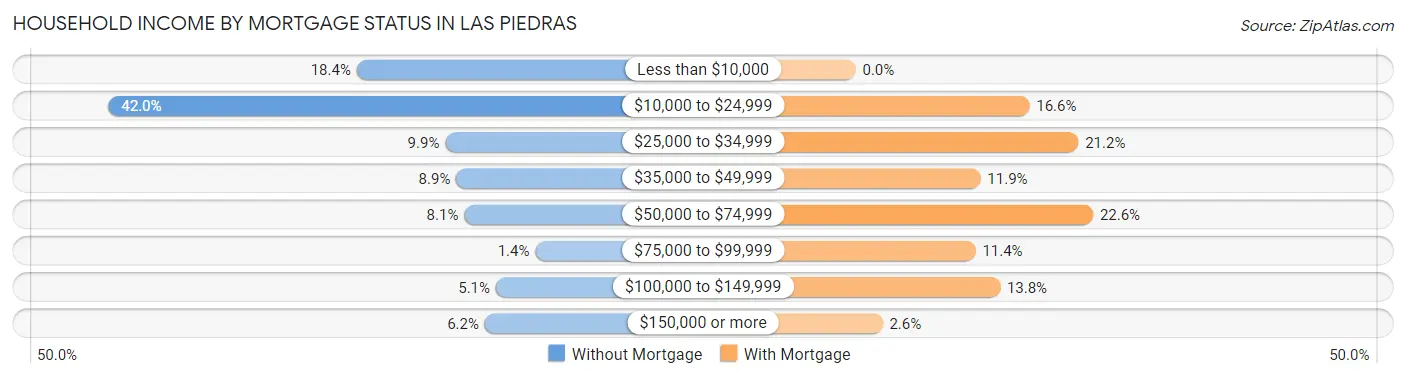
| Household Income | Without Mortgage | With Mortgage |
| Less than $10,000 | 122 (18.4%) | 0 (0.0%) |
| $10,000 to $24,999 | 279 (42.0%) | 71 (16.6%) |
| $25,000 to $34,999 | 66 (9.9%) | 91 (21.2%) |
| $35,000 to $49,999 | 59 (8.9%) | 51 (11.9%) |
| $50,000 to $74,999 | 54 (8.1%) | 97 (22.6%) |
| $75,000 to $99,999 | 9 (1.4%) | 49 (11.4%) |
| $100,000 to $149,999 | 34 (5.1%) | 59 (13.8%) |
| $150,000 or more | 41 (6.2%) | 11 (2.6%) |
| Total | 664 (100.0%) | 429 (100.0%) |
Property Value to Household Income Ratio in Las Piedras
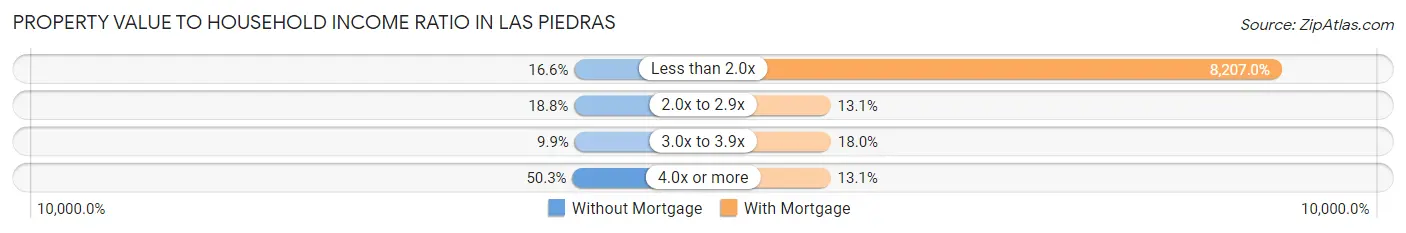
| Value-to-Income Ratio | Without Mortgage | With Mortgage |
| Less than 2.0x | 110 (16.6%) | 35,208 (8,207.0%) |
| 2.0x to 2.9x | 125 (18.8%) | 56 (13.1%) |
| 3.0x to 3.9x | 66 (9.9%) | 77 (17.9%) |
| 4.0x or more | 334 (50.3%) | 56 (13.1%) |
| Total | 664 (100.0%) | 429 (100.0%) |
Real Estate Taxes by Mortgage Status in Las Piedras

| Property Taxes | Without Mortgage | With Mortgage |
| Less than $800 | 73 (11.0%) | 18 (4.2%) |
| $800 to $1,499 | 15 (2.3%) | 43 (10.0%) |
| $800 to $1,499 | 49 (7.4%) | 13 (3.0%) |
| Total | 664 (100.0%) | 429 (100.0%) |
Health & Disability in Las Piedras
Health Insurance Coverage by Age in Las Piedras
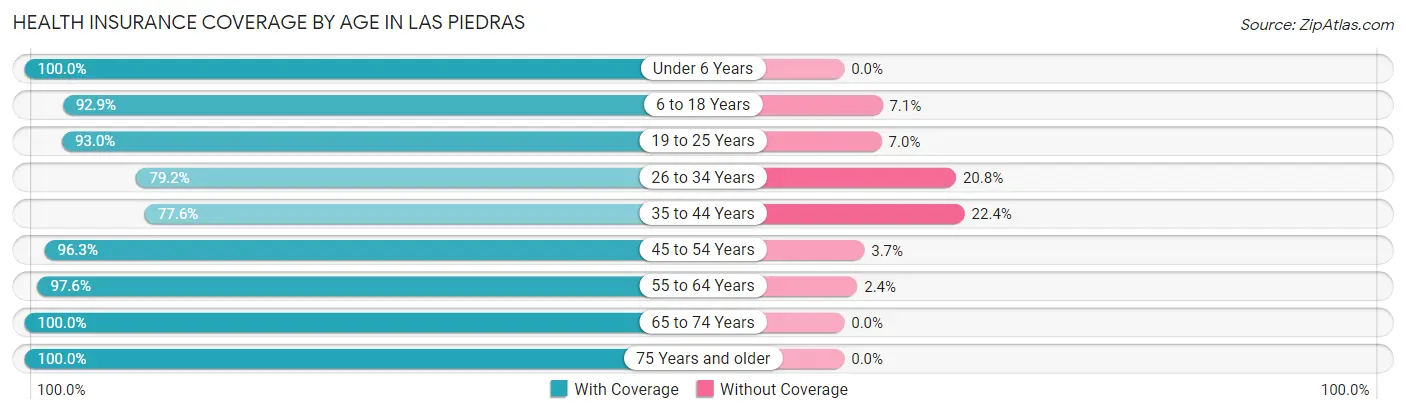
| Age Bracket | With Coverage | Without Coverage |
| Under 6 Years | 273 (100.0%) | 0 (0.0%) |
| 6 to 18 Years | 706 (92.9%) | 54 (7.1%) |
| 19 to 25 Years | 574 (93.0%) | 43 (7.0%) |
| 26 to 34 Years | 422 (79.2%) | 111 (20.8%) |
| 35 to 44 Years | 387 (77.6%) | 112 (22.4%) |
| 45 to 54 Years | 542 (96.3%) | 21 (3.7%) |
| 55 to 64 Years | 726 (97.6%) | 18 (2.4%) |
| 65 to 74 Years | 610 (100.0%) | 0 (0.0%) |
| 75 Years and older | 397 (100.0%) | 0 (0.0%) |
| Total | 4,637 (92.8%) | 359 (7.2%) |
Health Insurance Coverage by Citizenship Status in Las Piedras

| Citizenship Status | With Coverage | Without Coverage |
| Native Born | 273 (100.0%) | 0 (0.0%) |
| Foreign Born, Citizen | 706 (92.9%) | 54 (7.1%) |
| Foreign Born, not a Citizen | 574 (93.0%) | 43 (7.0%) |
Health Insurance Coverage by Household Income in Las Piedras

| Household Income | With Coverage | Without Coverage |
| Under $25,000 | 2,384 (93.2%) | 175 (6.8%) |
| $25,000 to $49,999 | 940 (100.0%) | 0 (0.0%) |
| $50,000 to $74,999 | 557 (79.7%) | 142 (20.3%) |
| $75,000 to $99,999 | 459 (94.1%) | 29 (5.9%) |
| $100,000 and over | 279 (95.6%) | 13 (4.4%) |
Public vs Private Health Insurance Coverage by Age in Las Piedras
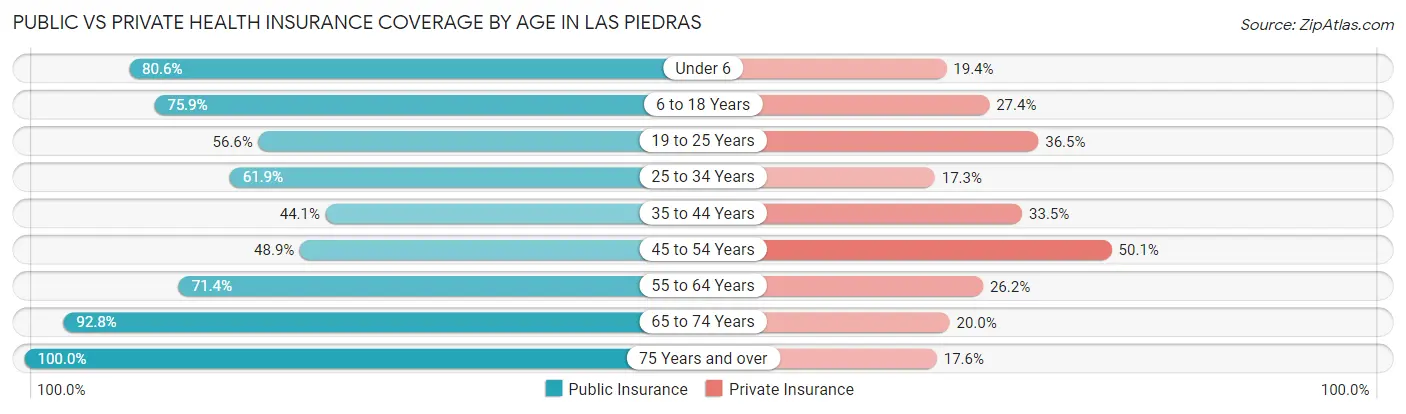
| Age Bracket | Public Insurance | Private Insurance |
| Under 6 | 220 (80.6%) | 53 (19.4%) |
| 6 to 18 Years | 577 (75.9%) | 208 (27.4%) |
| 19 to 25 Years | 349 (56.6%) | 225 (36.5%) |
| 25 to 34 Years | 330 (61.9%) | 92 (17.3%) |
| 35 to 44 Years | 220 (44.1%) | 167 (33.5%) |
| 45 to 54 Years | 275 (48.8%) | 282 (50.1%) |
| 55 to 64 Years | 531 (71.4%) | 195 (26.2%) |
| 65 to 74 Years | 566 (92.8%) | 122 (20.0%) |
| 75 Years and over | 397 (100.0%) | 70 (17.6%) |
| Total | 3,465 (69.4%) | 1,414 (28.3%) |
Disability Status by Sex by Age in Las Piedras
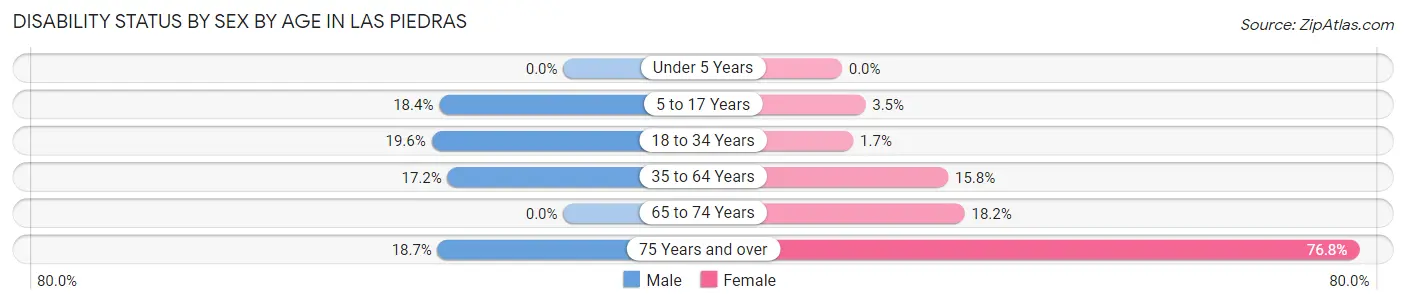
| Age Bracket | Male | Female |
| Under 5 Years | 0 (0.0%) | 0 (0.0%) |
| 5 to 17 Years | 73 (18.4%) | 12 (3.5%) |
| 18 to 34 Years | 109 (19.6%) | 11 (1.7%) |
| 35 to 64 Years | 145 (17.2%) | 152 (15.8%) |
| 65 to 74 Years | 0 (0.0%) | 64 (18.2%) |
| 75 Years and over | 25 (18.7%) | 202 (76.8%) |
Disability Class by Sex by Age in Las Piedras
Disability Class: Hearing Difficulty
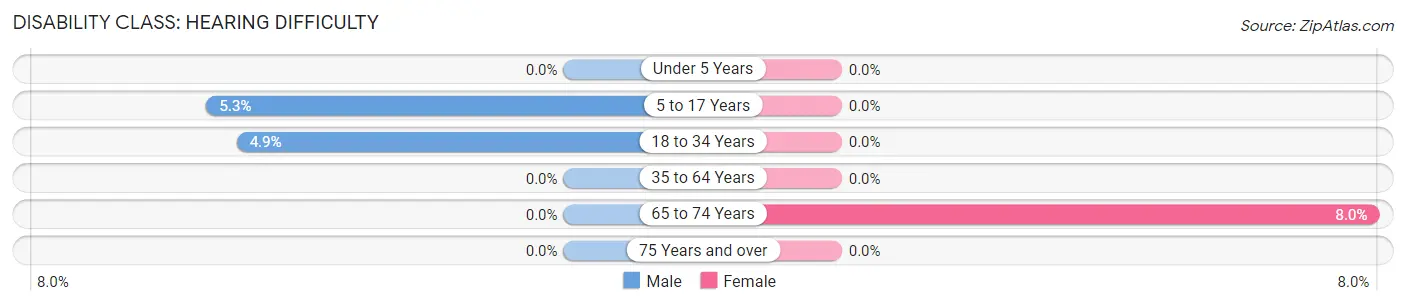
| Age Bracket | Male | Female |
| Under 5 Years | 0 (0.0%) | 0 (0.0%) |
| 5 to 17 Years | 21 (5.3%) | 0 (0.0%) |
| 18 to 34 Years | 27 (4.9%) | 0 (0.0%) |
| 35 to 64 Years | 0 (0.0%) | 0 (0.0%) |
| 65 to 74 Years | 0 (0.0%) | 28 (8.0%) |
| 75 Years and over | 0 (0.0%) | 0 (0.0%) |
Disability Class: Vision Difficulty
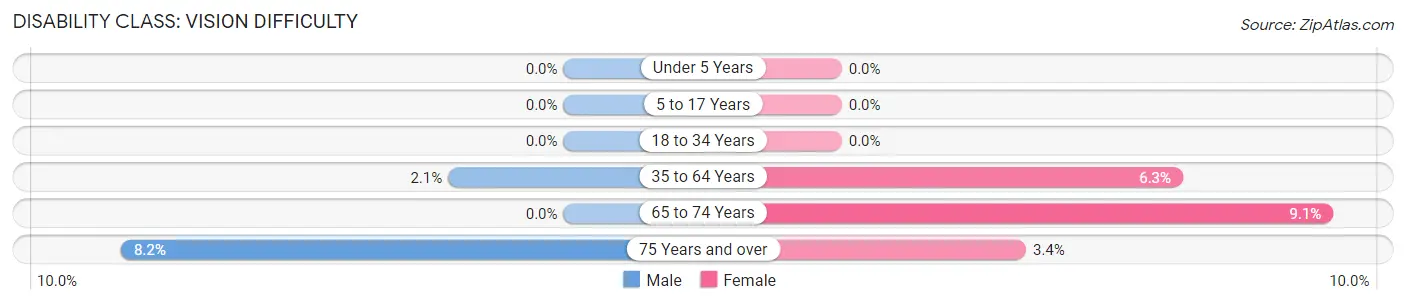
| Age Bracket | Male | Female |
| Under 5 Years | 0 (0.0%) | 0 (0.0%) |
| 5 to 17 Years | 0 (0.0%) | 0 (0.0%) |
| 18 to 34 Years | 0 (0.0%) | 0 (0.0%) |
| 35 to 64 Years | 18 (2.1%) | 61 (6.3%) |
| 65 to 74 Years | 0 (0.0%) | 32 (9.1%) |
| 75 Years and over | 11 (8.2%) | 9 (3.4%) |
Disability Class: Cognitive Difficulty
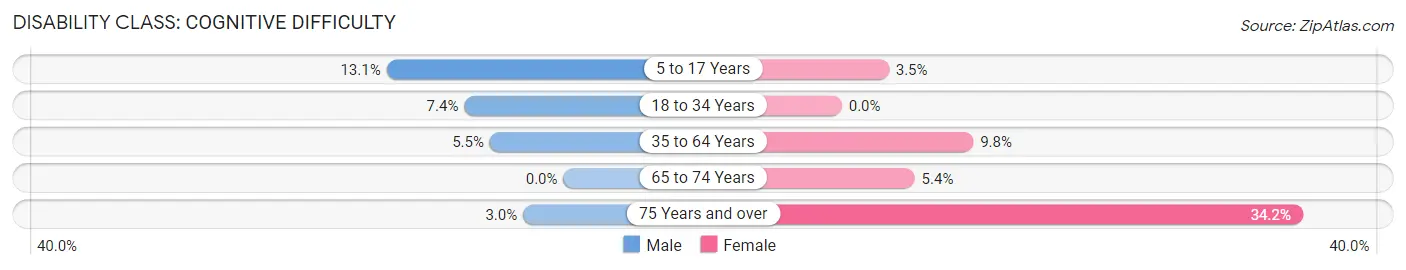
| Age Bracket | Male | Female |
| 5 to 17 Years | 52 (13.1%) | 12 (3.5%) |
| 18 to 34 Years | 41 (7.4%) | 0 (0.0%) |
| 35 to 64 Years | 46 (5.5%) | 94 (9.8%) |
| 65 to 74 Years | 0 (0.0%) | 19 (5.4%) |
| 75 Years and over | 4 (3.0%) | 90 (34.2%) |
Disability Class: Ambulatory Difficulty
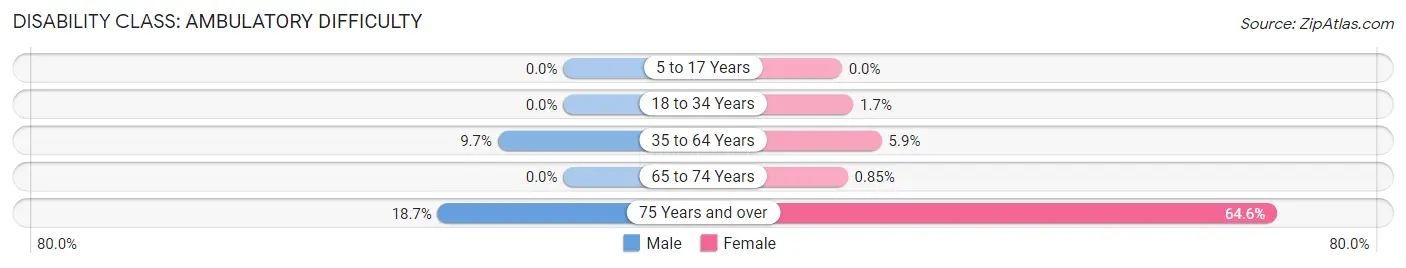
| Age Bracket | Male | Female |
| 5 to 17 Years | 0 (0.0%) | 0 (0.0%) |
| 18 to 34 Years | 0 (0.0%) | 11 (1.7%) |
| 35 to 64 Years | 82 (9.7%) | 57 (5.9%) |
| 65 to 74 Years | 0 (0.0%) | 3 (0.9%) |
| 75 Years and over | 25 (18.7%) | 170 (64.6%) |
Disability Class: Self-Care Difficulty

| Age Bracket | Male | Female |
| 5 to 17 Years | 0 (0.0%) | 0 (0.0%) |
| 18 to 34 Years | 22 (4.0%) | 0 (0.0%) |
| 35 to 64 Years | 23 (2.7%) | 16 (1.7%) |
| 65 to 74 Years | 0 (0.0%) | 3 (0.9%) |
| 75 Years and over | 15 (11.2%) | 113 (43.0%) |
Technology Access in Las Piedras
Computing Device Access in Las Piedras

| Device Type | # Households | % Households |
| Desktop or Laptop | 776 | 42.0% |
| Smartphone | 1,535 | 83.0% |
| Tablet | 910 | 49.2% |
| No Computing Device | 241 | 13.0% |
| Total | 1,849 | 100.0% |
Internet Access in Las Piedras
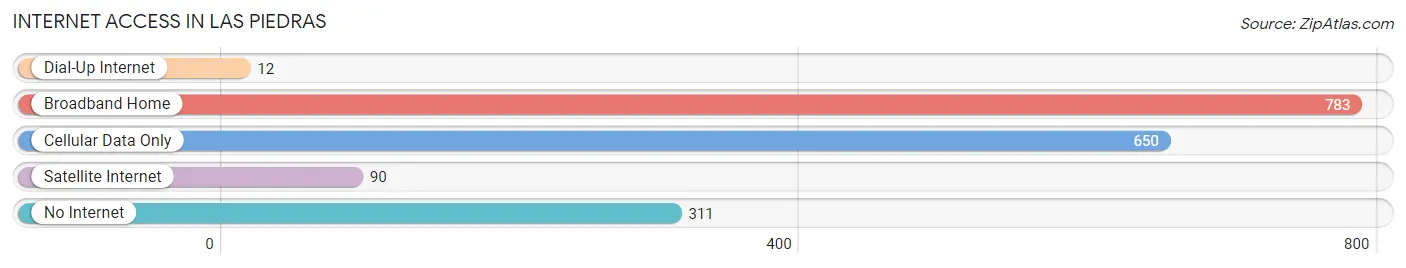
| Internet Type | # Households | % Households |
| Dial-Up Internet | 12 | 0.6% |
| Broadband Home | 783 | 42.3% |
| Cellular Data Only | 650 | 35.1% |
| Satellite Internet | 90 | 4.9% |
| No Internet | 311 | 16.8% |
| Total | 1,849 | 100.0% |
Las Piedras Summary
Las Piedras is a municipality located in the eastern region of Puerto Rico. It is part of the San Juan-Caguas-Guaynabo Metropolitan Statistical Area. The town is located in the northern part of the island, about 20 miles from San Juan. As of the 2010 census, the population of Las Piedras was 33,106.
History
Las Piedras was founded in 1793 by Don Francisco de los Ríos. The town was named after the many stones found in the area. The town was originally part of the municipality of Canóvanas, but it was separated in 1801. Las Piedras was officially recognized as a municipality in 1813.
In the 19th century, Las Piedras was an important agricultural center. The town was known for its production of coffee, tobacco, and sugar cane. In the early 20th century, the economy shifted to manufacturing and industry. The town was home to several factories, including a textile mill and a shoe factory.
Geography
Las Piedras is located in the northern part of Puerto Rico, about 20 miles from San Juan. The town is bordered by the municipalities of Canóvanas, Loíza, and Río Grande. The terrain of Las Piedras is mostly flat, with some hills in the northern part of the municipality. The town is located in the humid subtropical climate zone, with an average temperature of 79°F.
Economy
Las Piedras has a diversified economy. The town is home to several factories, including a textile mill and a shoe factory. The town is also home to several small businesses, including restaurants, shops, and services. Agriculture is still an important part of the economy, with the town producing coffee, tobacco, and sugar cane.
Demographics
As of the 2010 census, the population of Las Piedras was 33,106. The population is mostly of Puerto Rican descent, with a small percentage of African and European descent. The median household income in Las Piedras is $20,845, and the median age is 37. The town has a high rate of poverty, with 28.3% of the population living below the poverty line.
Las Piedras is a vibrant and diverse municipality. The town is home to several festivals and events, including the Festival de la Piedra, which celebrates the town's history and culture. Las Piedras is also home to several parks and recreational areas, including the Parque de la Piedra, which features a lake and a playground.
Common Questions
What is Per Capita Income in Las Piedras?
Per Capita income in Las Piedras is $12,399.
What is the Median Family Income in Las Piedras?
Median Family Income in Las Piedras is $21,250.
What is the Median Household income in Las Piedras?
Median Household Income in Las Piedras is $16,631.
What is Income or Wage Gap in Las Piedras?
Income or Wage Gap in Las Piedras is 39.0%.
Women in Las Piedras earn 61.0 cents for every dollar earned by a man.
What is Family Income Deficit in Las Piedras?
Family Income Deficit in Las Piedras is $11,878.
Families that are below poverty line in Las Piedras earn $11,878 less on average than the poverty threshold level.
What is Inequality or Gini Index in Las Piedras?
Inequality or Gini Index in Las Piedras is 0.58.
What is the Total Population of Las Piedras?
Total Population of Las Piedras is 4,996.
What is the Total Male Population of Las Piedras?
Total Male Population of Las Piedras is 2,255.
What is the Total Female Population of Las Piedras?
Total Female Population of Las Piedras is 2,741.
What is the Ratio of Males per 100 Females in Las Piedras?
There are 82.27 Males per 100 Females in Las Piedras.
What is the Ratio of Females per 100 Males in Las Piedras?
There are 121.55 Females per 100 Males in Las Piedras.
What is the Median Population Age in Las Piedras?
Median Population Age in Las Piedras is 42.3 Years.
What is the Average Family Size in Las Piedras
Average Family Size in Las Piedras is 3.6 People.
What is the Average Household Size in Las Piedras
Average Household Size in Las Piedras is 2.7 People.
How Large is the Labor Force in Las Piedras?
There are 1,717 People in the Labor Forcein in Las Piedras.
What is the Percentage of People in the Labor Force in Las Piedras?
41.6% of People are in the Labor Force in Las Piedras.
What is the Unemployment Rate in Las Piedras?
Unemployment Rate in Las Piedras is 13.4%.