Capitanejo, PR Map & Demographics
Capitanejo Map
Capitanejo Overview
$10,018
PER CAPITA INCOME
$22,473
AVG FAMILY INCOME
$23,681
AVG HOUSEHOLD INCOME
$10,936
FAMILY INCOME DEFICIT
0.38
INEQUALITY / GINI INDEX
2,751
TOTAL POPULATION
1,367
MALE POPULATION
1,384
FEMALE POPULATION
98.77
MALES / 100 FEMALES
101.24
FEMALES / 100 MALES
45.4
MEDIAN AGE
3.4
AVG FAMILY SIZE
2.9
AVG HOUSEHOLD SIZE
868
LABOR FORCE [ PEOPLE ]
40.0%
PERCENT IN LABOR FORCE
17.4%
UNEMPLOYMENT RATE
Income in Capitanejo
Income Overview in Capitanejo
Per Capita Income in Capitanejo is $10,018, while median incomes of families and households are $22,473 and $23,681 respectively.
| Characteristic | Number | Measure |
| Per Capita Income | 2,751 | $10,018 |
| Median Family Income | 695 | $22,473 |
| Mean Family Income | 695 | $27,629 |
| Median Household Income | 952 | $23,681 |
| Mean Household Income | 952 | $28,072 |
| Income Deficit | 695 | $10,936 |
| Wage / Income Gap (%) | 2,751 | 0.00% |
| Wage / Income Gap ($) | 2,751 | 100.00¢ per $1 |
| Gini / Inequality Index | 2,751 | 0.38 |
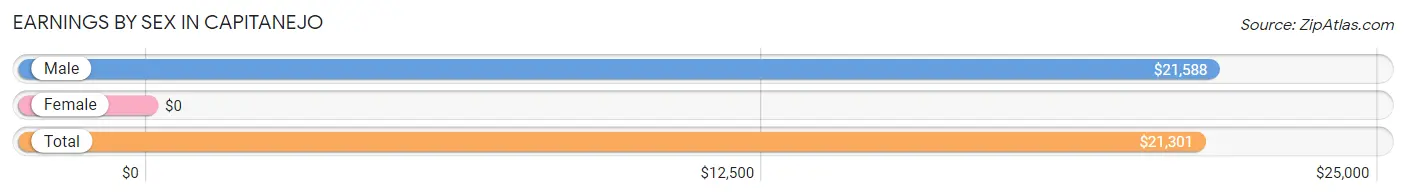
Earnings by Sex in Capitanejo
| Sex | Number | Average Earnings |
| Male | 492 (62.2%) | $21,588 |
| Female | 299 (37.8%) | $0 |
| Total | 791 (100.0%) | $21,301 |
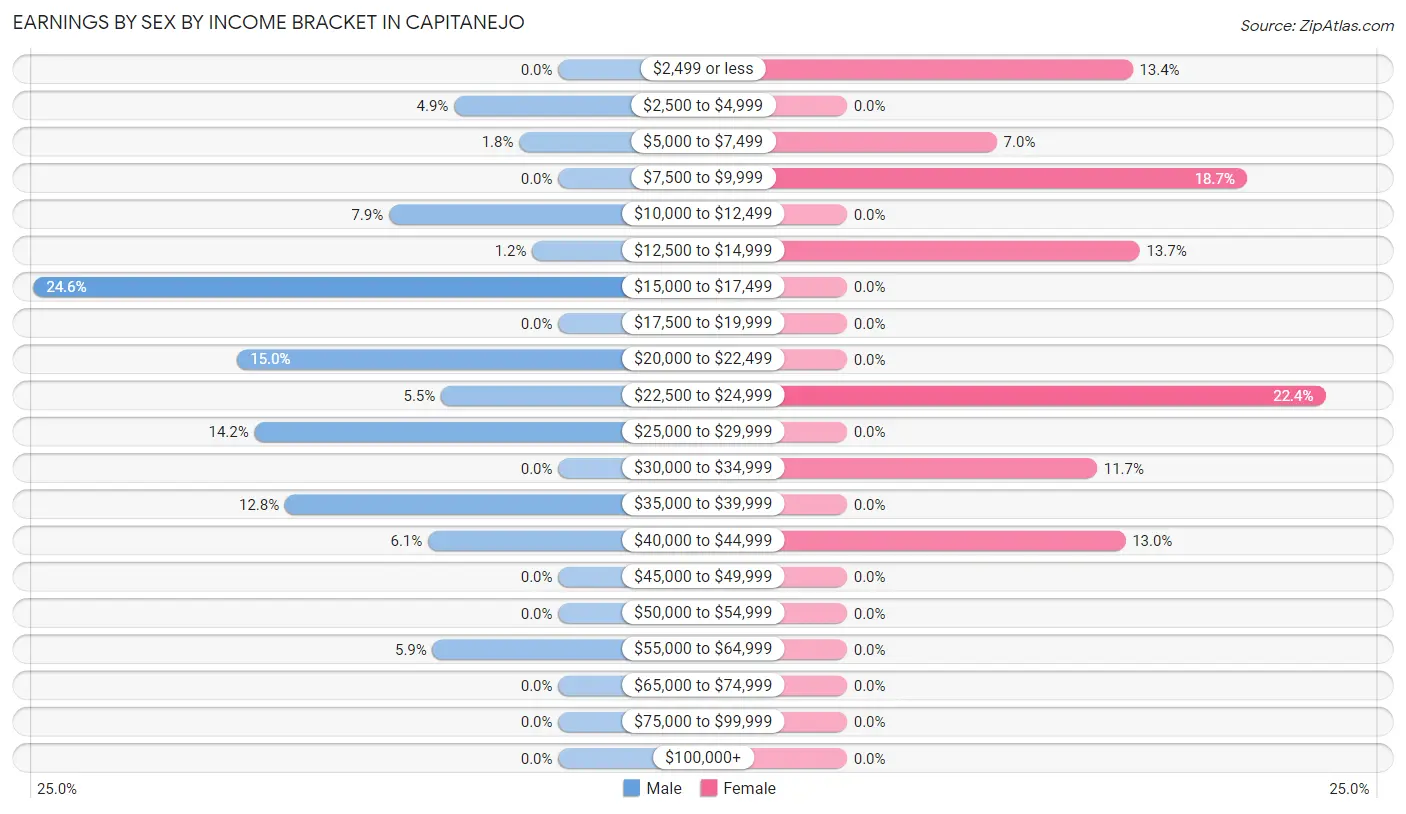
Earnings by Sex by Income Bracket in Capitanejo
The most common earnings brackets in Capitanejo are $15,000 to $17,499 for men (121 | 24.6%) and $22,500 to $24,999 for women (67 | 22.4%).
| Income | Male | Female |
| $2,499 or less | 0 (0.0%) | 40 (13.4%) |
| $2,500 to $4,999 | 24 (4.9%) | 0 (0.0%) |
| $5,000 to $7,499 | 9 (1.8%) | 21 (7.0%) |
| $7,500 to $9,999 | 0 (0.0%) | 56 (18.7%) |
| $10,000 to $12,499 | 39 (7.9%) | 0 (0.0%) |
| $12,500 to $14,999 | 6 (1.2%) | 41 (13.7%) |
| $15,000 to $17,499 | 121 (24.6%) | 0 (0.0%) |
| $17,500 to $19,999 | 0 (0.0%) | 0 (0.0%) |
| $20,000 to $22,499 | 74 (15.0%) | 0 (0.0%) |
| $22,500 to $24,999 | 27 (5.5%) | 67 (22.4%) |
| $25,000 to $29,999 | 70 (14.2%) | 0 (0.0%) |
| $30,000 to $34,999 | 0 (0.0%) | 35 (11.7%) |
| $35,000 to $39,999 | 63 (12.8%) | 0 (0.0%) |
| $40,000 to $44,999 | 30 (6.1%) | 39 (13.0%) |
| $45,000 to $49,999 | 0 (0.0%) | 0 (0.0%) |
| $50,000 to $54,999 | 0 (0.0%) | 0 (0.0%) |
| $55,000 to $64,999 | 29 (5.9%) | 0 (0.0%) |
| $65,000 to $74,999 | 0 (0.0%) | 0 (0.0%) |
| $75,000 to $99,999 | 0 (0.0%) | 0 (0.0%) |
| $100,000+ | 0 (0.0%) | 0 (0.0%) |
| Total | 492 (100.0%) | 299 (100.0%) |
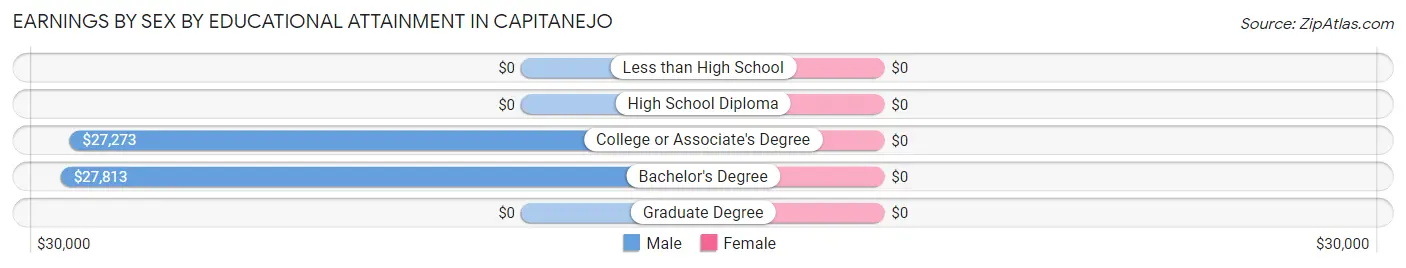
Earnings by Sex by Educational Attainment in Capitanejo
| Educational Attainment | Male Income | Female Income |
| Less than High School | - | - |
| High School Diploma | - | - |
| College or Associate's Degree | $27,273 | $0 |
| Bachelor's Degree | $27,813 | $0 |
| Graduate Degree | - | - |
| Total | $25,170 | $22,575 |
Family Income in Capitanejo
Family Income Brackets in Capitanejo
According to the Capitanejo family income data, there are 242 families falling into the $35,000 to $49,999 income range, which is the most common income bracket and makes up 34.8% of all families.
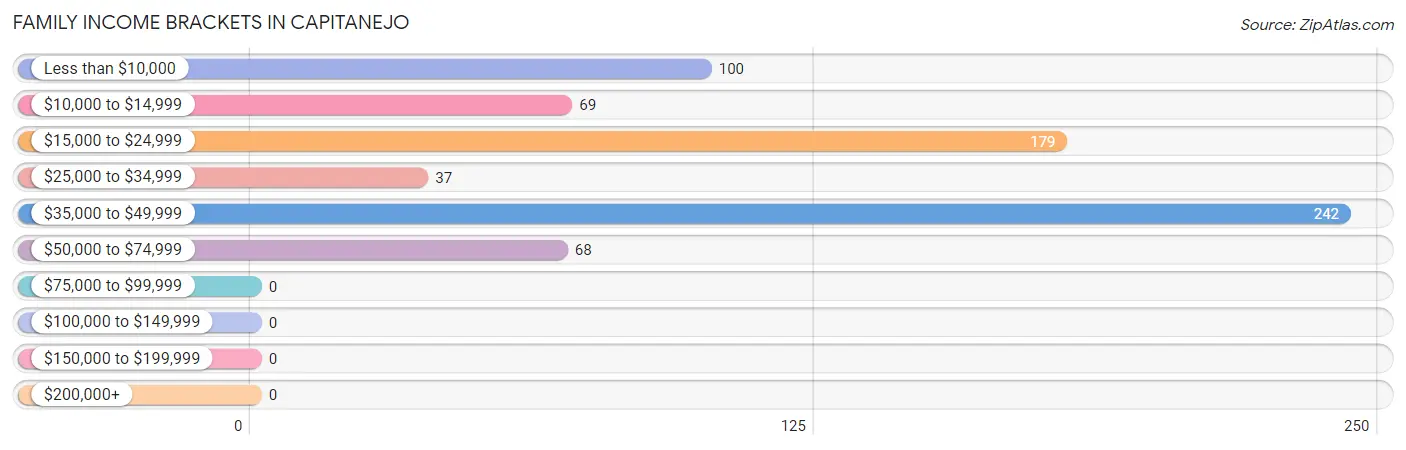
| Income Bracket | # Families | % Families |
| Less than $10,000 | 100 | 14.4% |
| $10,000 to $14,999 | 69 | 9.9% |
| $15,000 to $24,999 | 179 | 25.8% |
| $25,000 to $34,999 | 37 | 5.3% |
| $35,000 to $49,999 | 242 | 34.8% |
| $50,000 to $74,999 | 68 | 9.8% |
| $75,000 to $99,999 | 0 | 0.0% |
| $100,000 to $149,999 | 0 | 0.0% |
| $150,000 to $199,999 | 0 | 0.0% |
| $200,000+ | 0 | 0.0% |
Family Income by Famaliy Size in Capitanejo
4-person families (235 | 33.8%) account for the highest median family income in Capitanejo with $39,063 per family, while 3-person families (163 | 23.4%) have the highest median income of $12,595 per family member.
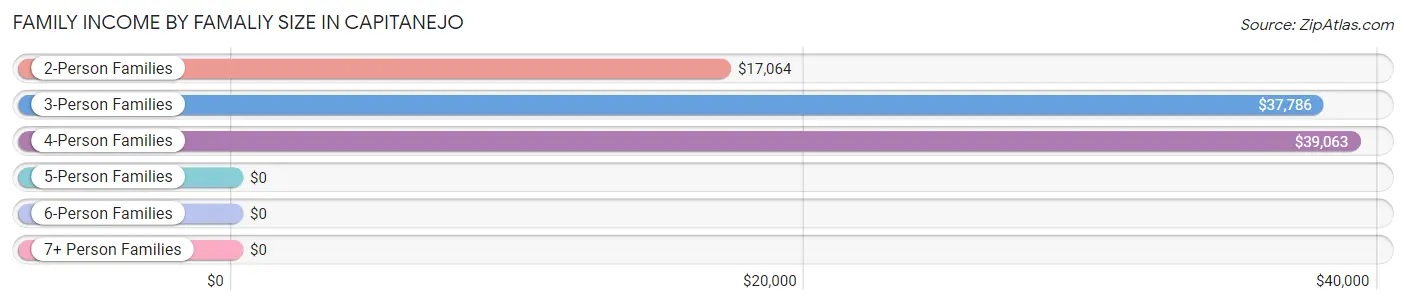
| Income Bracket | # Families | Median Income |
| 2-Person Families | 297 (42.7%) | $17,064 |
| 3-Person Families | 163 (23.4%) | $37,786 |
| 4-Person Families | 235 (33.8%) | $39,063 |
| 5-Person Families | 0 (0.0%) | $0 |
| 6-Person Families | 0 (0.0%) | $0 |
| 7+ Person Families | 0 (0.0%) | $0 |
| Total | 695 (100.0%) | $22,473 |
Family Income by Number of Earners in Capitanejo
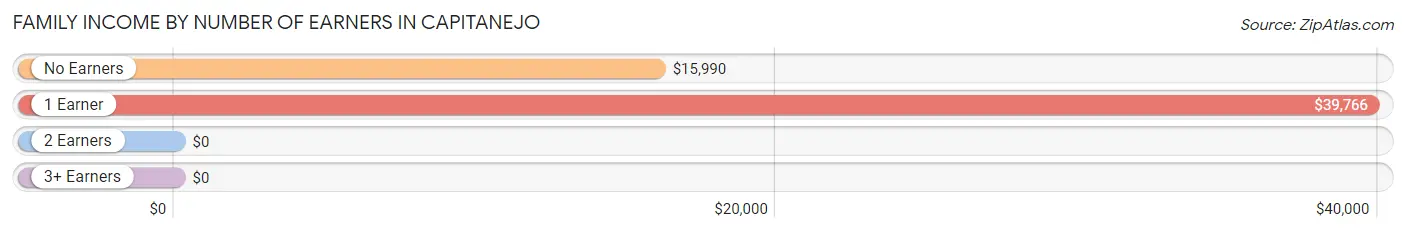
| Number of Earners | # Families | Median Income |
| No Earners | 309 (44.5%) | $15,990 |
| 1 Earner | 273 (39.3%) | $39,766 |
| 2 Earners | 68 (9.8%) | $0 |
| 3+ Earners | 45 (6.5%) | $0 |
| Total | 695 (100.0%) | $22,473 |
Household Income in Capitanejo
Household Income Brackets in Capitanejo
With 237 households falling in the category, the $15,000 to $24,999 income range is the most frequent in Capitanejo, accounting for 24.9% of all households.
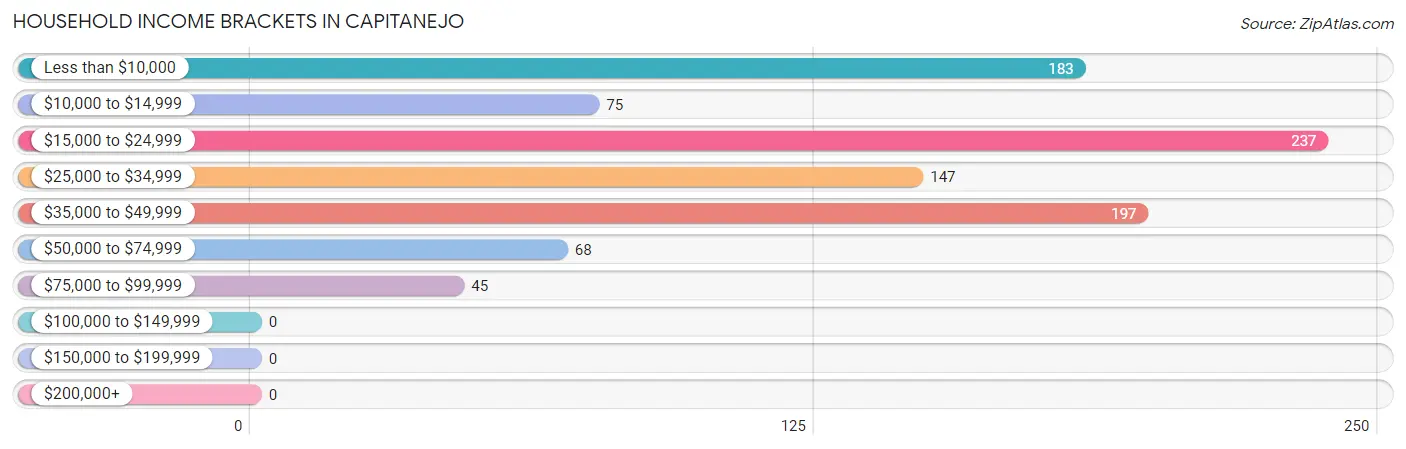
| Income Bracket | # Households | % Households |
| Less than $10,000 | 183 | 19.2% |
| $10,000 to $14,999 | 75 | 7.9% |
| $15,000 to $24,999 | 237 | 24.9% |
| $25,000 to $34,999 | 147 | 15.4% |
| $35,000 to $49,999 | 197 | 20.7% |
| $50,000 to $74,999 | 68 | 7.1% |
| $75,000 to $99,999 | 45 | 4.7% |
| $100,000 to $149,999 | 0 | 0.0% |
| $150,000 to $199,999 | 0 | 0.0% |
| $200,000+ | 0 | 0.0% |
Household Income by Householder Age in Capitanejo
The median household income in Capitanejo is $23,681, with the highest median household income of $37,670 found in the 25 to 44 years age bracket for the primary householder. A total of 250 households (26.3%) fall into this category.
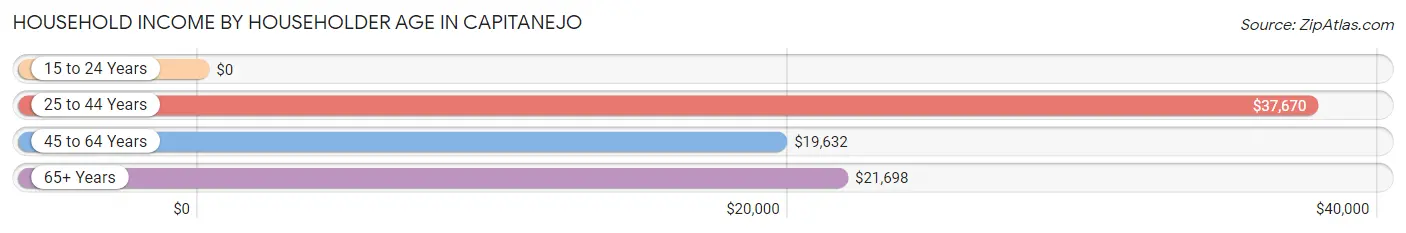
| Income Bracket | # Households | Median Income |
| 15 to 24 Years | 0 (0.0%) | $0 |
| 25 to 44 Years | 250 (26.3%) | $37,670 |
| 45 to 64 Years | 462 (48.5%) | $19,632 |
| 65+ Years | 240 (25.2%) | $21,698 |
| Total | 952 (100.0%) | $23,681 |
Poverty in Capitanejo
Income Below Poverty by Sex and Age in Capitanejo
With 41.5% poverty level for males and 47.5% for females among the residents of Capitanejo, under 5 year old males and 15 year old females are the most vulnerable to poverty, with 61 males (100.0%) and 13 females (100.0%) in their respective age groups living below the poverty level.
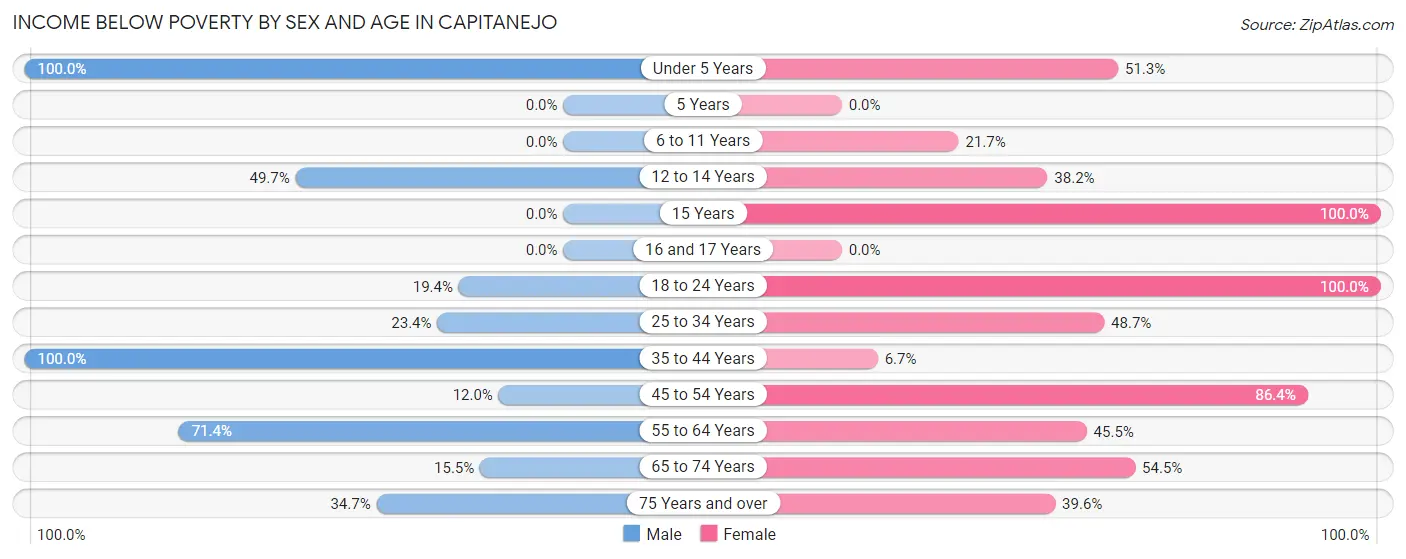
| Age Bracket | Male | Female |
| Under 5 Years | 61 (100.0%) | 40 (51.3%) |
| 5 Years | 0 (0.0%) | 0 (0.0%) |
| 6 to 11 Years | 0 (0.0%) | 13 (21.7%) |
| 12 to 14 Years | 87 (49.7%) | 58 (38.2%) |
| 15 Years | 0 (0.0%) | 13 (100.0%) |
| 16 and 17 Years | 0 (0.0%) | 0 (0.0%) |
| 18 to 24 Years | 33 (19.4%) | 31 (100.0%) |
| 25 to 34 Years | 36 (23.4%) | 75 (48.7%) |
| 35 to 44 Years | 24 (100.0%) | 9 (6.7%) |
| 45 to 54 Years | 21 (12.0%) | 204 (86.4%) |
| 55 to 64 Years | 272 (71.4%) | 70 (45.5%) |
| 65 to 74 Years | 17 (15.4%) | 104 (54.4%) |
| 75 Years and over | 17 (34.7%) | 40 (39.6%) |
| Total | 568 (41.5%) | 657 (47.5%) |
Income Above Poverty by Sex and Age in Capitanejo
According to the poverty statistics in Capitanejo, males aged 6 to 11 years and females aged 16 and 17 years are the age groups that are most secure financially, with 100.0% of males and 100.0% of females in these age groups living above the poverty line.
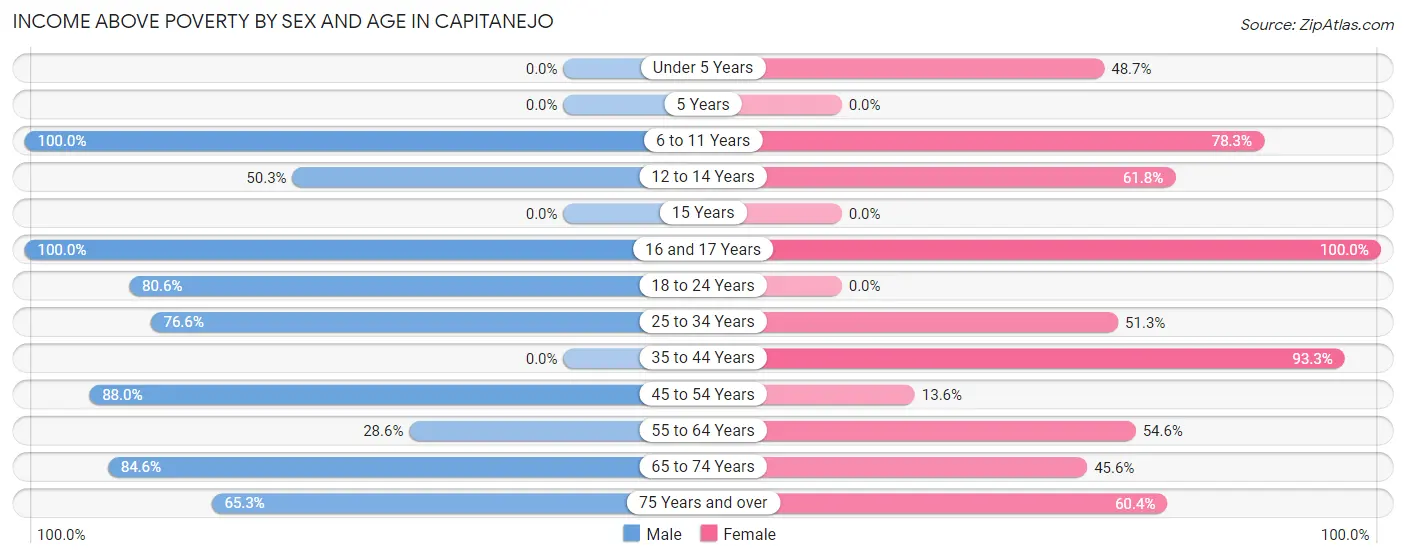
| Age Bracket | Male | Female |
| Under 5 Years | 0 (0.0%) | 38 (48.7%) |
| 5 Years | 0 (0.0%) | 0 (0.0%) |
| 6 to 11 Years | 41 (100.0%) | 47 (78.3%) |
| 12 to 14 Years | 88 (50.3%) | 94 (61.8%) |
| 15 Years | 0 (0.0%) | 0 (0.0%) |
| 16 and 17 Years | 27 (100.0%) | 79 (100.0%) |
| 18 to 24 Years | 137 (80.6%) | 0 (0.0%) |
| 25 to 34 Years | 118 (76.6%) | 79 (51.3%) |
| 35 to 44 Years | 0 (0.0%) | 126 (93.3%) |
| 45 to 54 Years | 154 (88.0%) | 32 (13.6%) |
| 55 to 64 Years | 109 (28.6%) | 84 (54.5%) |
| 65 to 74 Years | 93 (84.6%) | 87 (45.6%) |
| 75 Years and over | 32 (65.3%) | 61 (60.4%) |
| Total | 799 (58.5%) | 727 (52.5%) |
Income Below Poverty Among Married-Couple Families in Capitanejo
The poverty statistics for married-couple families in Capitanejo show that 21.9% or 75 of the total 342 families live below the poverty line. Families with no children have the highest poverty rate of 30.9%, comprising of 64 families. On the other hand, families with 1 or 2 children have the lowest poverty rate of 8.2%, which includes 11 families.
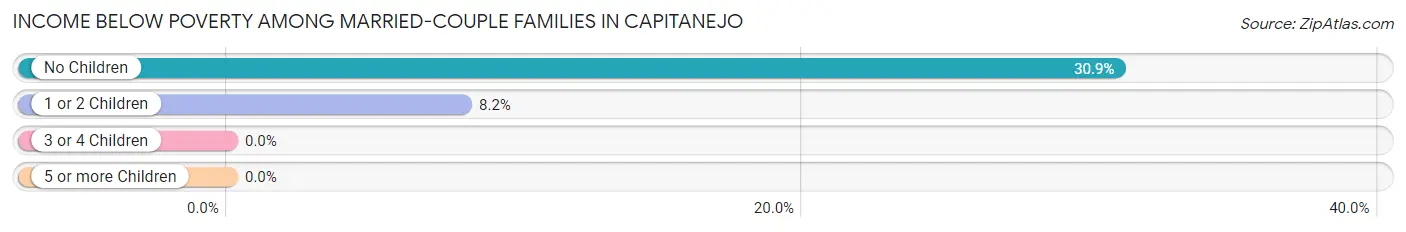
| Children | Above Poverty | Below Poverty |
| No Children | 143 (69.1%) | 64 (30.9%) |
| 1 or 2 Children | 124 (91.8%) | 11 (8.2%) |
| 3 or 4 Children | 0 (0.0%) | 0 (0.0%) |
| 5 or more Children | 0 (0.0%) | 0 (0.0%) |
| Total | 267 (78.1%) | 75 (21.9%) |
Income Below Poverty Among Single-Parent Households in Capitanejo
According to the poverty data in Capitanejo, 73.6% or 53 single-father households and 61.9% or 174 single-mother households are living below the poverty line. Among single-father households, those with 1 or 2 children have the highest poverty rate, with 49 households (100.0%) experiencing poverty. Likewise, among single-mother households, those with 3 or 4 children have the highest poverty rate, with 39 households (100.0%) falling below the poverty line.
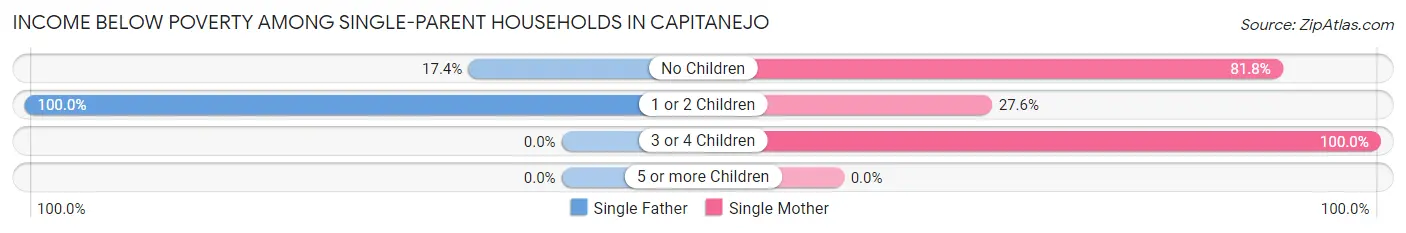
| Children | Single Father | Single Mother |
| No Children | 4 (17.4%) | 103 (81.8%) |
| 1 or 2 Children | 49 (100.0%) | 32 (27.6%) |
| 3 or 4 Children | 0 (0.0%) | 39 (100.0%) |
| 5 or more Children | 0 (0.0%) | 0 (0.0%) |
| Total | 53 (73.6%) | 174 (61.9%) |
Income Below Poverty Among Married-Couple vs Single-Parent Households in Capitanejo
The poverty data for Capitanejo shows that 75 of the married-couple family households (21.9%) and 227 of the single-parent households (64.3%) are living below the poverty level. Within the married-couple family households, those with no children have the highest poverty rate, with 64 households (30.9%) falling below the poverty line. Among the single-parent households, those with 3 or 4 children have the highest poverty rate, with 39 household (100.0%) living below poverty.
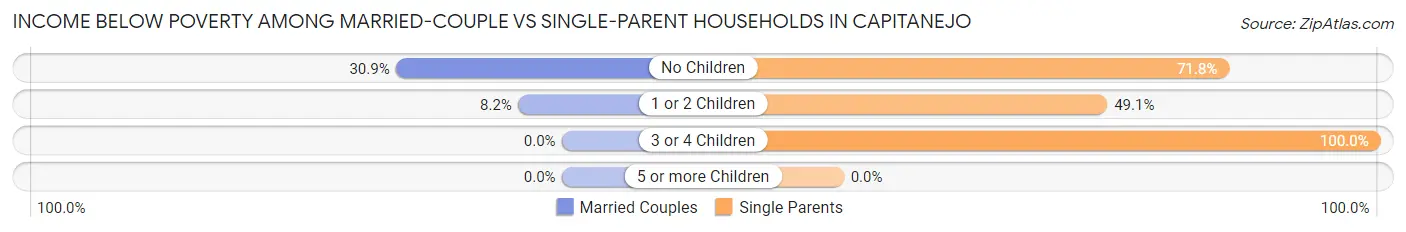
| Children | Married-Couple Families | Single-Parent Households |
| No Children | 64 (30.9%) | 107 (71.8%) |
| 1 or 2 Children | 11 (8.2%) | 81 (49.1%) |
| 3 or 4 Children | 0 (0.0%) | 39 (100.0%) |
| 5 or more Children | 0 (0.0%) | 0 (0.0%) |
| Total | 75 (21.9%) | 227 (64.3%) |
Race in Capitanejo
The most populous races in Capitanejo are Hispanic or Latino (2,751 | 100.0%), Two or more Races (2,030 | 73.8%), and White / Caucasian (528 | 19.2%).
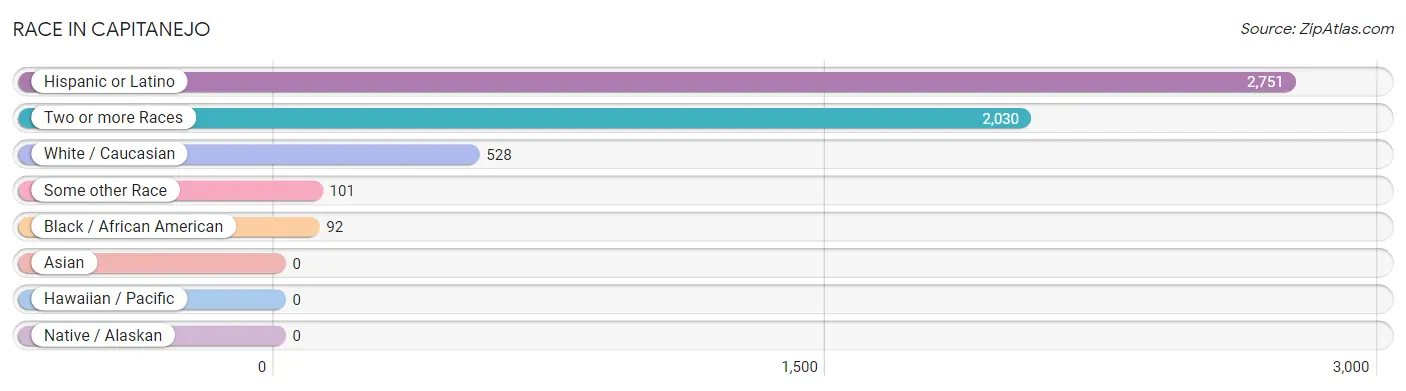
| Race | # Population | % Population |
| Asian | 0 | 0.0% |
| Black / African American | 92 | 3.3% |
| Hawaiian / Pacific | 0 | 0.0% |
| Hispanic or Latino | 2,751 | 100.0% |
| Native / Alaskan | 0 | 0.0% |
| White / Caucasian | 528 | 19.2% |
| Two or more Races | 2,030 | 73.8% |
| Some other Race | 101 | 3.7% |
| Total | 2,751 | 100.0% |
Ancestry in Capitanejo
The most populous ancestries reported in Capitanejo are Puerto Rican (2,751 | 100.0%), African (6 | 0.2%), Central American Indian (6 | 0.2%), and Subsaharan African (6 | 0.2%), together accounting for 100.7% of all Capitanejo residents.
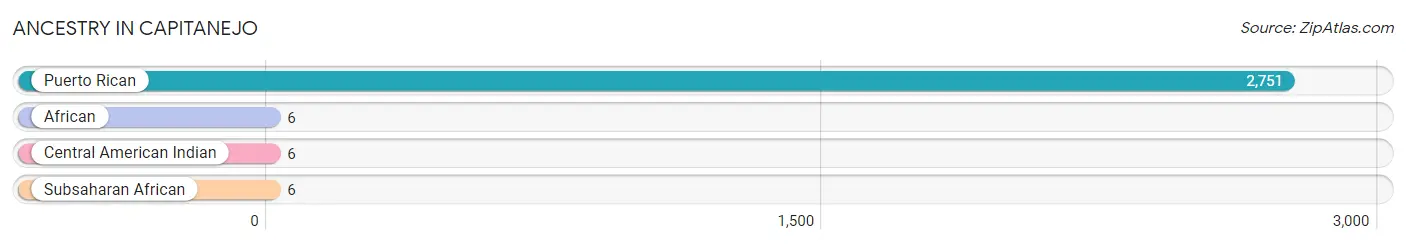
| Ancestry | # Population | % Population |
| African | 6 | 0.2% |
| Central American Indian | 6 | 0.2% |
| Puerto Rican | 2,751 | 100.0% |
| Subsaharan African | 6 | 0.2% | View All 4 Rows |
Immigrants in Capitanejo

| Immigration Origin | # Population | % Population | View All 0 Rows |
Sex and Age in Capitanejo
Sex and Age in Capitanejo
The most populous age groups in Capitanejo are 55 to 59 Years (217 | 15.9%) for men and 30 to 34 Years (154 | 11.1%) for women.
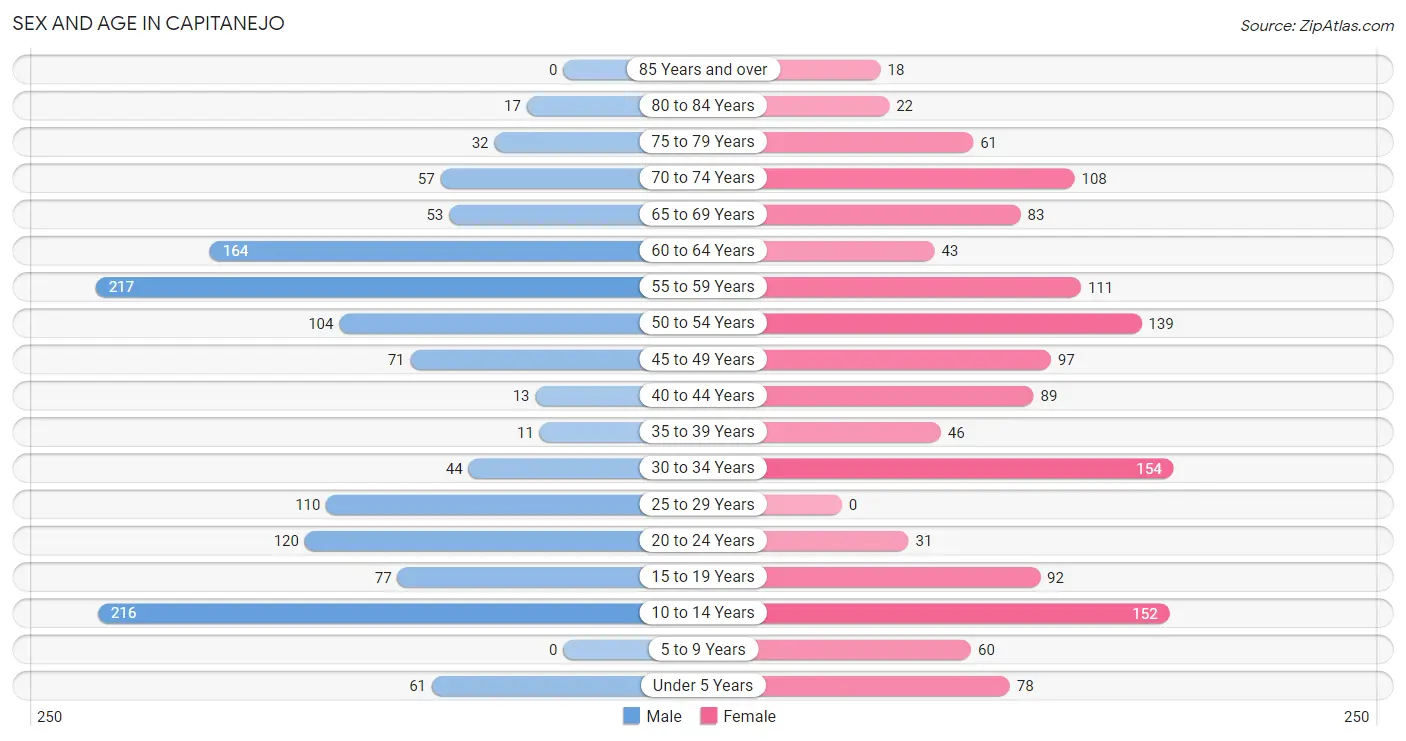
| Age Bracket | Male | Female |
| Under 5 Years | 61 (4.5%) | 78 (5.6%) |
| 5 to 9 Years | 0 (0.0%) | 60 (4.3%) |
| 10 to 14 Years | 216 (15.8%) | 152 (11.0%) |
| 15 to 19 Years | 77 (5.6%) | 92 (6.7%) |
| 20 to 24 Years | 120 (8.8%) | 31 (2.2%) |
| 25 to 29 Years | 110 (8.1%) | 0 (0.0%) |
| 30 to 34 Years | 44 (3.2%) | 154 (11.1%) |
| 35 to 39 Years | 11 (0.8%) | 46 (3.3%) |
| 40 to 44 Years | 13 (0.9%) | 89 (6.4%) |
| 45 to 49 Years | 71 (5.2%) | 97 (7.0%) |
| 50 to 54 Years | 104 (7.6%) | 139 (10.0%) |
| 55 to 59 Years | 217 (15.9%) | 111 (8.0%) |
| 60 to 64 Years | 164 (12.0%) | 43 (3.1%) |
| 65 to 69 Years | 53 (3.9%) | 83 (6.0%) |
| 70 to 74 Years | 57 (4.2%) | 108 (7.8%) |
| 75 to 79 Years | 32 (2.3%) | 61 (4.4%) |
| 80 to 84 Years | 17 (1.2%) | 22 (1.6%) |
| 85 Years and over | 0 (0.0%) | 18 (1.3%) |
| Total | 1,367 (100.0%) | 1,384 (100.0%) |
Families and Households in Capitanejo
Median Family Size in Capitanejo
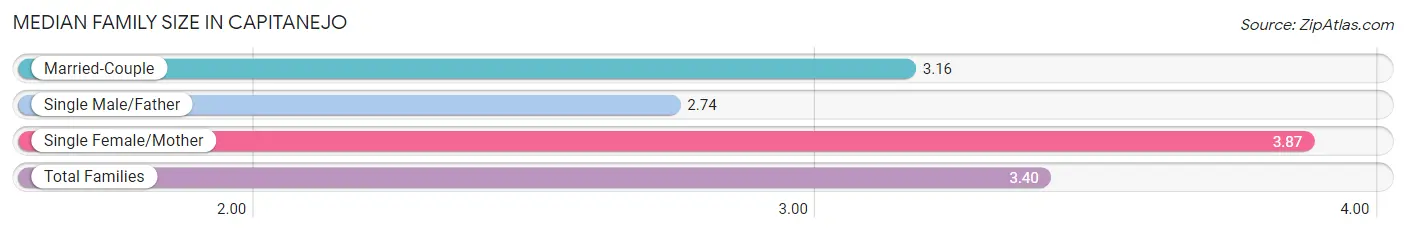
The median family size in Capitanejo is 3.40 persons per family, with single female/mother families (281 | 40.4%) accounting for the largest median family size of 3.87 persons per family. On the other hand, single male/father families (72 | 10.4%) represent the smallest median family size with 2.74 persons per family.
| Family Type | # Families | Family Size |
| Married-Couple | 342 (49.2%) | 3.16 |
| Single Male/Father | 72 (10.4%) | 2.74 |
| Single Female/Mother | 281 (40.4%) | 3.87 |
| Total Families | 695 (100.0%) | 3.40 |
Median Household Size in Capitanejo
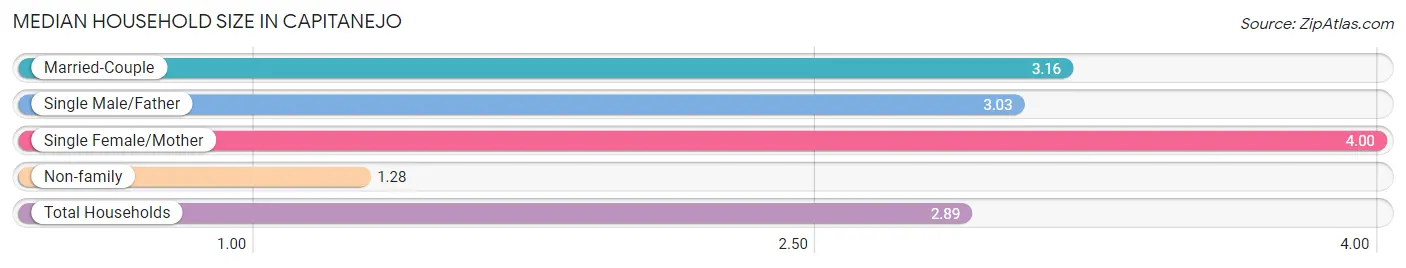
The median household size in Capitanejo is 2.89 persons per household, with single female/mother households (281 | 29.5%) accounting for the largest median household size of 4 persons per household. non-family households (257 | 27.0%) represent the smallest median household size with 1.28 persons per household.
| Household Type | # Households | Household Size |
| Married-Couple | 342 (35.9%) | 3.16 |
| Single Male/Father | 72 (7.6%) | 3.03 |
| Single Female/Mother | 281 (29.5%) | 4.00 |
| Non-family | 257 (27.0%) | 1.28 |
| Total Households | 952 (100.0%) | 2.89 |
Household Size by Marriage Status in Capitanejo
Out of a total of 952 households in Capitanejo, 695 (73.0%) are family households, while 257 (27.0%) are nonfamily households. The most numerous type of family households are 2-person households, comprising 254, and the most common type of nonfamily households are 1-person households, comprising 168.
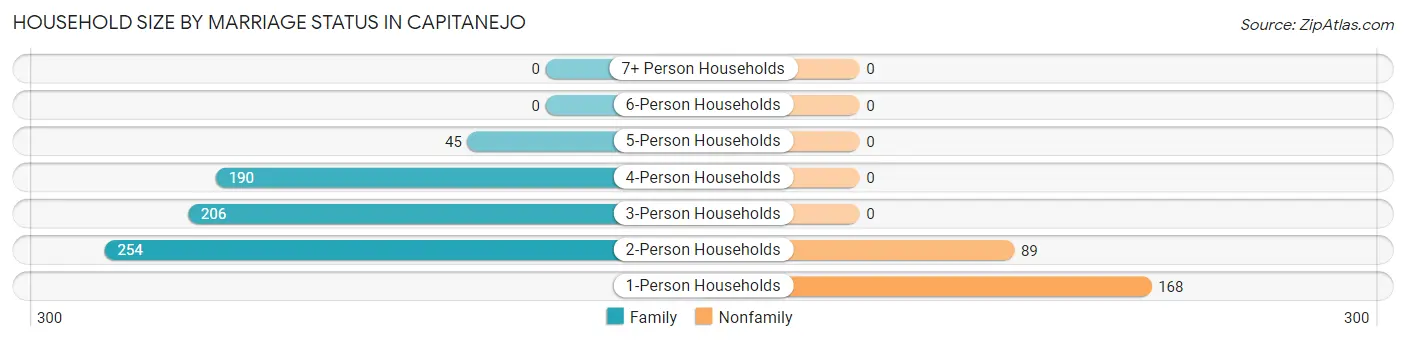
| Household Size | Family Households | Nonfamily Households |
| 1-Person Households | - | 168 (17.6%) |
| 2-Person Households | 254 (26.7%) | 89 (9.3%) |
| 3-Person Households | 206 (21.6%) | 0 (0.0%) |
| 4-Person Households | 190 (20.0%) | 0 (0.0%) |
| 5-Person Households | 45 (4.7%) | 0 (0.0%) |
| 6-Person Households | 0 (0.0%) | 0 (0.0%) |
| 7+ Person Households | 0 (0.0%) | 0 (0.0%) |
| Total | 695 (73.0%) | 257 (27.0%) |
Female Fertility in Capitanejo
Fertility by Age in Capitanejo
Average fertility rate in Capitanejo is 41.0 births per 1,000 women. Women in the age bracket of 20 to 34 years have the highest fertility rate with 114.0 births per 1,000 women. Women in the age bracket of 20 to 34 years acount for 100.0% of all women with births.
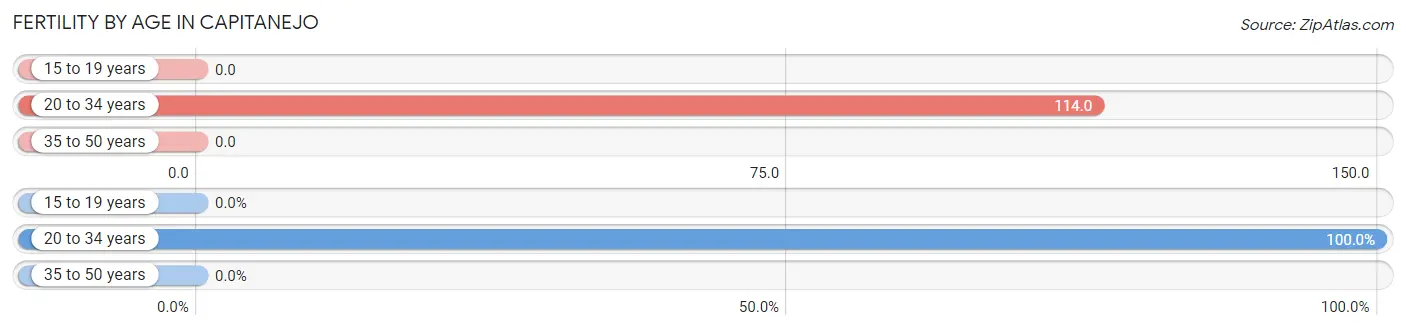
| Age Bracket | Women with Births | Births / 1,000 Women |
| 15 to 19 years | 0 (0.0%) | 0.0 |
| 20 to 34 years | 21 (100.0%) | 114.0 |
| 35 to 50 years | 0 (0.0%) | 0.0 |
| Total | 21 (100.0%) | 41.0 |
Fertility by Age by Marriage Status in Capitanejo
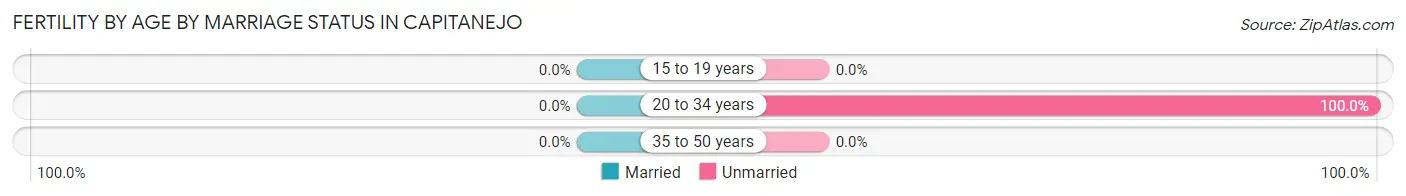
| Age Bracket | Married | Unmarried |
| 15 to 19 years | 0 (0.0%) | 0 (0.0%) |
| 20 to 34 years | 0 (0.0%) | 21 (100.0%) |
| 35 to 50 years | 0 (0.0%) | 0 (0.0%) |
| Total | 0 (0.0%) | 21 (100.0%) |
Fertility by Education in Capitanejo
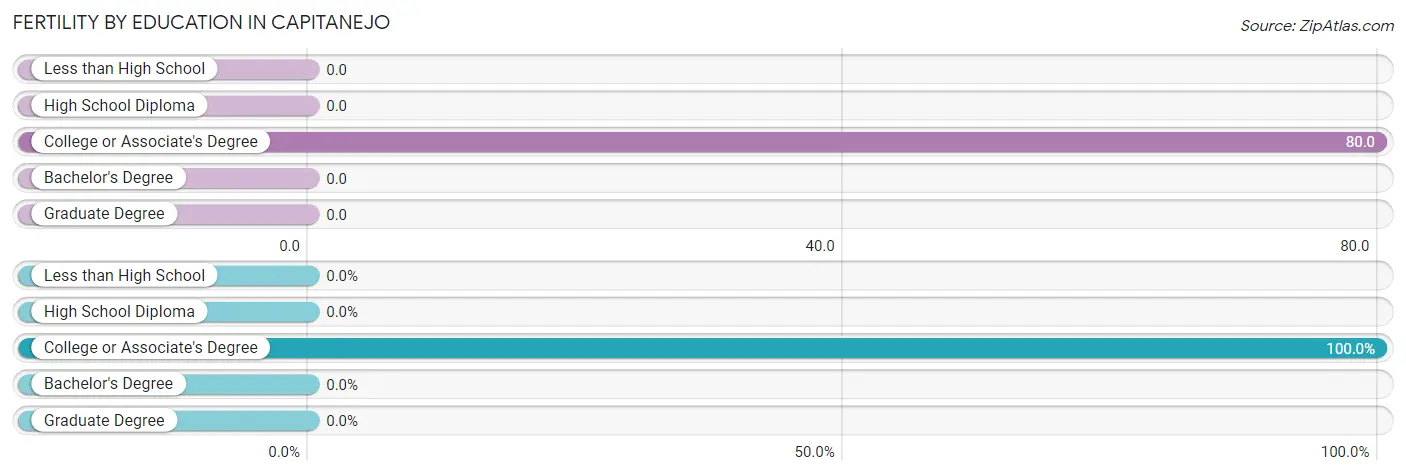
| Educational Attainment | Women with Births | Births / 1,000 Women |
| Less than High School | 0 (0.0%) | 0.0 |
| High School Diploma | 0 (0.0%) | 0.0 |
| College or Associate's Degree | 21 (100.0%) | 80.0 |
| Bachelor's Degree | 0 (0.0%) | 0.0 |
| Graduate Degree | 0 (0.0%) | 0.0 |
| Total | 21 (100.0%) | 41.0 |
Fertility by Education by Marriage Status in Capitanejo
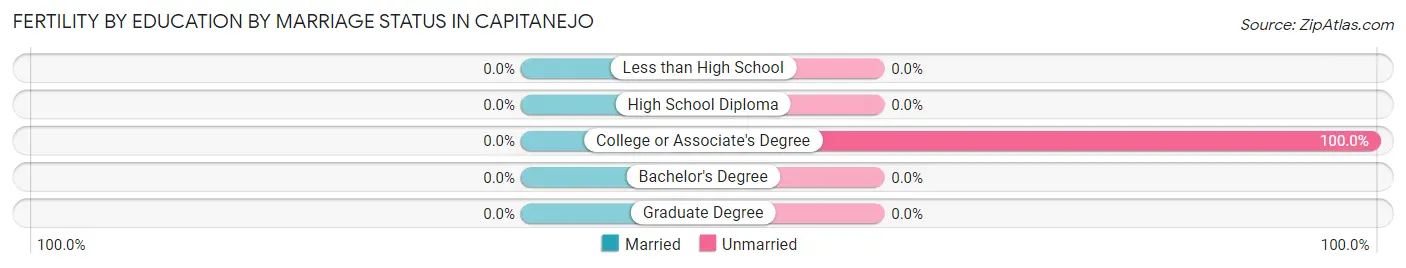
| Educational Attainment | Married | Unmarried |
| Less than High School | 0 (0.0%) | 0 (0.0%) |
| High School Diploma | 0 (0.0%) | 0 (0.0%) |
| College or Associate's Degree | 0 (0.0%) | 21 (100.0%) |
| Bachelor's Degree | 0 (0.0%) | 0 (0.0%) |
| Graduate Degree | 0 (0.0%) | 0 (0.0%) |
| Total | 0 (0.0%) | 21 (100.0%) |
Employment Characteristics in Capitanejo
Employment by Class of Employer in Capitanejo
Among the 718 employed individuals in Capitanejo, private company employees (629 | 87.6%), state government employees (62 | 8.6%), and not-for-profit organizations (27 | 3.8%) make up the most common classes of employment.
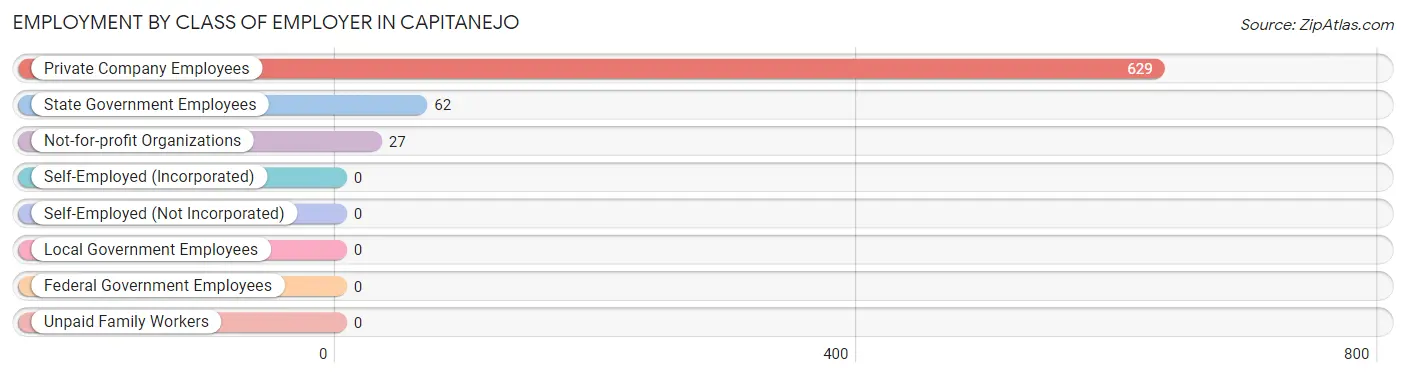
| Employer Class | # Employees | % Employees |
| Private Company Employees | 629 | 87.6% |
| Self-Employed (Incorporated) | 0 | 0.0% |
| Self-Employed (Not Incorporated) | 0 | 0.0% |
| Not-for-profit Organizations | 27 | 3.8% |
| Local Government Employees | 0 | 0.0% |
| State Government Employees | 62 | 8.6% |
| Federal Government Employees | 0 | 0.0% |
| Unpaid Family Workers | 0 | 0.0% |
| Total | 718 | 100.0% |
Employment Status by Age in Capitanejo
According to the labor force statistics for Capitanejo, out of the total population over 16 years of age (2,171), 40.0% or 868 individuals are in the labor force, with 17.4% or 151 of them unemployed. The age group with the highest labor force participation rate is 25 to 29 years, with 100.0% or 110 individuals in the labor force. Within the labor force, the 16 to 19 years age range has the highest percentage of unemployed individuals, with 100.0% or 39 of them being unemployed.
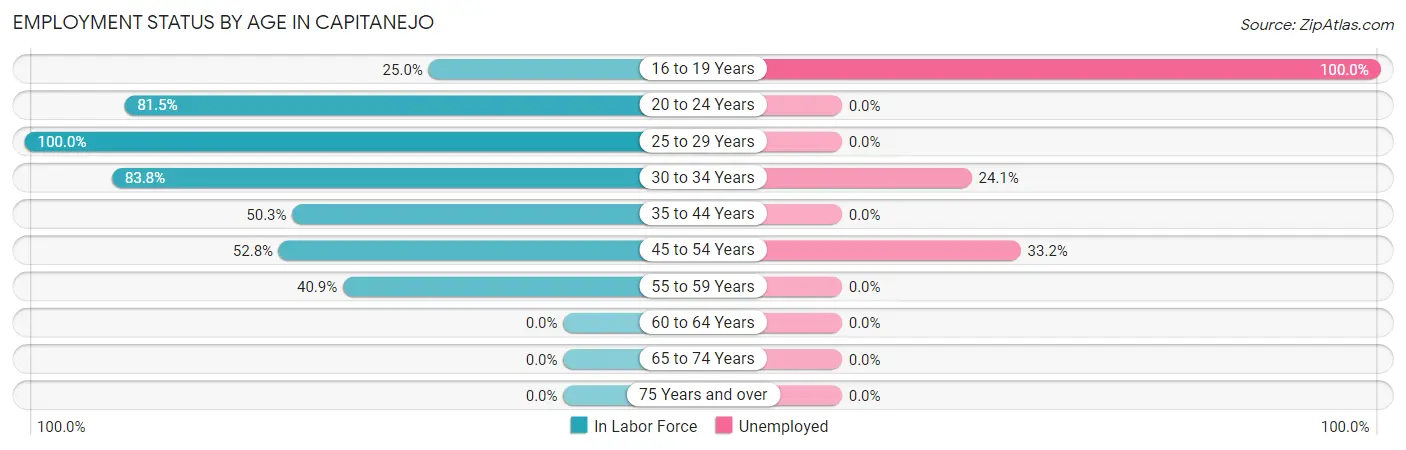
| Age Bracket | In Labor Force | Unemployed |
| 16 to 19 Years | 39 (25.0%) | 39 (100.0%) |
| 20 to 24 Years | 123 (81.5%) | 0 (0.0%) |
| 25 to 29 Years | 110 (100.0%) | 0 (0.0%) |
| 30 to 34 Years | 166 (83.8%) | 40 (24.1%) |
| 35 to 44 Years | 80 (50.3%) | 0 (0.0%) |
| 45 to 54 Years | 217 (52.8%) | 72 (33.2%) |
| 55 to 59 Years | 134 (40.9%) | 0 (0.0%) |
| 60 to 64 Years | 0 (0.0%) | 0 (0.0%) |
| 65 to 74 Years | 0 (0.0%) | 0 (0.0%) |
| 75 Years and over | 0 (0.0%) | 0 (0.0%) |
| Total | 868 (40.0%) | 151 (17.4%) |
Employment Status by Educational Attainment in Capitanejo
According to labor force statistics for Capitanejo, 50.0% of individuals (706) out of the total population between 25 and 64 years of age (1,413) are in the labor force, with 15.8% or 112 of them being unemployed. The group with the highest labor force participation rate are those with the educational attainment of bachelor's degree or higher, with 84.9% or 371 individuals in the labor force. Within the labor force, individuals with high school diploma education have the highest percentage of unemployment, with 54.2% or 26 of them being unemployed.
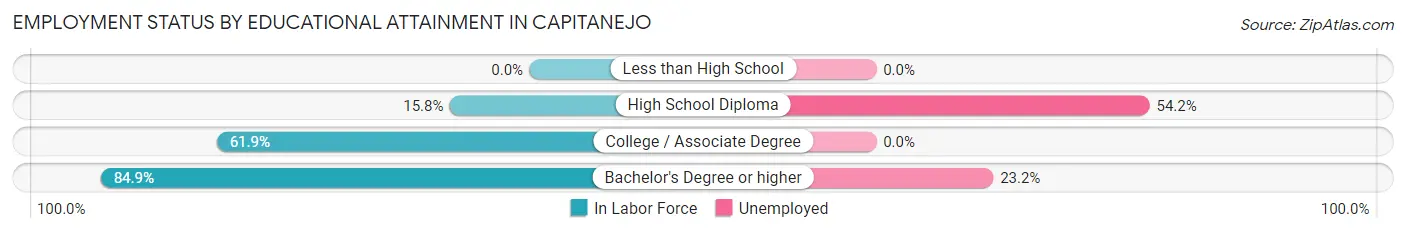
| Educational Attainment | In Labor Force | Unemployed |
| Less than High School | 0 (0.0%) | 0 (0.0%) |
| High School Diploma | 48 (15.8%) | 164 (54.2%) |
| College / Associate Degree | 288 (61.9%) | 0 (0.0%) |
| Bachelor's Degree or higher | 371 (84.9%) | 101 (23.2%) |
| Total | 706 (50.0%) | 223 (15.8%) |
Employment Occupations by Sex in Capitanejo
Management, Business, Science and Arts Occupations
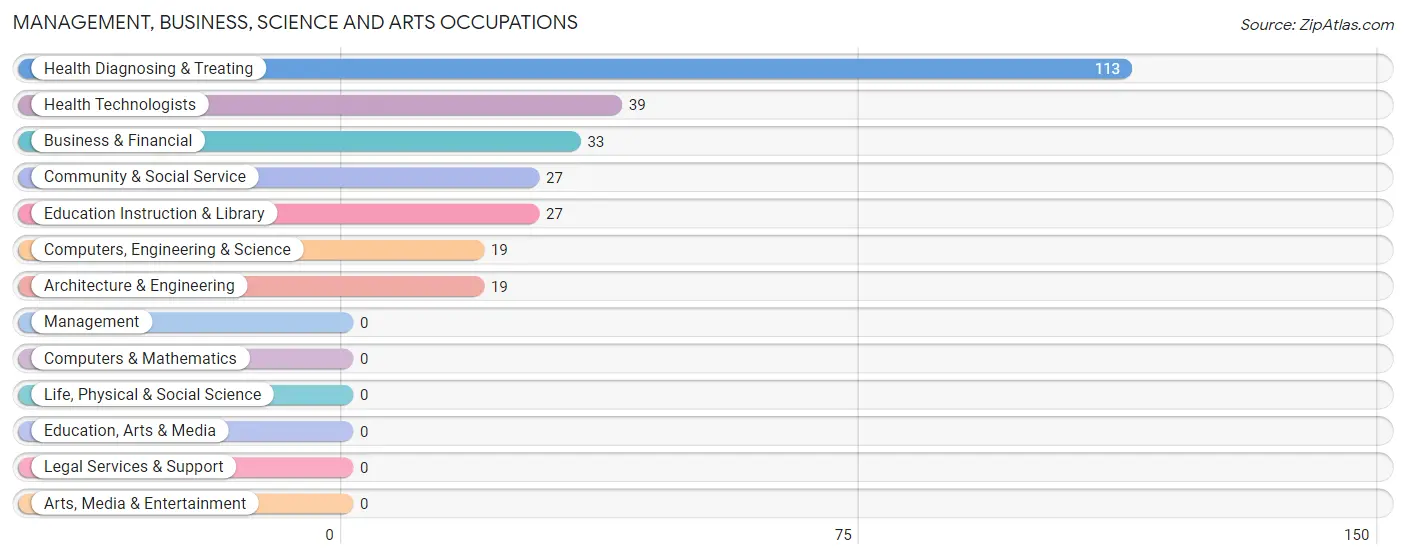
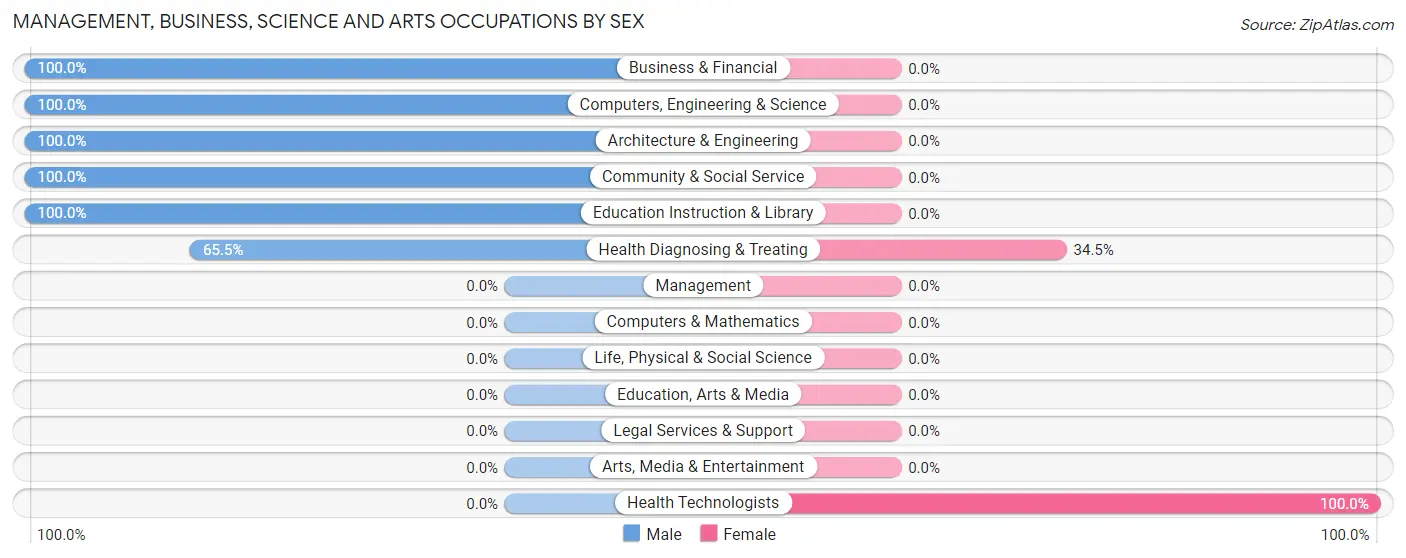
The most common Management, Business, Science and Arts occupations in Capitanejo are Health Diagnosing & Treating (113 | 15.7%), Health Technologists (39 | 5.4%), Business & Financial (33 | 4.6%), Community & Social Service (27 | 3.8%), and Education Instruction & Library (27 | 3.8%).
Management, Business, Science and Arts Occupations by Sex
Within the Management, Business, Science and Arts occupations in Capitanejo, the most male-oriented occupations are Business & Financial (100.0%), Computers, Engineering & Science (100.0%), and Architecture & Engineering (100.0%), while the most female-oriented occupations are Health Technologists (100.0%), and Health Diagnosing & Treating (34.5%).
| Occupation | Male | Female |
| Management | 0 (0.0%) | 0 (0.0%) |
| Business & Financial | 33 (100.0%) | 0 (0.0%) |
| Computers, Engineering & Science | 19 (100.0%) | 0 (0.0%) |
| Computers & Mathematics | 0 (0.0%) | 0 (0.0%) |
| Architecture & Engineering | 19 (100.0%) | 0 (0.0%) |
| Life, Physical & Social Science | 0 (0.0%) | 0 (0.0%) |
| Community & Social Service | 27 (100.0%) | 0 (0.0%) |
| Education, Arts & Media | 0 (0.0%) | 0 (0.0%) |
| Legal Services & Support | 0 (0.0%) | 0 (0.0%) |
| Education Instruction & Library | 27 (100.0%) | 0 (0.0%) |
| Arts, Media & Entertainment | 0 (0.0%) | 0 (0.0%) |
| Health Diagnosing & Treating | 74 (65.5%) | 39 (34.5%) |
| Health Technologists | 0 (0.0%) | 39 (100.0%) |
| Total (Category) | 153 (79.7%) | 39 (20.3%) |
| Total (Overall) | 459 (63.9%) | 259 (36.1%) |
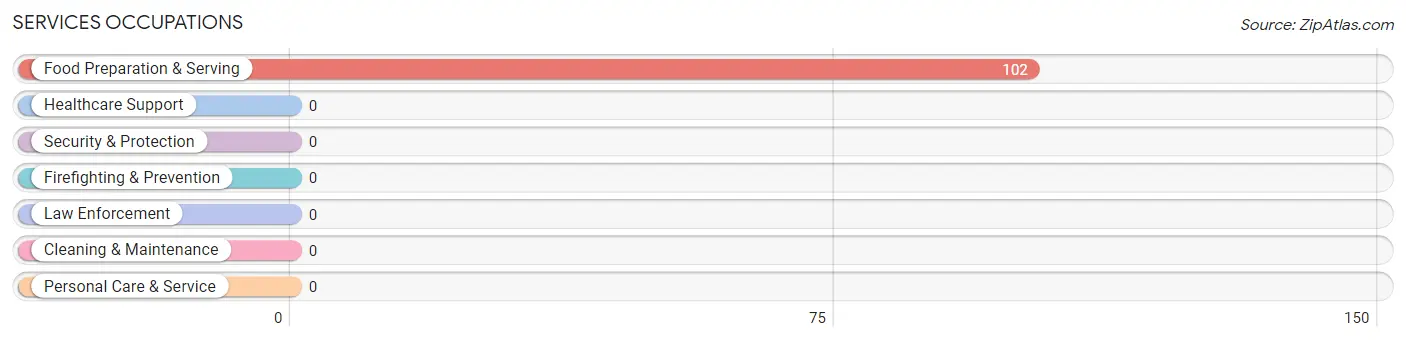
Services Occupations
The most common Services occupations in Capitanejo are , and Food Preparation & Serving (102 | 14.2%).
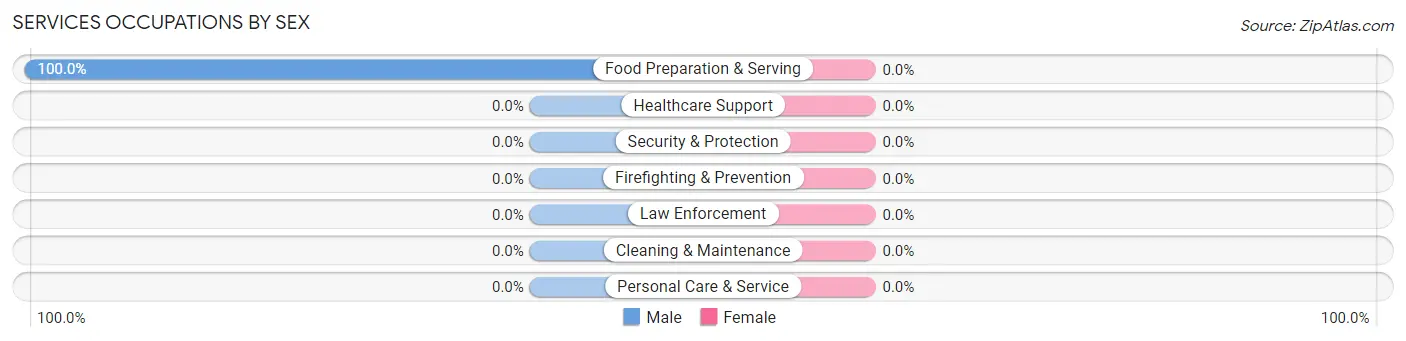
Services Occupations by Sex
| Occupation | Male | Female |
| Healthcare Support | 0 (0.0%) | 0 (0.0%) |
| Security & Protection | 0 (0.0%) | 0 (0.0%) |
| Firefighting & Prevention | 0 (0.0%) | 0 (0.0%) |
| Law Enforcement | 0 (0.0%) | 0 (0.0%) |
| Food Preparation & Serving | 102 (100.0%) | 0 (0.0%) |
| Cleaning & Maintenance | 0 (0.0%) | 0 (0.0%) |
| Personal Care & Service | 0 (0.0%) | 0 (0.0%) |
| Total (Category) | 102 (100.0%) | 0 (0.0%) |
| Total (Overall) | 459 (63.9%) | 259 (36.1%) |
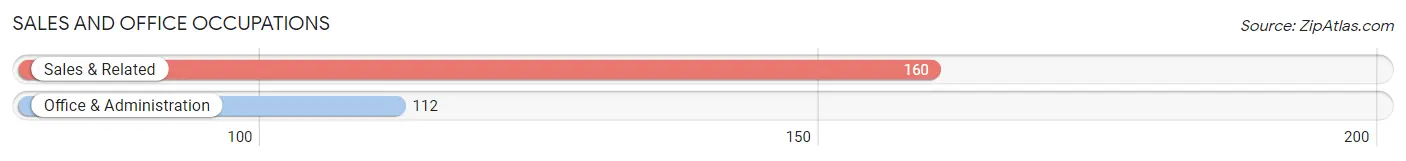
Sales and Office Occupations
The most common Sales and Office occupations in Capitanejo are Sales & Related (160 | 22.3%), and Office & Administration (112 | 15.6%).
Sales and Office Occupations by Sex
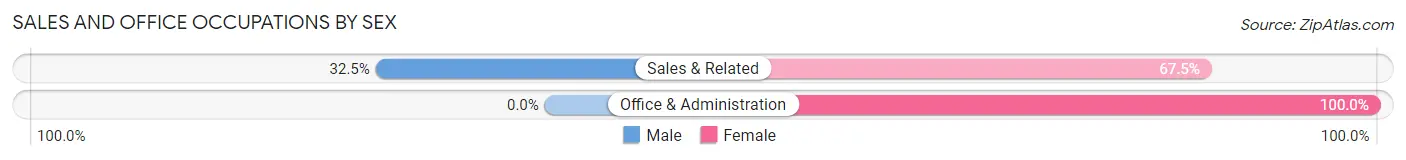
| Occupation | Male | Female |
| Sales & Related | 52 (32.5%) | 108 (67.5%) |
| Office & Administration | 0 (0.0%) | 112 (100.0%) |
| Total (Category) | 52 (19.1%) | 220 (80.9%) |
| Total (Overall) | 459 (63.9%) | 259 (36.1%) |
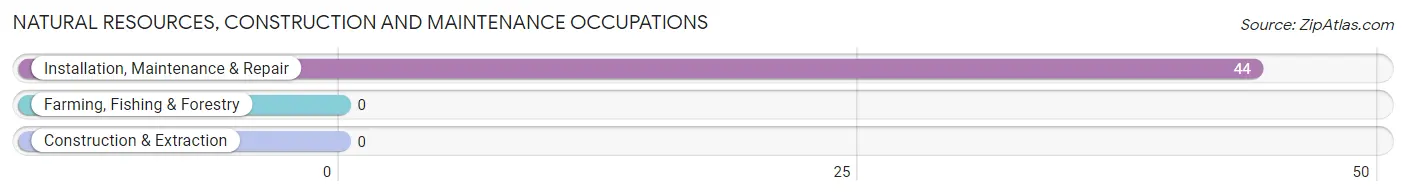
Natural Resources, Construction and Maintenance Occupations
The most common Natural Resources, Construction and Maintenance occupations in Capitanejo are , and Installation, Maintenance & Repair (44 | 6.1%).
Natural Resources, Construction and Maintenance Occupations by Sex
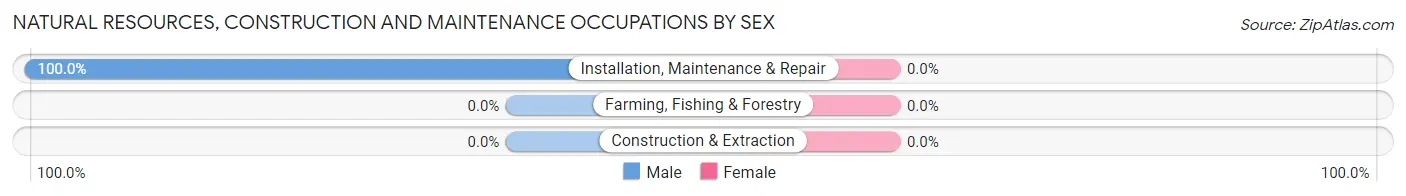
| Occupation | Male | Female |
| Farming, Fishing & Forestry | 0 (0.0%) | 0 (0.0%) |
| Construction & Extraction | 0 (0.0%) | 0 (0.0%) |
| Installation, Maintenance & Repair | 44 (100.0%) | 0 (0.0%) |
| Total (Category) | 44 (100.0%) | 0 (0.0%) |
| Total (Overall) | 459 (63.9%) | 259 (36.1%) |
Production, Transportation and Moving Occupations
The most common Production, Transportation and Moving occupations in Capitanejo are , and Production (108 | 15.0%).
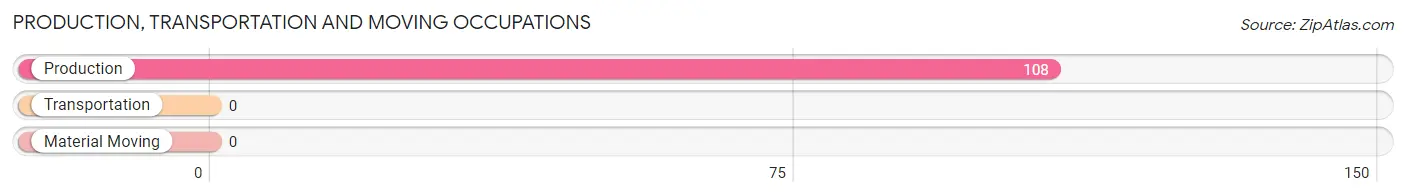
Production, Transportation and Moving Occupations by Sex
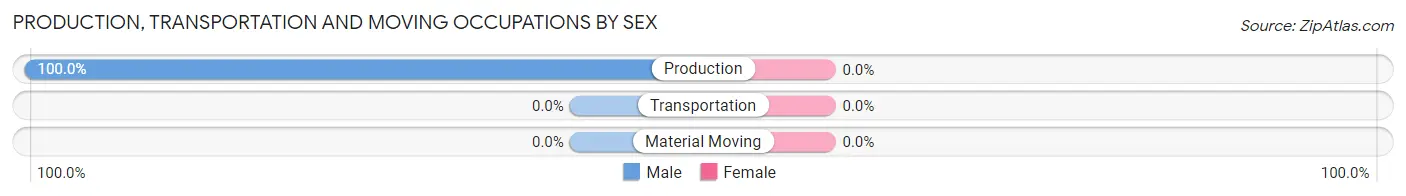
| Occupation | Male | Female |
| Production | 108 (100.0%) | 0 (0.0%) |
| Transportation | 0 (0.0%) | 0 (0.0%) |
| Material Moving | 0 (0.0%) | 0 (0.0%) |
| Total (Category) | 108 (100.0%) | 0 (0.0%) |
| Total (Overall) | 459 (63.9%) | 259 (36.1%) |
Employment Industries by Sex in Capitanejo
Employment Industries in Capitanejo
The major employment industries in Capitanejo include Retail Trade (144 | 20.1%), Manufacturing (121 | 16.9%), Health Care & Social Assistance (113 | 15.7%), Wholesale Trade (111 | 15.5%), and Accommodation & Food Services (102 | 14.2%).
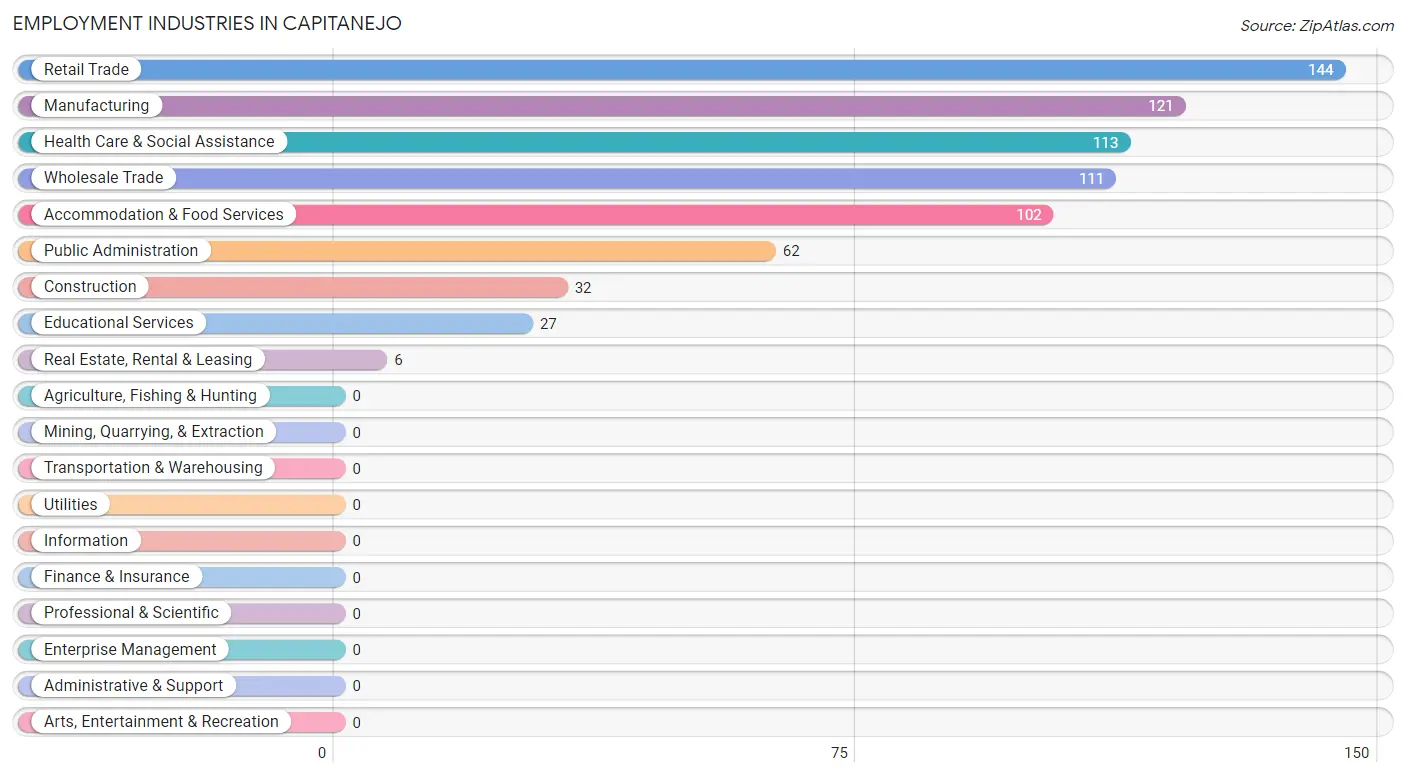
Employment Industries by Sex in Capitanejo
The Capitanejo industries that see more men than women are Manufacturing (100.0%), Real Estate, Rental & Leasing (100.0%), and Educational Services (100.0%), whereas the industries that tend to have a higher number of women are Construction (100.0%), Wholesale Trade (60.4%), and Retail Trade (59.7%).
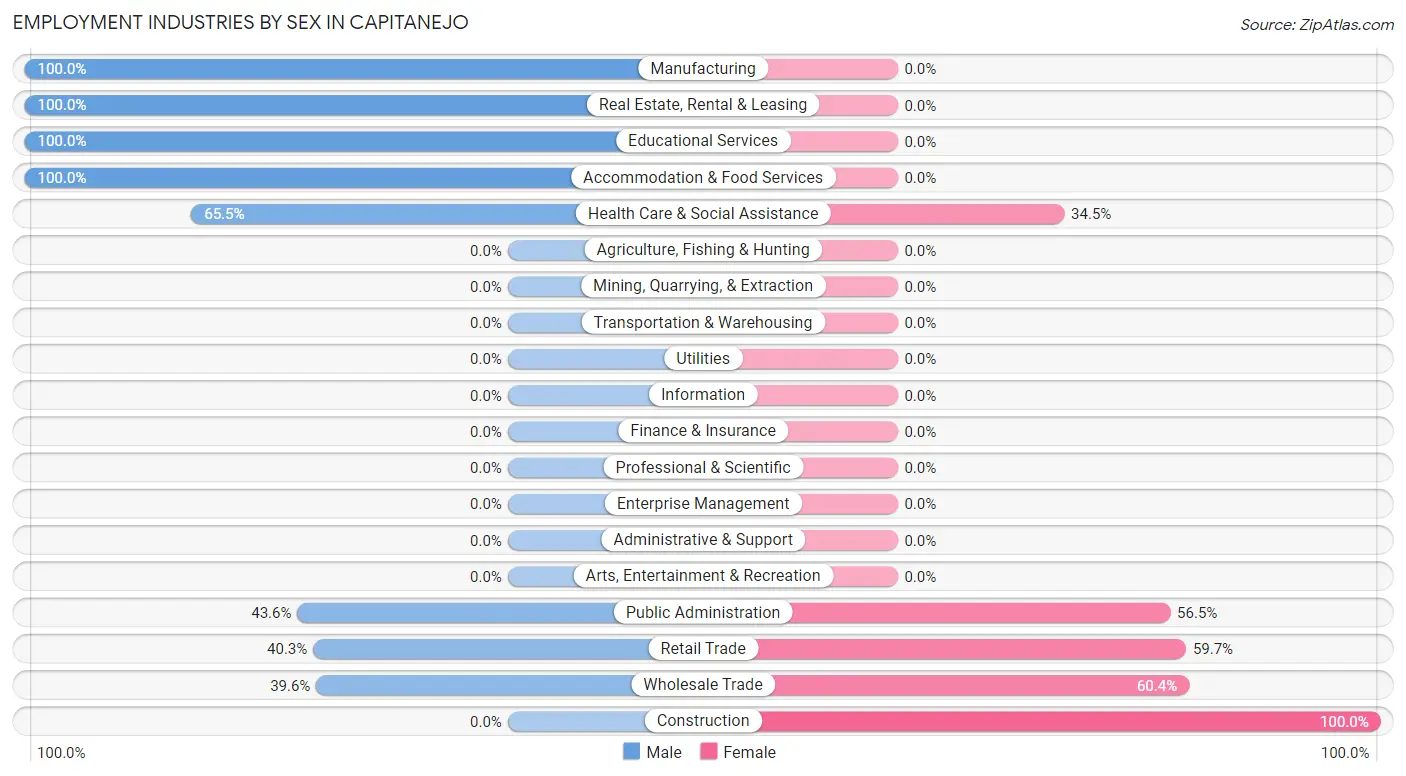
| Industry | Male | Female |
| Agriculture, Fishing & Hunting | 0 (0.0%) | 0 (0.0%) |
| Mining, Quarrying, & Extraction | 0 (0.0%) | 0 (0.0%) |
| Construction | 0 (0.0%) | 32 (100.0%) |
| Manufacturing | 121 (100.0%) | 0 (0.0%) |
| Wholesale Trade | 44 (39.6%) | 67 (60.4%) |
| Retail Trade | 58 (40.3%) | 86 (59.7%) |
| Transportation & Warehousing | 0 (0.0%) | 0 (0.0%) |
| Utilities | 0 (0.0%) | 0 (0.0%) |
| Information | 0 (0.0%) | 0 (0.0%) |
| Finance & Insurance | 0 (0.0%) | 0 (0.0%) |
| Real Estate, Rental & Leasing | 6 (100.0%) | 0 (0.0%) |
| Professional & Scientific | 0 (0.0%) | 0 (0.0%) |
| Enterprise Management | 0 (0.0%) | 0 (0.0%) |
| Administrative & Support | 0 (0.0%) | 0 (0.0%) |
| Educational Services | 27 (100.0%) | 0 (0.0%) |
| Health Care & Social Assistance | 74 (65.5%) | 39 (34.5%) |
| Arts, Entertainment & Recreation | 0 (0.0%) | 0 (0.0%) |
| Accommodation & Food Services | 102 (100.0%) | 0 (0.0%) |
| Public Administration | 27 (43.5%) | 35 (56.5%) |
| Total | 459 (63.9%) | 259 (36.1%) |
Education in Capitanejo
School Enrollment in Capitanejo
The most common levels of schooling among the 727 students in Capitanejo are high school (314 | 43.2%), middle school (237 | 32.6%), and college / undergraduate (157 | 21.6%).
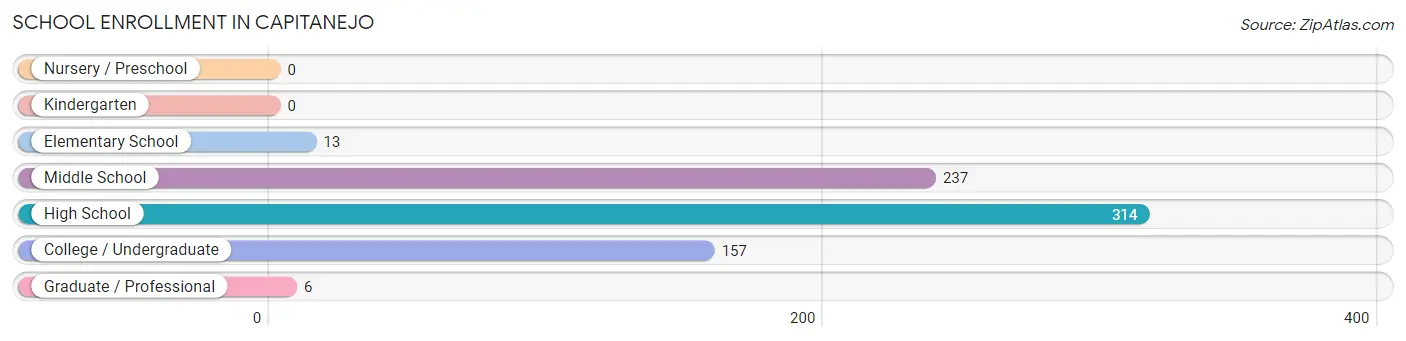
| School Level | # Students | % Students |
| Nursery / Preschool | 0 | 0.0% |
| Kindergarten | 0 | 0.0% |
| Elementary School | 13 | 1.8% |
| Middle School | 237 | 32.6% |
| High School | 314 | 43.2% |
| College / Undergraduate | 157 | 21.6% |
| Graduate / Professional | 6 | 0.8% |
| Total | 727 | 100.0% |
School Enrollment by Age by Funding Source in Capitanejo
Out of a total of 727 students who are enrolled in schools in Capitanejo, 229 (31.5%) attend a private institution, while the remaining 498 (68.5%) are enrolled in public schools. The age group of 20 to 24 year olds has the highest likelihood of being enrolled in private schools, with 93 (100.0% in the age bracket) enrolled. Conversely, the age group of 5 to 9 year old has the lowest likelihood of being enrolled in a private school, with 60 (100.0% in the age bracket) attending a public institution.
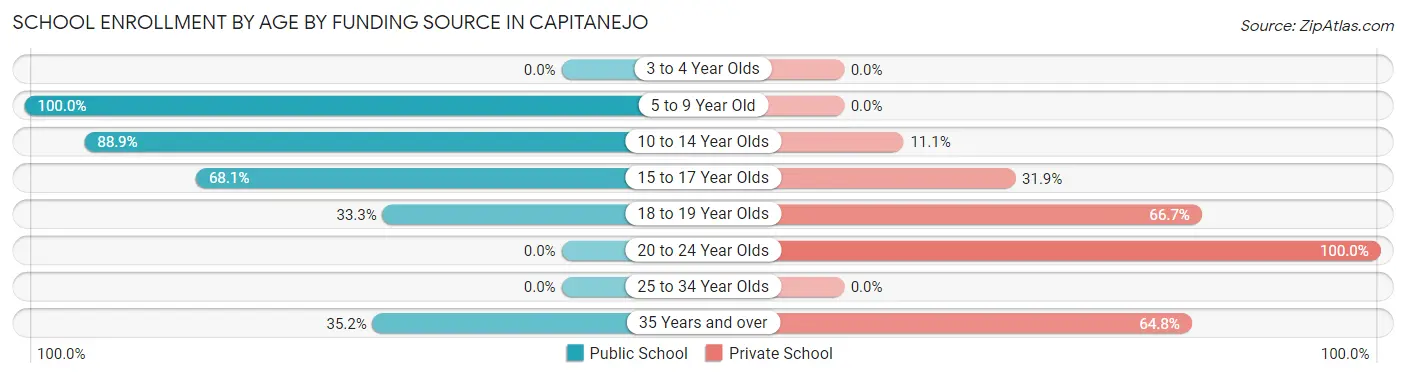
| Age Bracket | Public School | Private School |
| 3 to 4 Year Olds | 0 (0.0%) | 0 (0.0%) |
| 5 to 9 Year Old | 60 (100.0%) | 0 (0.0%) |
| 10 to 14 Year Olds | 327 (88.9%) | 41 (11.1%) |
| 15 to 17 Year Olds | 81 (68.1%) | 38 (31.9%) |
| 18 to 19 Year Olds | 11 (33.3%) | 22 (66.7%) |
| 20 to 24 Year Olds | 0 (0.0%) | 93 (100.0%) |
| 25 to 34 Year Olds | 0 (0.0%) | 0 (0.0%) |
| 35 Years and over | 19 (35.2%) | 35 (64.8%) |
| Total | 498 (68.5%) | 229 (31.5%) |
Educational Attainment by Field of Study in Capitanejo
Arts & humanities (95 | 21.4%), business (73 | 16.5%), science & technology (66 | 14.9%), computers & mathematics (56 | 12.6%), and communications (40 | 9.0%) are the most common fields of study among 443 individuals in Capitanejo who have obtained a bachelor's degree or higher.
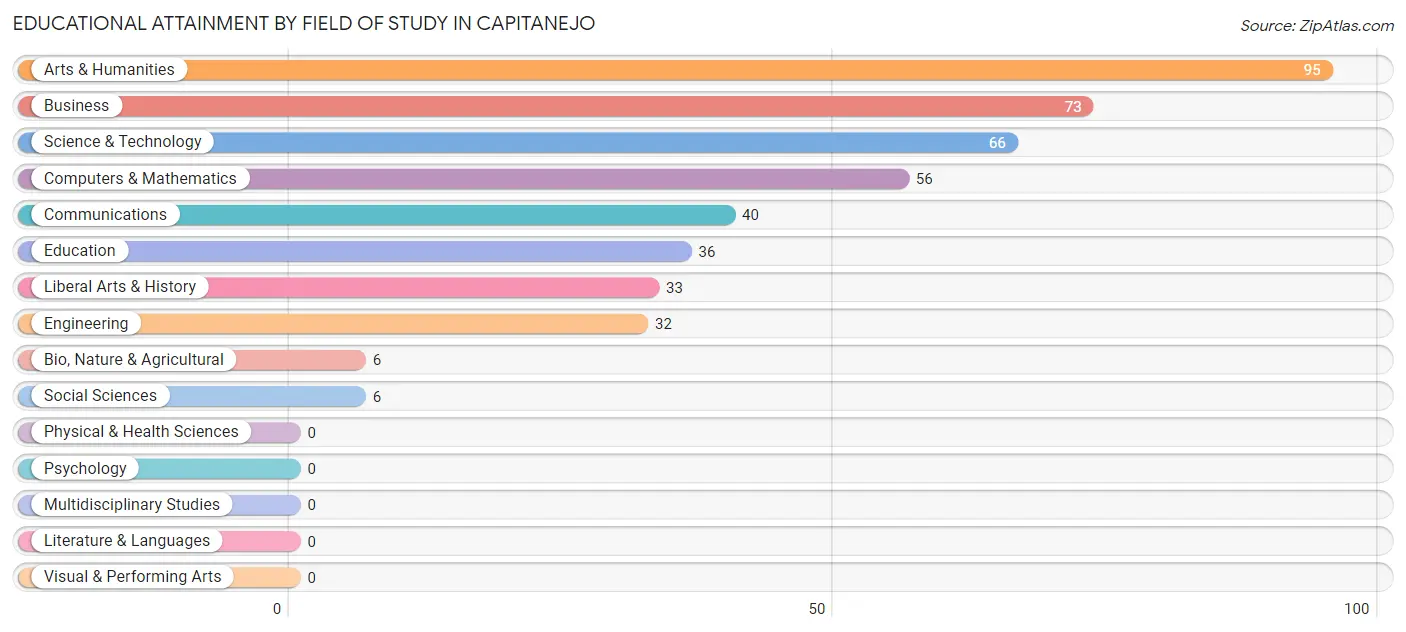
| Field of Study | # Graduates | % Graduates |
| Computers & Mathematics | 56 | 12.6% |
| Bio, Nature & Agricultural | 6 | 1.3% |
| Physical & Health Sciences | 0 | 0.0% |
| Psychology | 0 | 0.0% |
| Social Sciences | 6 | 1.3% |
| Engineering | 32 | 7.2% |
| Multidisciplinary Studies | 0 | 0.0% |
| Science & Technology | 66 | 14.9% |
| Business | 73 | 16.5% |
| Education | 36 | 8.1% |
| Literature & Languages | 0 | 0.0% |
| Liberal Arts & History | 33 | 7.4% |
| Visual & Performing Arts | 0 | 0.0% |
| Communications | 40 | 9.0% |
| Arts & Humanities | 95 | 21.4% |
| Total | 443 | 100.0% |
Transportation & Commute in Capitanejo
Vehicle Availability by Sex in Capitanejo
The most prevalent vehicle ownership categories in Capitanejo are males with 5 or more vehicles (143, accounting for 31.1%) and females with 5 or more vehicles (45, making up 55.2%).
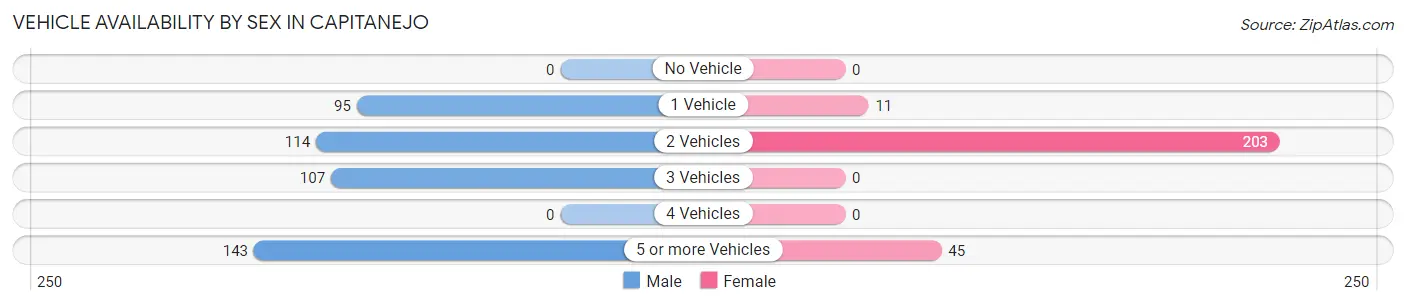
| Vehicles Available | Male | Female |
| No Vehicle | 0 (0.0%) | 0 (0.0%) |
| 1 Vehicle | 95 (20.7%) | 11 (4.3%) |
| 2 Vehicles | 114 (24.8%) | 203 (78.4%) |
| 3 Vehicles | 107 (23.3%) | 0 (0.0%) |
| 4 Vehicles | 0 (0.0%) | 0 (0.0%) |
| 5 or more Vehicles | 143 (31.1%) | 45 (17.4%) |
| Total | 459 (100.0%) | 259 (100.0%) |
Commute Time in Capitanejo
The most frequently occuring commute durations in Capitanejo are 30 to 34 minutes (168 commuters, 23.6%), 20 to 24 minutes (129 commuters, 18.1%), and 10 to 14 minutes (127 commuters, 17.8%).
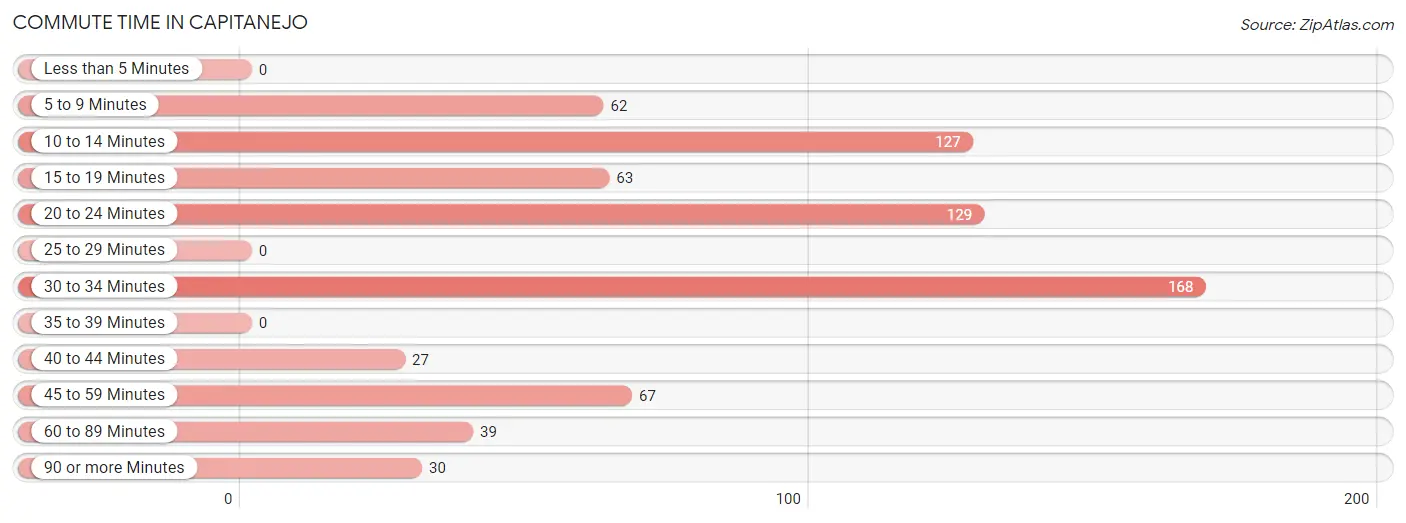
| Commute Time | # Commuters | % Commuters |
| Less than 5 Minutes | 0 | 0.0% |
| 5 to 9 Minutes | 62 | 8.7% |
| 10 to 14 Minutes | 127 | 17.8% |
| 15 to 19 Minutes | 63 | 8.8% |
| 20 to 24 Minutes | 129 | 18.1% |
| 25 to 29 Minutes | 0 | 0.0% |
| 30 to 34 Minutes | 168 | 23.6% |
| 35 to 39 Minutes | 0 | 0.0% |
| 40 to 44 Minutes | 27 | 3.8% |
| 45 to 59 Minutes | 67 | 9.4% |
| 60 to 89 Minutes | 39 | 5.5% |
| 90 or more Minutes | 30 | 4.2% |
Commute Time by Sex in Capitanejo
The most common commute times in Capitanejo are 20 to 24 minutes (129 commuters, 28.5%) for males and 30 to 34 minutes (97 commuters, 37.4%) for females.
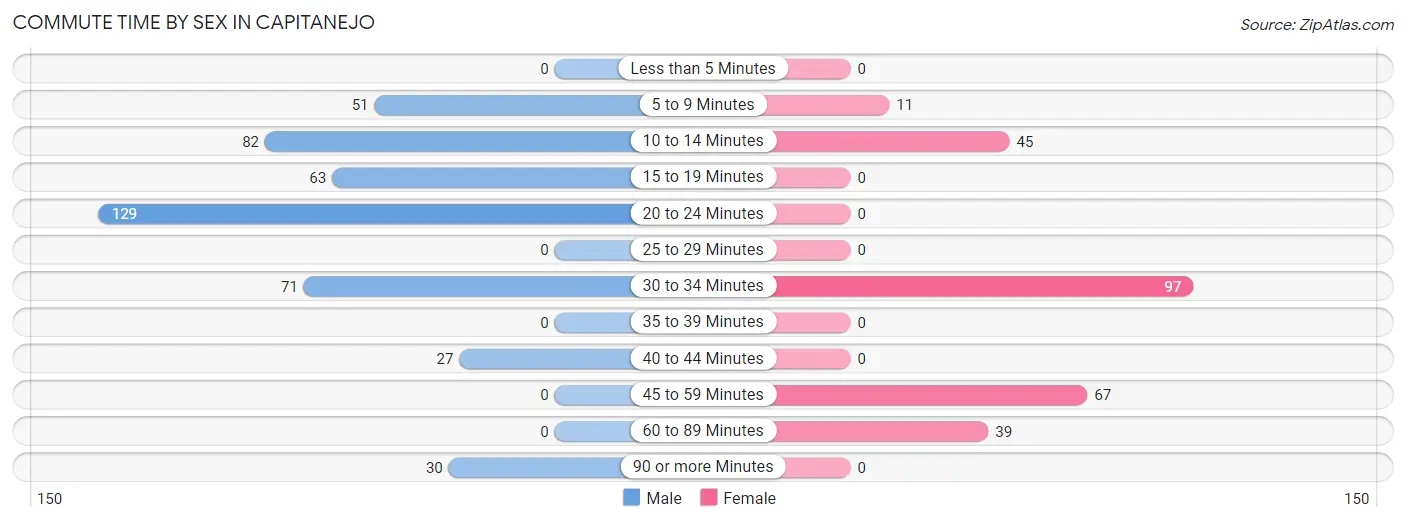
| Commute Time | Male | Female |
| Less than 5 Minutes | 0 (0.0%) | 0 (0.0%) |
| 5 to 9 Minutes | 51 (11.3%) | 11 (4.3%) |
| 10 to 14 Minutes | 82 (18.1%) | 45 (17.4%) |
| 15 to 19 Minutes | 63 (13.9%) | 0 (0.0%) |
| 20 to 24 Minutes | 129 (28.5%) | 0 (0.0%) |
| 25 to 29 Minutes | 0 (0.0%) | 0 (0.0%) |
| 30 to 34 Minutes | 71 (15.7%) | 97 (37.4%) |
| 35 to 39 Minutes | 0 (0.0%) | 0 (0.0%) |
| 40 to 44 Minutes | 27 (6.0%) | 0 (0.0%) |
| 45 to 59 Minutes | 0 (0.0%) | 67 (25.9%) |
| 60 to 89 Minutes | 0 (0.0%) | 39 (15.1%) |
| 90 or more Minutes | 30 (6.6%) | 0 (0.0%) |
Time of Departure to Work by Sex in Capitanejo
The most frequent times of departure to work in Capitanejo are 6:00 AM to 6:29 AM (177, 39.1%) for males and 8:00 AM to 8:29 AM (110, 42.5%) for females.
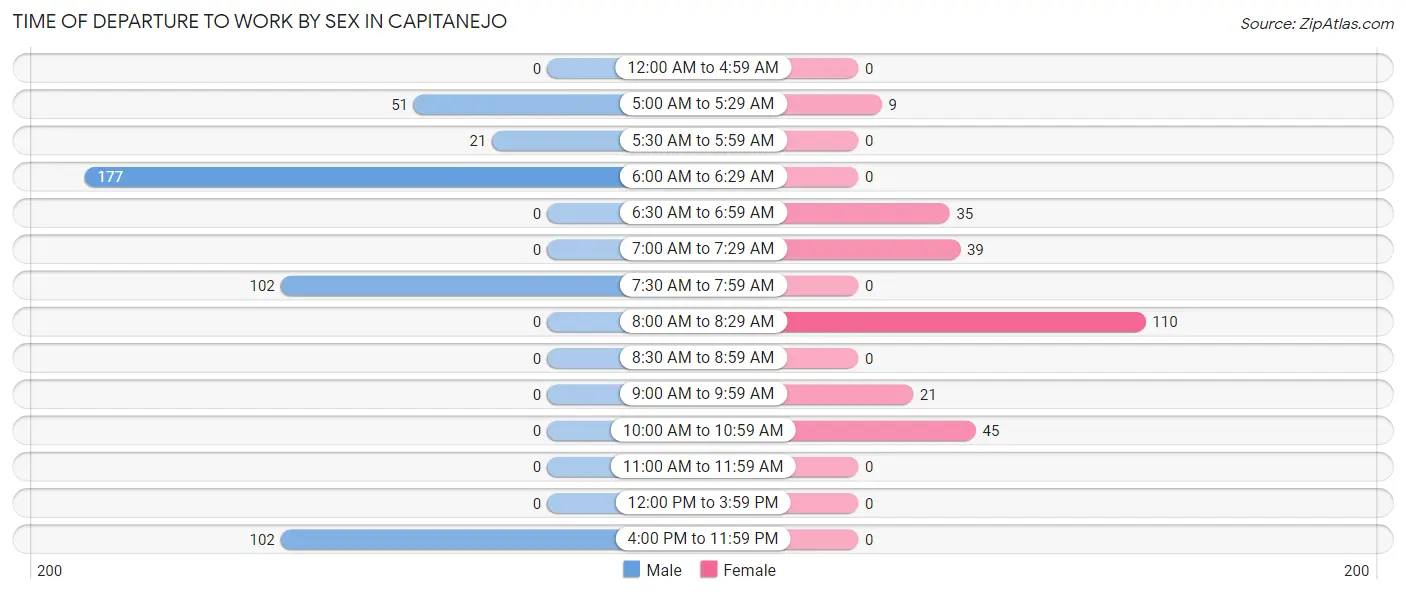
| Time of Departure | Male | Female |
| 12:00 AM to 4:59 AM | 0 (0.0%) | 0 (0.0%) |
| 5:00 AM to 5:29 AM | 51 (11.3%) | 9 (3.5%) |
| 5:30 AM to 5:59 AM | 21 (4.6%) | 0 (0.0%) |
| 6:00 AM to 6:29 AM | 177 (39.1%) | 0 (0.0%) |
| 6:30 AM to 6:59 AM | 0 (0.0%) | 35 (13.5%) |
| 7:00 AM to 7:29 AM | 0 (0.0%) | 39 (15.1%) |
| 7:30 AM to 7:59 AM | 102 (22.5%) | 0 (0.0%) |
| 8:00 AM to 8:29 AM | 0 (0.0%) | 110 (42.5%) |
| 8:30 AM to 8:59 AM | 0 (0.0%) | 0 (0.0%) |
| 9:00 AM to 9:59 AM | 0 (0.0%) | 21 (8.1%) |
| 10:00 AM to 10:59 AM | 0 (0.0%) | 45 (17.4%) |
| 11:00 AM to 11:59 AM | 0 (0.0%) | 0 (0.0%) |
| 12:00 PM to 3:59 PM | 0 (0.0%) | 0 (0.0%) |
| 4:00 PM to 11:59 PM | 102 (22.5%) | 0 (0.0%) |
| Total | 453 (100.0%) | 259 (100.0%) |
Housing Occupancy in Capitanejo
Occupancy by Ownership in Capitanejo
Of the total 952 dwellings in Capitanejo, owner-occupied units account for 817 (85.8%), while renter-occupied units make up 135 (14.2%).
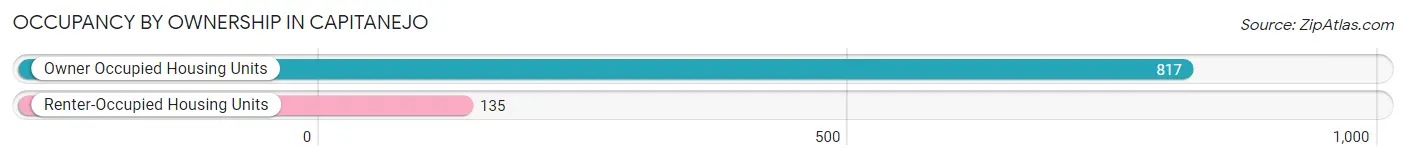
| Occupancy | # Housing Units | % Housing Units |
| Owner Occupied Housing Units | 817 | 85.8% |
| Renter-Occupied Housing Units | 135 | 14.2% |
| Total Occupied Housing Units | 952 | 100.0% |
Occupancy by Household Size in Capitanejo
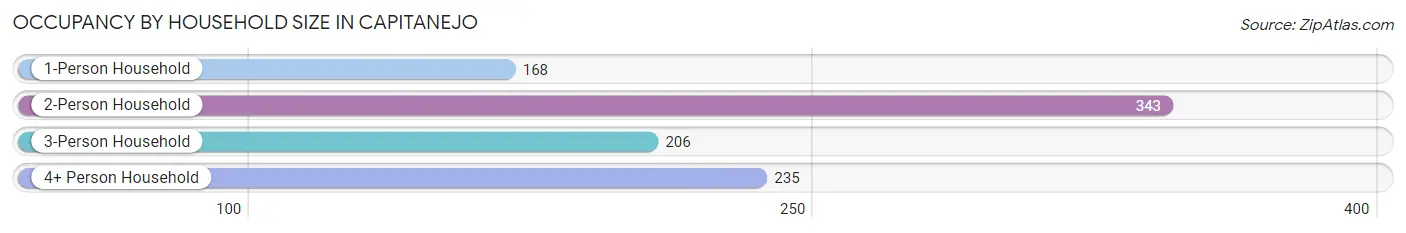
| Household Size | # Housing Units | % Housing Units |
| 1-Person Household | 168 | 17.6% |
| 2-Person Household | 343 | 36.0% |
| 3-Person Household | 206 | 21.6% |
| 4+ Person Household | 235 | 24.7% |
| Total Housing Units | 952 | 100.0% |
Occupancy by Ownership by Household Size in Capitanejo
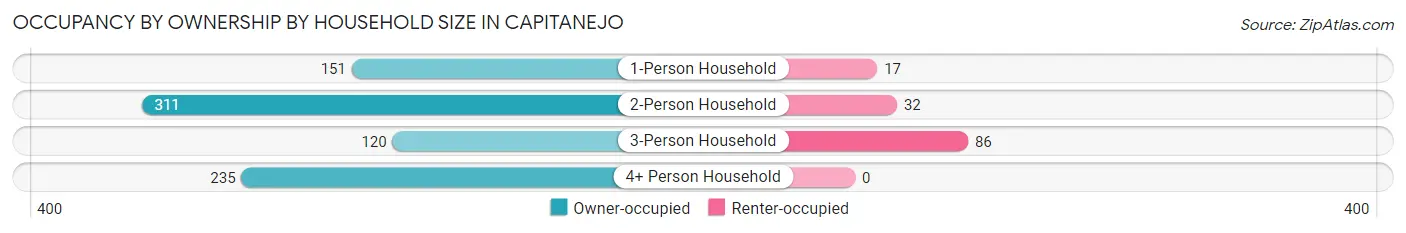
| Household Size | Owner-occupied | Renter-occupied |
| 1-Person Household | 151 (89.9%) | 17 (10.1%) |
| 2-Person Household | 311 (90.7%) | 32 (9.3%) |
| 3-Person Household | 120 (58.3%) | 86 (41.7%) |
| 4+ Person Household | 235 (100.0%) | 0 (0.0%) |
| Total Housing Units | 817 (85.8%) | 135 (14.2%) |
Occupancy by Educational Attainment in Capitanejo
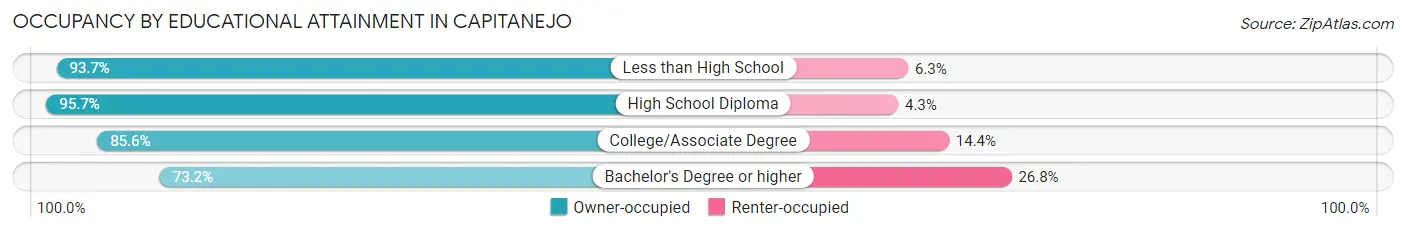
| Household Size | Owner-occupied | Renter-occupied |
| Less than High School | 163 (93.7%) | 11 (6.3%) |
| High School Diploma | 243 (95.7%) | 11 (4.3%) |
| College/Associate Degree | 190 (85.6%) | 32 (14.4%) |
| Bachelor's Degree or higher | 221 (73.2%) | 81 (26.8%) |
Occupancy by Age of Householder in Capitanejo
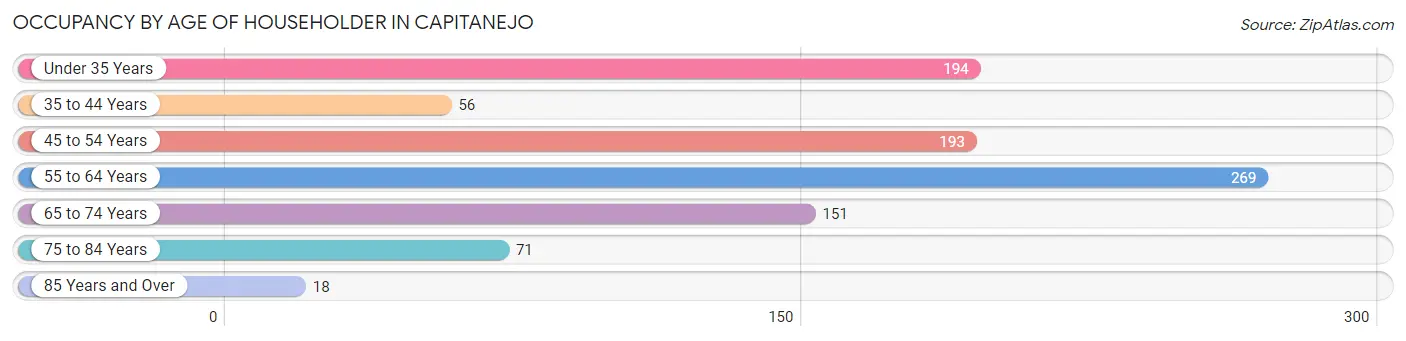
| Age Bracket | # Households | % Households |
| Under 35 Years | 194 | 20.4% |
| 35 to 44 Years | 56 | 5.9% |
| 45 to 54 Years | 193 | 20.3% |
| 55 to 64 Years | 269 | 28.3% |
| 65 to 74 Years | 151 | 15.9% |
| 75 to 84 Years | 71 | 7.5% |
| 85 Years and Over | 18 | 1.9% |
| Total | 952 | 100.0% |
Housing Finances in Capitanejo
Median Income by Occupancy in Capitanejo
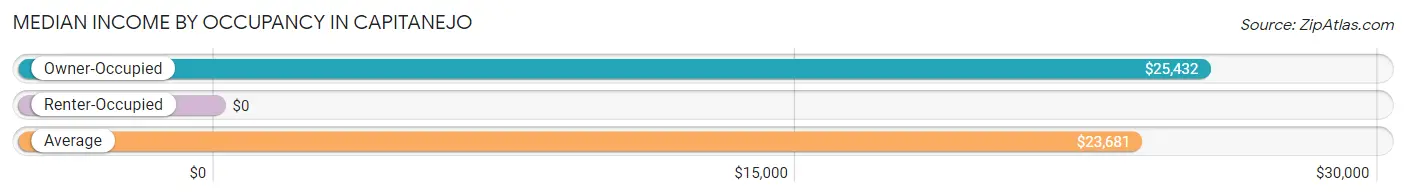
| Occupancy Type | # Households | Median Income |
| Owner-Occupied | 817 (85.8%) | $25,432 |
| Renter-Occupied | 135 (14.2%) | $0 |
| Average | 952 (100.0%) | $23,681 |
Occupancy by Householder Income Bracket in Capitanejo
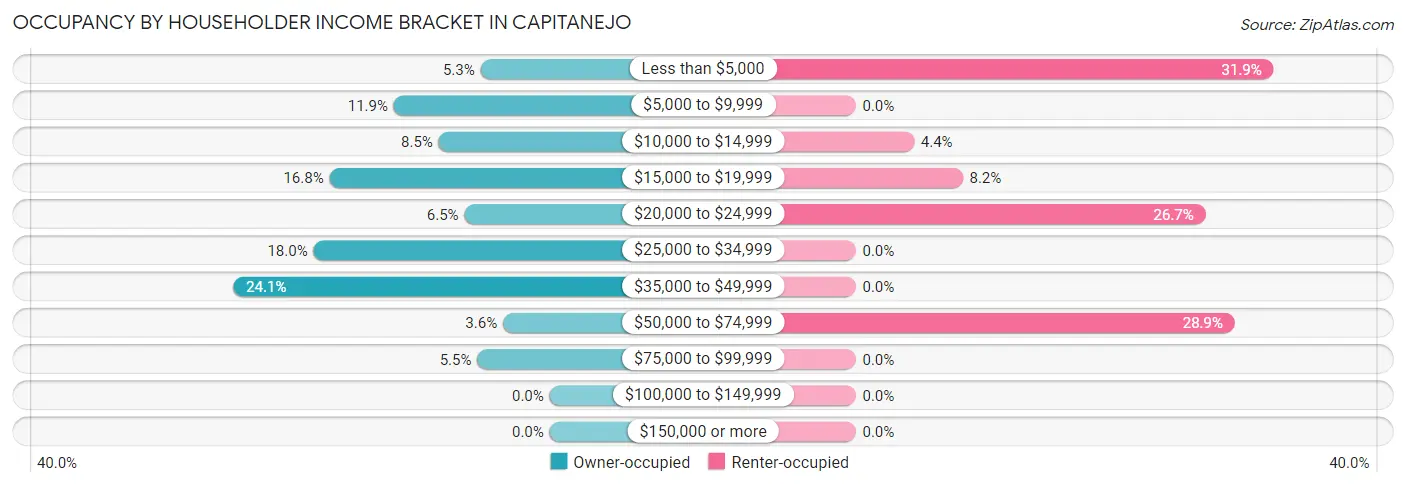
| Income Bracket | Owner-occupied | Renter-occupied |
| Less than $5,000 | 43 (5.3%) | 43 (31.9%) |
| $5,000 to $9,999 | 97 (11.9%) | 0 (0.0%) |
| $10,000 to $14,999 | 69 (8.5%) | 6 (4.4%) |
| $15,000 to $19,999 | 137 (16.8%) | 11 (8.2%) |
| $20,000 to $24,999 | 53 (6.5%) | 36 (26.7%) |
| $25,000 to $34,999 | 147 (18.0%) | 0 (0.0%) |
| $35,000 to $49,999 | 197 (24.1%) | 0 (0.0%) |
| $50,000 to $74,999 | 29 (3.5%) | 39 (28.9%) |
| $75,000 to $99,999 | 45 (5.5%) | 0 (0.0%) |
| $100,000 to $149,999 | 0 (0.0%) | 0 (0.0%) |
| $150,000 or more | 0 (0.0%) | 0 (0.0%) |
| Total | 817 (100.0%) | 135 (100.0%) |
Monthly Housing Cost Tiers in Capitanejo
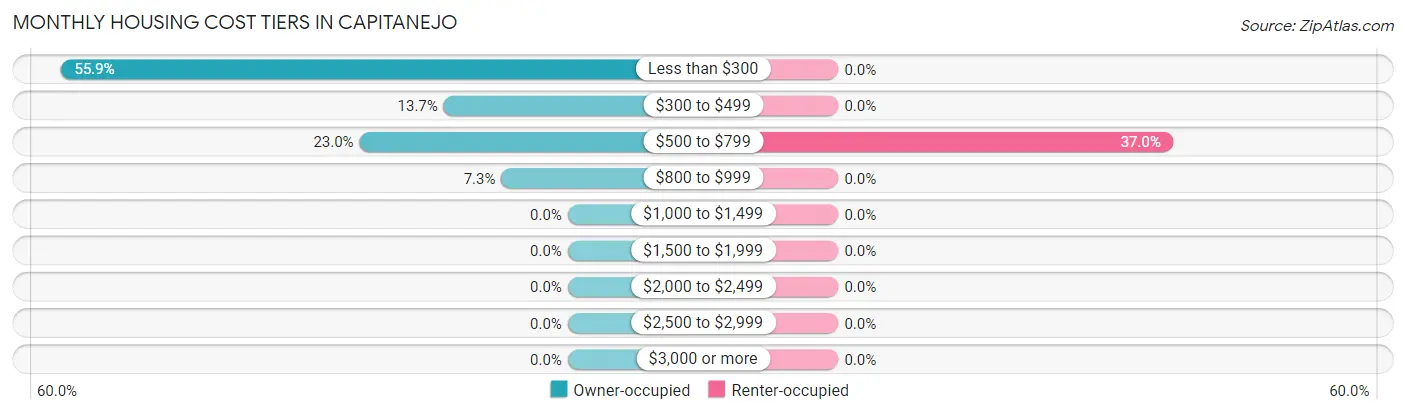
| Monthly Cost | Owner-occupied | Renter-occupied |
| Less than $300 | 457 (55.9%) | 0 (0.0%) |
| $300 to $499 | 112 (13.7%) | 0 (0.0%) |
| $500 to $799 | 188 (23.0%) | 50 (37.0%) |
| $800 to $999 | 60 (7.3%) | 0 (0.0%) |
| $1,000 to $1,499 | 0 (0.0%) | 0 (0.0%) |
| $1,500 to $1,999 | 0 (0.0%) | 0 (0.0%) |
| $2,000 to $2,499 | 0 (0.0%) | 0 (0.0%) |
| $2,500 to $2,999 | 0 (0.0%) | 0 (0.0%) |
| $3,000 or more | 0 (0.0%) | 0 (0.0%) |
| Total | 817 (100.0%) | 135 (100.0%) |
Physical Housing Characteristics in Capitanejo
Housing Structures in Capitanejo
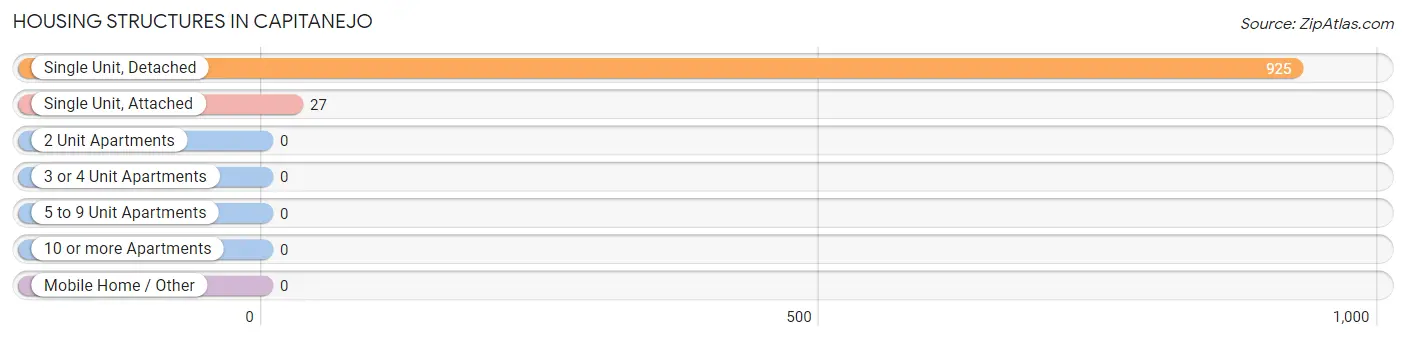
| Structure Type | # Housing Units | % Housing Units |
| Single Unit, Detached | 925 | 97.2% |
| Single Unit, Attached | 27 | 2.8% |
| 2 Unit Apartments | 0 | 0.0% |
| 3 or 4 Unit Apartments | 0 | 0.0% |
| 5 to 9 Unit Apartments | 0 | 0.0% |
| 10 or more Apartments | 0 | 0.0% |
| Mobile Home / Other | 0 | 0.0% |
| Total | 952 | 100.0% |
Housing Structures by Occupancy in Capitanejo
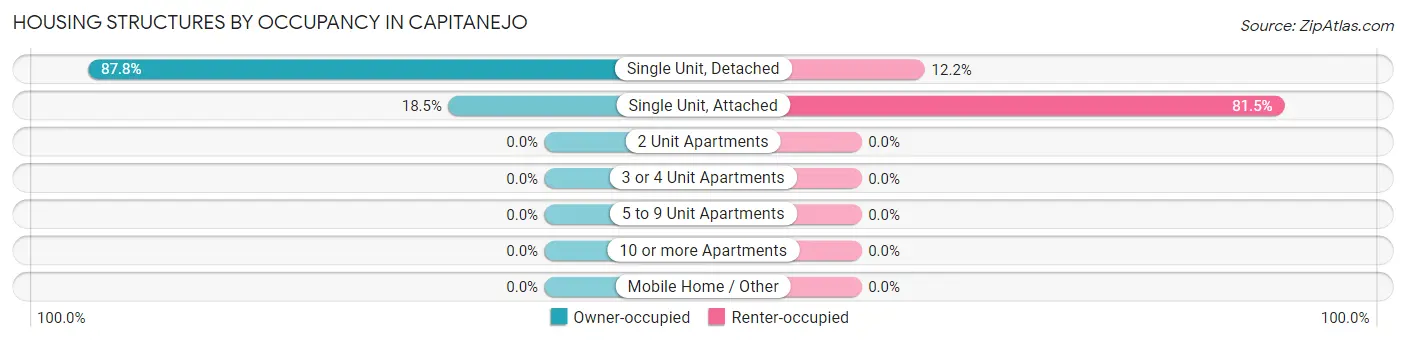
| Structure Type | Owner-occupied | Renter-occupied |
| Single Unit, Detached | 812 (87.8%) | 113 (12.2%) |
| Single Unit, Attached | 5 (18.5%) | 22 (81.5%) |
| 2 Unit Apartments | 0 (0.0%) | 0 (0.0%) |
| 3 or 4 Unit Apartments | 0 (0.0%) | 0 (0.0%) |
| 5 to 9 Unit Apartments | 0 (0.0%) | 0 (0.0%) |
| 10 or more Apartments | 0 (0.0%) | 0 (0.0%) |
| Mobile Home / Other | 0 (0.0%) | 0 (0.0%) |
| Total | 817 (85.8%) | 135 (14.2%) |
Housing Structures by Number of Rooms in Capitanejo
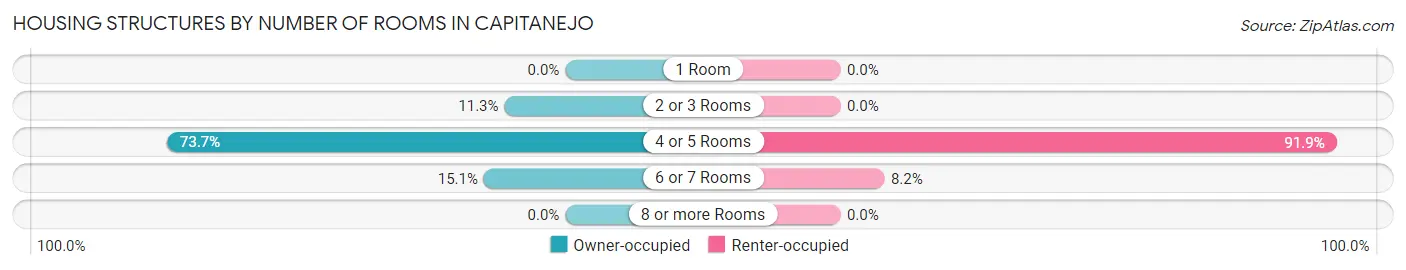
| Number of Rooms | Owner-occupied | Renter-occupied |
| 1 Room | 0 (0.0%) | 0 (0.0%) |
| 2 or 3 Rooms | 92 (11.3%) | 0 (0.0%) |
| 4 or 5 Rooms | 602 (73.7%) | 124 (91.8%) |
| 6 or 7 Rooms | 123 (15.1%) | 11 (8.2%) |
| 8 or more Rooms | 0 (0.0%) | 0 (0.0%) |
| Total | 817 (100.0%) | 135 (100.0%) |
Housing Structure by Heating Type in Capitanejo
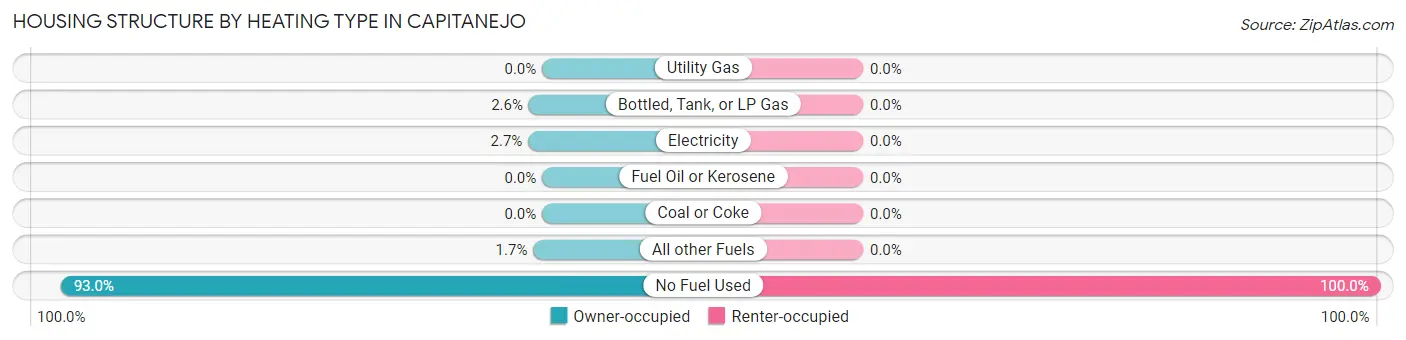
| Heating Type | Owner-occupied | Renter-occupied |
| Utility Gas | 0 (0.0%) | 0 (0.0%) |
| Bottled, Tank, or LP Gas | 21 (2.6%) | 0 (0.0%) |
| Electricity | 22 (2.7%) | 0 (0.0%) |
| Fuel Oil or Kerosene | 0 (0.0%) | 0 (0.0%) |
| Coal or Coke | 0 (0.0%) | 0 (0.0%) |
| All other Fuels | 14 (1.7%) | 0 (0.0%) |
| No Fuel Used | 760 (93.0%) | 135 (100.0%) |
| Total | 817 (100.0%) | 135 (100.0%) |
Household Vehicle Usage in Capitanejo
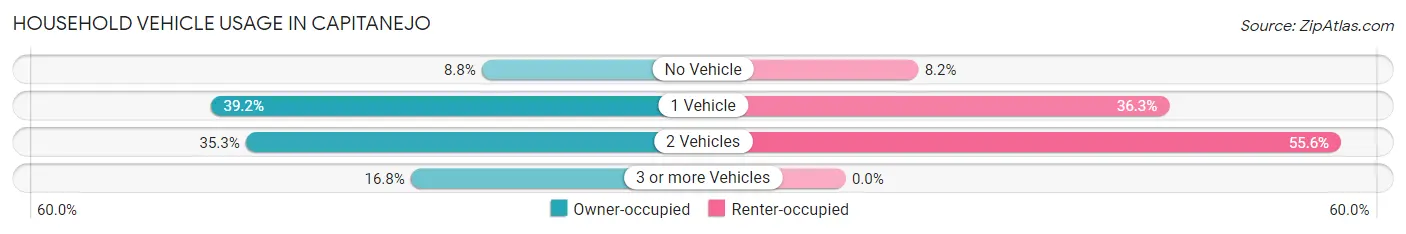
| Vehicles per Household | Owner-occupied | Renter-occupied |
| No Vehicle | 72 (8.8%) | 11 (8.2%) |
| 1 Vehicle | 320 (39.2%) | 49 (36.3%) |
| 2 Vehicles | 288 (35.2%) | 75 (55.6%) |
| 3 or more Vehicles | 137 (16.8%) | 0 (0.0%) |
| Total | 817 (100.0%) | 135 (100.0%) |
Real Estate & Mortgages in Capitanejo
Real Estate and Mortgage Overview in Capitanejo
| Characteristic | Without Mortgage | With Mortgage |
| Housing Units | 467 | 350 |
| Median Property Value | $85,100 | $94,700 |
| Median Household Income | $17,141 | $0 |
| Monthly Housing Costs | $161 | $0 |
| Real Estate Taxes | - | - |
Property Value by Mortgage Status in Capitanejo
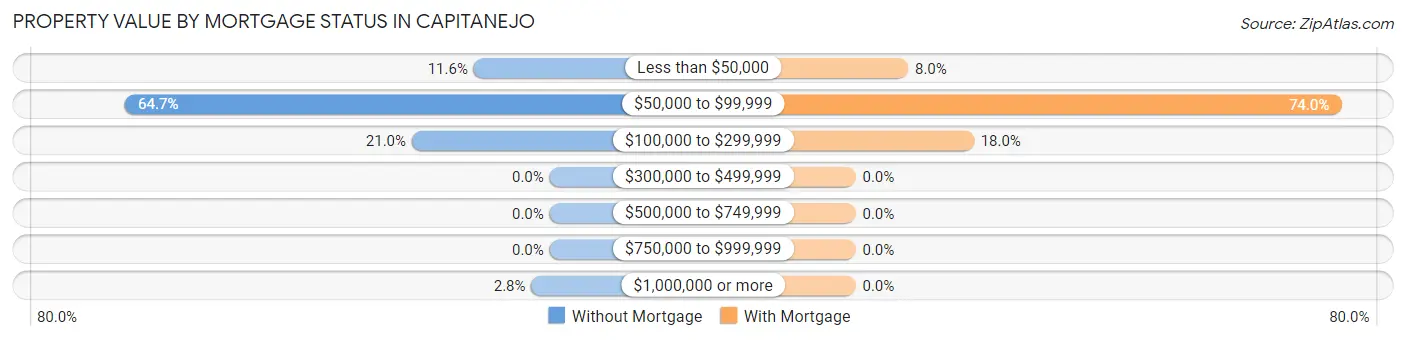
| Property Value | Without Mortgage | With Mortgage |
| Less than $50,000 | 54 (11.6%) | 28 (8.0%) |
| $50,000 to $99,999 | 302 (64.7%) | 259 (74.0%) |
| $100,000 to $299,999 | 98 (21.0%) | 63 (18.0%) |
| $300,000 to $499,999 | 0 (0.0%) | 0 (0.0%) |
| $500,000 to $749,999 | 0 (0.0%) | 0 (0.0%) |
| $750,000 to $999,999 | 0 (0.0%) | 0 (0.0%) |
| $1,000,000 or more | 13 (2.8%) | 0 (0.0%) |
| Total | 467 (100.0%) | 350 (100.0%) |
Household Income by Mortgage Status in Capitanejo
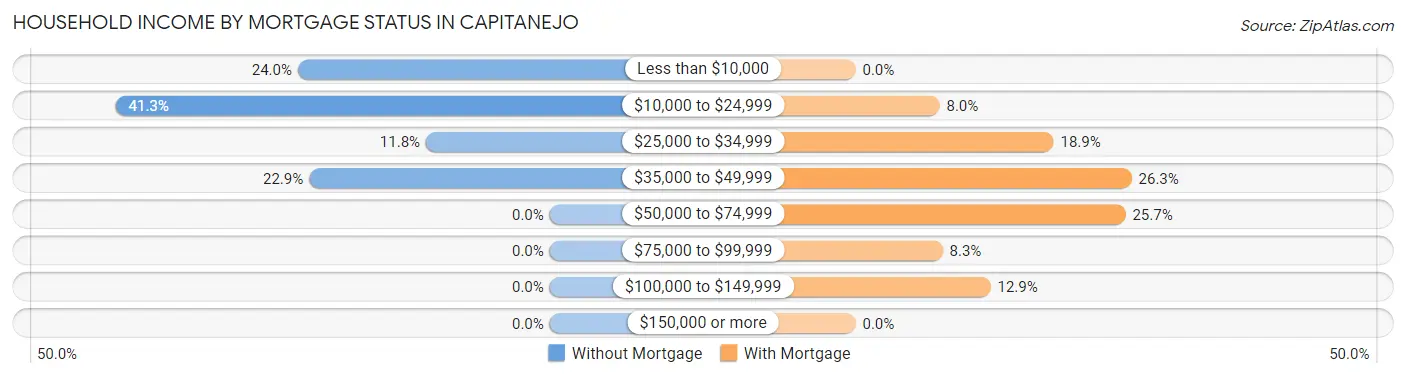
| Household Income | Without Mortgage | With Mortgage |
| Less than $10,000 | 112 (24.0%) | 0 (0.0%) |
| $10,000 to $24,999 | 193 (41.3%) | 28 (8.0%) |
| $25,000 to $34,999 | 55 (11.8%) | 66 (18.9%) |
| $35,000 to $49,999 | 107 (22.9%) | 92 (26.3%) |
| $50,000 to $74,999 | 0 (0.0%) | 90 (25.7%) |
| $75,000 to $99,999 | 0 (0.0%) | 29 (8.3%) |
| $100,000 to $149,999 | 0 (0.0%) | 45 (12.9%) |
| $150,000 or more | 0 (0.0%) | 0 (0.0%) |
| Total | 467 (100.0%) | 350 (100.0%) |
Property Value to Household Income Ratio in Capitanejo
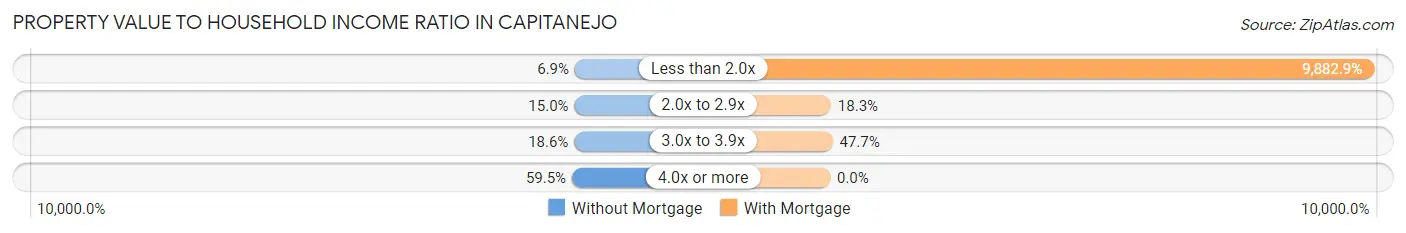
| Value-to-Income Ratio | Without Mortgage | With Mortgage |
| Less than 2.0x | 32 (6.9%) | 34,590 (9,882.9%) |
| 2.0x to 2.9x | 70 (15.0%) | 64 (18.3%) |
| 3.0x to 3.9x | 87 (18.6%) | 167 (47.7%) |
| 4.0x or more | 278 (59.5%) | 0 (0.0%) |
| Total | 467 (100.0%) | 350 (100.0%) |
Real Estate Taxes by Mortgage Status in Capitanejo
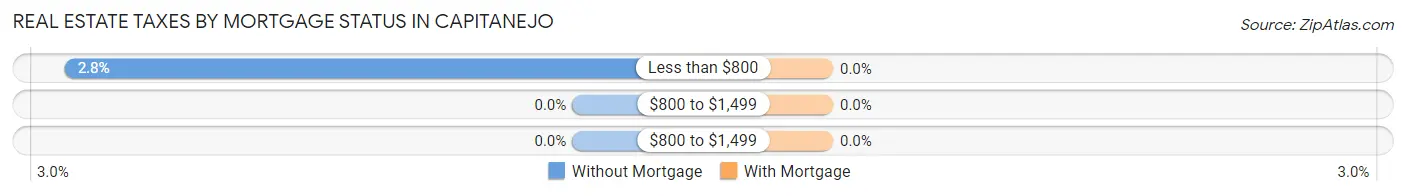
| Property Taxes | Without Mortgage | With Mortgage |
| Less than $800 | 13 (2.8%) | 0 (0.0%) |
| $800 to $1,499 | 0 (0.0%) | 0 (0.0%) |
| $800 to $1,499 | 0 (0.0%) | 0 (0.0%) |
| Total | 467 (100.0%) | 350 (100.0%) |
Health & Disability in Capitanejo
Health Insurance Coverage by Age in Capitanejo
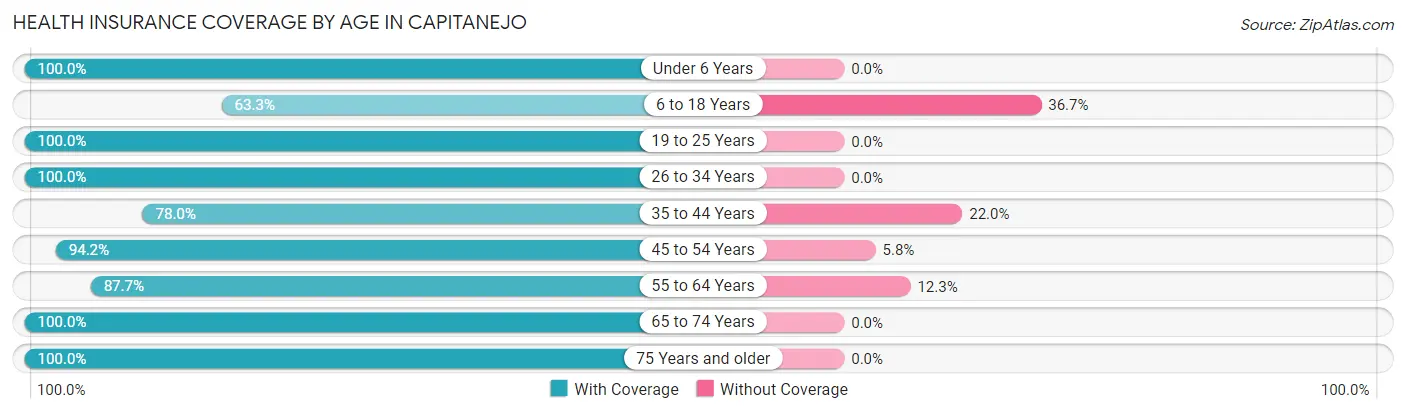
| Age Bracket | With Coverage | Without Coverage |
| Under 6 Years | 139 (100.0%) | 0 (0.0%) |
| 6 to 18 Years | 353 (63.3%) | 205 (36.7%) |
| 19 to 25 Years | 190 (100.0%) | 0 (0.0%) |
| 26 to 34 Years | 308 (100.0%) | 0 (0.0%) |
| 35 to 44 Years | 124 (78.0%) | 35 (22.0%) |
| 45 to 54 Years | 387 (94.2%) | 24 (5.8%) |
| 55 to 64 Years | 469 (87.7%) | 66 (12.3%) |
| 65 to 74 Years | 301 (100.0%) | 0 (0.0%) |
| 75 Years and older | 150 (100.0%) | 0 (0.0%) |
| Total | 2,421 (88.0%) | 330 (12.0%) |
Health Insurance Coverage by Citizenship Status in Capitanejo
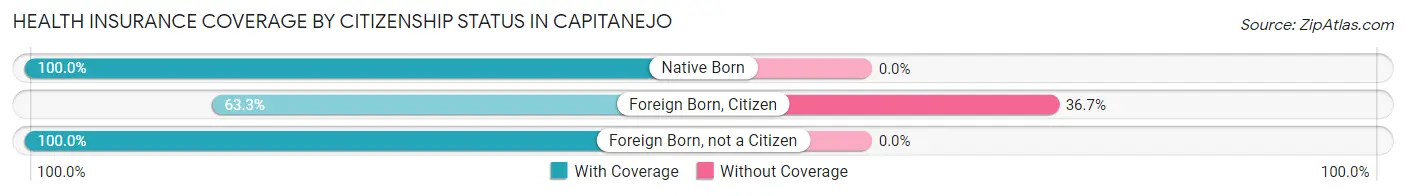
| Citizenship Status | With Coverage | Without Coverage |
| Native Born | 139 (100.0%) | 0 (0.0%) |
| Foreign Born, Citizen | 353 (63.3%) | 205 (36.7%) |
| Foreign Born, not a Citizen | 190 (100.0%) | 0 (0.0%) |
Health Insurance Coverage by Household Income in Capitanejo
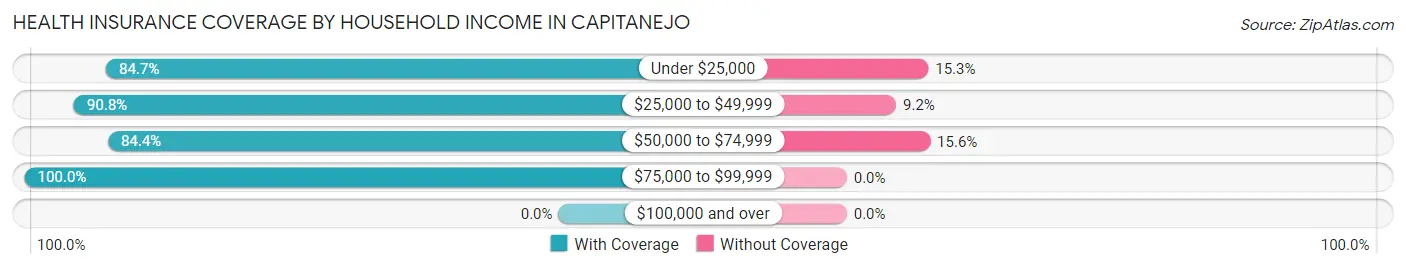
| Household Income | With Coverage | Without Coverage |
| Under $25,000 | 1,104 (84.7%) | 199 (15.3%) |
| $25,000 to $49,999 | 845 (90.8%) | 86 (9.2%) |
| $50,000 to $74,999 | 243 (84.4%) | 45 (15.6%) |
| $75,000 to $99,999 | 229 (100.0%) | 0 (0.0%) |
| $100,000 and over | 0 (0.0%) | 0 (0.0%) |
Public vs Private Health Insurance Coverage by Age in Capitanejo
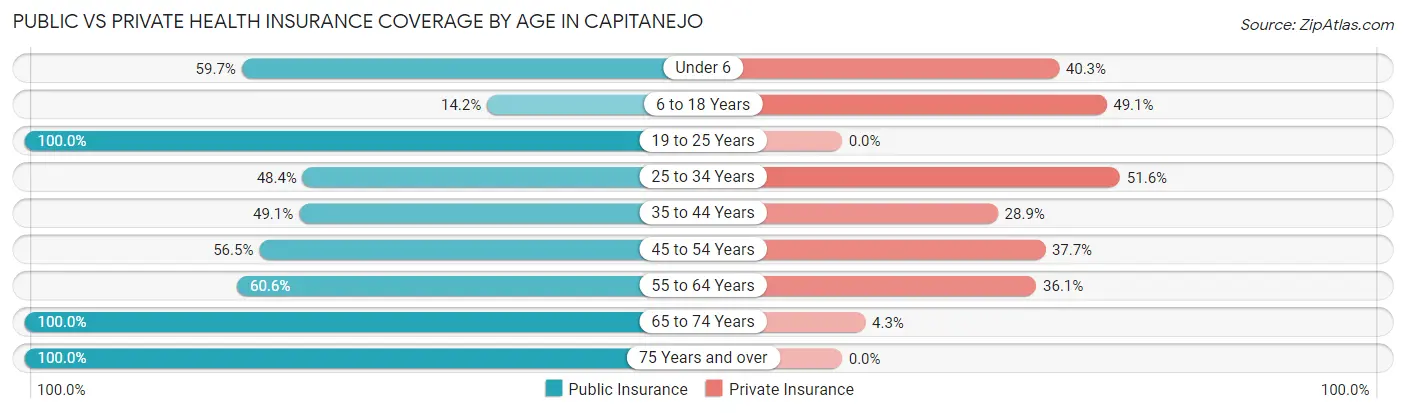
| Age Bracket | Public Insurance | Private Insurance |
| Under 6 | 83 (59.7%) | 56 (40.3%) |
| 6 to 18 Years | 79 (14.2%) | 274 (49.1%) |
| 19 to 25 Years | 190 (100.0%) | 0 (0.0%) |
| 25 to 34 Years | 149 (48.4%) | 159 (51.6%) |
| 35 to 44 Years | 78 (49.1%) | 46 (28.9%) |
| 45 to 54 Years | 232 (56.5%) | 155 (37.7%) |
| 55 to 64 Years | 324 (60.6%) | 193 (36.1%) |
| 65 to 74 Years | 301 (100.0%) | 13 (4.3%) |
| 75 Years and over | 150 (100.0%) | 0 (0.0%) |
| Total | 1,586 (57.7%) | 896 (32.6%) |
Disability Status by Sex by Age in Capitanejo
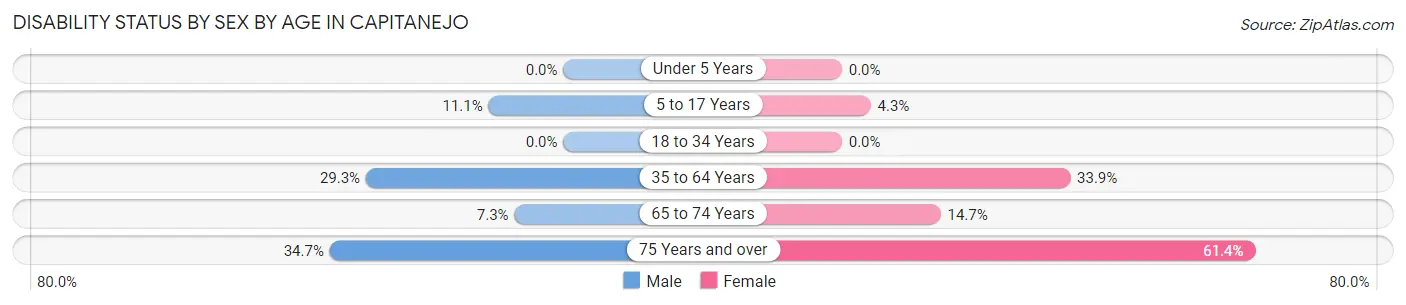
| Age Bracket | Male | Female |
| Under 5 Years | 0 (0.0%) | 0 (0.0%) |
| 5 to 17 Years | 27 (11.1%) | 13 (4.3%) |
| 18 to 34 Years | 0 (0.0%) | 0 (0.0%) |
| 35 to 64 Years | 170 (29.3%) | 178 (33.9%) |
| 65 to 74 Years | 8 (7.3%) | 28 (14.7%) |
| 75 Years and over | 17 (34.7%) | 62 (61.4%) |
Disability Class by Sex by Age in Capitanejo
Disability Class: Hearing Difficulty
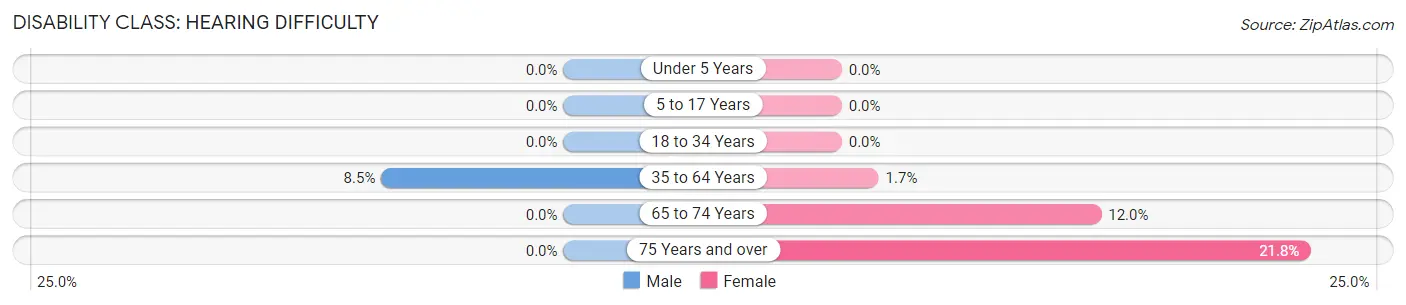
| Age Bracket | Male | Female |
| Under 5 Years | 0 (0.0%) | 0 (0.0%) |
| 5 to 17 Years | 0 (0.0%) | 0 (0.0%) |
| 18 to 34 Years | 0 (0.0%) | 0 (0.0%) |
| 35 to 64 Years | 49 (8.5%) | 9 (1.7%) |
| 65 to 74 Years | 0 (0.0%) | 23 (12.0%) |
| 75 Years and over | 0 (0.0%) | 22 (21.8%) |
Disability Class: Vision Difficulty
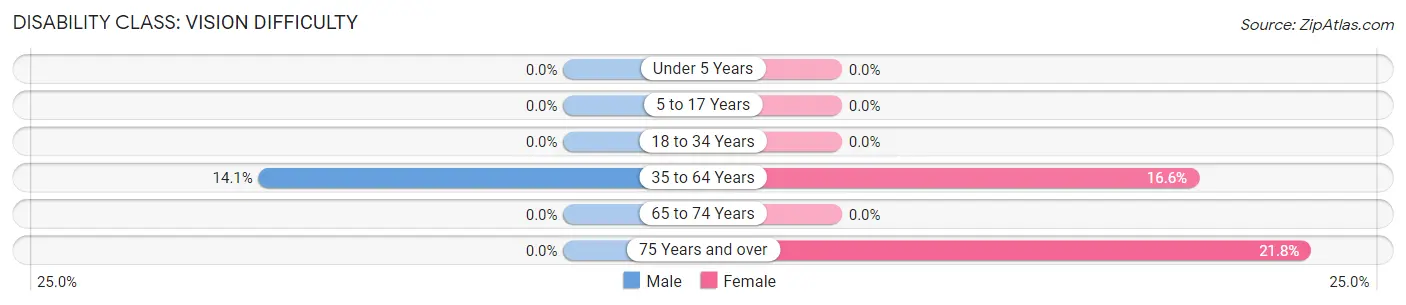
| Age Bracket | Male | Female |
| Under 5 Years | 0 (0.0%) | 0 (0.0%) |
| 5 to 17 Years | 0 (0.0%) | 0 (0.0%) |
| 18 to 34 Years | 0 (0.0%) | 0 (0.0%) |
| 35 to 64 Years | 82 (14.1%) | 87 (16.6%) |
| 65 to 74 Years | 0 (0.0%) | 0 (0.0%) |
| 75 Years and over | 0 (0.0%) | 22 (21.8%) |
Disability Class: Cognitive Difficulty
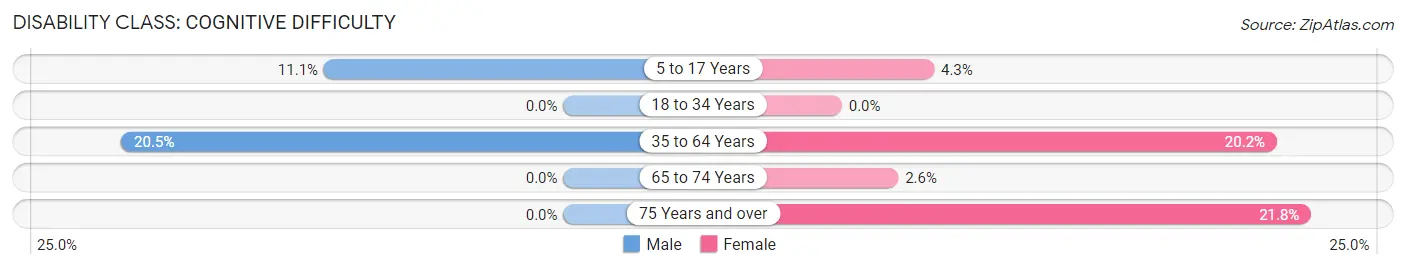
| Age Bracket | Male | Female |
| 5 to 17 Years | 27 (11.1%) | 13 (4.3%) |
| 18 to 34 Years | 0 (0.0%) | 0 (0.0%) |
| 35 to 64 Years | 119 (20.5%) | 106 (20.2%) |
| 65 to 74 Years | 0 (0.0%) | 5 (2.6%) |
| 75 Years and over | 0 (0.0%) | 22 (21.8%) |
Disability Class: Ambulatory Difficulty
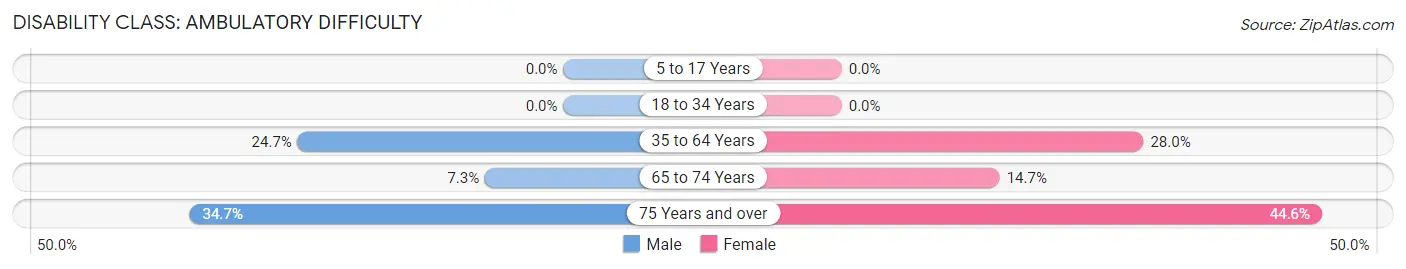
| Age Bracket | Male | Female |
| 5 to 17 Years | 0 (0.0%) | 0 (0.0%) |
| 18 to 34 Years | 0 (0.0%) | 0 (0.0%) |
| 35 to 64 Years | 143 (24.7%) | 147 (28.0%) |
| 65 to 74 Years | 8 (7.3%) | 28 (14.7%) |
| 75 Years and over | 17 (34.7%) | 45 (44.6%) |
Disability Class: Self-Care Difficulty
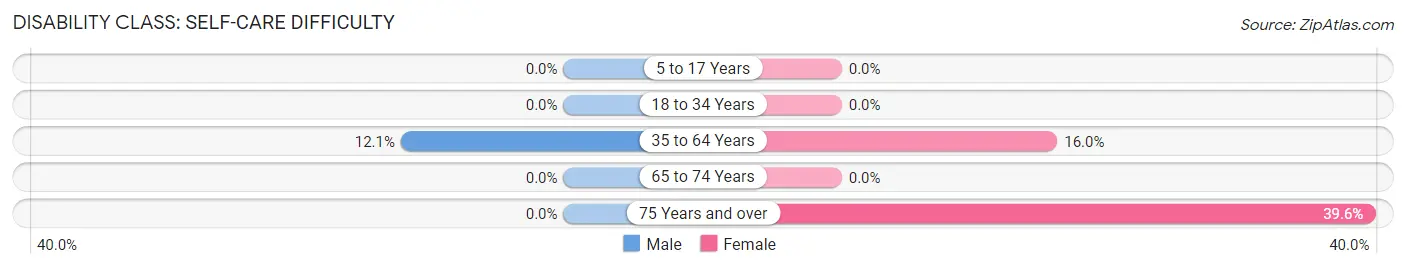
| Age Bracket | Male | Female |
| 5 to 17 Years | 0 (0.0%) | 0 (0.0%) |
| 18 to 34 Years | 0 (0.0%) | 0 (0.0%) |
| 35 to 64 Years | 70 (12.1%) | 84 (16.0%) |
| 65 to 74 Years | 0 (0.0%) | 0 (0.0%) |
| 75 Years and over | 0 (0.0%) | 40 (39.6%) |
Technology Access in Capitanejo
Computing Device Access in Capitanejo
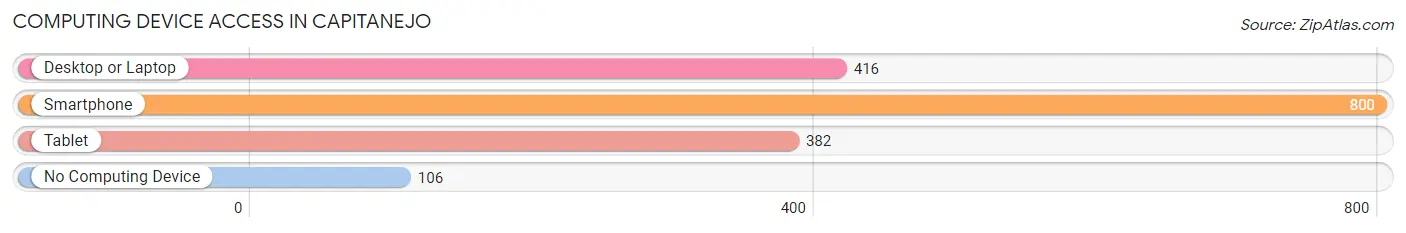
| Device Type | # Households | % Households |
| Desktop or Laptop | 416 | 43.7% |
| Smartphone | 800 | 84.0% |
| Tablet | 382 | 40.1% |
| No Computing Device | 106 | 11.1% |
| Total | 952 | 100.0% |
Internet Access in Capitanejo
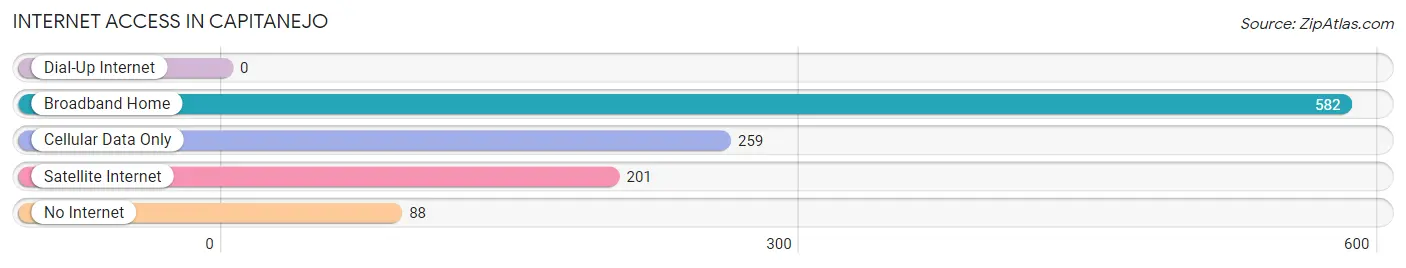
| Internet Type | # Households | % Households |
| Dial-Up Internet | 0 | 0.0% |
| Broadband Home | 582 | 61.1% |
| Cellular Data Only | 259 | 27.2% |
| Satellite Internet | 201 | 21.1% |
| No Internet | 88 | 9.2% |
| Total | 952 | 100.0% |
Capitanejo Summary
Capitanejo is a small town located in the municipality of San Germán, Puerto Rico. It is located in the southwestern part of the island, about 20 miles from the capital city of San Juan. The town has a population of approximately 2,000 people and is known for its rich history and culture.
History
The town of Capitanejo was founded in 1790 by Don Juan de la Cruz, a Spanish soldier who was stationed in the area. He named the town after himself, as “Capitanejo” is a combination of the words “capitán” (captain) and “ejo” (little). The town was originally a small farming community, but it soon grew to become a major center of commerce and industry.
In the 19th century, Capitanejo was a major producer of sugar cane, coffee, and tobacco. The town was also home to several factories, including a cigar factory and a tannery. During this time, the town was also a major port for the export of goods to the United States and other countries.
In the early 20th century, Capitanejo experienced a period of economic decline due to the Great Depression and the decline of the sugar industry. However, the town was able to recover and become a major center of commerce and industry once again.
Geography
Capitanejo is located in the southwestern part of Puerto Rico, about 20 miles from the capital city of San Juan. The town is situated in a valley surrounded by mountains, and is known for its lush vegetation and beautiful scenery. The town is also home to several rivers, including the Rio Grande de Loíza and the Rio Grande de Manatí.
The climate in Capitanejo is tropical, with temperatures ranging from the mid-70s to the mid-90s throughout the year. The town receives an average of about 60 inches of rain per year, and is known for its frequent rain showers.
Economy
The economy of Capitanejo is largely based on agriculture and tourism. The town is home to several farms, which produce a variety of crops, including sugar cane, coffee, and tobacco. The town is also home to several factories, including a cigar factory and a tannery.
In recent years, the town has become a popular tourist destination, due to its beautiful scenery and rich history. The town is home to several hotels and restaurants, as well as a variety of shops and boutiques.
Demographics
As of the 2010 census, the population of Capitanejo was 2,000. The town is predominantly Hispanic, with a majority of the population being of Puerto Rican descent. The town is also home to a small population of African Americans, as well as a small population of non-Hispanic whites.
The town is predominantly Catholic, with a majority of the population being affiliated with the Roman Catholic Church. The town is also home to a small population of Protestants, as well as a small population of Jews.
Conclusion
Capitanejo is a small town located in the municipality of San Germán, Puerto Rico. It is known for its rich history and culture, as well as its lush vegetation and beautiful scenery. The town has a population of approximately 2,000 people, and is largely based on agriculture and tourism. The town is predominantly Hispanic, with a majority of the population being of Puerto Rican descent. The town is also home to a small population of African Americans, as well as a small population of non-Hispanic whites. The town is predominantly Catholic, with a majority of the population being affiliated with the Roman Catholic Church.
Common Questions
What is Per Capita Income in Capitanejo?
Per Capita income in Capitanejo is $10,018.
What is the Median Family Income in Capitanejo?
Median Family Income in Capitanejo is $22,473.
What is the Median Household income in Capitanejo?
Median Household Income in Capitanejo is $23,681.
What is Family Income Deficit in Capitanejo?
Family Income Deficit in Capitanejo is $10,936.
Families that are below poverty line in Capitanejo earn $10,936 less on average than the poverty threshold level.
What is Inequality or Gini Index in Capitanejo?
Inequality or Gini Index in Capitanejo is 0.38.
What is the Total Population of Capitanejo?
Total Population of Capitanejo is 2,751.
What is the Total Male Population of Capitanejo?
Total Male Population of Capitanejo is 1,367.
What is the Total Female Population of Capitanejo?
Total Female Population of Capitanejo is 1,384.
What is the Ratio of Males per 100 Females in Capitanejo?
There are 98.77 Males per 100 Females in Capitanejo.
What is the Ratio of Females per 100 Males in Capitanejo?
There are 101.24 Females per 100 Males in Capitanejo.
What is the Median Population Age in Capitanejo?
Median Population Age in Capitanejo is 45.4 Years.
What is the Average Family Size in Capitanejo
Average Family Size in Capitanejo is 3.4 People.
What is the Average Household Size in Capitanejo
Average Household Size in Capitanejo is 2.9 People.
How Large is the Labor Force in Capitanejo?
There are 868 People in the Labor Forcein in Capitanejo.
What is the Percentage of People in the Labor Force in Capitanejo?
40.0% of People are in the Labor Force in Capitanejo.
What is the Unemployment Rate in Capitanejo?
Unemployment Rate in Capitanejo is 17.4%.