Bufalo, PR Map & Demographics
Bufalo Overview
$12,047
PER CAPITA INCOME
$20,061
AVG FAMILY INCOME
$15,000
AVG HOUSEHOLD INCOME
0.32
INEQUALITY / GINI INDEX
747
TOTAL POPULATION
384
MALE POPULATION
363
FEMALE POPULATION
105.79
MALES / 100 FEMALES
94.53
FEMALES / 100 MALES
48.9
MEDIAN AGE
2.7
AVG FAMILY SIZE
2.5
AVG HOUSEHOLD SIZE
346
LABOR FORCE [ PEOPLE ]
48.9%
PERCENT IN LABOR FORCE
26.3%
UNEMPLOYMENT RATE
Income in Bufalo
Income Overview in Bufalo
Per Capita Income in Bufalo is $12,047, while median incomes of families and households are $20,061 and $15,000 respectively.
| Characteristic | Number | Measure |
| Per Capita Income | 747 | $12,047 |
| Median Family Income | 248 | $20,061 |
| Mean Family Income | 248 | $21,321 |
| Median Household Income | 296 | $15,000 |
| Mean Household Income | 296 | $19,792 |
| Income Deficit | 248 | $0 |
| Wage / Income Gap (%) | 747 | 0.00% |
| Wage / Income Gap ($) | 747 | 100.00¢ per $1 |
| Gini / Inequality Index | 747 | 0.32 |
Earnings by Sex in Bufalo
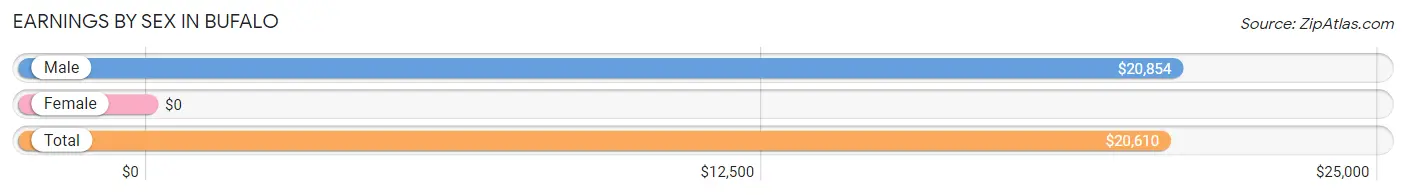
| Sex | Number | Average Earnings |
| Male | 144 (48.0%) | $20,854 |
| Female | 156 (52.0%) | $0 |
| Total | 300 (100.0%) | $20,610 |
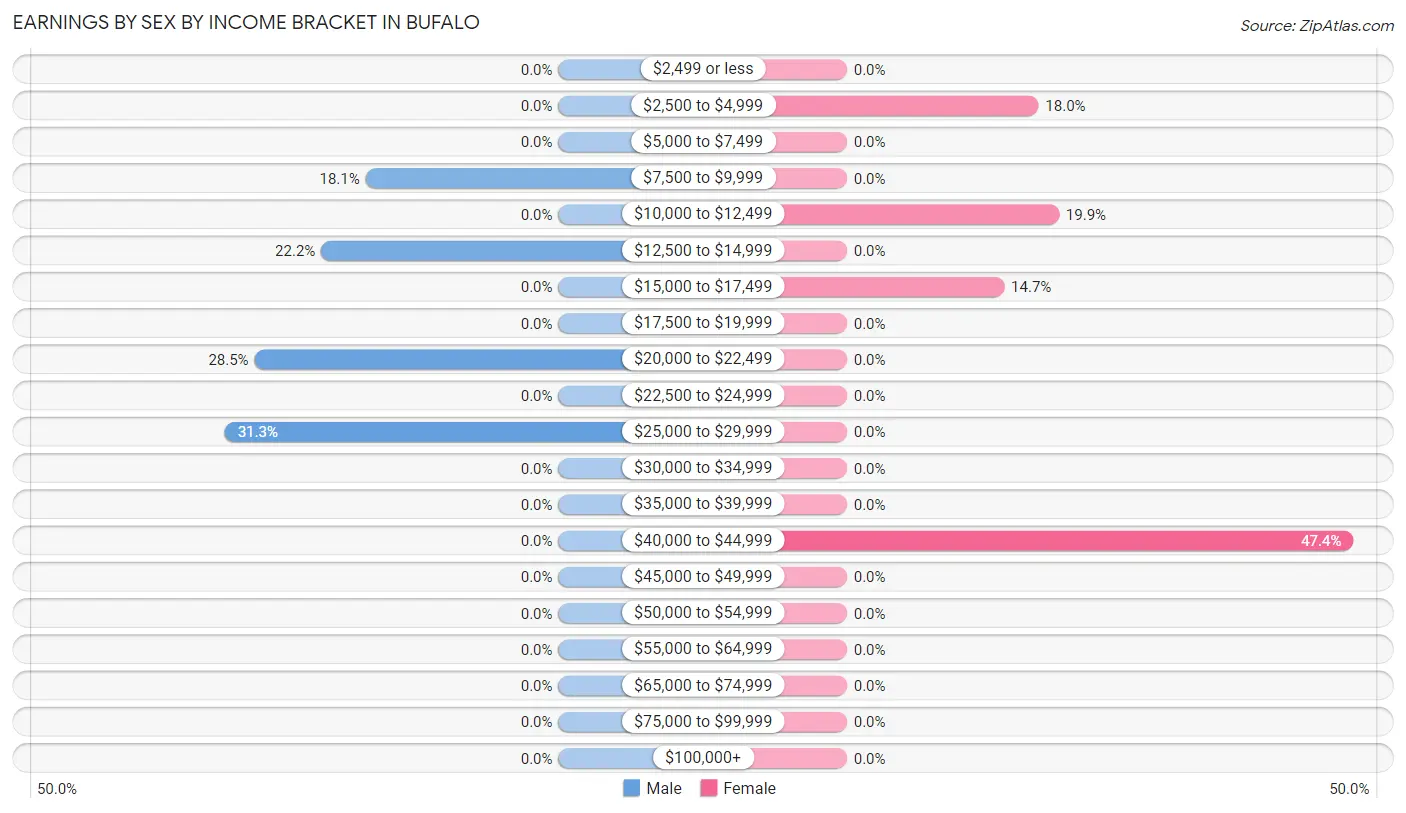
Earnings by Sex by Income Bracket in Bufalo
The most common earnings brackets in Bufalo are $25,000 to $29,999 for men (45 | 31.2%) and $40,000 to $44,999 for women (74 | 47.4%).
| Income | Male | Female |
| $2,499 or less | 0 (0.0%) | 0 (0.0%) |
| $2,500 to $4,999 | 0 (0.0%) | 28 (17.9%) |
| $5,000 to $7,499 | 0 (0.0%) | 0 (0.0%) |
| $7,500 to $9,999 | 26 (18.1%) | 0 (0.0%) |
| $10,000 to $12,499 | 0 (0.0%) | 31 (19.9%) |
| $12,500 to $14,999 | 32 (22.2%) | 0 (0.0%) |
| $15,000 to $17,499 | 0 (0.0%) | 23 (14.7%) |
| $17,500 to $19,999 | 0 (0.0%) | 0 (0.0%) |
| $20,000 to $22,499 | 41 (28.5%) | 0 (0.0%) |
| $22,500 to $24,999 | 0 (0.0%) | 0 (0.0%) |
| $25,000 to $29,999 | 45 (31.2%) | 0 (0.0%) |
| $30,000 to $34,999 | 0 (0.0%) | 0 (0.0%) |
| $35,000 to $39,999 | 0 (0.0%) | 0 (0.0%) |
| $40,000 to $44,999 | 0 (0.0%) | 74 (47.4%) |
| $45,000 to $49,999 | 0 (0.0%) | 0 (0.0%) |
| $50,000 to $54,999 | 0 (0.0%) | 0 (0.0%) |
| $55,000 to $64,999 | 0 (0.0%) | 0 (0.0%) |
| $65,000 to $74,999 | 0 (0.0%) | 0 (0.0%) |
| $75,000 to $99,999 | 0 (0.0%) | 0 (0.0%) |
| $100,000+ | 0 (0.0%) | 0 (0.0%) |
| Total | 144 (100.0%) | 156 (100.0%) |
Earnings by Sex by Educational Attainment in Bufalo
| Educational Attainment | Male Income | Female Income |
| Less than High School | - | - |
| High School Diploma | - | - |
| College or Associate's Degree | - | - |
| Bachelor's Degree | - | - |
| Graduate Degree | - | - |
| Total | $20,854 | $0 |
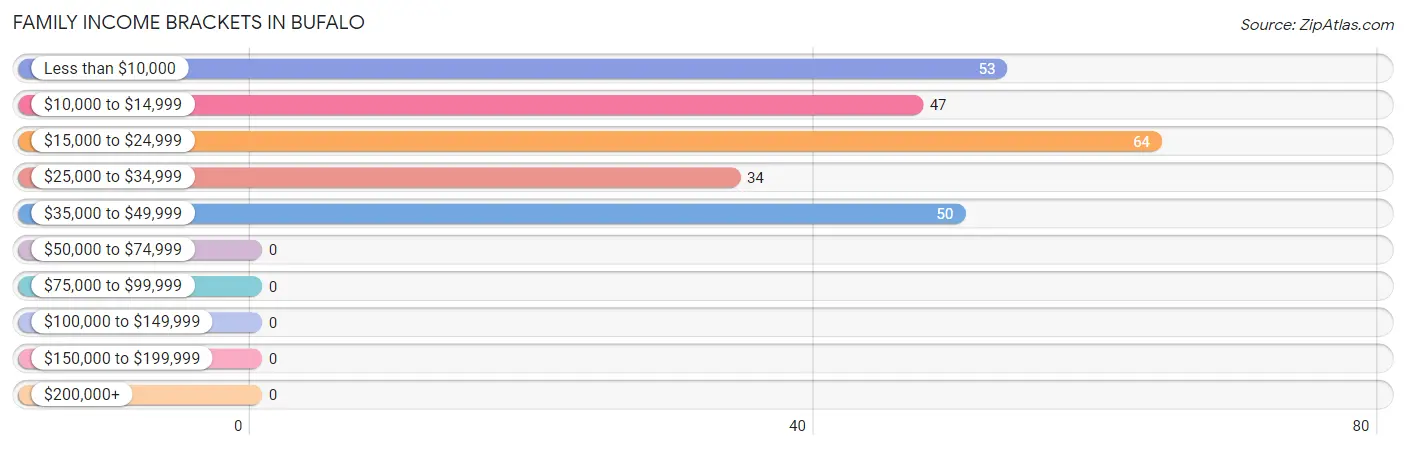
Family Income in Bufalo
Family Income Brackets in Bufalo
According to the Bufalo family income data, there are 64 families falling into the $15,000 to $24,999 income range, which is the most common income bracket and makes up 25.8% of all families.
| Income Bracket | # Families | % Families |
| Less than $10,000 | 53 | 21.4% |
| $10,000 to $14,999 | 47 | 19.0% |
| $15,000 to $24,999 | 64 | 25.8% |
| $25,000 to $34,999 | 34 | 13.7% |
| $35,000 to $49,999 | 50 | 20.2% |
| $50,000 to $74,999 | 0 | 0.0% |
| $75,000 to $99,999 | 0 | 0.0% |
| $100,000 to $149,999 | 0 | 0.0% |
| $150,000 to $199,999 | 0 | 0.0% |
| $200,000+ | 0 | 0.0% |
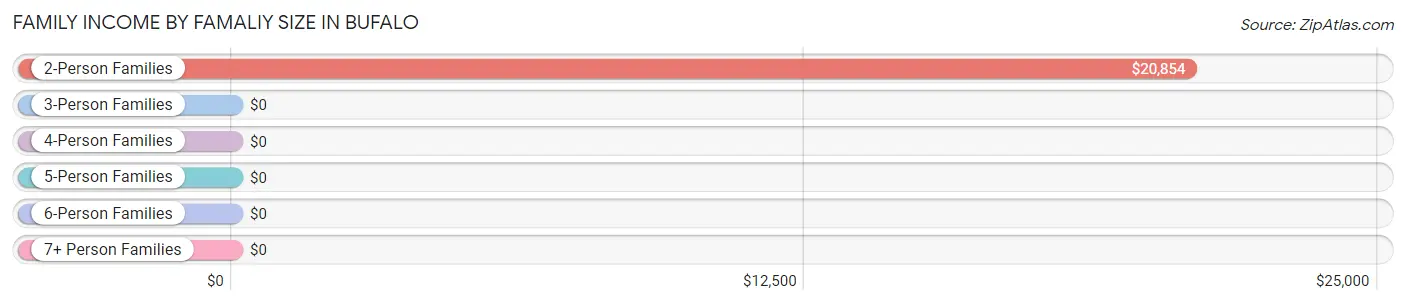
Family Income by Famaliy Size in Bufalo
2-person families (222 | 89.5%) account for the highest median family income in Bufalo with $20,854 per family, while 2-person families (222 | 89.5%) have the highest median income of $10,427 per family member.
| Income Bracket | # Families | Median Income |
| 2-Person Families | 222 (89.5%) | $20,854 |
| 3-Person Families | 26 (10.5%) | $0 |
| 4-Person Families | 0 (0.0%) | $0 |
| 5-Person Families | 0 (0.0%) | $0 |
| 6-Person Families | 0 (0.0%) | $0 |
| 7+ Person Families | 0 (0.0%) | $0 |
| Total | 248 (100.0%) | $20,061 |
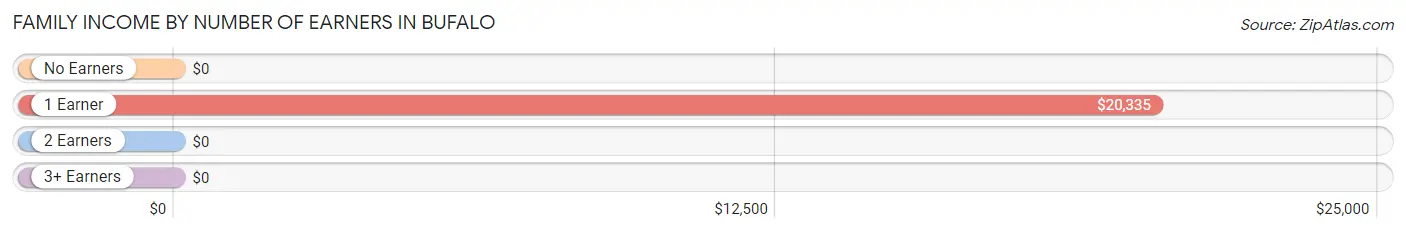
Family Income by Number of Earners in Bufalo
| Number of Earners | # Families | Median Income |
| No Earners | 77 (31.0%) | $0 |
| 1 Earner | 171 (69.0%) | $20,335 |
| 2 Earners | 0 (0.0%) | $0 |
| 3+ Earners | 0 (0.0%) | $0 |
| Total | 248 (100.0%) | $20,061 |
Household Income in Bufalo
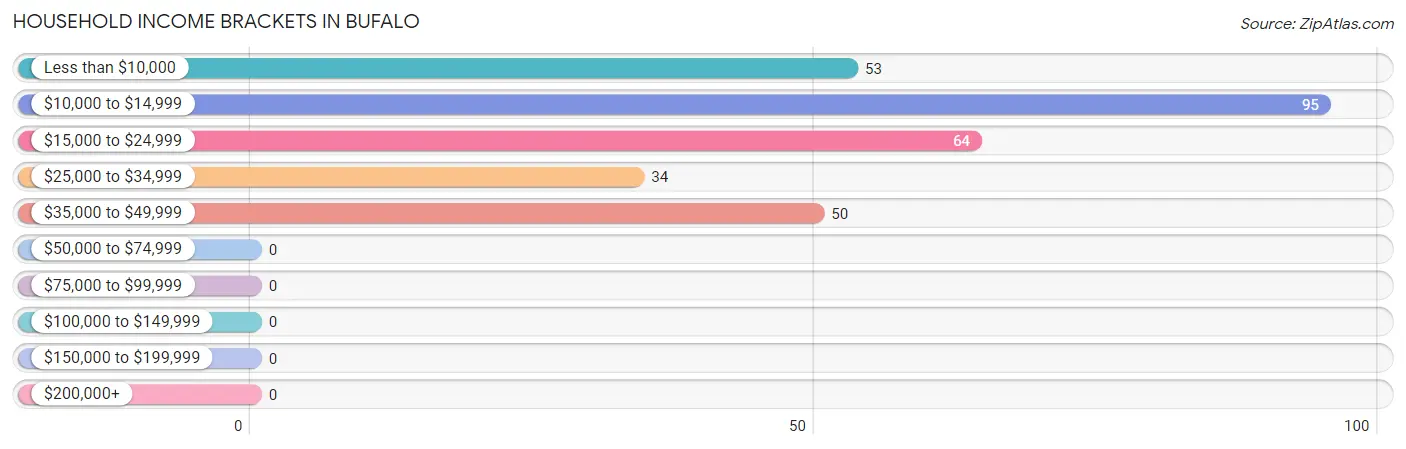
Household Income Brackets in Bufalo
With 95 households falling in the category, the $10,000 to $14,999 income range is the most frequent in Bufalo, accounting for 32.1% of all households.
| Income Bracket | # Households | % Households |
| Less than $10,000 | 53 | 17.9% |
| $10,000 to $14,999 | 95 | 32.1% |
| $15,000 to $24,999 | 64 | 21.6% |
| $25,000 to $34,999 | 34 | 11.5% |
| $35,000 to $49,999 | 50 | 16.9% |
| $50,000 to $74,999 | 0 | 0.0% |
| $75,000 to $99,999 | 0 | 0.0% |
| $100,000 to $149,999 | 0 | 0.0% |
| $150,000 to $199,999 | 0 | 0.0% |
| $200,000+ | 0 | 0.0% |
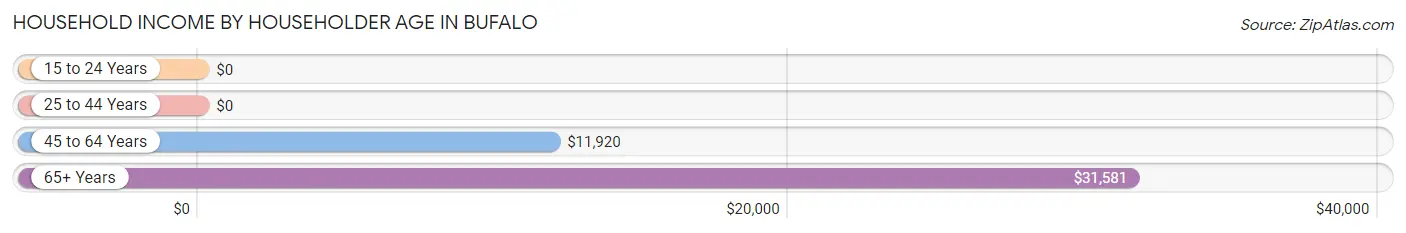
Household Income by Householder Age in Bufalo
The median household income in Bufalo is $15,000, with the highest median household income of $31,581 found in the 65+ years age bracket for the primary householder. A total of 75 households (25.3%) fall into this category.
| Income Bracket | # Households | Median Income |
| 15 to 24 Years | 0 (0.0%) | $0 |
| 25 to 44 Years | 72 (24.3%) | $0 |
| 45 to 64 Years | 149 (50.3%) | $11,920 |
| 65+ Years | 75 (25.3%) | $31,581 |
| Total | 296 (100.0%) | $15,000 |
Poverty in Bufalo
Income Below Poverty by Sex and Age in Bufalo
With 62.1% poverty level for males and 48.3% for females among the residents of Bufalo, 12 to 14 year old males and 55 to 64 year old females are the most vulnerable to poverty, with 40 males (100.0%) and 78 females (75.7%) in their respective age groups living below the poverty level.
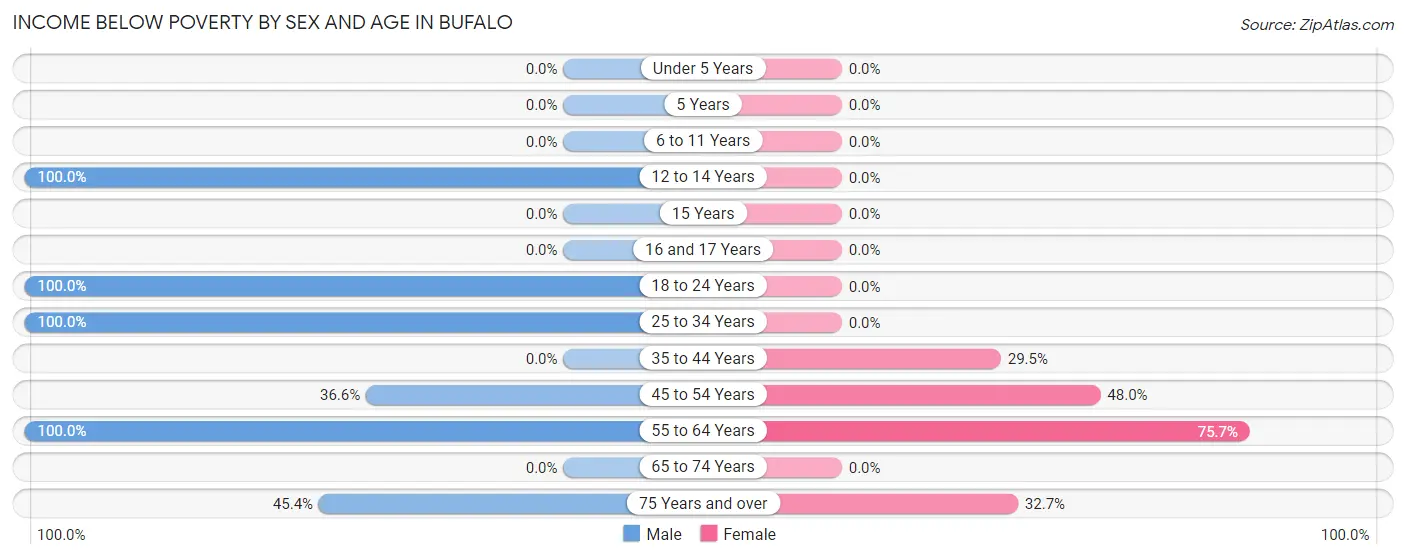
| Age Bracket | Male | Female |
| Under 5 Years | 0 (0.0%) | 0 (0.0%) |
| 5 Years | 0 (0.0%) | 0 (0.0%) |
| 6 to 11 Years | 0 (0.0%) | 0 (0.0%) |
| 12 to 14 Years | 40 (100.0%) | 0 (0.0%) |
| 15 Years | 0 (0.0%) | 0 (0.0%) |
| 16 and 17 Years | 0 (0.0%) | 0 (0.0%) |
| 18 to 24 Years | 36 (100.0%) | 0 (0.0%) |
| 25 to 34 Years | 55 (100.0%) | 0 (0.0%) |
| 35 to 44 Years | 0 (0.0%) | 31 (29.5%) |
| 45 to 54 Years | 26 (36.6%) | 48 (48.0%) |
| 55 to 64 Years | 32 (100.0%) | 78 (75.7%) |
| 65 to 74 Years | 0 (0.0%) | 0 (0.0%) |
| 75 Years and over | 49 (45.4%) | 17 (32.7%) |
| Total | 238 (62.1%) | 174 (48.3%) |
Income Above Poverty by Sex and Age in Bufalo
According to the poverty statistics in Bufalo, males aged 35 to 44 years and females aged 35 to 44 years are the age groups that are most secure financially, with 100.0% of males and 70.5% of females in these age groups living above the poverty line.
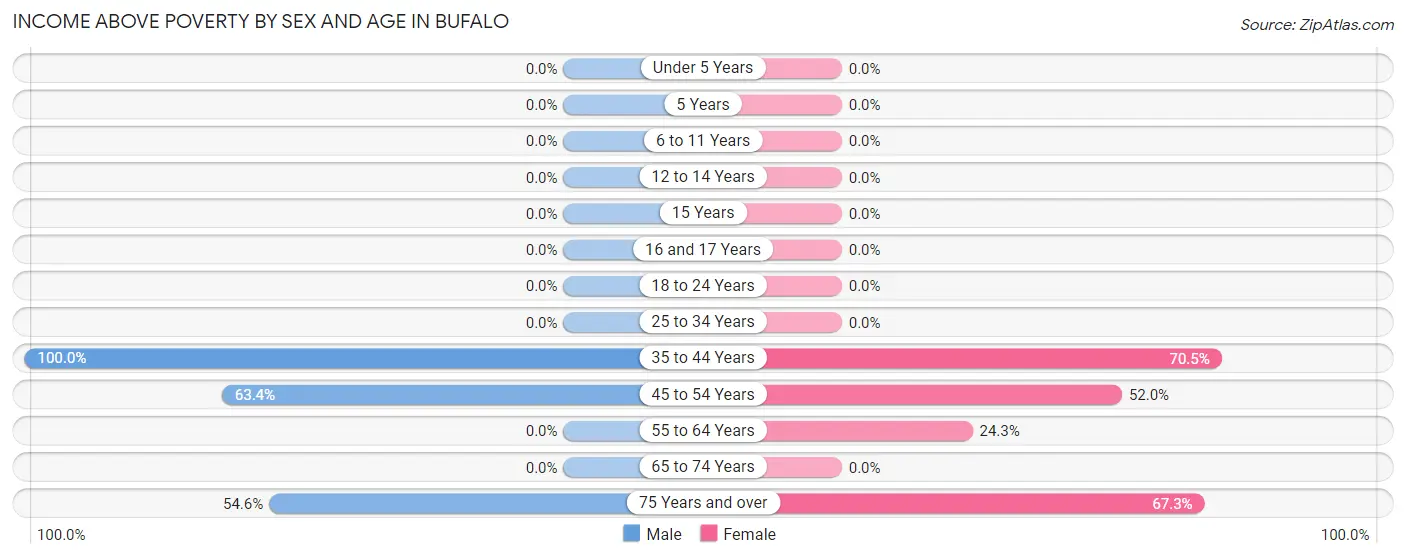
| Age Bracket | Male | Female |
| Under 5 Years | 0 (0.0%) | 0 (0.0%) |
| 5 Years | 0 (0.0%) | 0 (0.0%) |
| 6 to 11 Years | 0 (0.0%) | 0 (0.0%) |
| 12 to 14 Years | 0 (0.0%) | 0 (0.0%) |
| 15 Years | 0 (0.0%) | 0 (0.0%) |
| 16 and 17 Years | 0 (0.0%) | 0 (0.0%) |
| 18 to 24 Years | 0 (0.0%) | 0 (0.0%) |
| 25 to 34 Years | 0 (0.0%) | 0 (0.0%) |
| 35 to 44 Years | 41 (100.0%) | 74 (70.5%) |
| 45 to 54 Years | 45 (63.4%) | 52 (52.0%) |
| 55 to 64 Years | 0 (0.0%) | 25 (24.3%) |
| 65 to 74 Years | 0 (0.0%) | 0 (0.0%) |
| 75 Years and over | 59 (54.6%) | 35 (67.3%) |
| Total | 145 (37.9%) | 186 (51.7%) |
Income Below Poverty Among Married-Couple Families in Bufalo
The poverty statistics for married-couple families in Bufalo show that 67.0% or 69 of the total 103 families live below the poverty line. Families with 1 or 2 children have the highest poverty rate of 100.0%, comprising of 26 families. On the other hand, families with no children have the lowest poverty rate of 55.8%, which includes 43 families.
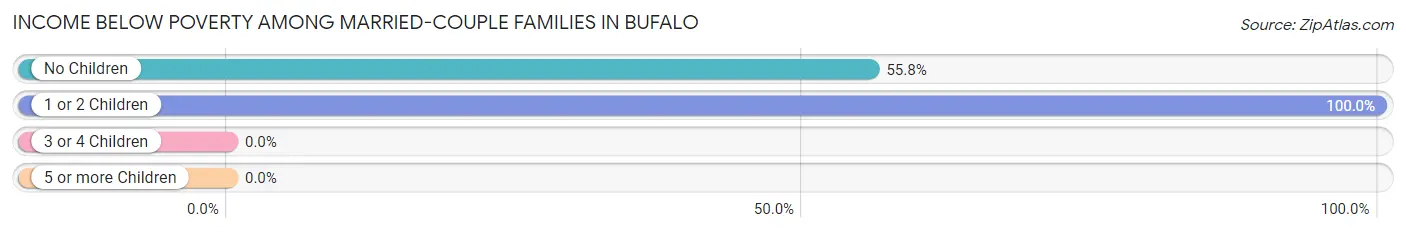
| Children | Above Poverty | Below Poverty |
| No Children | 34 (44.2%) | 43 (55.8%) |
| 1 or 2 Children | 0 (0.0%) | 26 (100.0%) |
| 3 or 4 Children | 0 (0.0%) | 0 (0.0%) |
| 5 or more Children | 0 (0.0%) | 0 (0.0%) |
| Total | 34 (33.0%) | 69 (67.0%) |
Income Below Poverty Among Single-Parent Households in Bufalo
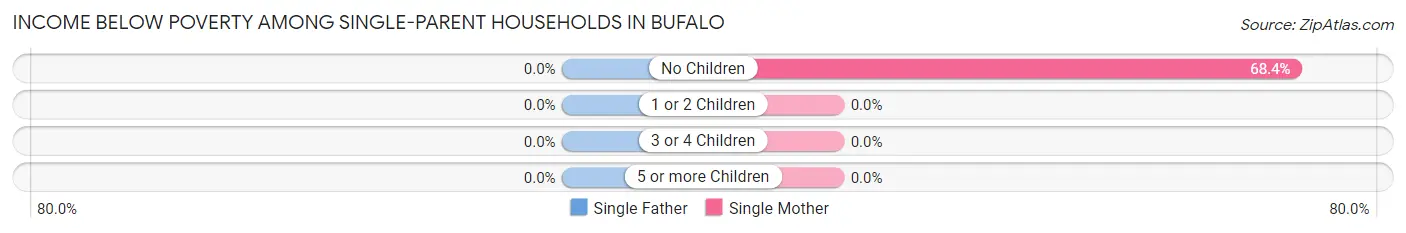
| Children | Single Father | Single Mother |
| No Children | 0 (0.0%) | 54 (68.3%) |
| 1 or 2 Children | 0 (0.0%) | 0 (0.0%) |
| 3 or 4 Children | 0 (0.0%) | 0 (0.0%) |
| 5 or more Children | 0 (0.0%) | 0 (0.0%) |
| Total | 0 (0.0%) | 54 (68.3%) |
Income Below Poverty Among Married-Couple vs Single-Parent Households in Bufalo
The poverty data for Bufalo shows that 69 of the married-couple family households (67.0%) and 54 of the single-parent households (37.2%) are living below the poverty level. Within the married-couple family households, those with 1 or 2 children have the highest poverty rate, with 26 households (100.0%) falling below the poverty line. Among the single-parent households, those with no children have the highest poverty rate, with 54 household (37.2%) living below poverty.
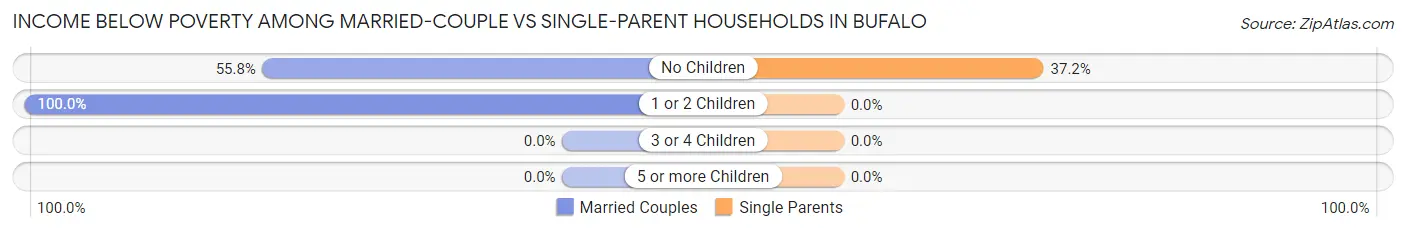
| Children | Married-Couple Families | Single-Parent Households |
| No Children | 43 (55.8%) | 54 (37.2%) |
| 1 or 2 Children | 26 (100.0%) | 0 (0.0%) |
| 3 or 4 Children | 0 (0.0%) | 0 (0.0%) |
| 5 or more Children | 0 (0.0%) | 0 (0.0%) |
| Total | 69 (67.0%) | 54 (37.2%) |
Race in Bufalo
The most populous races in Bufalo are Hispanic or Latino (747 | 100.0%), Two or more Races (351 | 47.0%), and White / Caucasian (183 | 24.5%).
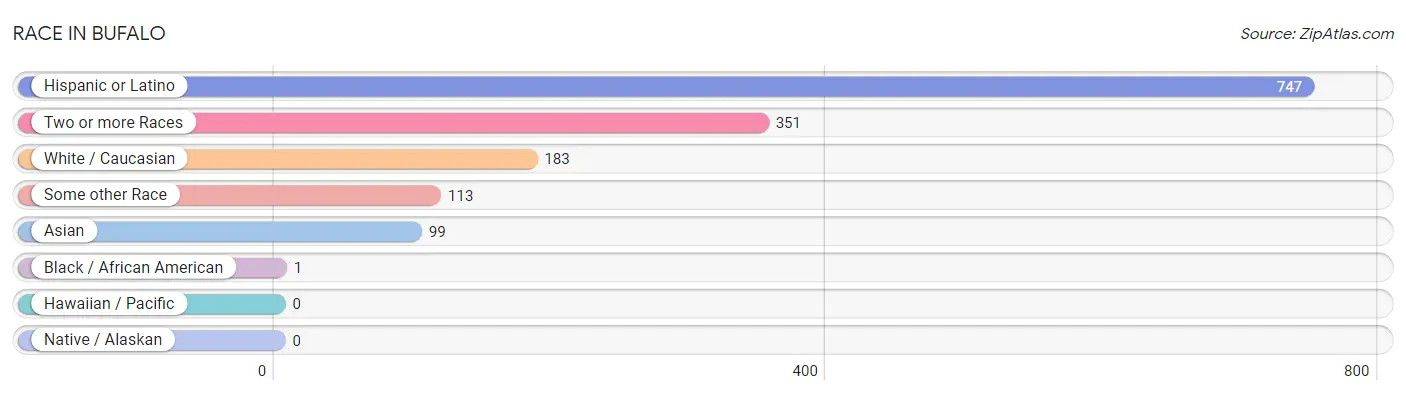
| Race | # Population | % Population |
| Asian | 99 | 13.3% |
| Black / African American | 1 | 0.1% |
| Hawaiian / Pacific | 0 | 0.0% |
| Hispanic or Latino | 747 | 100.0% |
| Native / Alaskan | 0 | 0.0% |
| White / Caucasian | 183 | 24.5% |
| Two or more Races | 351 | 47.0% |
| Some other Race | 113 | 15.1% |
| Total | 747 | 100.0% |
Ancestry in Bufalo
The most populous ancestries reported in Bufalo are Puerto Rican (747 | 100.0%), and Thai (99 | 13.3%), together accounting for 113.3% of all Bufalo residents.
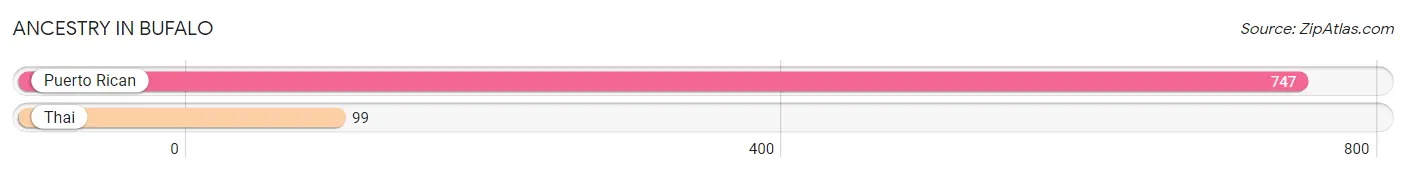
| Ancestry | # Population | % Population |
| Puerto Rican | 747 | 100.0% |
| Thai | 99 | 13.3% | View All 2 Rows |
Immigrants in Bufalo

| Immigration Origin | # Population | % Population | View All 0 Rows |
Sex and Age in Bufalo
Sex and Age in Bufalo
The most populous age groups in Bufalo are 45 to 49 Years (71 | 18.5%) for men and 35 to 39 Years (105 | 28.9%) for women.
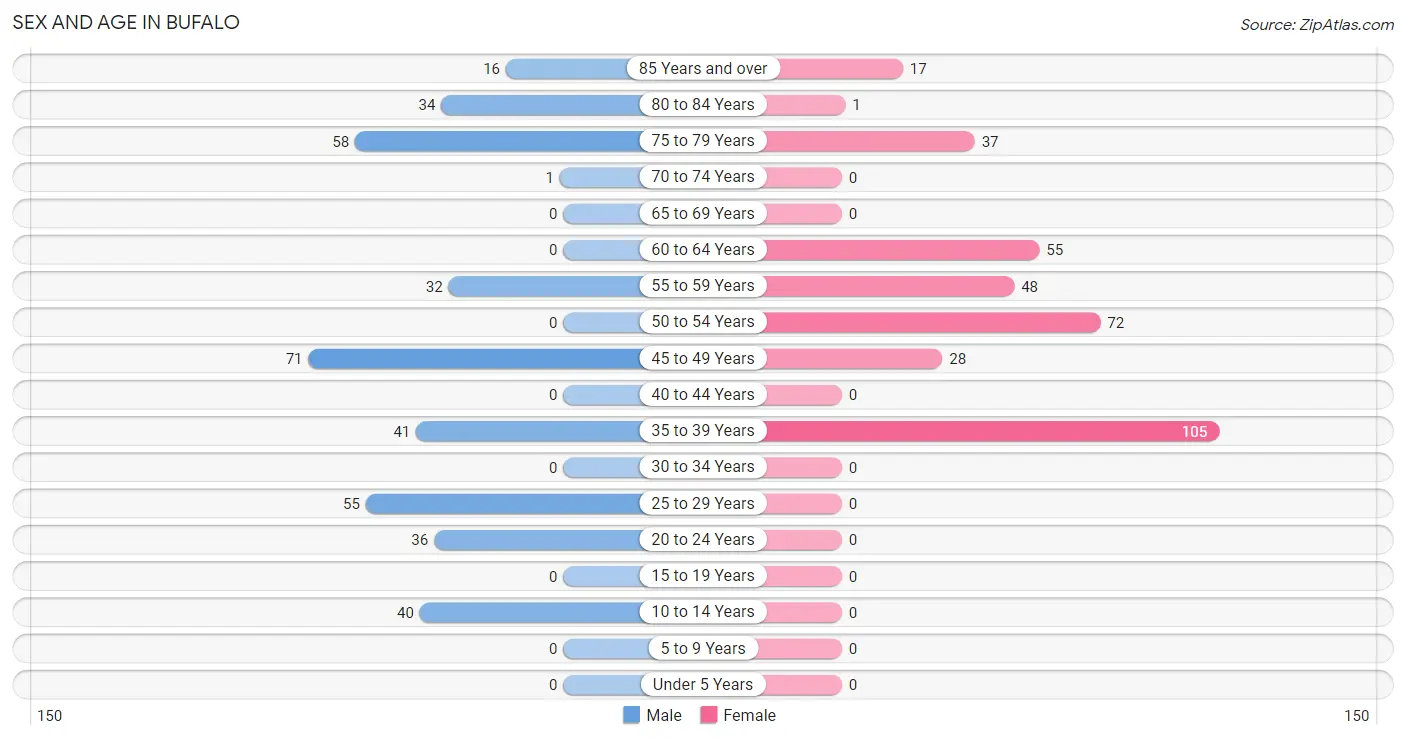
| Age Bracket | Male | Female |
| Under 5 Years | 0 (0.0%) | 0 (0.0%) |
| 5 to 9 Years | 0 (0.0%) | 0 (0.0%) |
| 10 to 14 Years | 40 (10.4%) | 0 (0.0%) |
| 15 to 19 Years | 0 (0.0%) | 0 (0.0%) |
| 20 to 24 Years | 36 (9.4%) | 0 (0.0%) |
| 25 to 29 Years | 55 (14.3%) | 0 (0.0%) |
| 30 to 34 Years | 0 (0.0%) | 0 (0.0%) |
| 35 to 39 Years | 41 (10.7%) | 105 (28.9%) |
| 40 to 44 Years | 0 (0.0%) | 0 (0.0%) |
| 45 to 49 Years | 71 (18.5%) | 28 (7.7%) |
| 50 to 54 Years | 0 (0.0%) | 72 (19.8%) |
| 55 to 59 Years | 32 (8.3%) | 48 (13.2%) |
| 60 to 64 Years | 0 (0.0%) | 55 (15.1%) |
| 65 to 69 Years | 0 (0.0%) | 0 (0.0%) |
| 70 to 74 Years | 1 (0.3%) | 0 (0.0%) |
| 75 to 79 Years | 58 (15.1%) | 37 (10.2%) |
| 80 to 84 Years | 34 (8.8%) | 1 (0.3%) |
| 85 Years and over | 16 (4.2%) | 17 (4.7%) |
| Total | 384 (100.0%) | 363 (100.0%) |
Families and Households in Bufalo
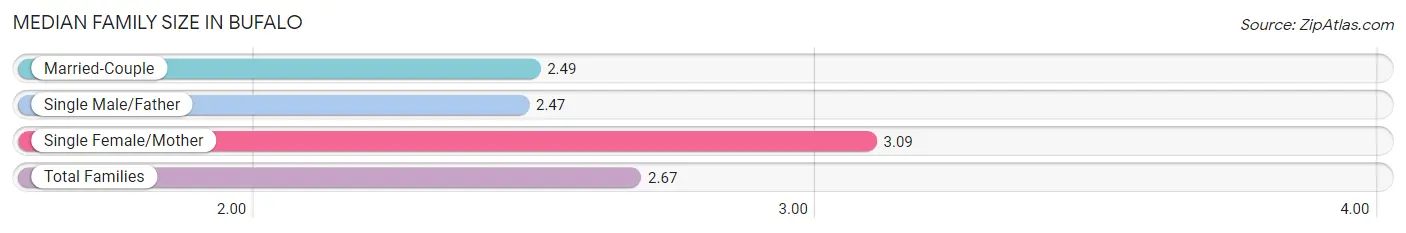
Median Family Size in Bufalo
The median family size in Bufalo is 2.67 persons per family, with single female/mother families (79 | 31.9%) accounting for the largest median family size of 3.09 persons per family. On the other hand, single male/father families (66 | 26.6%) represent the smallest median family size with 2.47 persons per family.
| Family Type | # Families | Family Size |
| Married-Couple | 103 (41.5%) | 2.49 |
| Single Male/Father | 66 (26.6%) | 2.47 |
| Single Female/Mother | 79 (31.9%) | 3.09 |
| Total Families | 248 (100.0%) | 2.67 |
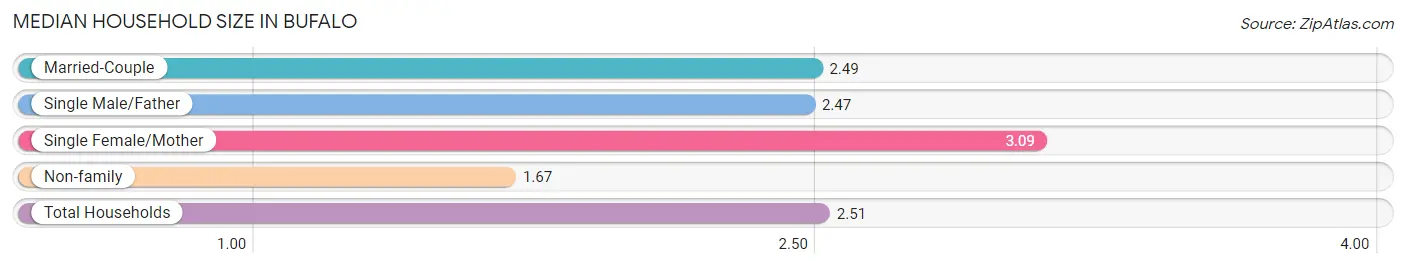
Median Household Size in Bufalo
The median household size in Bufalo is 2.51 persons per household, with single female/mother households (79 | 26.7%) accounting for the largest median household size of 3.09 persons per household. non-family households (48 | 16.2%) represent the smallest median household size with 1.67 persons per household.
| Household Type | # Households | Household Size |
| Married-Couple | 103 (34.8%) | 2.49 |
| Single Male/Father | 66 (22.3%) | 2.47 |
| Single Female/Mother | 79 (26.7%) | 3.09 |
| Non-family | 48 (16.2%) | 1.67 |
| Total Households | 296 (100.0%) | 2.51 |
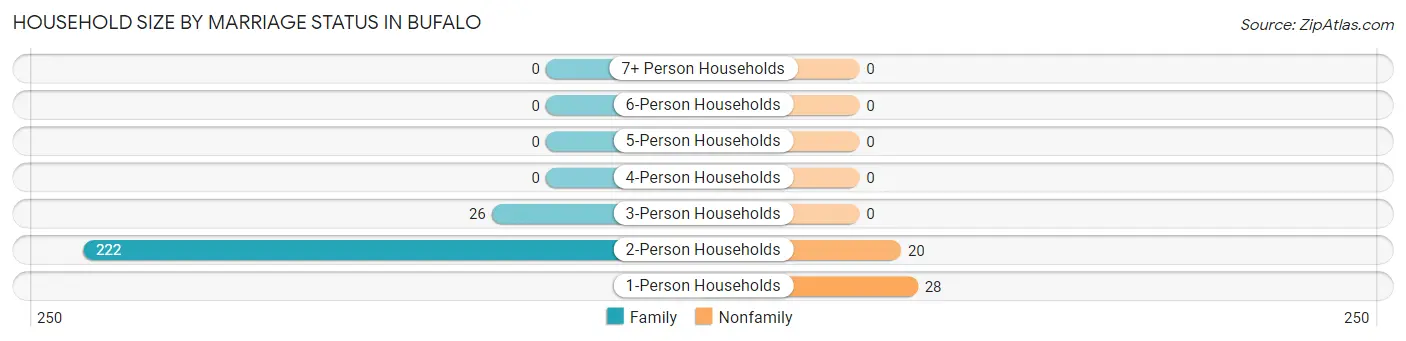
Household Size by Marriage Status in Bufalo
Out of a total of 296 households in Bufalo, 248 (83.8%) are family households, while 48 (16.2%) are nonfamily households. The most numerous type of family households are 2-person households, comprising 222, and the most common type of nonfamily households are 1-person households, comprising 28.
| Household Size | Family Households | Nonfamily Households |
| 1-Person Households | - | 28 (9.5%) |
| 2-Person Households | 222 (75.0%) | 20 (6.8%) |
| 3-Person Households | 26 (8.8%) | 0 (0.0%) |
| 4-Person Households | 0 (0.0%) | 0 (0.0%) |
| 5-Person Households | 0 (0.0%) | 0 (0.0%) |
| 6-Person Households | 0 (0.0%) | 0 (0.0%) |
| 7+ Person Households | 0 (0.0%) | 0 (0.0%) |
| Total | 248 (83.8%) | 48 (16.2%) |
Female Fertility in Bufalo
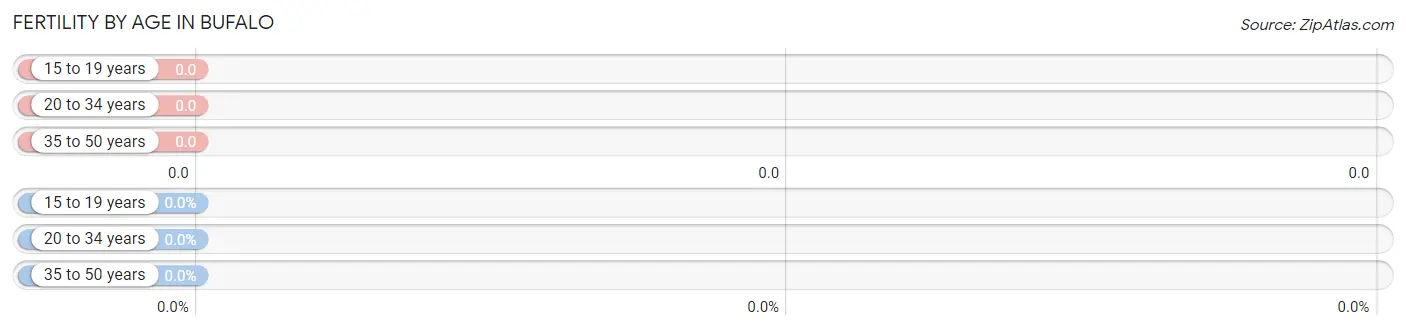
Fertility by Age in Bufalo
| Age Bracket | Women with Births | Births / 1,000 Women |
| 15 to 19 years | 0 (0.0%) | 0.0 |
| 20 to 34 years | 0 (0.0%) | 0.0 |
| 35 to 50 years | 0 (0.0%) | 0.0 |
| Total | 0 (0.0%) | 0.0 |
Fertility by Age by Marriage Status in Bufalo
| Age Bracket | Married | Unmarried |
| 15 to 19 years | 0 (0.0%) | 0 (0.0%) |
| 20 to 34 years | 0 (0.0%) | 0 (0.0%) |
| 35 to 50 years | 0 (0.0%) | 0 (0.0%) |
| Total | 0 (0.0%) | 0 (0.0%) |
Fertility by Education in Bufalo
| Educational Attainment | Women with Births | Births / 1,000 Women |
| Less than High School | 0 (0.0%) | 0.0 |
| High School Diploma | 0 (0.0%) | 0.0 |
| College or Associate's Degree | 0 (0.0%) | 0.0 |
| Bachelor's Degree | 0 (0.0%) | 0.0 |
| Graduate Degree | 0 (0.0%) | 0.0 |
| Total | 0 (0.0%) | 0.0 |
Fertility by Education by Marriage Status in Bufalo
| Educational Attainment | Married | Unmarried |
| Less than High School | 0 (0.0%) | 0 (0.0%) |
| High School Diploma | 0 (0.0%) | 0 (0.0%) |
| College or Associate's Degree | 0 (0.0%) | 0 (0.0%) |
| Bachelor's Degree | 0 (0.0%) | 0 (0.0%) |
| Graduate Degree | 0 (0.0%) | 0 (0.0%) |
| Total | 0 (0.0%) | 0 (0.0%) |
Employment Characteristics in Bufalo
Employment by Class of Employer in Bufalo
Among the 223 employed individuals in Bufalo, private company employees (102 | 45.7%), self-employed (not incorporated) (67 | 30.0%), and local government employees (31 | 13.9%) make up the most common classes of employment.
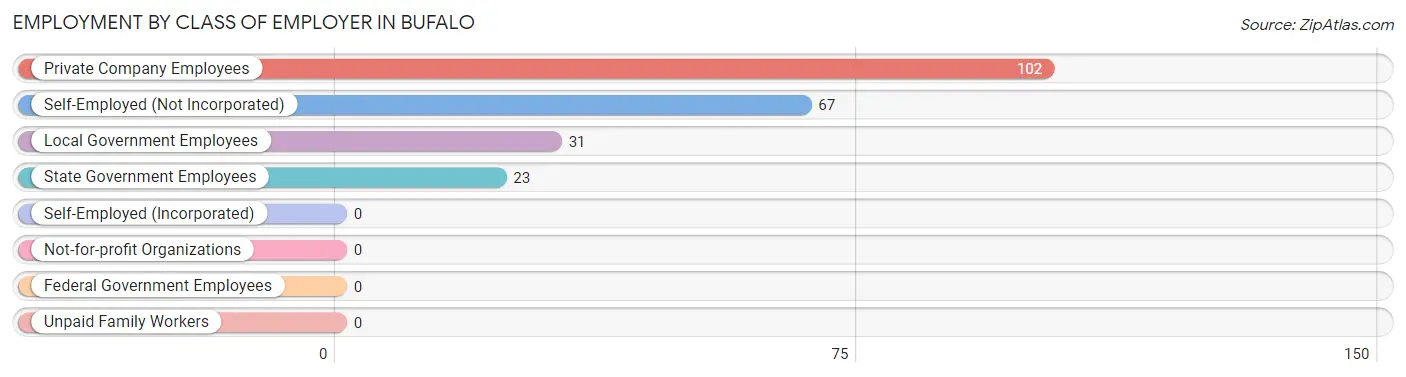
| Employer Class | # Employees | % Employees |
| Private Company Employees | 102 | 45.7% |
| Self-Employed (Incorporated) | 0 | 0.0% |
| Self-Employed (Not Incorporated) | 67 | 30.0% |
| Not-for-profit Organizations | 0 | 0.0% |
| Local Government Employees | 31 | 13.9% |
| State Government Employees | 23 | 10.3% |
| Federal Government Employees | 0 | 0.0% |
| Unpaid Family Workers | 0 | 0.0% |
| Total | 223 | 100.0% |
Employment Status by Age in Bufalo
According to the labor force statistics for Bufalo, out of the total population over 16 years of age (707), 48.9% or 346 individuals are in the labor force, with 26.3% or 91 of them unemployed. The age group with the highest labor force participation rate is 20 to 24 years, with 100.0% or 36 individuals in the labor force. Within the labor force, the 20 to 24 years age range has the highest percentage of unemployed individuals, with 100.0% or 36 of them being unemployed.
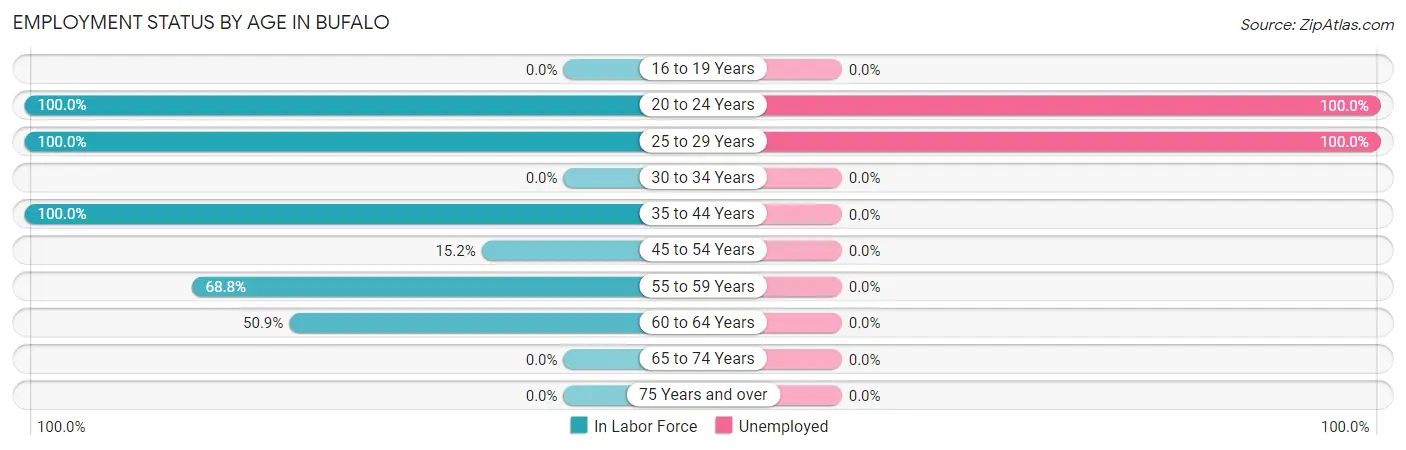
| Age Bracket | In Labor Force | Unemployed |
| 16 to 19 Years | 0 (0.0%) | 0 (0.0%) |
| 20 to 24 Years | 36 (100.0%) | 36 (100.0%) |
| 25 to 29 Years | 55 (100.0%) | 55 (100.0%) |
| 30 to 34 Years | 0 (0.0%) | 0 (0.0%) |
| 35 to 44 Years | 146 (100.0%) | 0 (0.0%) |
| 45 to 54 Years | 26 (15.2%) | 0 (0.0%) |
| 55 to 59 Years | 55 (68.8%) | 0 (0.0%) |
| 60 to 64 Years | 28 (50.9%) | 0 (0.0%) |
| 65 to 74 Years | 0 (0.0%) | 0 (0.0%) |
| 75 Years and over | 0 (0.0%) | 0 (0.0%) |
| Total | 346 (48.9%) | 91 (26.3%) |
Employment Status by Educational Attainment in Bufalo
According to labor force statistics for Bufalo, 61.1% of individuals (310) out of the total population between 25 and 64 years of age (507) are in the labor force, with 17.7% or 55 of them being unemployed. The group with the highest labor force participation rate are those with the educational attainment of college / associate degree, with 100.0% or 28 individuals in the labor force. Within the labor force, individuals with bachelor's degree or higher education have the highest percentage of unemployment, with 30.9% or 55 of them being unemployed.
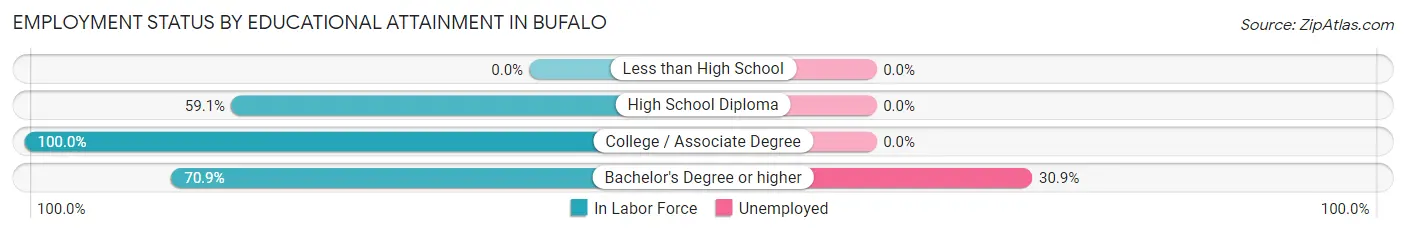
| Educational Attainment | In Labor Force | Unemployed |
| Less than High School | 0 (0.0%) | 0 (0.0%) |
| High School Diploma | 104 (59.1%) | 0 (0.0%) |
| College / Associate Degree | 28 (100.0%) | 0 (0.0%) |
| Bachelor's Degree or higher | 178 (70.9%) | 78 (30.9%) |
| Total | 310 (61.1%) | 90 (17.7%) |
Employment Occupations by Sex in Bufalo
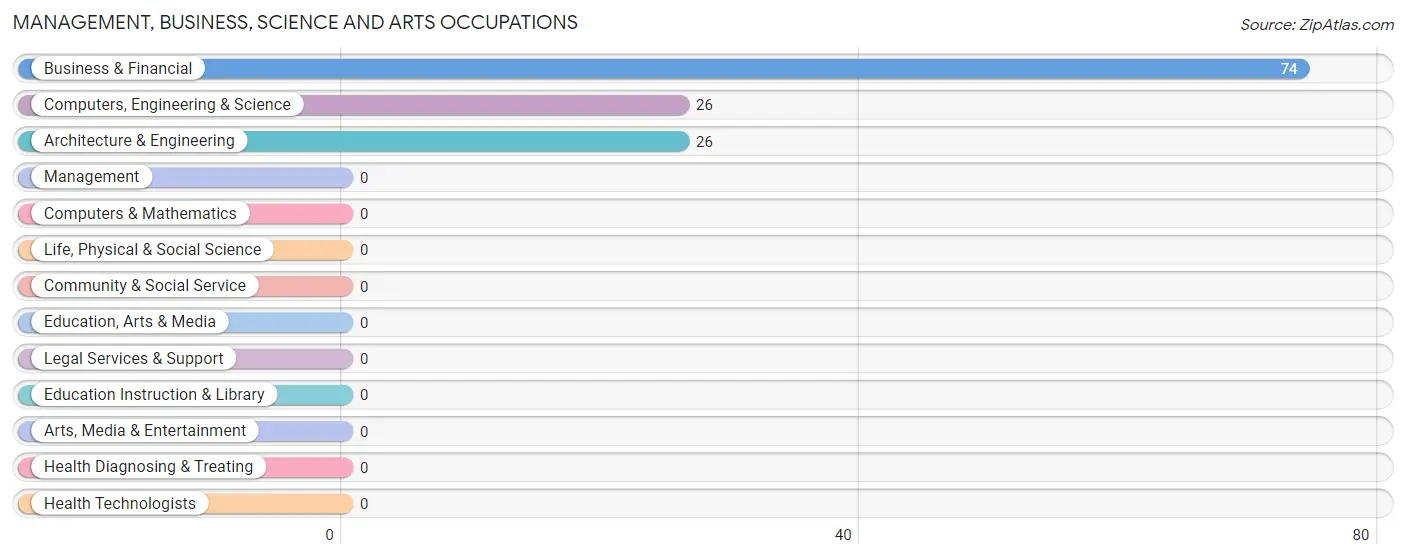
Management, Business, Science and Arts Occupations
The most common Management, Business, Science and Arts occupations in Bufalo are Business & Financial (74 | 29.0%), Computers, Engineering & Science (26 | 10.2%), and Architecture & Engineering (26 | 10.2%).
Management, Business, Science and Arts Occupations by Sex
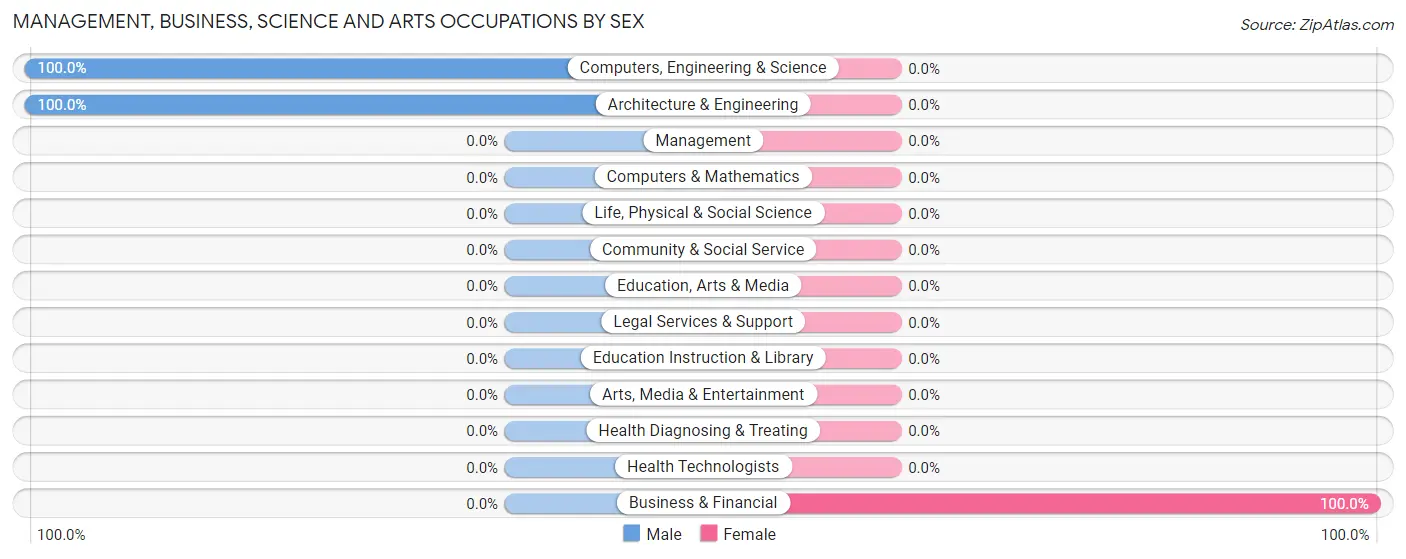
| Occupation | Male | Female |
| Management | 0 (0.0%) | 0 (0.0%) |
| Business & Financial | 0 (0.0%) | 74 (100.0%) |
| Computers, Engineering & Science | 26 (100.0%) | 0 (0.0%) |
| Computers & Mathematics | 0 (0.0%) | 0 (0.0%) |
| Architecture & Engineering | 26 (100.0%) | 0 (0.0%) |
| Life, Physical & Social Science | 0 (0.0%) | 0 (0.0%) |
| Community & Social Service | 0 (0.0%) | 0 (0.0%) |
| Education, Arts & Media | 0 (0.0%) | 0 (0.0%) |
| Legal Services & Support | 0 (0.0%) | 0 (0.0%) |
| Education Instruction & Library | 0 (0.0%) | 0 (0.0%) |
| Arts, Media & Entertainment | 0 (0.0%) | 0 (0.0%) |
| Health Diagnosing & Treating | 0 (0.0%) | 0 (0.0%) |
| Health Technologists | 0 (0.0%) | 0 (0.0%) |
| Total (Category) | 26 (26.0%) | 74 (74.0%) |
| Total (Overall) | 99 (38.8%) | 156 (61.2%) |
Services Occupations
The most common Services occupations in Bufalo are Food Preparation & Serving (41 | 16.1%), and Cleaning & Maintenance (31 | 12.2%).
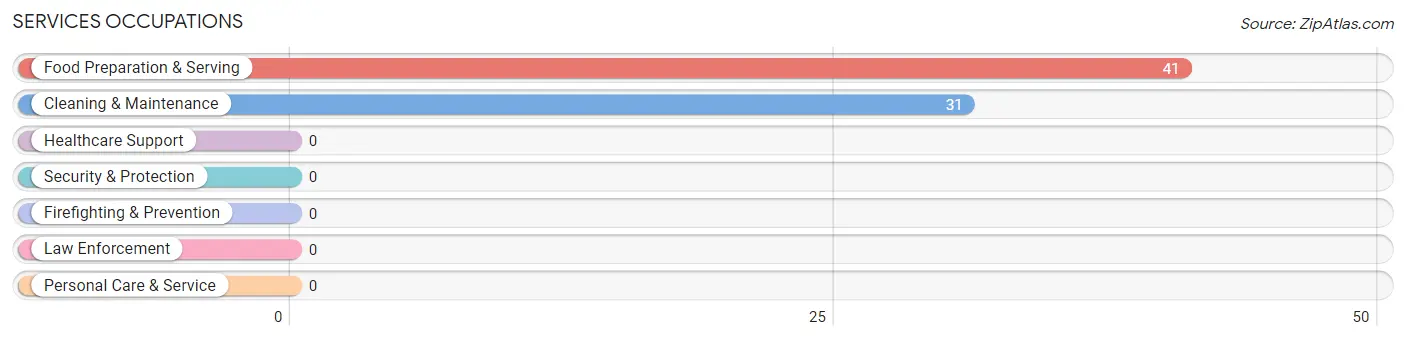
Services Occupations by Sex
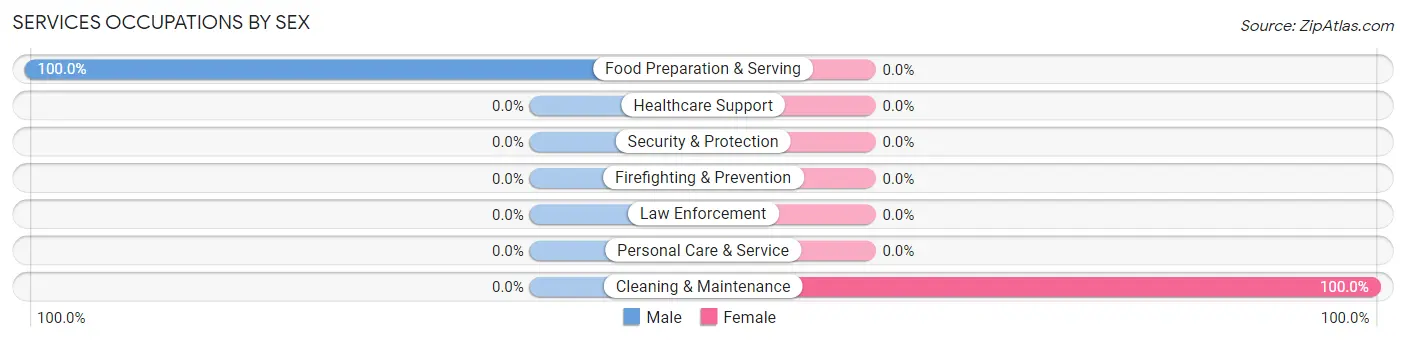
| Occupation | Male | Female |
| Healthcare Support | 0 (0.0%) | 0 (0.0%) |
| Security & Protection | 0 (0.0%) | 0 (0.0%) |
| Firefighting & Prevention | 0 (0.0%) | 0 (0.0%) |
| Law Enforcement | 0 (0.0%) | 0 (0.0%) |
| Food Preparation & Serving | 41 (100.0%) | 0 (0.0%) |
| Cleaning & Maintenance | 0 (0.0%) | 31 (100.0%) |
| Personal Care & Service | 0 (0.0%) | 0 (0.0%) |
| Total (Category) | 41 (56.9%) | 31 (43.1%) |
| Total (Overall) | 99 (38.8%) | 156 (61.2%) |
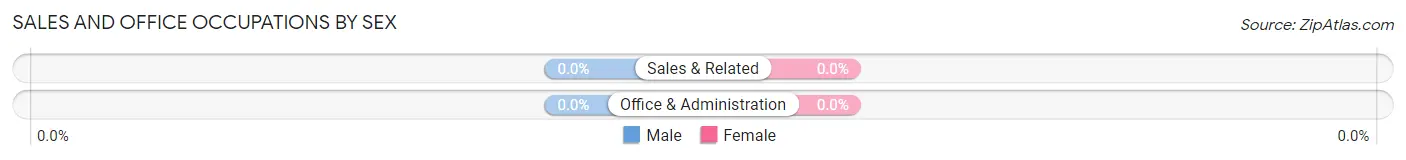
Sales and Office Occupations

Sales and Office Occupations by Sex
| Occupation | Male | Female |
| Sales & Related | 0 (0.0%) | 0 (0.0%) |
| Office & Administration | 0 (0.0%) | 0 (0.0%) |
| Total (Category) | 0 (0.0%) | 0 (0.0%) |
| Total (Overall) | 99 (38.8%) | 156 (61.2%) |
Natural Resources, Construction and Maintenance Occupations
The most common Natural Resources, Construction and Maintenance occupations in Bufalo are Installation, Maintenance & Repair (32 | 12.6%), and Farming, Fishing & Forestry (28 | 11.0%).

Natural Resources, Construction and Maintenance Occupations by Sex

| Occupation | Male | Female |
| Farming, Fishing & Forestry | 0 (0.0%) | 28 (100.0%) |
| Construction & Extraction | 0 (0.0%) | 0 (0.0%) |
| Installation, Maintenance & Repair | 32 (100.0%) | 0 (0.0%) |
| Total (Category) | 32 (53.3%) | 28 (46.7%) |
| Total (Overall) | 99 (38.8%) | 156 (61.2%) |
Production, Transportation and Moving Occupations
The most common Production, Transportation and Moving occupations in Bufalo are , and Transportation (23 | 9.0%).
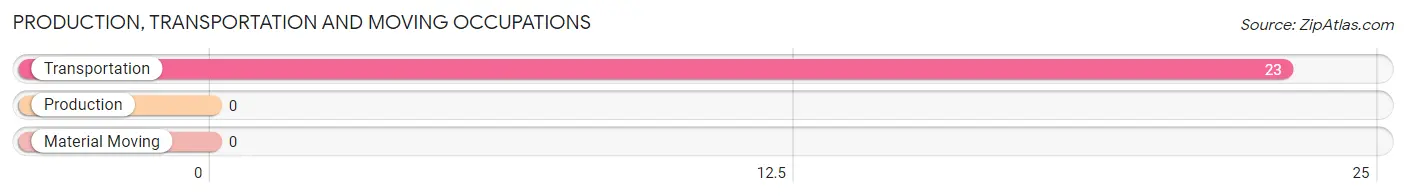
Production, Transportation and Moving Occupations by Sex

| Occupation | Male | Female |
| Production | 0 (0.0%) | 0 (0.0%) |
| Transportation | 0 (0.0%) | 23 (100.0%) |
| Material Moving | 0 (0.0%) | 0 (0.0%) |
| Total (Category) | 0 (0.0%) | 23 (100.0%) |
| Total (Overall) | 99 (38.8%) | 156 (61.2%) |
Employment Industries by Sex in Bufalo
Employment Industries in Bufalo
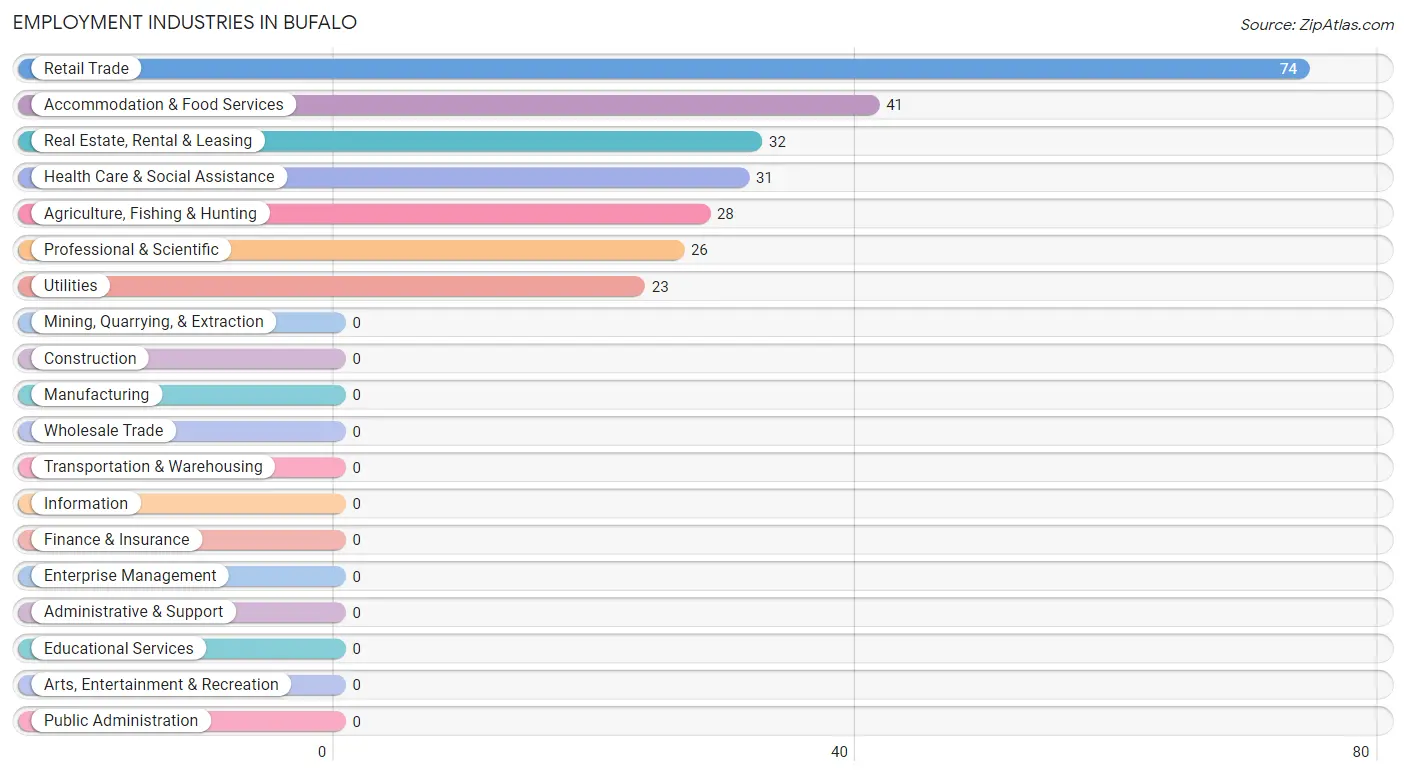
The major employment industries in Bufalo include Retail Trade (74 | 29.0%), Accommodation & Food Services (41 | 16.1%), Real Estate, Rental & Leasing (32 | 12.6%), Health Care & Social Assistance (31 | 12.2%), and Agriculture, Fishing & Hunting (28 | 11.0%).
Employment Industries by Sex in Bufalo
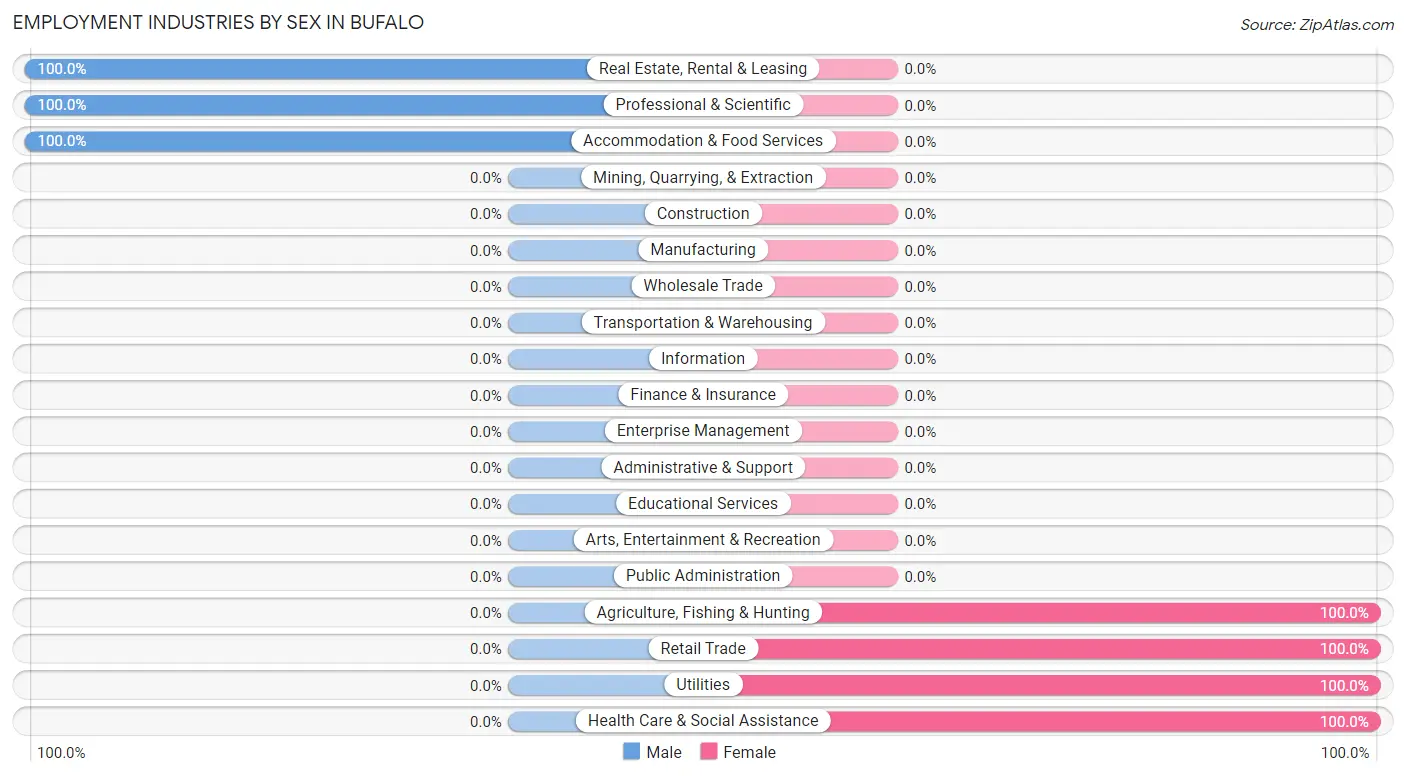
The Bufalo industries that see more men than women are Real Estate, Rental & Leasing (100.0%), Professional & Scientific (100.0%), and Accommodation & Food Services (100.0%), whereas the industries that tend to have a higher number of women are Agriculture, Fishing & Hunting (100.0%), Retail Trade (100.0%), and Utilities (100.0%).
| Industry | Male | Female |
| Agriculture, Fishing & Hunting | 0 (0.0%) | 28 (100.0%) |
| Mining, Quarrying, & Extraction | 0 (0.0%) | 0 (0.0%) |
| Construction | 0 (0.0%) | 0 (0.0%) |
| Manufacturing | 0 (0.0%) | 0 (0.0%) |
| Wholesale Trade | 0 (0.0%) | 0 (0.0%) |
| Retail Trade | 0 (0.0%) | 74 (100.0%) |
| Transportation & Warehousing | 0 (0.0%) | 0 (0.0%) |
| Utilities | 0 (0.0%) | 23 (100.0%) |
| Information | 0 (0.0%) | 0 (0.0%) |
| Finance & Insurance | 0 (0.0%) | 0 (0.0%) |
| Real Estate, Rental & Leasing | 32 (100.0%) | 0 (0.0%) |
| Professional & Scientific | 26 (100.0%) | 0 (0.0%) |
| Enterprise Management | 0 (0.0%) | 0 (0.0%) |
| Administrative & Support | 0 (0.0%) | 0 (0.0%) |
| Educational Services | 0 (0.0%) | 0 (0.0%) |
| Health Care & Social Assistance | 0 (0.0%) | 31 (100.0%) |
| Arts, Entertainment & Recreation | 0 (0.0%) | 0 (0.0%) |
| Accommodation & Food Services | 41 (100.0%) | 0 (0.0%) |
| Public Administration | 0 (0.0%) | 0 (0.0%) |
| Total | 99 (38.8%) | 156 (61.2%) |
Education in Bufalo
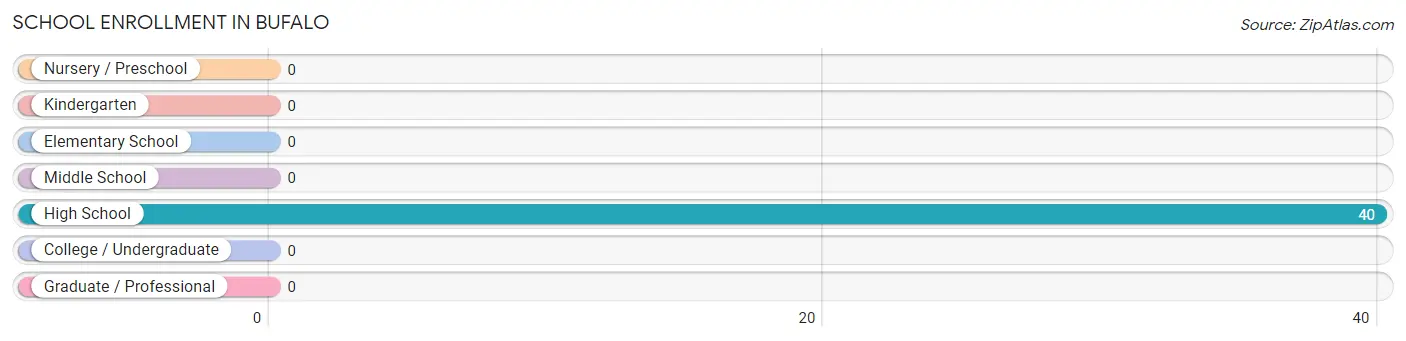
School Enrollment in Bufalo
| School Level | # Students | % Students |
| Nursery / Preschool | 0 | 0.0% |
| Kindergarten | 0 | 0.0% |
| Elementary School | 0 | 0.0% |
| Middle School | 0 | 0.0% |
| High School | 40 | 100.0% |
| College / Undergraduate | 0 | 0.0% |
| Graduate / Professional | 0 | 0.0% |
| Total | 40 | 100.0% |
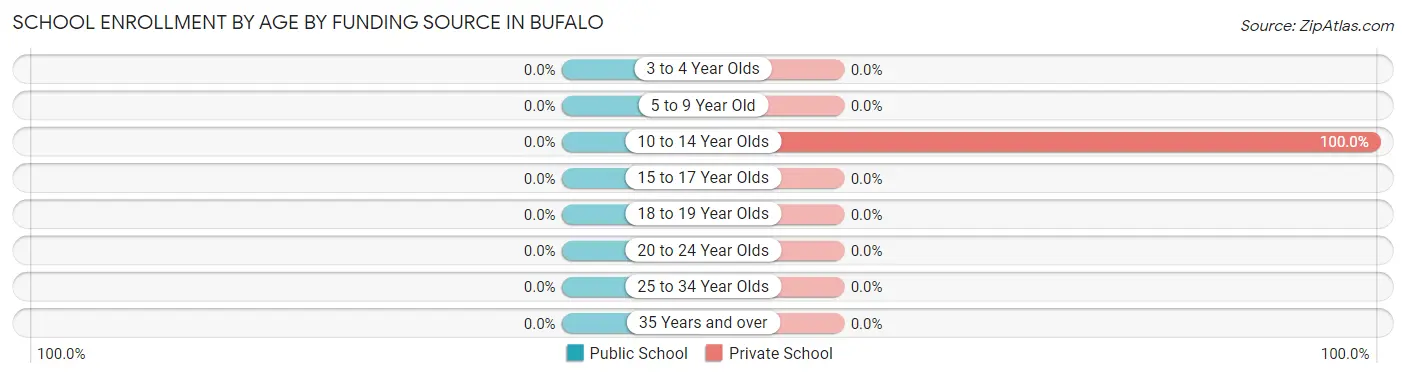
School Enrollment by Age by Funding Source in Bufalo
| Age Bracket | Public School | Private School |
| 3 to 4 Year Olds | 0 (0.0%) | 0 (0.0%) |
| 5 to 9 Year Old | 0 (0.0%) | 0 (0.0%) |
| 10 to 14 Year Olds | 0 (0.0%) | 40 (100.0%) |
| 15 to 17 Year Olds | 0 (0.0%) | 0 (0.0%) |
| 18 to 19 Year Olds | 0 (0.0%) | 0 (0.0%) |
| 20 to 24 Year Olds | 0 (0.0%) | 0 (0.0%) |
| 25 to 34 Year Olds | 0 (0.0%) | 0 (0.0%) |
| 35 Years and over | 0 (0.0%) | 0 (0.0%) |
| Total | 0 (0.0%) | 40 (100.0%) |
Educational Attainment by Field of Study in Bufalo
Business (97 | 38.5%), social sciences (55 | 21.8%), science & technology (54 | 21.4%), and education (46 | 18.2%) are the most common fields of study among 252 individuals in Bufalo who have obtained a bachelor's degree or higher.
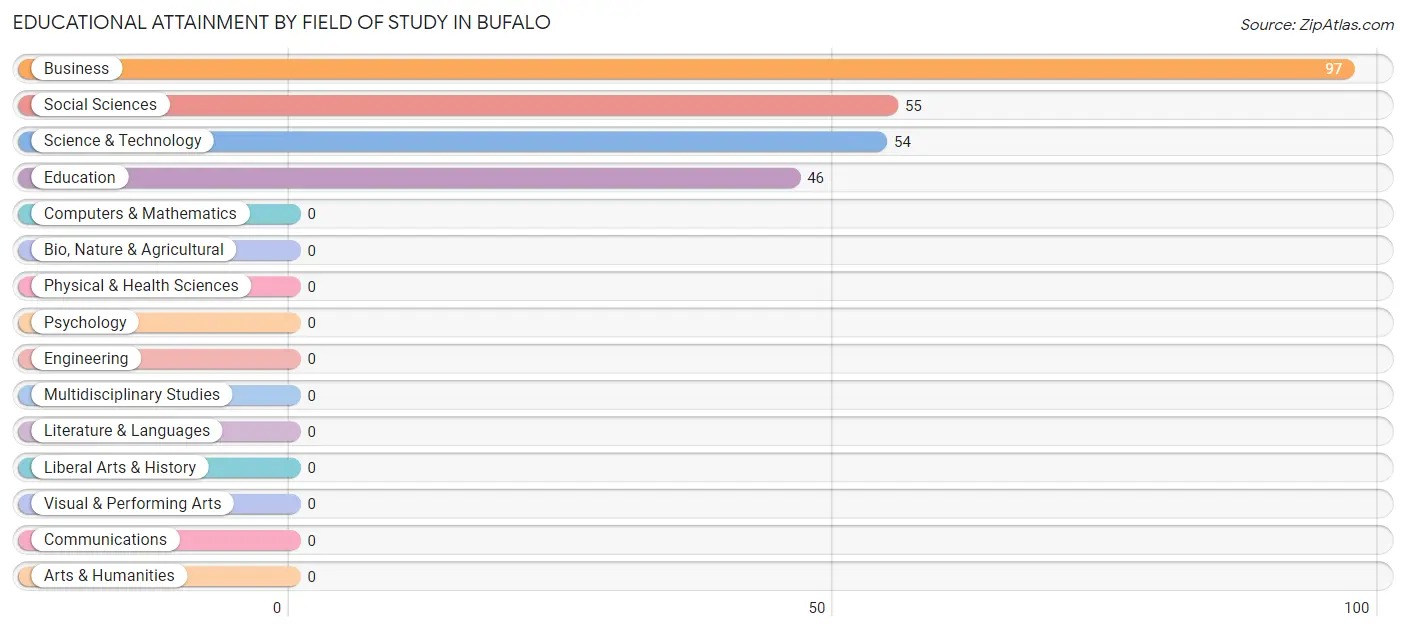
| Field of Study | # Graduates | % Graduates |
| Computers & Mathematics | 0 | 0.0% |
| Bio, Nature & Agricultural | 0 | 0.0% |
| Physical & Health Sciences | 0 | 0.0% |
| Psychology | 0 | 0.0% |
| Social Sciences | 55 | 21.8% |
| Engineering | 0 | 0.0% |
| Multidisciplinary Studies | 0 | 0.0% |
| Science & Technology | 54 | 21.4% |
| Business | 97 | 38.5% |
| Education | 46 | 18.2% |
| Literature & Languages | 0 | 0.0% |
| Liberal Arts & History | 0 | 0.0% |
| Visual & Performing Arts | 0 | 0.0% |
| Communications | 0 | 0.0% |
| Arts & Humanities | 0 | 0.0% |
| Total | 252 | 100.0% |
Transportation & Commute in Bufalo
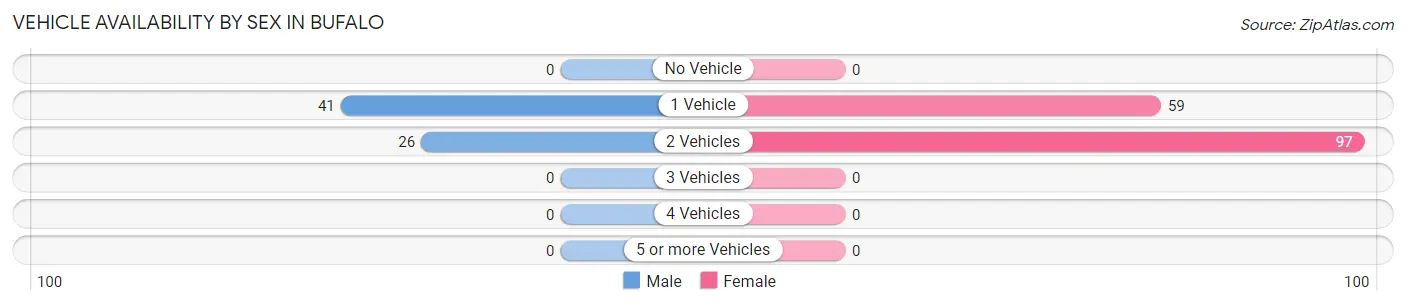
Vehicle Availability by Sex in Bufalo
The most prevalent vehicle ownership categories in Bufalo are males with 1 vehicle (41, accounting for 61.2%) and females with 1 vehicle (59, making up 26.3%).
| Vehicles Available | Male | Female |
| No Vehicle | 0 (0.0%) | 0 (0.0%) |
| 1 Vehicle | 41 (61.2%) | 59 (37.8%) |
| 2 Vehicles | 26 (38.8%) | 97 (62.2%) |
| 3 Vehicles | 0 (0.0%) | 0 (0.0%) |
| 4 Vehicles | 0 (0.0%) | 0 (0.0%) |
| 5 or more Vehicles | 0 (0.0%) | 0 (0.0%) |
| Total | 67 (100.0%) | 156 (100.0%) |
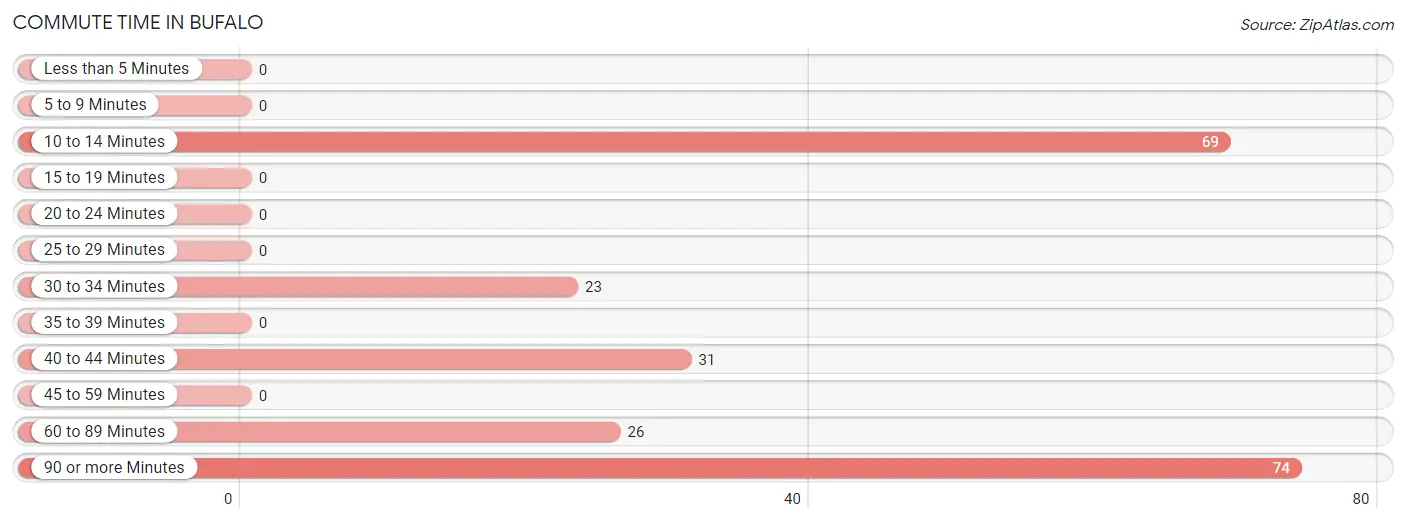
Commute Time in Bufalo
The most frequently occuring commute durations in Bufalo are 90 or more minutes (74 commuters, 33.2%), 10 to 14 minutes (69 commuters, 30.9%), and 40 to 44 minutes (31 commuters, 13.9%).
| Commute Time | # Commuters | % Commuters |
| Less than 5 Minutes | 0 | 0.0% |
| 5 to 9 Minutes | 0 | 0.0% |
| 10 to 14 Minutes | 69 | 30.9% |
| 15 to 19 Minutes | 0 | 0.0% |
| 20 to 24 Minutes | 0 | 0.0% |
| 25 to 29 Minutes | 0 | 0.0% |
| 30 to 34 Minutes | 23 | 10.3% |
| 35 to 39 Minutes | 0 | 0.0% |
| 40 to 44 Minutes | 31 | 13.9% |
| 45 to 59 Minutes | 0 | 0.0% |
| 60 to 89 Minutes | 26 | 11.7% |
| 90 or more Minutes | 74 | 33.2% |
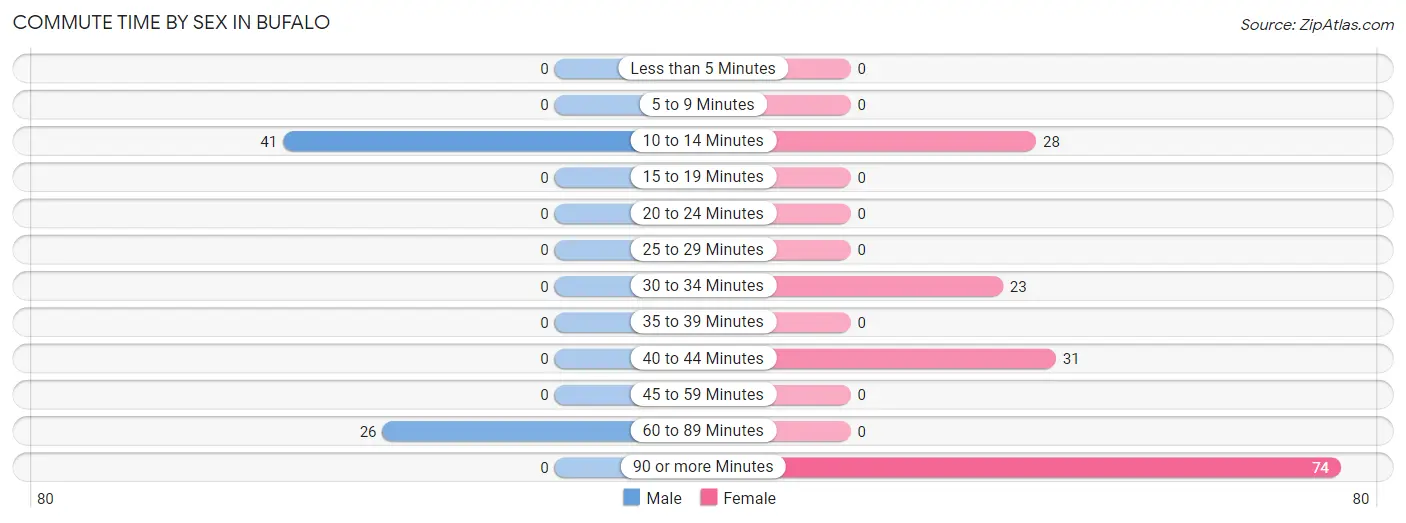
Commute Time by Sex in Bufalo
The most common commute times in Bufalo are 10 to 14 minutes (41 commuters, 61.2%) for males and 90 or more minutes (74 commuters, 47.4%) for females.
| Commute Time | Male | Female |
| Less than 5 Minutes | 0 (0.0%) | 0 (0.0%) |
| 5 to 9 Minutes | 0 (0.0%) | 0 (0.0%) |
| 10 to 14 Minutes | 41 (61.2%) | 28 (17.9%) |
| 15 to 19 Minutes | 0 (0.0%) | 0 (0.0%) |
| 20 to 24 Minutes | 0 (0.0%) | 0 (0.0%) |
| 25 to 29 Minutes | 0 (0.0%) | 0 (0.0%) |
| 30 to 34 Minutes | 0 (0.0%) | 23 (14.7%) |
| 35 to 39 Minutes | 0 (0.0%) | 0 (0.0%) |
| 40 to 44 Minutes | 0 (0.0%) | 31 (19.9%) |
| 45 to 59 Minutes | 0 (0.0%) | 0 (0.0%) |
| 60 to 89 Minutes | 26 (38.8%) | 0 (0.0%) |
| 90 or more Minutes | 0 (0.0%) | 74 (47.4%) |
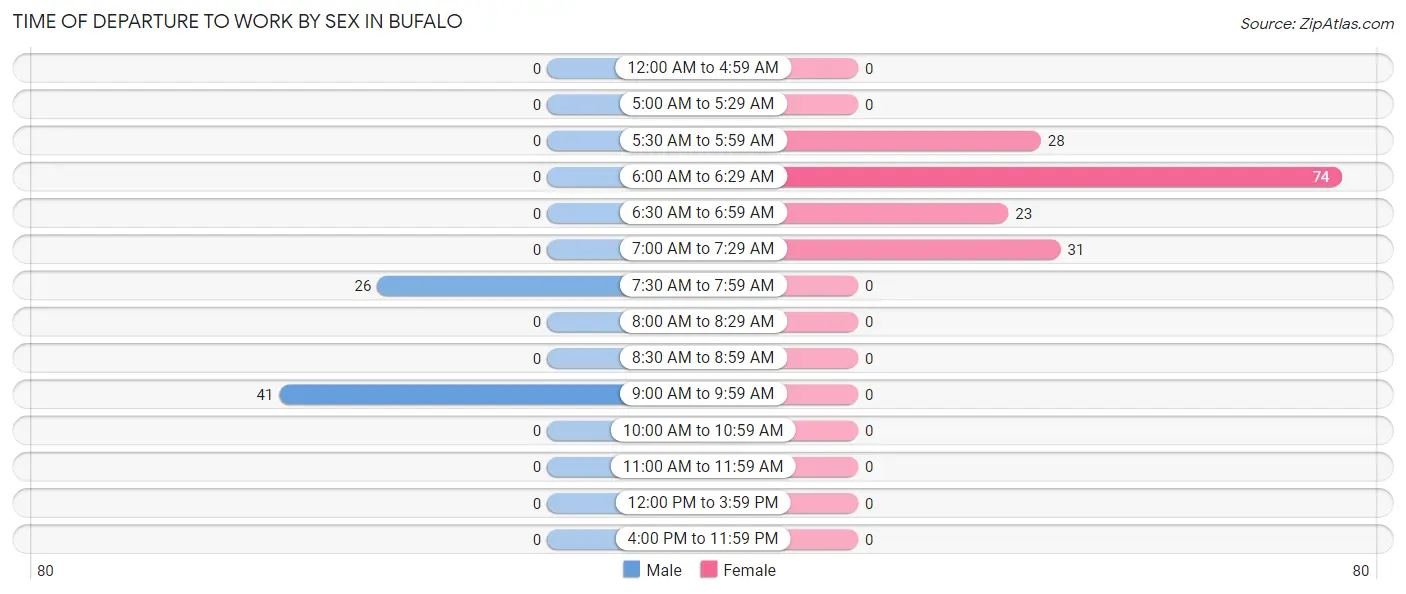
Time of Departure to Work by Sex in Bufalo
The most frequent times of departure to work in Bufalo are 9:00 AM to 9:59 AM (41, 61.2%) for males and 6:00 AM to 6:29 AM (74, 47.4%) for females.
| Time of Departure | Male | Female |
| 12:00 AM to 4:59 AM | 0 (0.0%) | 0 (0.0%) |
| 5:00 AM to 5:29 AM | 0 (0.0%) | 0 (0.0%) |
| 5:30 AM to 5:59 AM | 0 (0.0%) | 28 (17.9%) |
| 6:00 AM to 6:29 AM | 0 (0.0%) | 74 (47.4%) |
| 6:30 AM to 6:59 AM | 0 (0.0%) | 23 (14.7%) |
| 7:00 AM to 7:29 AM | 0 (0.0%) | 31 (19.9%) |
| 7:30 AM to 7:59 AM | 26 (38.8%) | 0 (0.0%) |
| 8:00 AM to 8:29 AM | 0 (0.0%) | 0 (0.0%) |
| 8:30 AM to 8:59 AM | 0 (0.0%) | 0 (0.0%) |
| 9:00 AM to 9:59 AM | 41 (61.2%) | 0 (0.0%) |
| 10:00 AM to 10:59 AM | 0 (0.0%) | 0 (0.0%) |
| 11:00 AM to 11:59 AM | 0 (0.0%) | 0 (0.0%) |
| 12:00 PM to 3:59 PM | 0 (0.0%) | 0 (0.0%) |
| 4:00 PM to 11:59 PM | 0 (0.0%) | 0 (0.0%) |
| Total | 67 (100.0%) | 156 (100.0%) |
Housing Occupancy in Bufalo
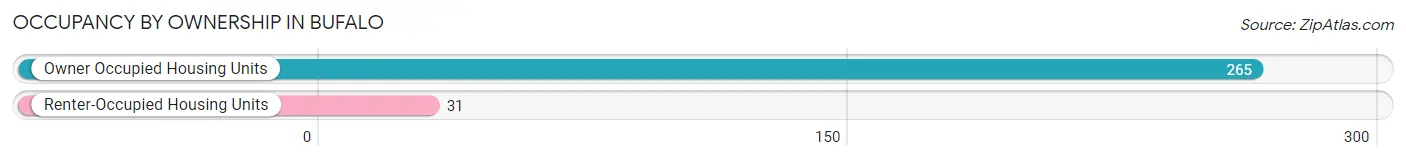
Occupancy by Ownership in Bufalo
Of the total 296 dwellings in Bufalo, owner-occupied units account for 265 (89.5%), while renter-occupied units make up 31 (10.5%).
| Occupancy | # Housing Units | % Housing Units |
| Owner Occupied Housing Units | 265 | 89.5% |
| Renter-Occupied Housing Units | 31 | 10.5% |
| Total Occupied Housing Units | 296 | 100.0% |
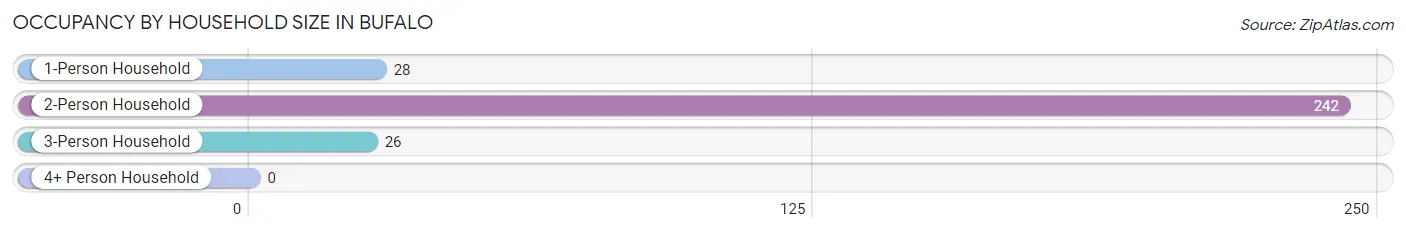
Occupancy by Household Size in Bufalo
| Household Size | # Housing Units | % Housing Units |
| 1-Person Household | 28 | 9.5% |
| 2-Person Household | 242 | 81.8% |
| 3-Person Household | 26 | 8.8% |
| 4+ Person Household | 0 | 0.0% |
| Total Housing Units | 296 | 100.0% |
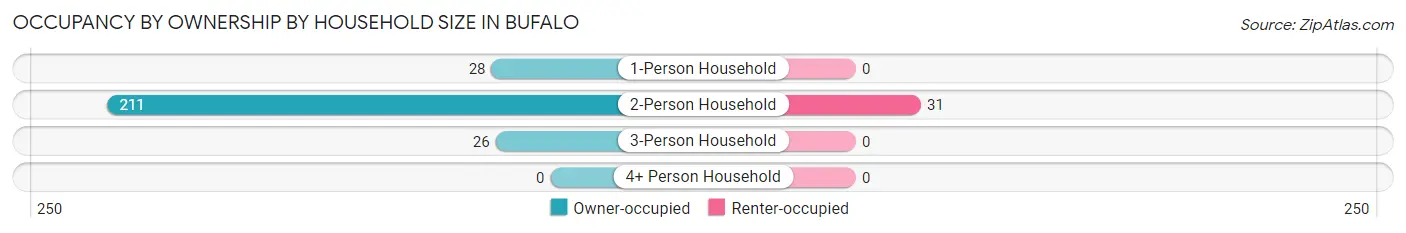
Occupancy by Ownership by Household Size in Bufalo
| Household Size | Owner-occupied | Renter-occupied |
| 1-Person Household | 28 (100.0%) | 0 (0.0%) |
| 2-Person Household | 211 (87.2%) | 31 (12.8%) |
| 3-Person Household | 26 (100.0%) | 0 (0.0%) |
| 4+ Person Household | 0 (0.0%) | 0 (0.0%) |
| Total Housing Units | 265 (89.5%) | 31 (10.5%) |
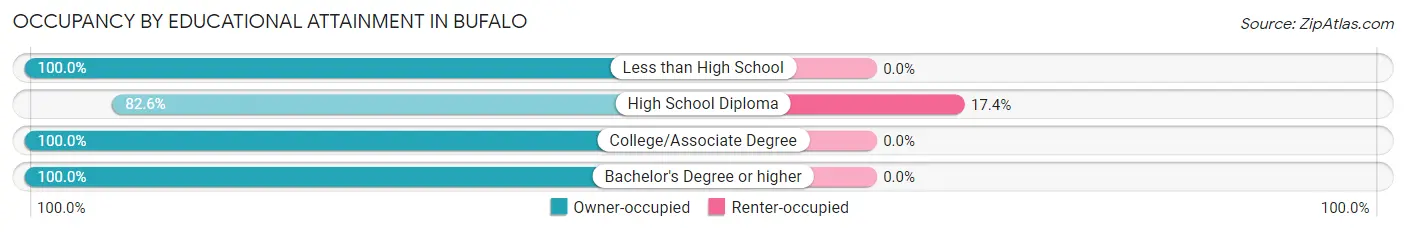
Occupancy by Educational Attainment in Bufalo
| Household Size | Owner-occupied | Renter-occupied |
| Less than High School | 41 (100.0%) | 0 (0.0%) |
| High School Diploma | 147 (82.6%) | 31 (17.4%) |
| College/Associate Degree | 28 (100.0%) | 0 (0.0%) |
| Bachelor's Degree or higher | 49 (100.0%) | 0 (0.0%) |
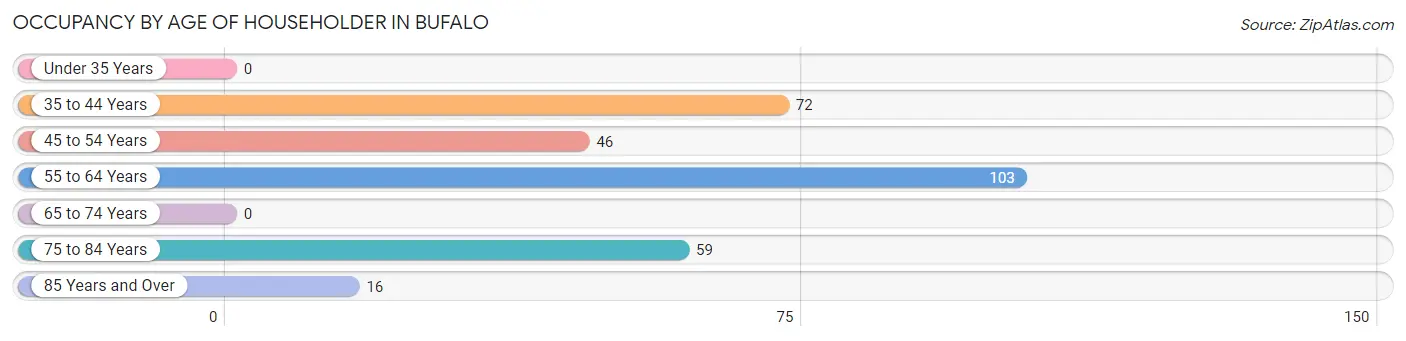
Occupancy by Age of Householder in Bufalo
| Age Bracket | # Households | % Households |
| Under 35 Years | 0 | 0.0% |
| 35 to 44 Years | 72 | 24.3% |
| 45 to 54 Years | 46 | 15.5% |
| 55 to 64 Years | 103 | 34.8% |
| 65 to 74 Years | 0 | 0.0% |
| 75 to 84 Years | 59 | 19.9% |
| 85 Years and Over | 16 | 5.4% |
| Total | 296 | 100.0% |
Housing Finances in Bufalo
Median Income by Occupancy in Bufalo
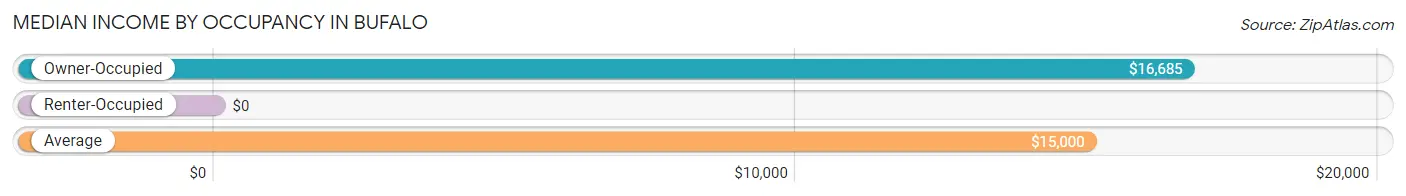
| Occupancy Type | # Households | Median Income |
| Owner-Occupied | 265 (89.5%) | $16,685 |
| Renter-Occupied | 31 (10.5%) | $0 |
| Average | 296 (100.0%) | $15,000 |
Occupancy by Householder Income Bracket in Bufalo
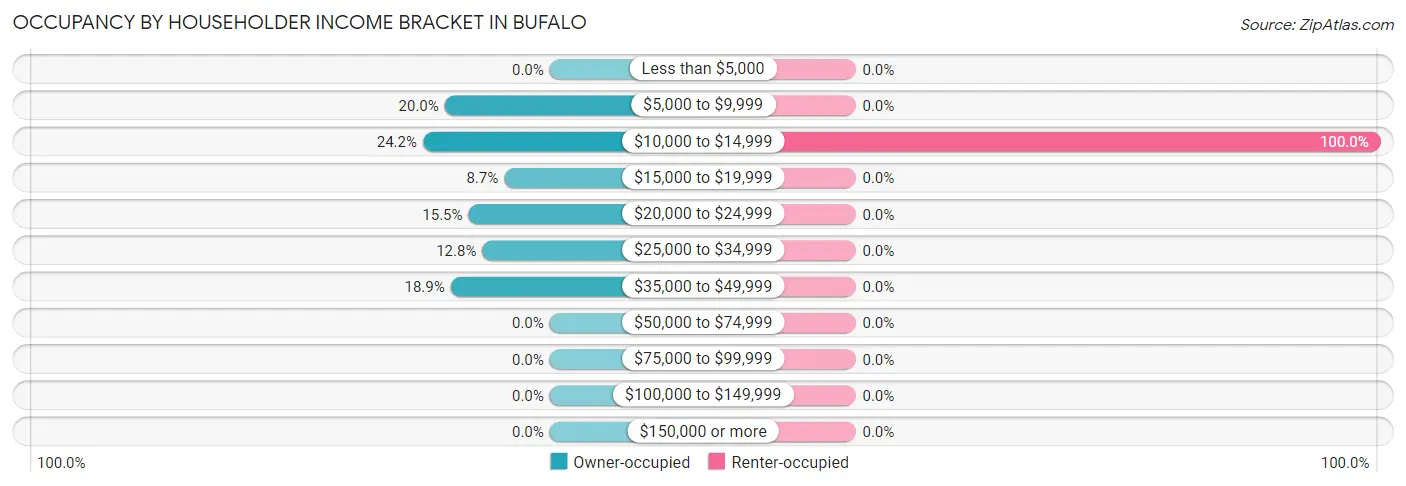
| Income Bracket | Owner-occupied | Renter-occupied |
| Less than $5,000 | 0 (0.0%) | 0 (0.0%) |
| $5,000 to $9,999 | 53 (20.0%) | 0 (0.0%) |
| $10,000 to $14,999 | 64 (24.1%) | 31 (100.0%) |
| $15,000 to $19,999 | 23 (8.7%) | 0 (0.0%) |
| $20,000 to $24,999 | 41 (15.5%) | 0 (0.0%) |
| $25,000 to $34,999 | 34 (12.8%) | 0 (0.0%) |
| $35,000 to $49,999 | 50 (18.9%) | 0 (0.0%) |
| $50,000 to $74,999 | 0 (0.0%) | 0 (0.0%) |
| $75,000 to $99,999 | 0 (0.0%) | 0 (0.0%) |
| $100,000 to $149,999 | 0 (0.0%) | 0 (0.0%) |
| $150,000 or more | 0 (0.0%) | 0 (0.0%) |
| Total | 265 (100.0%) | 31 (100.0%) |
Monthly Housing Cost Tiers in Bufalo
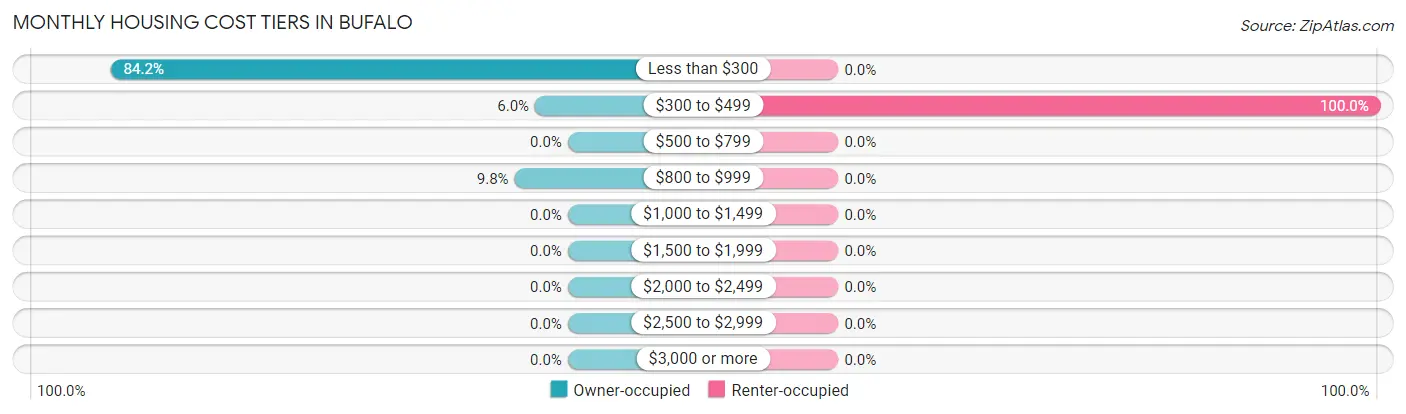
| Monthly Cost | Owner-occupied | Renter-occupied |
| Less than $300 | 223 (84.2%) | 0 (0.0%) |
| $300 to $499 | 16 (6.0%) | 31 (100.0%) |
| $500 to $799 | 0 (0.0%) | 0 (0.0%) |
| $800 to $999 | 26 (9.8%) | 0 (0.0%) |
| $1,000 to $1,499 | 0 (0.0%) | 0 (0.0%) |
| $1,500 to $1,999 | 0 (0.0%) | 0 (0.0%) |
| $2,000 to $2,499 | 0 (0.0%) | 0 (0.0%) |
| $2,500 to $2,999 | 0 (0.0%) | 0 (0.0%) |
| $3,000 or more | 0 (0.0%) | 0 (0.0%) |
| Total | 265 (100.0%) | 31 (100.0%) |
Physical Housing Characteristics in Bufalo
Housing Structures in Bufalo
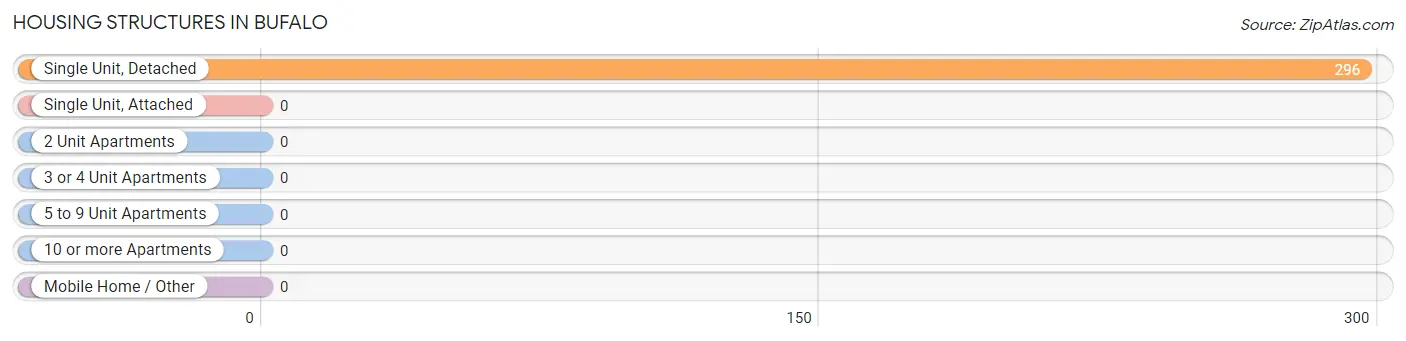
| Structure Type | # Housing Units | % Housing Units |
| Single Unit, Detached | 296 | 100.0% |
| Single Unit, Attached | 0 | 0.0% |
| 2 Unit Apartments | 0 | 0.0% |
| 3 or 4 Unit Apartments | 0 | 0.0% |
| 5 to 9 Unit Apartments | 0 | 0.0% |
| 10 or more Apartments | 0 | 0.0% |
| Mobile Home / Other | 0 | 0.0% |
| Total | 296 | 100.0% |
Housing Structures by Occupancy in Bufalo
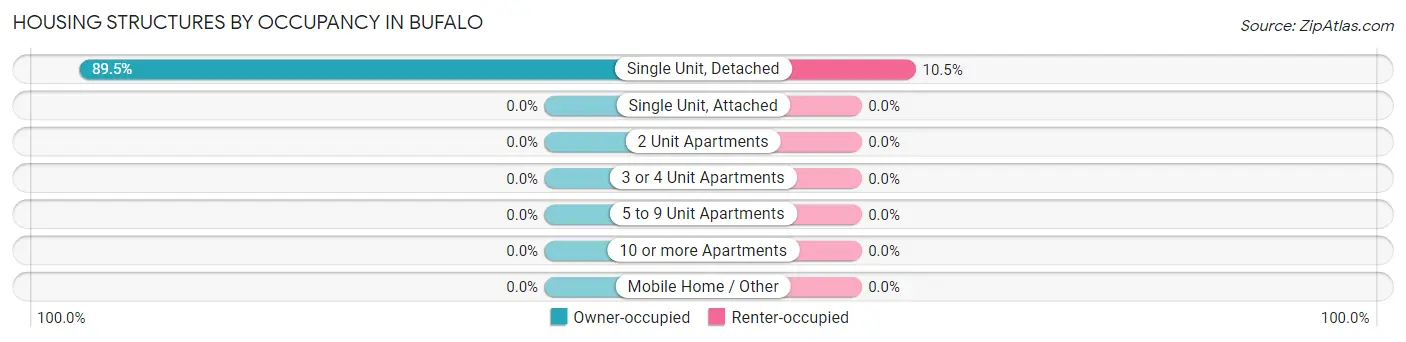
| Structure Type | Owner-occupied | Renter-occupied |
| Single Unit, Detached | 265 (89.5%) | 31 (10.5%) |
| Single Unit, Attached | 0 (0.0%) | 0 (0.0%) |
| 2 Unit Apartments | 0 (0.0%) | 0 (0.0%) |
| 3 or 4 Unit Apartments | 0 (0.0%) | 0 (0.0%) |
| 5 to 9 Unit Apartments | 0 (0.0%) | 0 (0.0%) |
| 10 or more Apartments | 0 (0.0%) | 0 (0.0%) |
| Mobile Home / Other | 0 (0.0%) | 0 (0.0%) |
| Total | 265 (89.5%) | 31 (10.5%) |
Housing Structures by Number of Rooms in Bufalo
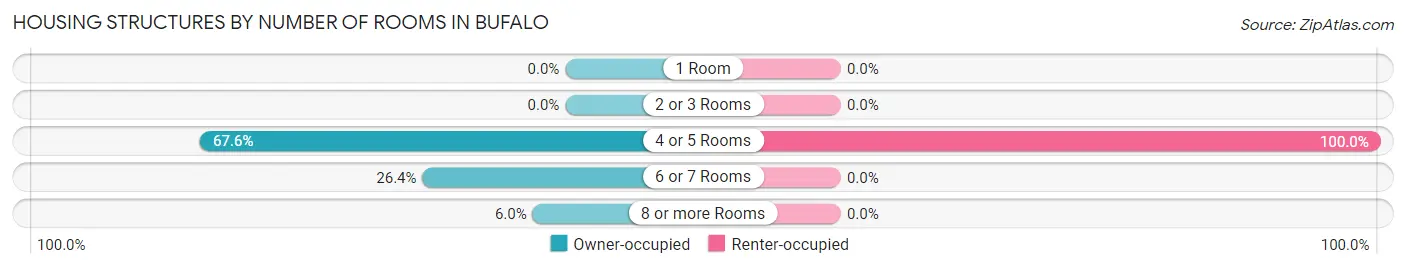
| Number of Rooms | Owner-occupied | Renter-occupied |
| 1 Room | 0 (0.0%) | 0 (0.0%) |
| 2 or 3 Rooms | 0 (0.0%) | 0 (0.0%) |
| 4 or 5 Rooms | 179 (67.5%) | 31 (100.0%) |
| 6 or 7 Rooms | 70 (26.4%) | 0 (0.0%) |
| 8 or more Rooms | 16 (6.0%) | 0 (0.0%) |
| Total | 265 (100.0%) | 31 (100.0%) |
Housing Structure by Heating Type in Bufalo
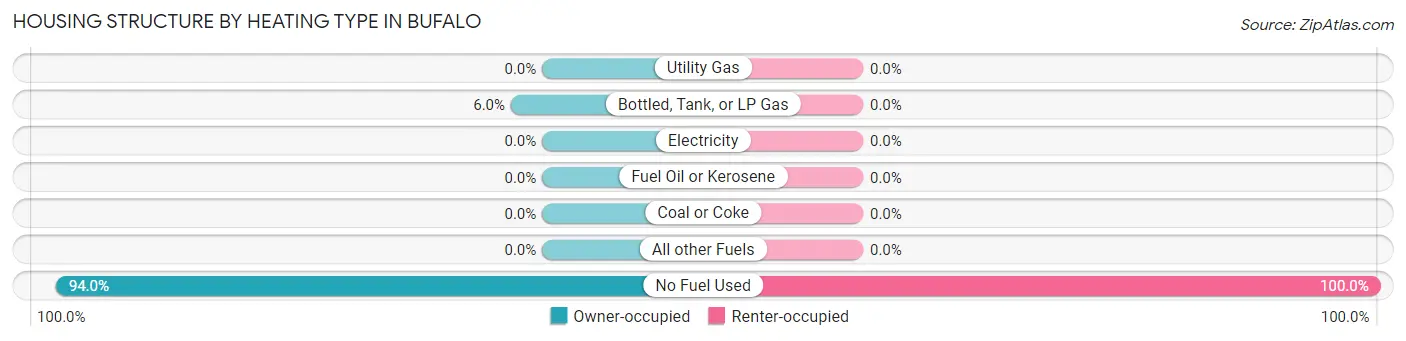
| Heating Type | Owner-occupied | Renter-occupied |
| Utility Gas | 0 (0.0%) | 0 (0.0%) |
| Bottled, Tank, or LP Gas | 16 (6.0%) | 0 (0.0%) |
| Electricity | 0 (0.0%) | 0 (0.0%) |
| Fuel Oil or Kerosene | 0 (0.0%) | 0 (0.0%) |
| Coal or Coke | 0 (0.0%) | 0 (0.0%) |
| All other Fuels | 0 (0.0%) | 0 (0.0%) |
| No Fuel Used | 249 (94.0%) | 31 (100.0%) |
| Total | 265 (100.0%) | 31 (100.0%) |
Household Vehicle Usage in Bufalo
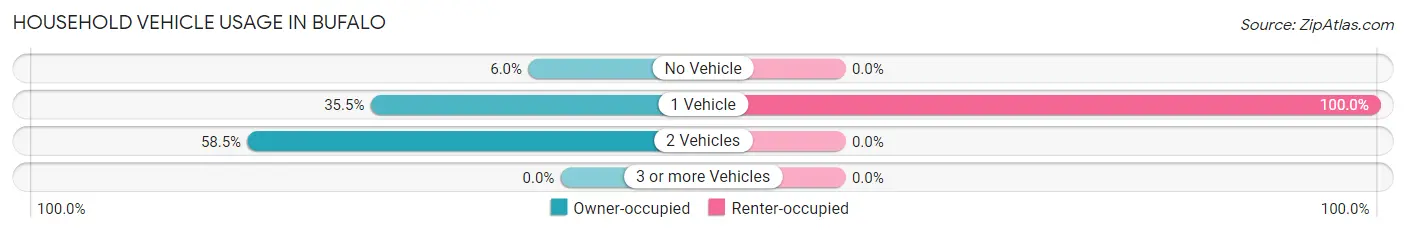
| Vehicles per Household | Owner-occupied | Renter-occupied |
| No Vehicle | 16 (6.0%) | 0 (0.0%) |
| 1 Vehicle | 94 (35.5%) | 31 (100.0%) |
| 2 Vehicles | 155 (58.5%) | 0 (0.0%) |
| 3 or more Vehicles | 0 (0.0%) | 0 (0.0%) |
| Total | 265 (100.0%) | 31 (100.0%) |
Real Estate & Mortgages in Bufalo
Real Estate and Mortgage Overview in Bufalo
| Characteristic | Without Mortgage | With Mortgage |
| Housing Units | 239 | 26 |
| Median Property Value | $100,500 | $0 |
| Median Household Income | $20,335 | $0 |
| Monthly Housing Costs | $131 | $0 |
| Real Estate Taxes | - | - |
Property Value by Mortgage Status in Bufalo
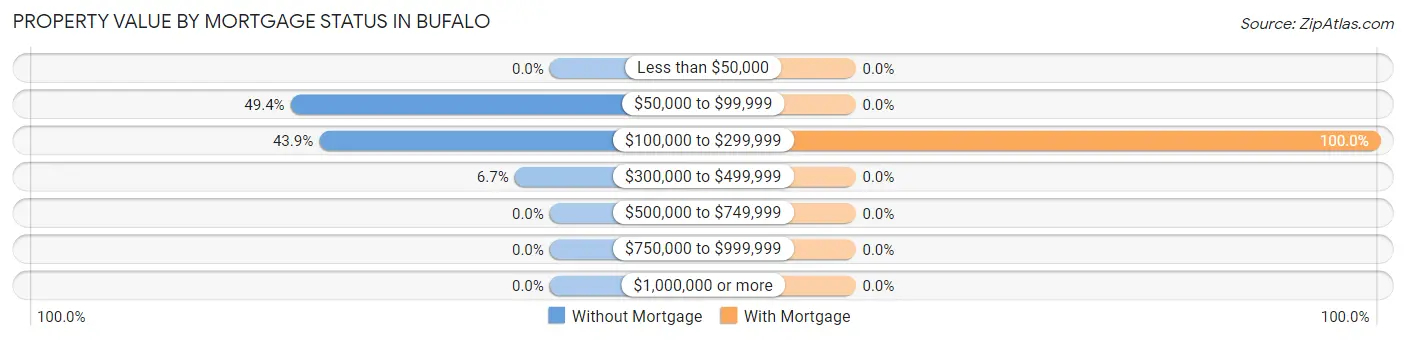
| Property Value | Without Mortgage | With Mortgage |
| Less than $50,000 | 0 (0.0%) | 0 (0.0%) |
| $50,000 to $99,999 | 118 (49.4%) | 0 (0.0%) |
| $100,000 to $299,999 | 105 (43.9%) | 26 (100.0%) |
| $300,000 to $499,999 | 16 (6.7%) | 0 (0.0%) |
| $500,000 to $749,999 | 0 (0.0%) | 0 (0.0%) |
| $750,000 to $999,999 | 0 (0.0%) | 0 (0.0%) |
| $1,000,000 or more | 0 (0.0%) | 0 (0.0%) |
| Total | 239 (100.0%) | 26 (100.0%) |
Household Income by Mortgage Status in Bufalo
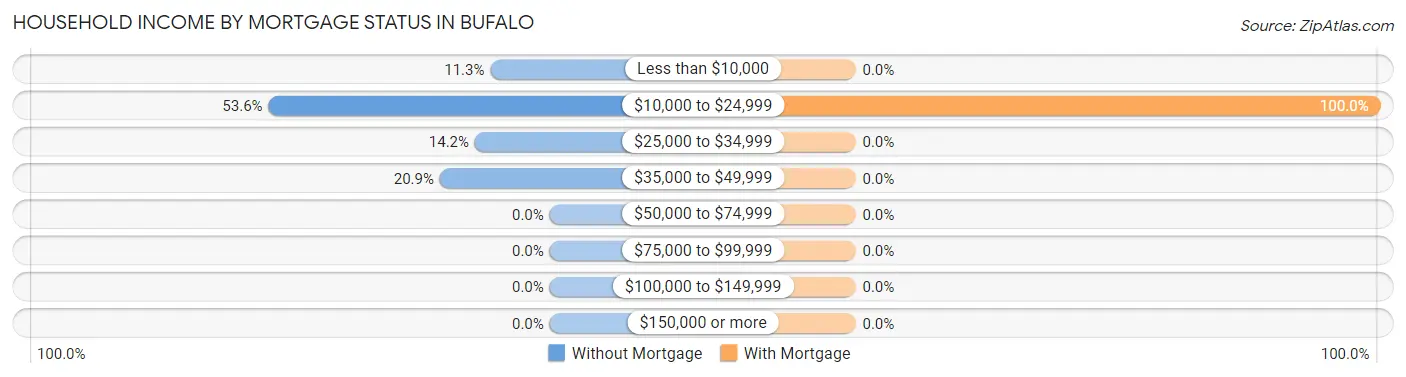
| Household Income | Without Mortgage | With Mortgage |
| Less than $10,000 | 27 (11.3%) | 0 (0.0%) |
| $10,000 to $24,999 | 128 (53.6%) | 26 (100.0%) |
| $25,000 to $34,999 | 34 (14.2%) | 0 (0.0%) |
| $35,000 to $49,999 | 50 (20.9%) | 0 (0.0%) |
| $50,000 to $74,999 | 0 (0.0%) | 0 (0.0%) |
| $75,000 to $99,999 | 0 (0.0%) | 0 (0.0%) |
| $100,000 to $149,999 | 0 (0.0%) | 0 (0.0%) |
| $150,000 or more | 0 (0.0%) | 0 (0.0%) |
| Total | 239 (100.0%) | 26 (100.0%) |
Property Value to Household Income Ratio in Bufalo
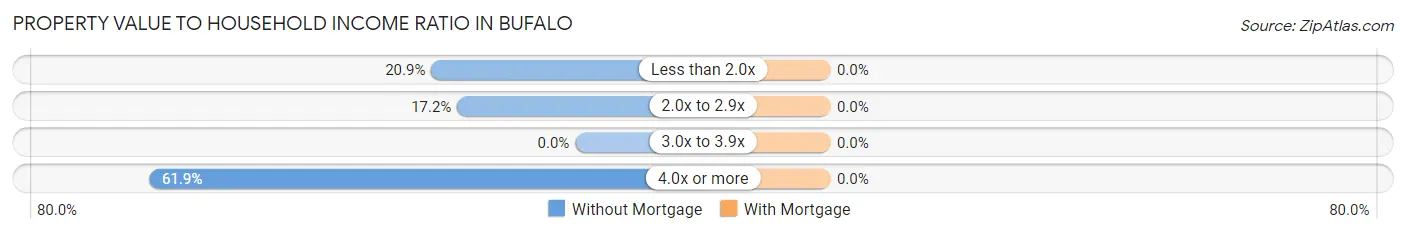
| Value-to-Income Ratio | Without Mortgage | With Mortgage |
| Less than 2.0x | 50 (20.9%) | 0 (0.0%) |
| 2.0x to 2.9x | 41 (17.2%) | 0 (0.0%) |
| 3.0x to 3.9x | 0 (0.0%) | 0 (0.0%) |
| 4.0x or more | 148 (61.9%) | 0 (0.0%) |
| Total | 239 (100.0%) | 26 (100.0%) |
Real Estate Taxes by Mortgage Status in Bufalo
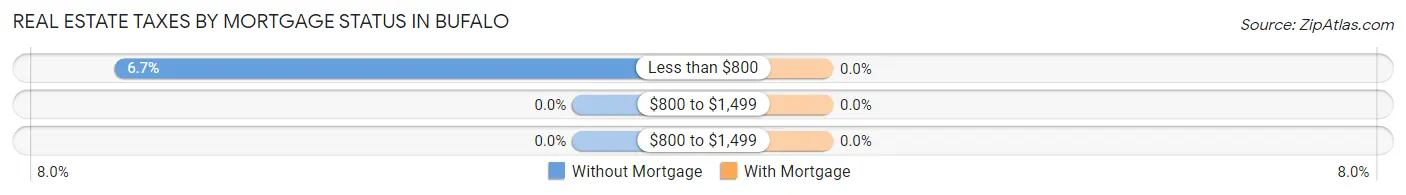
| Property Taxes | Without Mortgage | With Mortgage |
| Less than $800 | 16 (6.7%) | 0 (0.0%) |
| $800 to $1,499 | 0 (0.0%) | 0 (0.0%) |
| $800 to $1,499 | 0 (0.0%) | 0 (0.0%) |
| Total | 239 (100.0%) | 26 (100.0%) |
Health & Disability in Bufalo
Health Insurance Coverage by Age in Bufalo
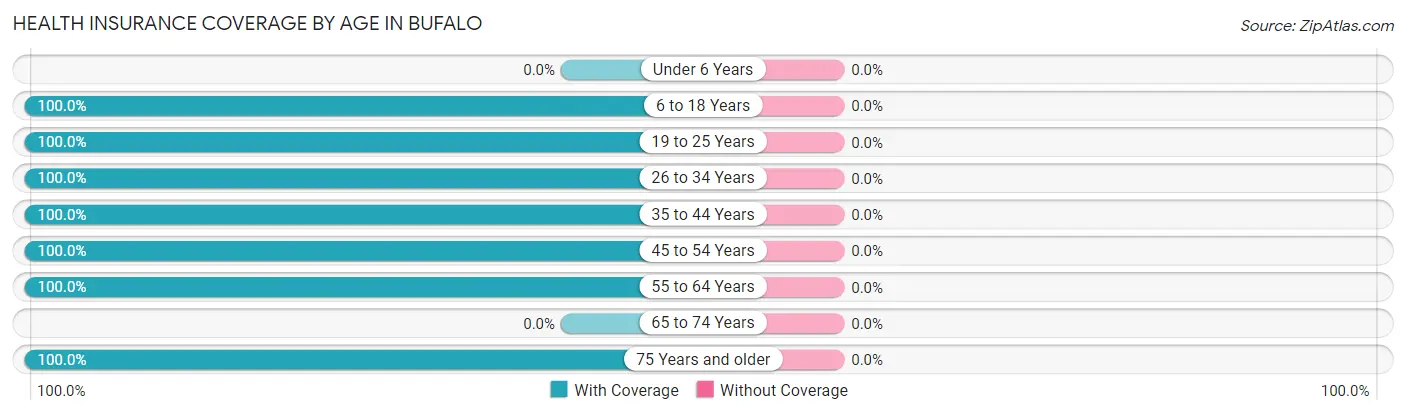
| Age Bracket | With Coverage | Without Coverage |
| Under 6 Years | 0 (0.0%) | 0 (0.0%) |
| 6 to 18 Years | 40 (100.0%) | 0 (0.0%) |
| 19 to 25 Years | 36 (100.0%) | 0 (0.0%) |
| 26 to 34 Years | 55 (100.0%) | 0 (0.0%) |
| 35 to 44 Years | 146 (100.0%) | 0 (0.0%) |
| 45 to 54 Years | 171 (100.0%) | 0 (0.0%) |
| 55 to 64 Years | 135 (100.0%) | 0 (0.0%) |
| 65 to 74 Years | 0 (0.0%) | 0 (0.0%) |
| 75 Years and older | 160 (100.0%) | 0 (0.0%) |
| Total | 743 (100.0%) | 0 (0.0%) |
Health Insurance Coverage by Citizenship Status in Bufalo
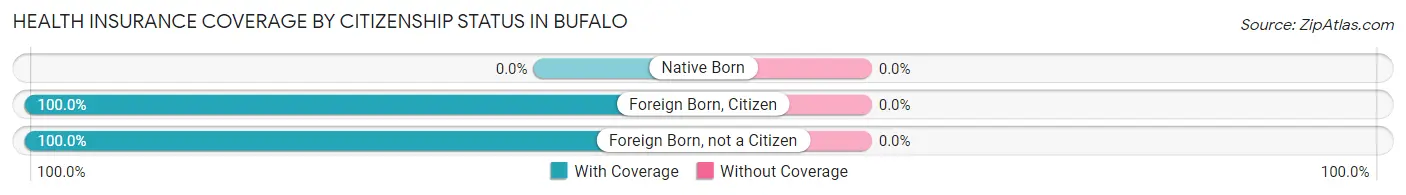
| Citizenship Status | With Coverage | Without Coverage |
| Native Born | 0 (0.0%) | 0 (0.0%) |
| Foreign Born, Citizen | 40 (100.0%) | 0 (0.0%) |
| Foreign Born, not a Citizen | 36 (100.0%) | 0 (0.0%) |
Health Insurance Coverage by Household Income in Bufalo
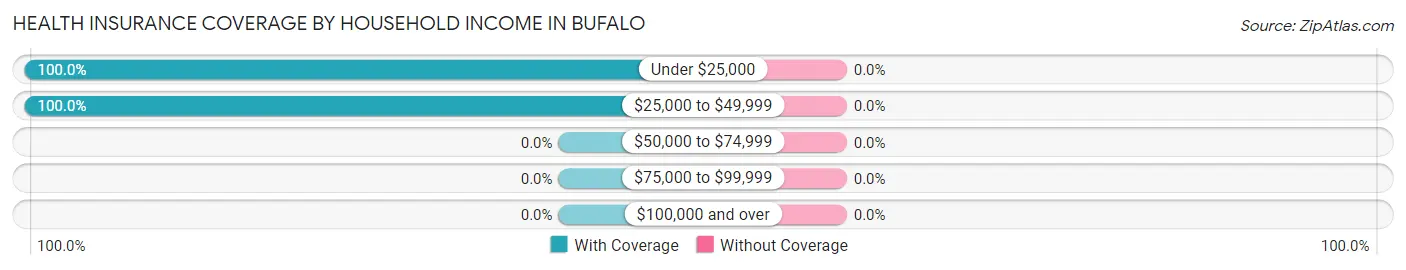
| Household Income | With Coverage | Without Coverage |
| Under $25,000 | 505 (100.0%) | 0 (0.0%) |
| $25,000 to $49,999 | 238 (100.0%) | 0 (0.0%) |
| $50,000 to $74,999 | 0 (0.0%) | 0 (0.0%) |
| $75,000 to $99,999 | 0 (0.0%) | 0 (0.0%) |
| $100,000 and over | 0 (0.0%) | 0 (0.0%) |
Public vs Private Health Insurance Coverage by Age in Bufalo
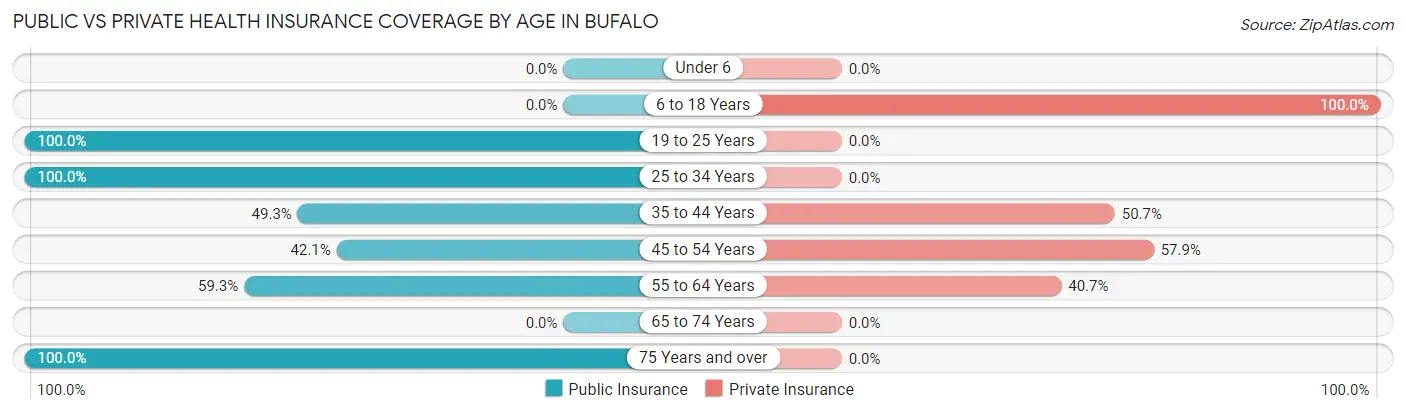
| Age Bracket | Public Insurance | Private Insurance |
| Under 6 | 0 (0.0%) | 0 (0.0%) |
| 6 to 18 Years | 0 (0.0%) | 40 (100.0%) |
| 19 to 25 Years | 36 (100.0%) | 0 (0.0%) |
| 25 to 34 Years | 55 (100.0%) | 0 (0.0%) |
| 35 to 44 Years | 72 (49.3%) | 74 (50.7%) |
| 45 to 54 Years | 72 (42.1%) | 99 (57.9%) |
| 55 to 64 Years | 80 (59.3%) | 55 (40.7%) |
| 65 to 74 Years | 0 (0.0%) | 0 (0.0%) |
| 75 Years and over | 160 (100.0%) | 0 (0.0%) |
| Total | 475 (63.9%) | 268 (36.1%) |
Disability Status by Sex by Age in Bufalo
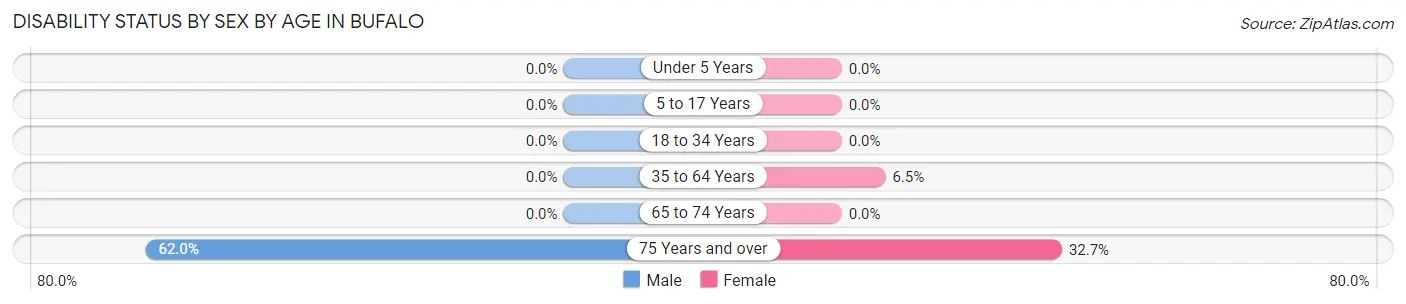
| Age Bracket | Male | Female |
| Under 5 Years | 0 (0.0%) | 0 (0.0%) |
| 5 to 17 Years | 0 (0.0%) | 0 (0.0%) |
| 18 to 34 Years | 0 (0.0%) | 0 (0.0%) |
| 35 to 64 Years | 0 (0.0%) | 20 (6.5%) |
| 65 to 74 Years | 0 (0.0%) | 0 (0.0%) |
| 75 Years and over | 67 (62.0%) | 17 (32.7%) |
Disability Class by Sex by Age in Bufalo
Disability Class: Hearing Difficulty
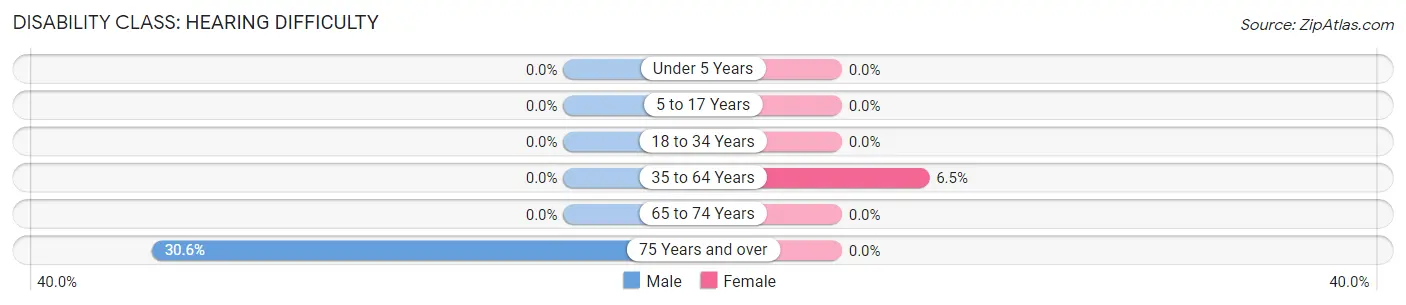
| Age Bracket | Male | Female |
| Under 5 Years | 0 (0.0%) | 0 (0.0%) |
| 5 to 17 Years | 0 (0.0%) | 0 (0.0%) |
| 18 to 34 Years | 0 (0.0%) | 0 (0.0%) |
| 35 to 64 Years | 0 (0.0%) | 20 (6.5%) |
| 65 to 74 Years | 0 (0.0%) | 0 (0.0%) |
| 75 Years and over | 33 (30.6%) | 0 (0.0%) |
Disability Class: Vision Difficulty
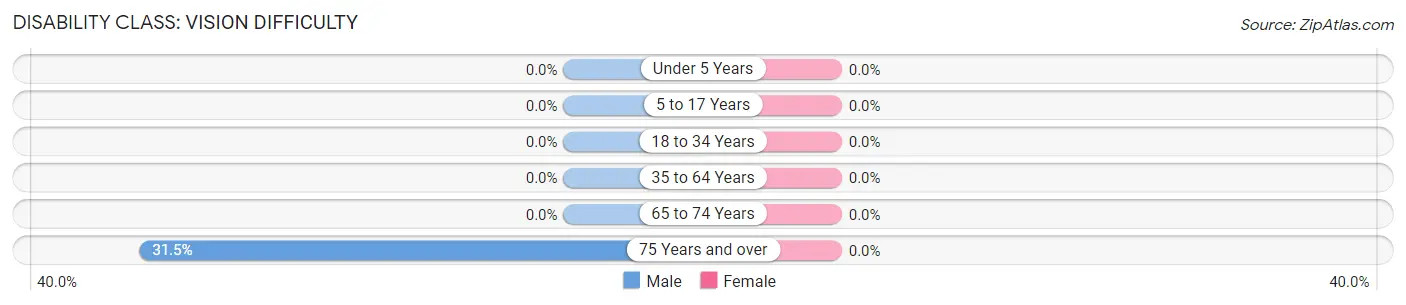
| Age Bracket | Male | Female |
| Under 5 Years | 0 (0.0%) | 0 (0.0%) |
| 5 to 17 Years | 0 (0.0%) | 0 (0.0%) |
| 18 to 34 Years | 0 (0.0%) | 0 (0.0%) |
| 35 to 64 Years | 0 (0.0%) | 0 (0.0%) |
| 65 to 74 Years | 0 (0.0%) | 0 (0.0%) |
| 75 Years and over | 34 (31.5%) | 0 (0.0%) |
Disability Class: Cognitive Difficulty
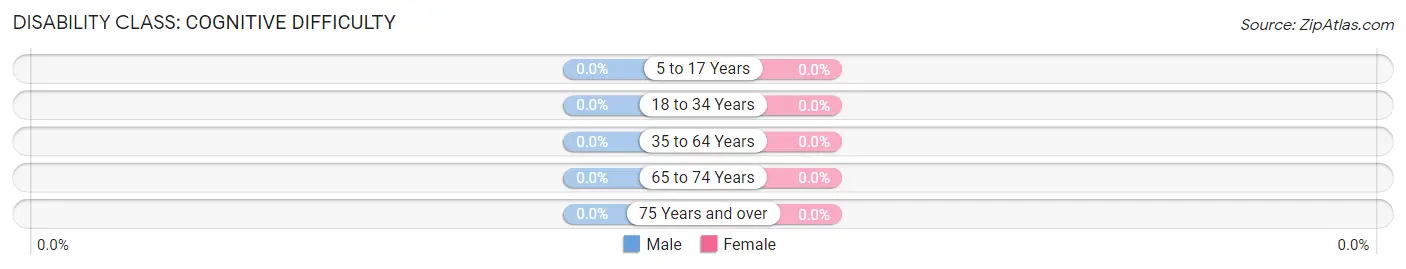
| Age Bracket | Male | Female |
| 5 to 17 Years | 0 (0.0%) | 0 (0.0%) |
| 18 to 34 Years | 0 (0.0%) | 0 (0.0%) |
| 35 to 64 Years | 0 (0.0%) | 0 (0.0%) |
| 65 to 74 Years | 0 (0.0%) | 0 (0.0%) |
| 75 Years and over | 0 (0.0%) | 0 (0.0%) |
Disability Class: Ambulatory Difficulty

| Age Bracket | Male | Female |
| 5 to 17 Years | 0 (0.0%) | 0 (0.0%) |
| 18 to 34 Years | 0 (0.0%) | 0 (0.0%) |
| 35 to 64 Years | 0 (0.0%) | 0 (0.0%) |
| 65 to 74 Years | 0 (0.0%) | 0 (0.0%) |
| 75 Years and over | 0 (0.0%) | 17 (32.7%) |
Disability Class: Self-Care Difficulty
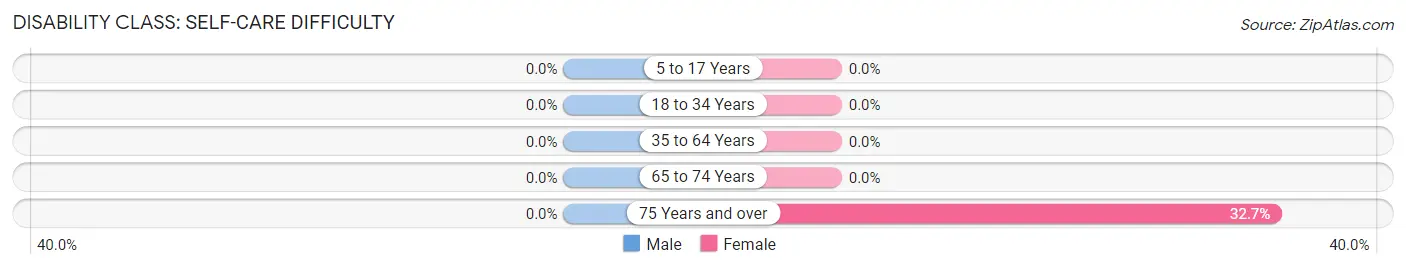
| Age Bracket | Male | Female |
| 5 to 17 Years | 0 (0.0%) | 0 (0.0%) |
| 18 to 34 Years | 0 (0.0%) | 0 (0.0%) |
| 35 to 64 Years | 0 (0.0%) | 0 (0.0%) |
| 65 to 74 Years | 0 (0.0%) | 0 (0.0%) |
| 75 Years and over | 0 (0.0%) | 17 (32.7%) |
Technology Access in Bufalo
Computing Device Access in Bufalo
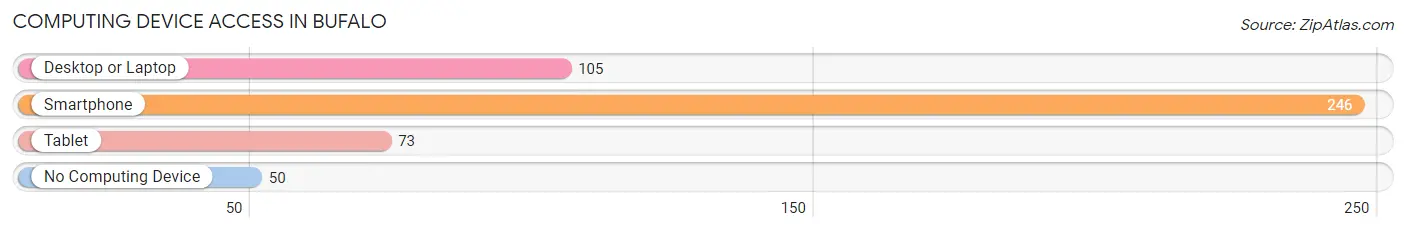
| Device Type | # Households | % Households |
| Desktop or Laptop | 105 | 35.5% |
| Smartphone | 246 | 83.1% |
| Tablet | 73 | 24.7% |
| No Computing Device | 50 | 16.9% |
| Total | 296 | 100.0% |
Internet Access in Bufalo
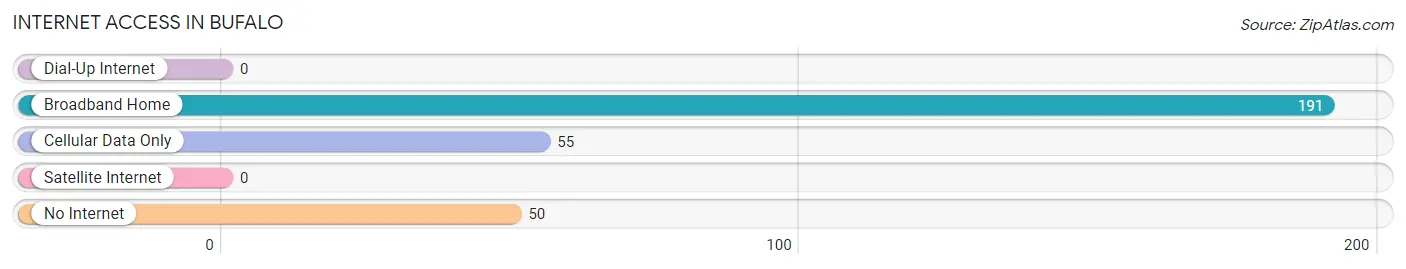
| Internet Type | # Households | % Households |
| Dial-Up Internet | 0 | 0.0% |
| Broadband Home | 191 | 64.5% |
| Cellular Data Only | 55 | 18.6% |
| Satellite Internet | 0 | 0.0% |
| No Internet | 50 | 16.9% |
| Total | 296 | 100.0% |
Bufalo Summary
Bufalo, Puerto Rico is a small municipality located in the northern region of the island of Puerto Rico. It is part of the San Juan-Caguas-Guaynabo Metropolitan Statistical Area. The population of Bufalo was 5,845 in the 2010 census.
Geography
Bufalo is located in the northern region of Puerto Rico, in the northern part of the San Juan-Caguas-Guaynabo Metropolitan Statistical Area. It is bordered by the municipalities of Toa Alta, Toa Baja, Dorado, and San Juan. The municipality is located in the northern part of the island, and is part of the northern coastal plain. The terrain is mostly flat, with some hills in the northern part of the municipality. The highest point is Cerro de la Cruz, which is located in the northern part of the municipality and has an elevation of 590 feet (180 meters). The climate is tropical, with an average temperature of 79°F (26°C).
Economy
The economy of Bufalo is largely based on agriculture and tourism. The main agricultural products are sugarcane, coffee, and fruits. The municipality is also home to several small businesses, including restaurants, hotels, and retail stores. Tourism is an important part of the economy, as the municipality is home to several popular beaches, such as Playa de Bufalo and Playa de la Cruz.
Demographics
As of the 2010 census, the population of Bufalo was 5,845. The population is mostly of Hispanic origin, with a small percentage of African-American and other ethnicities. The median age is 37.5 years, and the median household income is $17,845. The unemployment rate is 11.2%, which is higher than the national average.
Education
Bufalo is served by the Puerto Rico Department of Education. There are several public schools in the municipality, including Escuela Bufalo, Escuela de la Cruz, and Escuela de la Playa. There are also several private schools, such as Colegio San Antonio de Padua and Colegio San Juan Bautista.
Conclusion
Bufalo, Puerto Rico is a small municipality located in the northern region of the island of Puerto Rico. It is part of the San Juan-Caguas-Guaynabo Metropolitan Statistical Area. The economy of Bufalo is largely based on agriculture and tourism, and the population is mostly of Hispanic origin. The municipality is served by the Puerto Rico Department of Education, and there are several public and private schools in the area.
Common Questions
What is Per Capita Income in Bufalo?
Per Capita income in Bufalo is $12,047.
What is the Median Family Income in Bufalo?
Median Family Income in Bufalo is $20,061.
What is the Median Household income in Bufalo?
Median Household Income in Bufalo is $15,000.
What is Inequality or Gini Index in Bufalo?
Inequality or Gini Index in Bufalo is 0.32.
What is the Total Population of Bufalo?
Total Population of Bufalo is 747.
What is the Total Male Population of Bufalo?
Total Male Population of Bufalo is 384.
What is the Total Female Population of Bufalo?
Total Female Population of Bufalo is 363.
What is the Ratio of Males per 100 Females in Bufalo?
There are 105.79 Males per 100 Females in Bufalo.
What is the Ratio of Females per 100 Males in Bufalo?
There are 94.53 Females per 100 Males in Bufalo.
What is the Median Population Age in Bufalo?
Median Population Age in Bufalo is 48.9 Years.
What is the Average Family Size in Bufalo
Average Family Size in Bufalo is 2.7 People.
What is the Average Household Size in Bufalo
Average Household Size in Bufalo is 2.5 People.
How Large is the Labor Force in Bufalo?
There are 346 People in the Labor Forcein in Bufalo.
What is the Percentage of People in the Labor Force in Bufalo?
48.9% of People are in the Labor Force in Bufalo.
What is the Unemployment Rate in Bufalo?
Unemployment Rate in Bufalo is 26.3%.