Jayuya, PR Map & Demographics
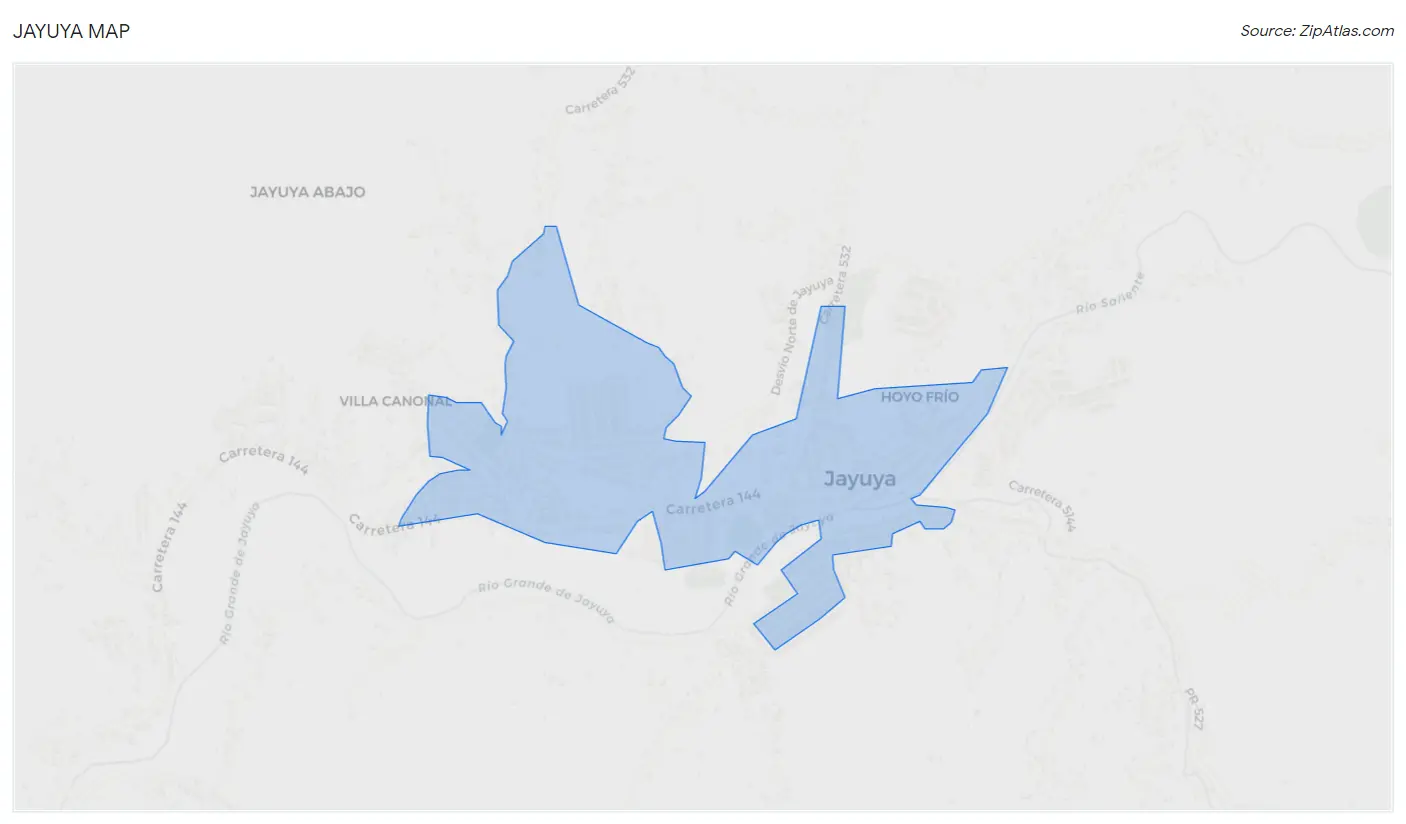
Jayuya Map
Jayuya Overview
$8,699
PER CAPITA INCOME
$19,010
AVG FAMILY INCOME
$17,689
AVG HOUSEHOLD INCOME
9.4%
WAGE / INCOME GAP [ % ]
90.6¢/ $1
WAGE / INCOME GAP [ $ ]
$11,686
FAMILY INCOME DEFICIT
0.48
INEQUALITY / GINI INDEX
2,879
TOTAL POPULATION
1,423
MALE POPULATION
1,456
FEMALE POPULATION
97.73
MALES / 100 FEMALES
102.32
FEMALES / 100 MALES
39.0
MEDIAN AGE
3.5
AVG FAMILY SIZE
2.8
AVG HOUSEHOLD SIZE
939
LABOR FORCE [ PEOPLE ]
40.2%
PERCENT IN LABOR FORCE
31.3%
UNEMPLOYMENT RATE
Jayuya Zip Codes
Jayuya Area Codes
Income in Jayuya
Income Overview in Jayuya
Per Capita Income in Jayuya is $8,699, while median incomes of families and households are $19,010 and $17,689 respectively.
| Characteristic | Number | Measure |
| Per Capita Income | 2,879 | $8,699 |
| Median Family Income | 659 | $19,010 |
| Mean Family Income | 659 | $23,934 |
| Median Household Income | 1,040 | $17,689 |
| Mean Household Income | 1,040 | $21,671 |
| Income Deficit | 659 | $11,686 |
| Wage / Income Gap (%) | 2,879 | 9.39% |
| Wage / Income Gap ($) | 2,879 | 90.61¢ per $1 |
| Gini / Inequality Index | 2,879 | 0.48 |
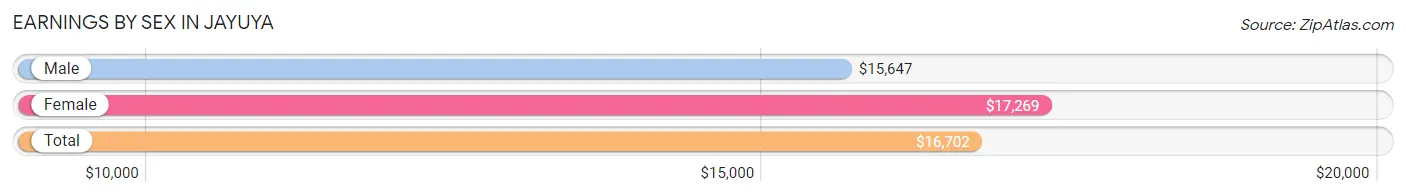
Earnings by Sex in Jayuya
Average Earnings in Jayuya are $16,702, $15,647 for men and $17,269 for women, a difference of 9.4%.
| Sex | Number | Average Earnings |
| Male | 521 (67.2%) | $15,647 |
| Female | 254 (32.8%) | $17,269 |
| Total | 775 (100.0%) | $16,702 |
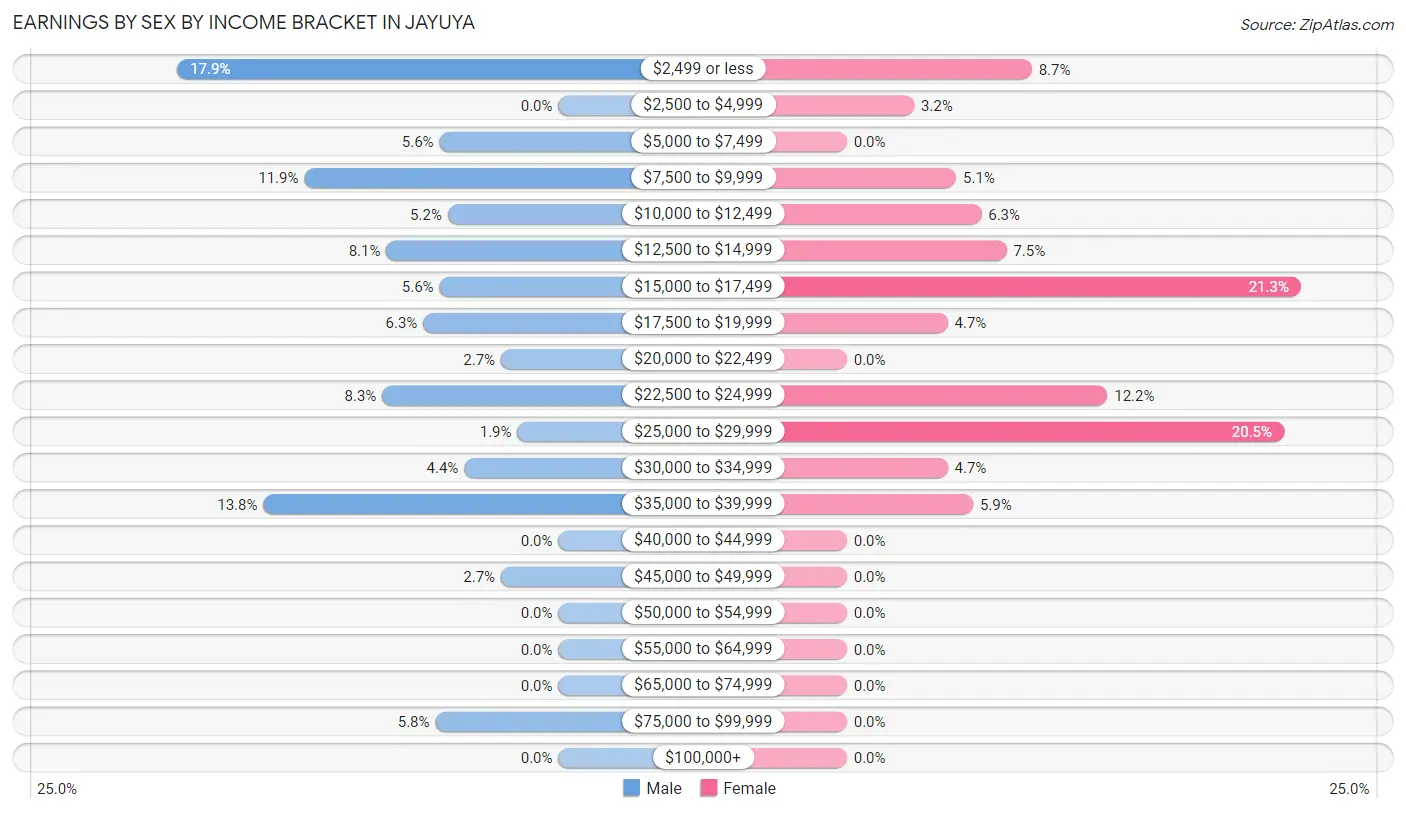
Earnings by Sex by Income Bracket in Jayuya
The most common earnings brackets in Jayuya are $2,499 or less for men (93 | 17.8%) and $15,000 to $17,499 for women (54 | 21.3%).
| Income | Male | Female |
| $2,499 or less | 93 (17.8%) | 22 (8.7%) |
| $2,500 to $4,999 | 0 (0.0%) | 8 (3.2%) |
| $5,000 to $7,499 | 29 (5.6%) | 0 (0.0%) |
| $7,500 to $9,999 | 62 (11.9%) | 13 (5.1%) |
| $10,000 to $12,499 | 27 (5.2%) | 16 (6.3%) |
| $12,500 to $14,999 | 42 (8.1%) | 19 (7.5%) |
| $15,000 to $17,499 | 29 (5.6%) | 54 (21.3%) |
| $17,500 to $19,999 | 33 (6.3%) | 12 (4.7%) |
| $20,000 to $22,499 | 14 (2.7%) | 0 (0.0%) |
| $22,500 to $24,999 | 43 (8.3%) | 31 (12.2%) |
| $25,000 to $29,999 | 10 (1.9%) | 52 (20.5%) |
| $30,000 to $34,999 | 23 (4.4%) | 12 (4.7%) |
| $35,000 to $39,999 | 72 (13.8%) | 15 (5.9%) |
| $40,000 to $44,999 | 0 (0.0%) | 0 (0.0%) |
| $45,000 to $49,999 | 14 (2.7%) | 0 (0.0%) |
| $50,000 to $54,999 | 0 (0.0%) | 0 (0.0%) |
| $55,000 to $64,999 | 0 (0.0%) | 0 (0.0%) |
| $65,000 to $74,999 | 0 (0.0%) | 0 (0.0%) |
| $75,000 to $99,999 | 30 (5.8%) | 0 (0.0%) |
| $100,000+ | 0 (0.0%) | 0 (0.0%) |
| Total | 521 (100.0%) | 254 (100.0%) |
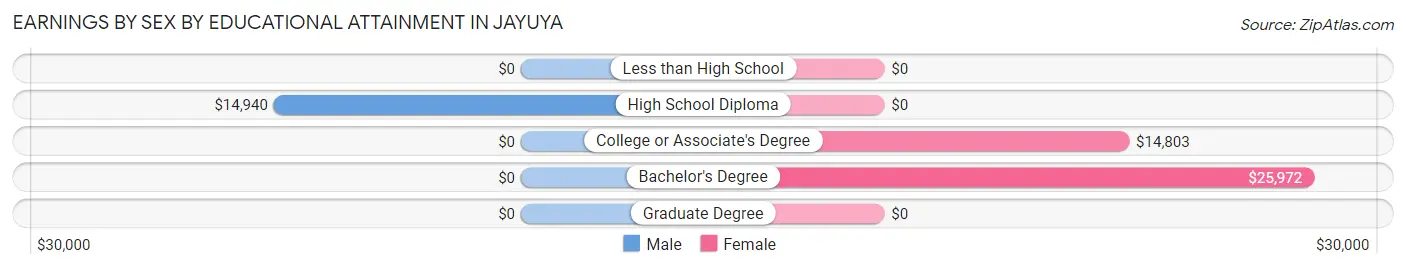
Earnings by Sex by Educational Attainment in Jayuya
Average earnings in Jayuya are $18,712 for men and $17,269 for women, a difference of 7.7%. Men with an educational attainment of high school diploma enjoy the highest average annual earnings of $14,940, while those with high school diploma education earn the least with $14,940. Women with an educational attainment of bachelor's degree earn the most with the average annual earnings of $25,972, while those with college or associate's degree education have the smallest earnings of $14,803.
| Educational Attainment | Male Income | Female Income |
| Less than High School | - | - |
| High School Diploma | $14,940 | $0 |
| College or Associate's Degree | - | - |
| Bachelor's Degree | - | - |
| Graduate Degree | - | - |
| Total | $18,712 | $17,269 |
Family Income in Jayuya
Family Income Brackets in Jayuya
According to the Jayuya family income data, there are 163 families falling into the $15,000 to $24,999 income range, which is the most common income bracket and makes up 24.7% of all families.
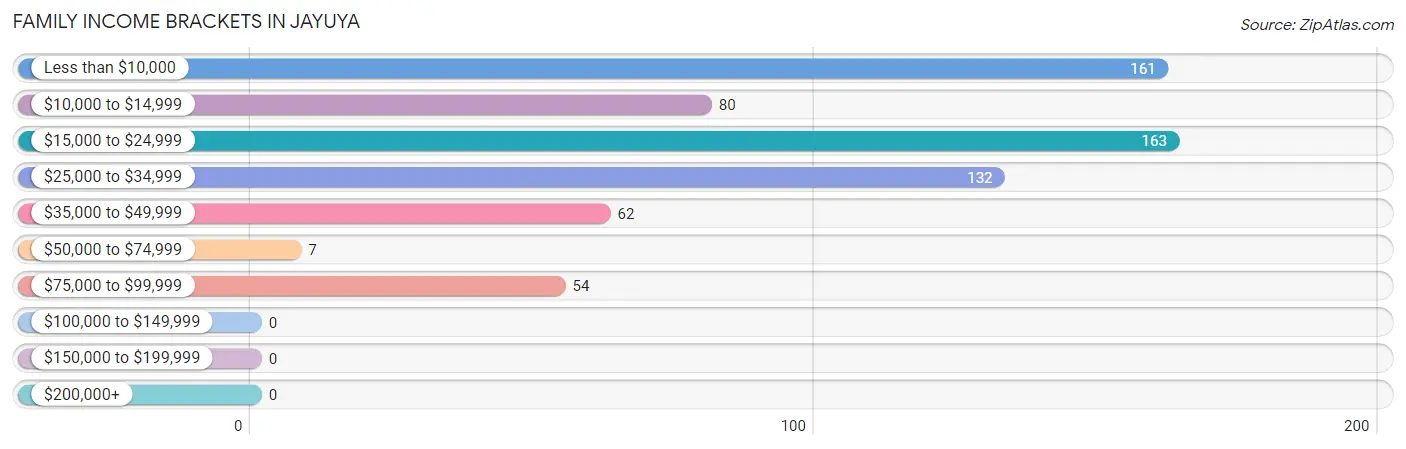
| Income Bracket | # Families | % Families |
| Less than $10,000 | 161 | 24.4% |
| $10,000 to $14,999 | 80 | 12.1% |
| $15,000 to $24,999 | 163 | 24.7% |
| $25,000 to $34,999 | 132 | 20.0% |
| $35,000 to $49,999 | 62 | 9.4% |
| $50,000 to $74,999 | 7 | 1.1% |
| $75,000 to $99,999 | 54 | 8.2% |
| $100,000 to $149,999 | 0 | 0.0% |
| $150,000 to $199,999 | 0 | 0.0% |
| $200,000+ | 0 | 0.0% |
Family Income by Famaliy Size in Jayuya
4-person families (119 | 18.1%) account for the highest median family income in Jayuya with $24,450 per family, while 2-person families (303 | 46.0%) have the highest median income of $9,294 per family member.
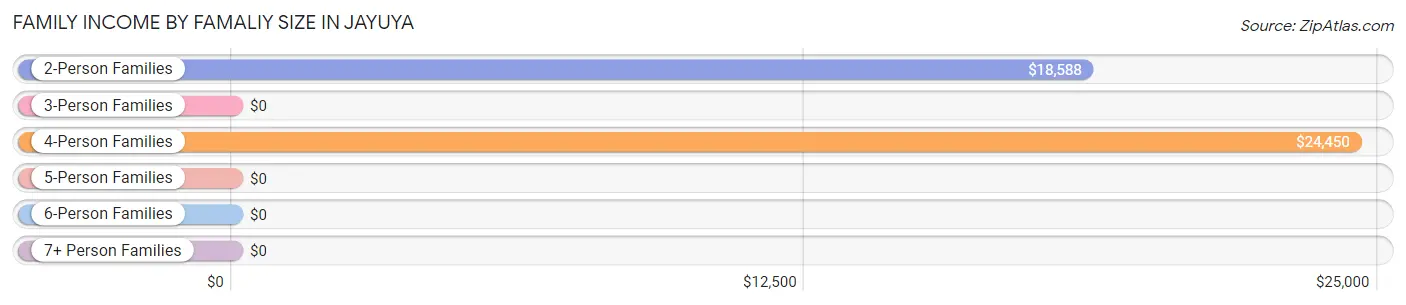
| Income Bracket | # Families | Median Income |
| 2-Person Families | 303 (46.0%) | $18,588 |
| 3-Person Families | 181 (27.5%) | $0 |
| 4-Person Families | 119 (18.1%) | $24,450 |
| 5-Person Families | 56 (8.5%) | $0 |
| 6-Person Families | 0 (0.0%) | $0 |
| 7+ Person Families | 0 (0.0%) | $0 |
| Total | 659 (100.0%) | $19,010 |
Family Income by Number of Earners in Jayuya
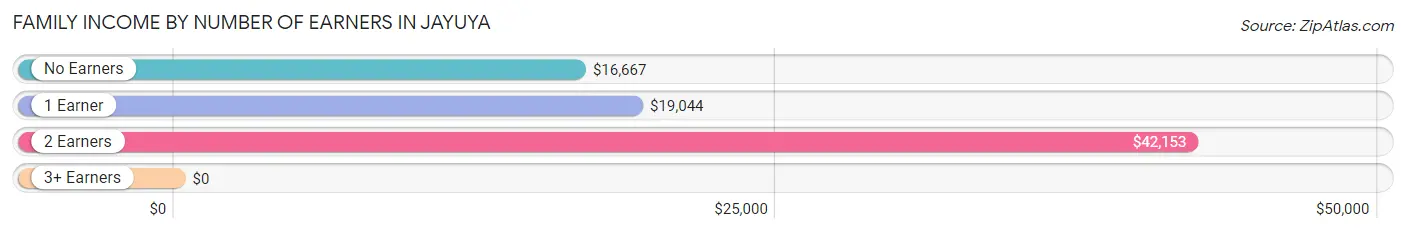
| Number of Earners | # Families | Median Income |
| No Earners | 296 (44.9%) | $16,667 |
| 1 Earner | 308 (46.7%) | $19,044 |
| 2 Earners | 43 (6.5%) | $42,153 |
| 3+ Earners | 12 (1.8%) | $0 |
| Total | 659 (100.0%) | $19,010 |
Household Income in Jayuya
Household Income Brackets in Jayuya
With 305 households falling in the category, the less than $10,000 income range is the most frequent in Jayuya, accounting for 29.3% of all households.
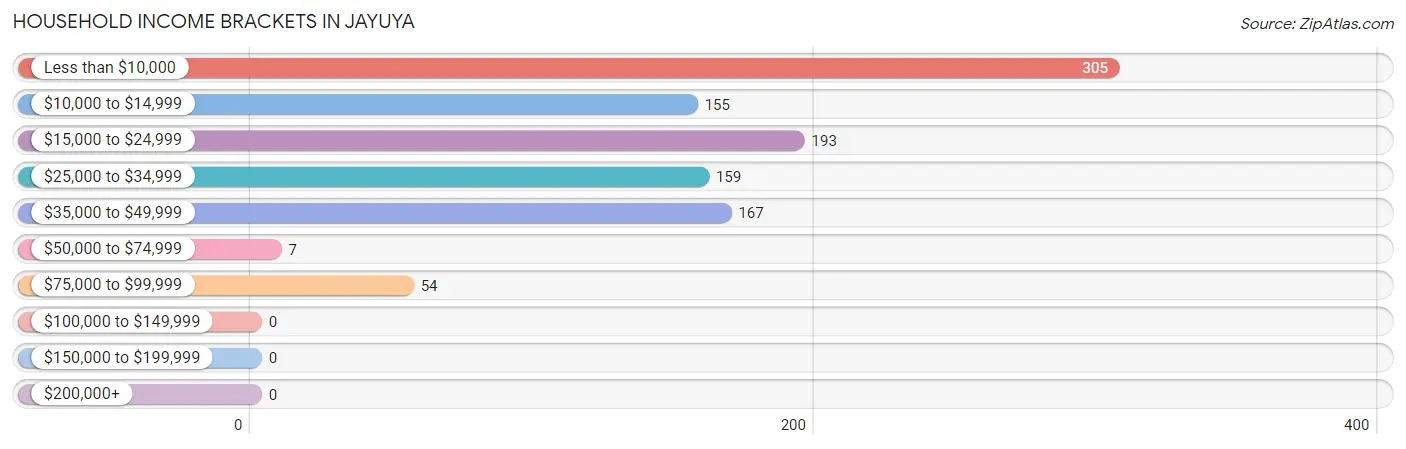
| Income Bracket | # Households | % Households |
| Less than $10,000 | 305 | 29.3% |
| $10,000 to $14,999 | 155 | 14.9% |
| $15,000 to $24,999 | 193 | 18.6% |
| $25,000 to $34,999 | 159 | 15.3% |
| $35,000 to $49,999 | 167 | 16.1% |
| $50,000 to $74,999 | 7 | 0.7% |
| $75,000 to $99,999 | 54 | 5.2% |
| $100,000 to $149,999 | 0 | 0.0% |
| $150,000 to $199,999 | 0 | 0.0% |
| $200,000+ | 0 | 0.0% |
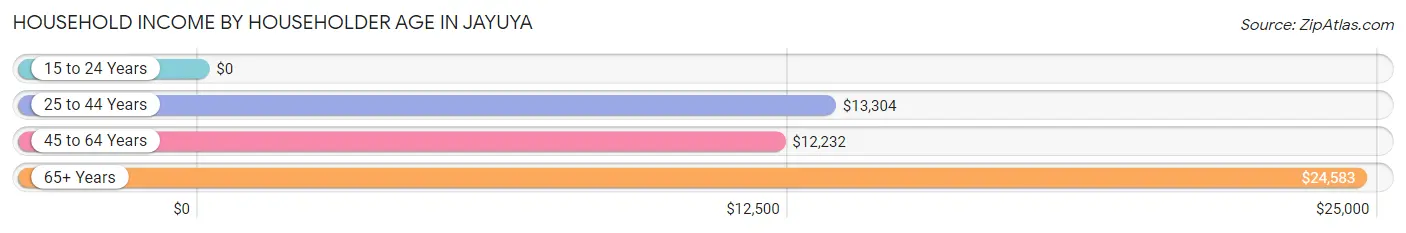
Household Income by Householder Age in Jayuya
The median household income in Jayuya is $17,689, with the highest median household income of $24,583 found in the 65+ years age bracket for the primary householder. A total of 361 households (34.7%) fall into this category. Meanwhile, the 15 to 24 years age bracket for the primary householder has the lowest median household income of $0, with 10 households (1.0%) in this group.
| Income Bracket | # Households | Median Income |
| 15 to 24 Years | 10 (1.0%) | $0 |
| 25 to 44 Years | 254 (24.4%) | $13,304 |
| 45 to 64 Years | 415 (39.9%) | $12,232 |
| 65+ Years | 361 (34.7%) | $24,583 |
| Total | 1,040 (100.0%) | $17,689 |
Poverty in Jayuya
Income Below Poverty by Sex and Age in Jayuya
With 58.6% poverty level for males and 51.9% for females among the residents of Jayuya, 5 year old males and 18 to 24 year old females are the most vulnerable to poverty, with 15 males (100.0%) and 62 females (100.0%) in their respective age groups living below the poverty level.
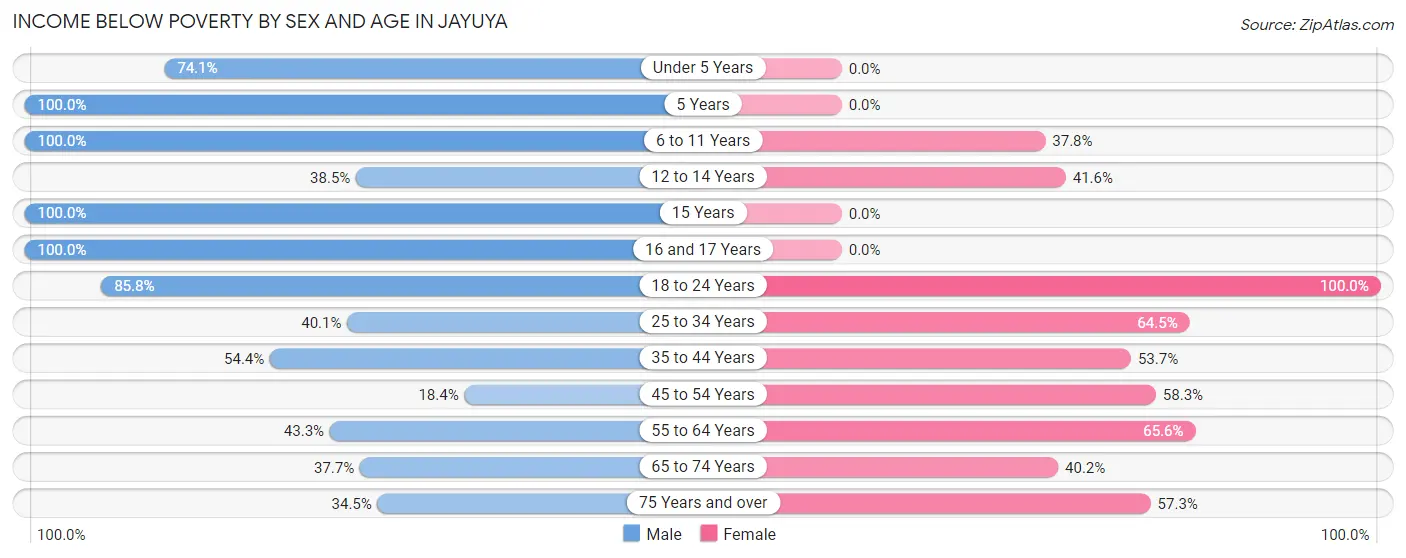
| Age Bracket | Male | Female |
| Under 5 Years | 40 (74.1%) | 0 (0.0%) |
| 5 Years | 15 (100.0%) | 0 (0.0%) |
| 6 to 11 Years | 94 (100.0%) | 34 (37.8%) |
| 12 to 14 Years | 20 (38.5%) | 42 (41.6%) |
| 15 Years | 33 (100.0%) | 0 (0.0%) |
| 16 and 17 Years | 65 (100.0%) | 0 (0.0%) |
| 18 to 24 Years | 235 (85.8%) | 62 (100.0%) |
| 25 to 34 Years | 81 (40.1%) | 111 (64.5%) |
| 35 to 44 Years | 86 (54.4%) | 51 (53.7%) |
| 45 to 54 Years | 20 (18.3%) | 137 (58.3%) |
| 55 to 64 Years | 65 (43.3%) | 168 (65.6%) |
| 65 to 74 Years | 60 (37.7%) | 106 (40.2%) |
| 75 Years and over | 20 (34.5%) | 43 (57.3%) |
| Total | 834 (58.6%) | 754 (51.9%) |
Income Above Poverty by Sex and Age in Jayuya
According to the poverty statistics in Jayuya, males aged 45 to 54 years and females aged under 5 years are the age groups that are most secure financially, with 81.7% of males and 100.0% of females in these age groups living above the poverty line.
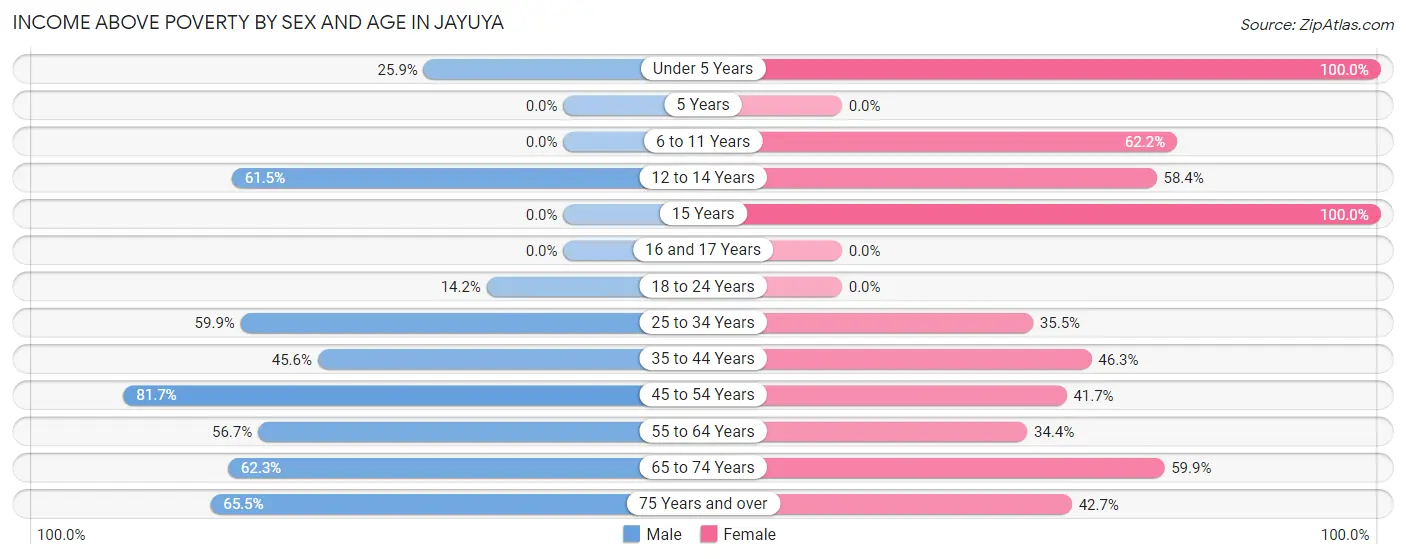
| Age Bracket | Male | Female |
| Under 5 Years | 14 (25.9%) | 45 (100.0%) |
| 5 Years | 0 (0.0%) | 0 (0.0%) |
| 6 to 11 Years | 0 (0.0%) | 56 (62.2%) |
| 12 to 14 Years | 32 (61.5%) | 59 (58.4%) |
| 15 Years | 0 (0.0%) | 59 (100.0%) |
| 16 and 17 Years | 0 (0.0%) | 0 (0.0%) |
| 18 to 24 Years | 39 (14.2%) | 0 (0.0%) |
| 25 to 34 Years | 121 (59.9%) | 61 (35.5%) |
| 35 to 44 Years | 72 (45.6%) | 44 (46.3%) |
| 45 to 54 Years | 89 (81.7%) | 98 (41.7%) |
| 55 to 64 Years | 85 (56.7%) | 88 (34.4%) |
| 65 to 74 Years | 99 (62.3%) | 158 (59.9%) |
| 75 Years and over | 38 (65.5%) | 32 (42.7%) |
| Total | 589 (41.4%) | 700 (48.1%) |
Income Below Poverty Among Married-Couple Families in Jayuya
The poverty statistics for married-couple families in Jayuya show that 39.8% or 123 of the total 309 families live below the poverty line. Families with no children have the highest poverty rate of 45.2%, comprising of 80 families. On the other hand, families with 3 or 4 children have the lowest poverty rate of 0.0%, which includes 0 families.
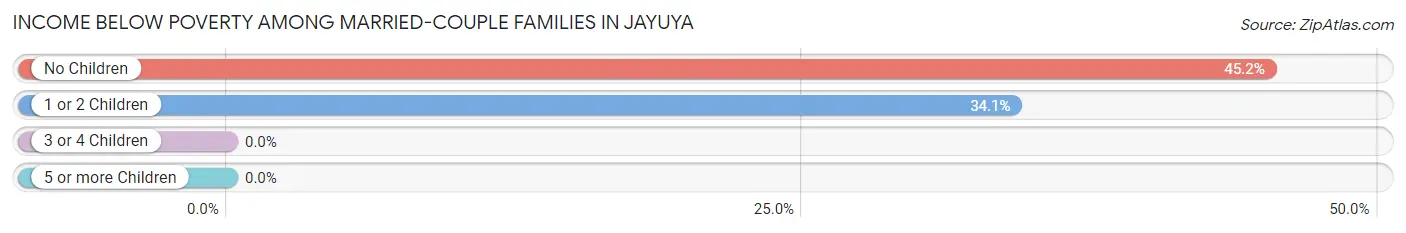
| Children | Above Poverty | Below Poverty |
| No Children | 97 (54.8%) | 80 (45.2%) |
| 1 or 2 Children | 83 (65.9%) | 43 (34.1%) |
| 3 or 4 Children | 6 (100.0%) | 0 (0.0%) |
| 5 or more Children | 0 (0.0%) | 0 (0.0%) |
| Total | 186 (60.2%) | 123 (39.8%) |
Income Below Poverty Among Single-Parent Households in Jayuya
According to the poverty data in Jayuya, 56.3% or 58 single-father households and 70.0% or 173 single-mother households are living below the poverty line. Among single-father households, those with 1 or 2 children have the highest poverty rate, with 48 households (68.6%) experiencing poverty. Likewise, among single-mother households, those with 1 or 2 children have the highest poverty rate, with 83 households (73.5%) falling below the poverty line.
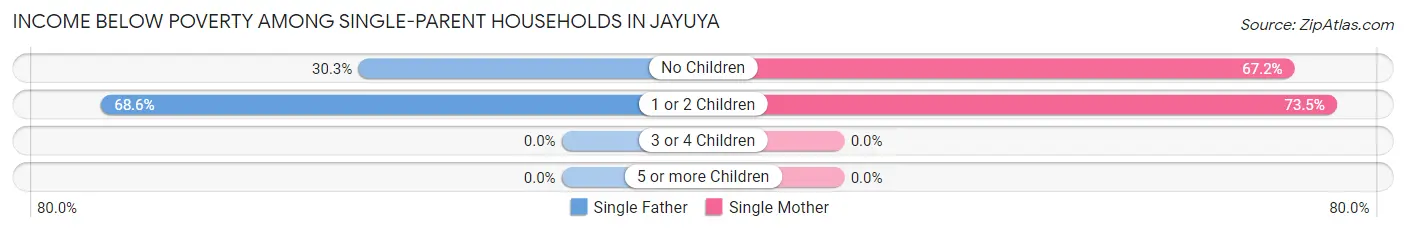
| Children | Single Father | Single Mother |
| No Children | 10 (30.3%) | 90 (67.2%) |
| 1 or 2 Children | 48 (68.6%) | 83 (73.5%) |
| 3 or 4 Children | 0 (0.0%) | 0 (0.0%) |
| 5 or more Children | 0 (0.0%) | 0 (0.0%) |
| Total | 58 (56.3%) | 173 (70.0%) |
Income Below Poverty Among Married-Couple vs Single-Parent Households in Jayuya
The poverty data for Jayuya shows that 123 of the married-couple family households (39.8%) and 231 of the single-parent households (66.0%) are living below the poverty level. Within the married-couple family households, those with no children have the highest poverty rate, with 80 households (45.2%) falling below the poverty line. Among the single-parent households, those with 1 or 2 children have the highest poverty rate, with 131 household (71.6%) living below poverty.
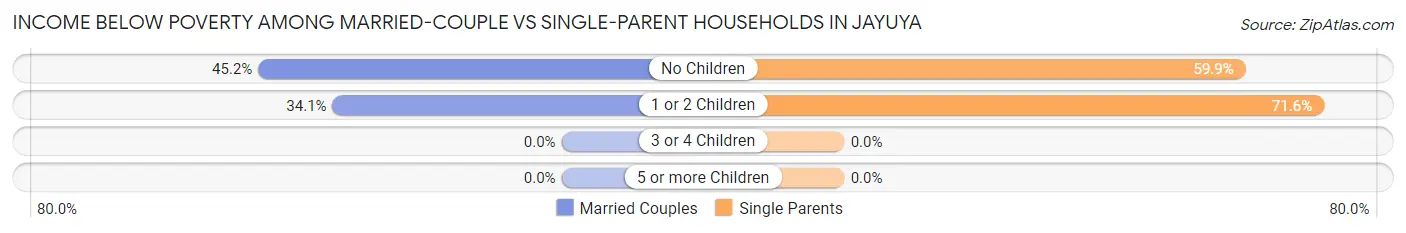
| Children | Married-Couple Families | Single-Parent Households |
| No Children | 80 (45.2%) | 100 (59.9%) |
| 1 or 2 Children | 43 (34.1%) | 131 (71.6%) |
| 3 or 4 Children | 0 (0.0%) | 0 (0.0%) |
| 5 or more Children | 0 (0.0%) | 0 (0.0%) |
| Total | 123 (39.8%) | 231 (66.0%) |
Race in Jayuya
The most populous races in Jayuya are Hispanic or Latino (2,841 | 98.7%), White / Caucasian (1,877 | 65.2%), and Some other Race (939 | 32.6%).
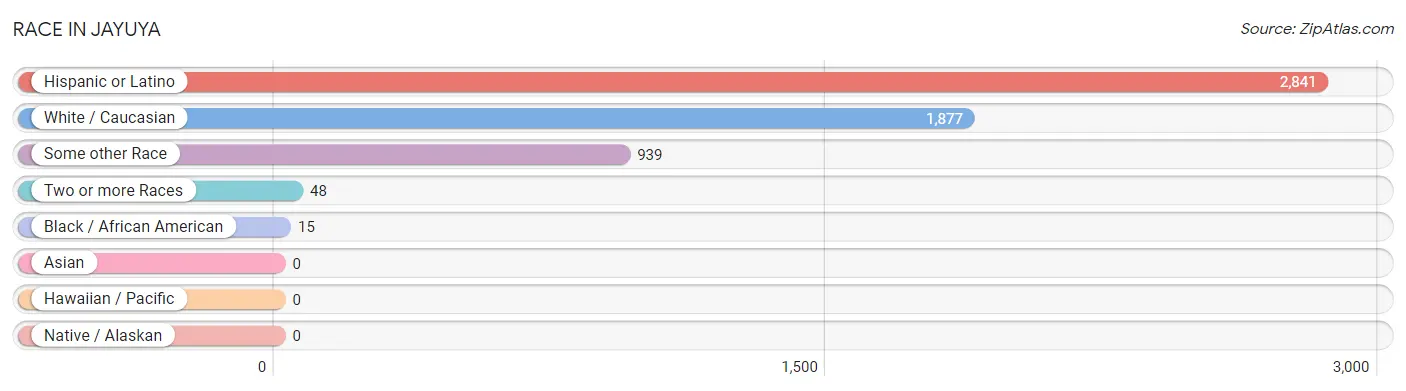
| Race | # Population | % Population |
| Asian | 0 | 0.0% |
| Black / African American | 15 | 0.5% |
| Hawaiian / Pacific | 0 | 0.0% |
| Hispanic or Latino | 2,841 | 98.7% |
| Native / Alaskan | 0 | 0.0% |
| White / Caucasian | 1,877 | 65.2% |
| Two or more Races | 48 | 1.7% |
| Some other Race | 939 | 32.6% |
| Total | 2,879 | 100.0% |
Ancestry in Jayuya
The most populous ancestries reported in Jayuya are Puerto Rican (2,775 | 96.4%), Dominican (61 | 2.1%), and American (52 | 1.8%), together accounting for 100.3% of all Jayuya residents.
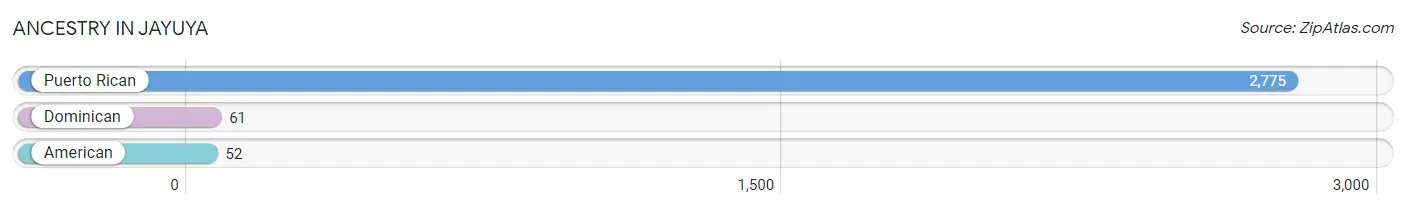
| Ancestry | # Population | % Population |
| American | 52 | 1.8% |
| Dominican | 61 | 2.1% |
| Puerto Rican | 2,775 | 96.4% | View All 3 Rows |
Immigrants in Jayuya

| Immigration Origin | # Population | % Population | View All 0 Rows |
Sex and Age in Jayuya
Sex and Age in Jayuya
The most populous age groups in Jayuya are 20 to 24 Years (214 | 15.0%) for men and 65 to 69 Years (136 | 9.3%) for women.
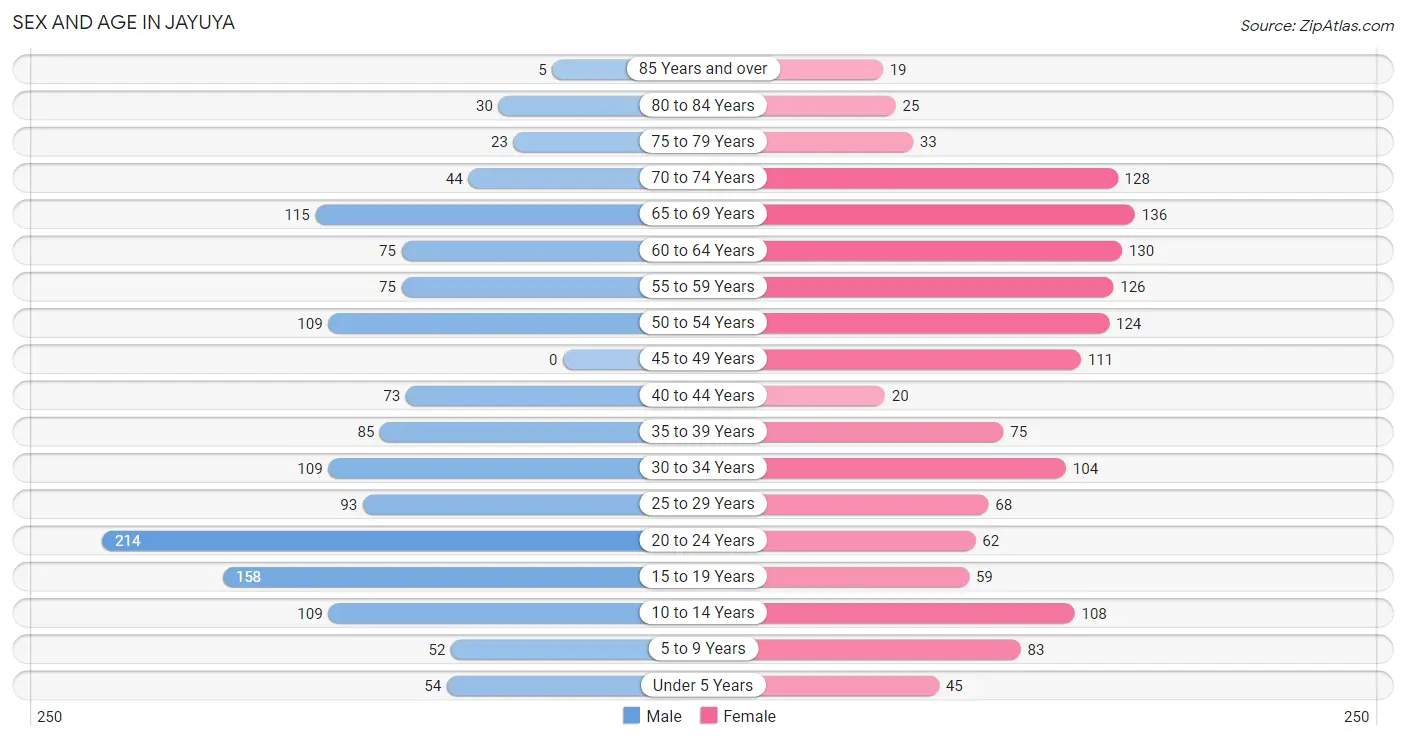
| Age Bracket | Male | Female |
| Under 5 Years | 54 (3.8%) | 45 (3.1%) |
| 5 to 9 Years | 52 (3.6%) | 83 (5.7%) |
| 10 to 14 Years | 109 (7.7%) | 108 (7.4%) |
| 15 to 19 Years | 158 (11.1%) | 59 (4.1%) |
| 20 to 24 Years | 214 (15.0%) | 62 (4.3%) |
| 25 to 29 Years | 93 (6.5%) | 68 (4.7%) |
| 30 to 34 Years | 109 (7.7%) | 104 (7.1%) |
| 35 to 39 Years | 85 (6.0%) | 75 (5.1%) |
| 40 to 44 Years | 73 (5.1%) | 20 (1.4%) |
| 45 to 49 Years | 0 (0.0%) | 111 (7.6%) |
| 50 to 54 Years | 109 (7.7%) | 124 (8.5%) |
| 55 to 59 Years | 75 (5.3%) | 126 (8.6%) |
| 60 to 64 Years | 75 (5.3%) | 130 (8.9%) |
| 65 to 69 Years | 115 (8.1%) | 136 (9.3%) |
| 70 to 74 Years | 44 (3.1%) | 128 (8.8%) |
| 75 to 79 Years | 23 (1.6%) | 33 (2.3%) |
| 80 to 84 Years | 30 (2.1%) | 25 (1.7%) |
| 85 Years and over | 5 (0.4%) | 19 (1.3%) |
| Total | 1,423 (100.0%) | 1,456 (100.0%) |
Families and Households in Jayuya
Median Family Size in Jayuya
The median family size in Jayuya is 3.52 persons per family, with single female/mother families (247 | 37.5%) accounting for the largest median family size of 3.77 persons per family. On the other hand, single male/father families (103 | 15.6%) represent the smallest median family size with 2.93 persons per family.
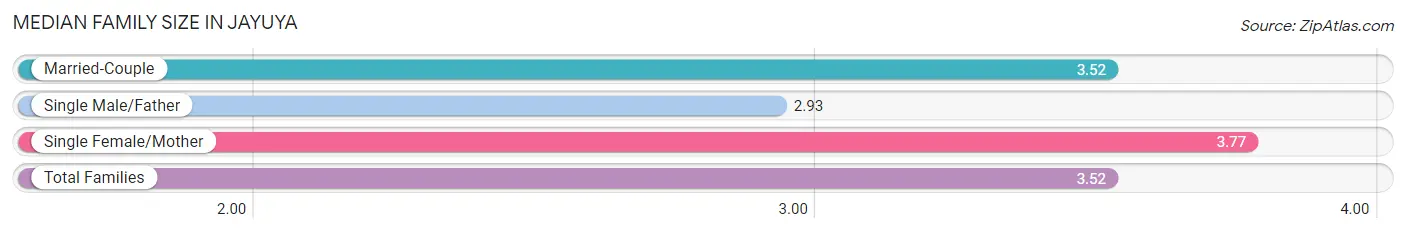
| Family Type | # Families | Family Size |
| Married-Couple | 309 (46.9%) | 3.52 |
| Single Male/Father | 103 (15.6%) | 2.93 |
| Single Female/Mother | 247 (37.5%) | 3.77 |
| Total Families | 659 (100.0%) | 3.52 |
Median Household Size in Jayuya
The median household size in Jayuya is 2.77 persons per household, with single female/mother households (247 | 23.7%) accounting for the largest median household size of 3.98 persons per household. non-family households (381 | 36.6%) represent the smallest median household size with 1.25 persons per household.
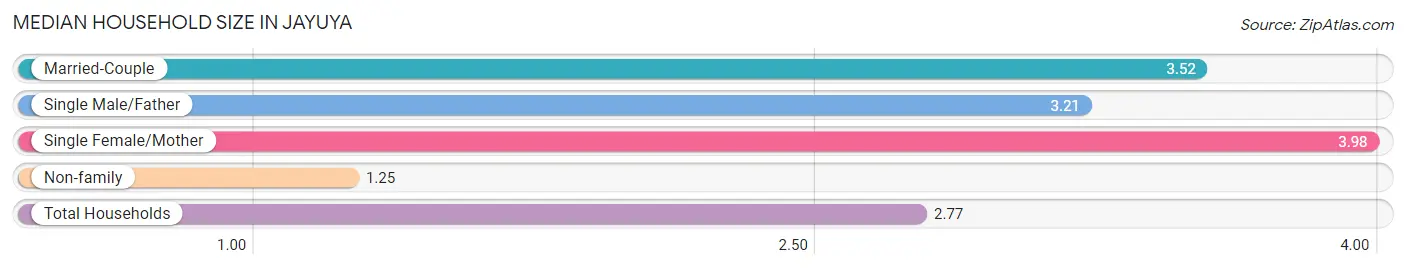
| Household Type | # Households | Household Size |
| Married-Couple | 309 (29.7%) | 3.52 |
| Single Male/Father | 103 (9.9%) | 3.21 |
| Single Female/Mother | 247 (23.7%) | 3.98 |
| Non-family | 381 (36.6%) | 1.25 |
| Total Households | 1,040 (100.0%) | 2.77 |
Household Size by Marriage Status in Jayuya
Out of a total of 1,040 households in Jayuya, 659 (63.4%) are family households, while 381 (36.6%) are nonfamily households. The most numerous type of family households are 2-person households, comprising 237, and the most common type of nonfamily households are 1-person households, comprising 309.
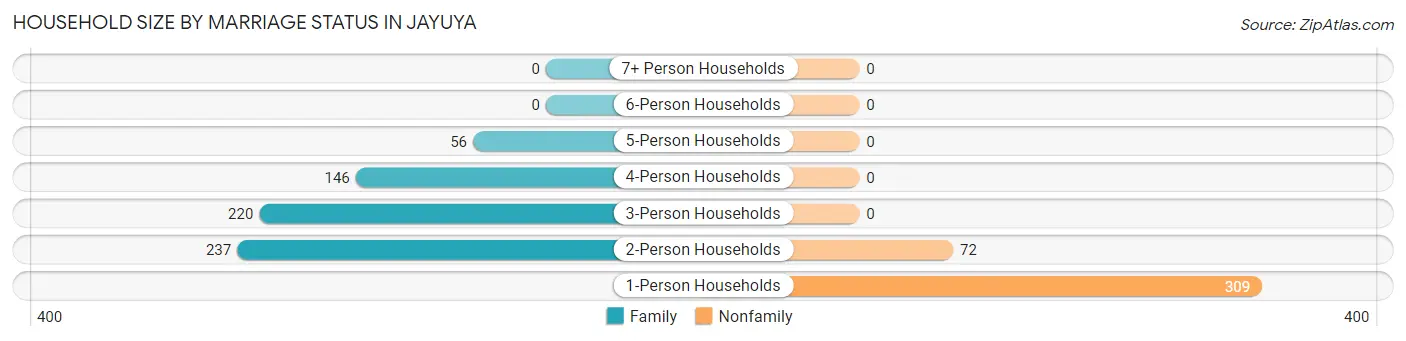
| Household Size | Family Households | Nonfamily Households |
| 1-Person Households | - | 309 (29.7%) |
| 2-Person Households | 237 (22.8%) | 72 (6.9%) |
| 3-Person Households | 220 (21.1%) | 0 (0.0%) |
| 4-Person Households | 146 (14.0%) | 0 (0.0%) |
| 5-Person Households | 56 (5.4%) | 0 (0.0%) |
| 6-Person Households | 0 (0.0%) | 0 (0.0%) |
| 7+ Person Households | 0 (0.0%) | 0 (0.0%) |
| Total | 659 (63.4%) | 381 (36.6%) |
Female Fertility in Jayuya
Fertility by Age in Jayuya
| Age Bracket | Women with Births | Births / 1,000 Women |
| 15 to 19 years | 0 (0.0%) | 0.0 |
| 20 to 34 years | 0 (0.0%) | 0.0 |
| 35 to 50 years | 0 (0.0%) | 0.0 |
| Total | 0 (0.0%) | 0.0 |
Fertility by Age by Marriage Status in Jayuya
| Age Bracket | Married | Unmarried |
| 15 to 19 years | 0 (0.0%) | 0 (0.0%) |
| 20 to 34 years | 0 (0.0%) | 0 (0.0%) |
| 35 to 50 years | 0 (0.0%) | 0 (0.0%) |
| Total | 0 (0.0%) | 0 (0.0%) |
Fertility by Education in Jayuya
| Educational Attainment | Women with Births | Births / 1,000 Women |
| Less than High School | 0 (0.0%) | 0.0 |
| High School Diploma | 0 (0.0%) | 0.0 |
| College or Associate's Degree | 0 (0.0%) | 0.0 |
| Bachelor's Degree | 0 (0.0%) | 0.0 |
| Graduate Degree | 0 (0.0%) | 0.0 |
| Total | 0 (0.0%) | 0.0 |
Fertility by Education by Marriage Status in Jayuya
| Educational Attainment | Married | Unmarried |
| Less than High School | 0 (0.0%) | 0 (0.0%) |
| High School Diploma | 0 (0.0%) | 0 (0.0%) |
| College or Associate's Degree | 0 (0.0%) | 0 (0.0%) |
| Bachelor's Degree | 0 (0.0%) | 0 (0.0%) |
| Graduate Degree | 0 (0.0%) | 0 (0.0%) |
| Total | 0 (0.0%) | 0 (0.0%) |
Employment Characteristics in Jayuya
Employment by Class of Employer in Jayuya
Among the 626 employed individuals in Jayuya, private company employees (363 | 58.0%), local government employees (149 | 23.8%), and state government employees (54 | 8.6%) make up the most common classes of employment.
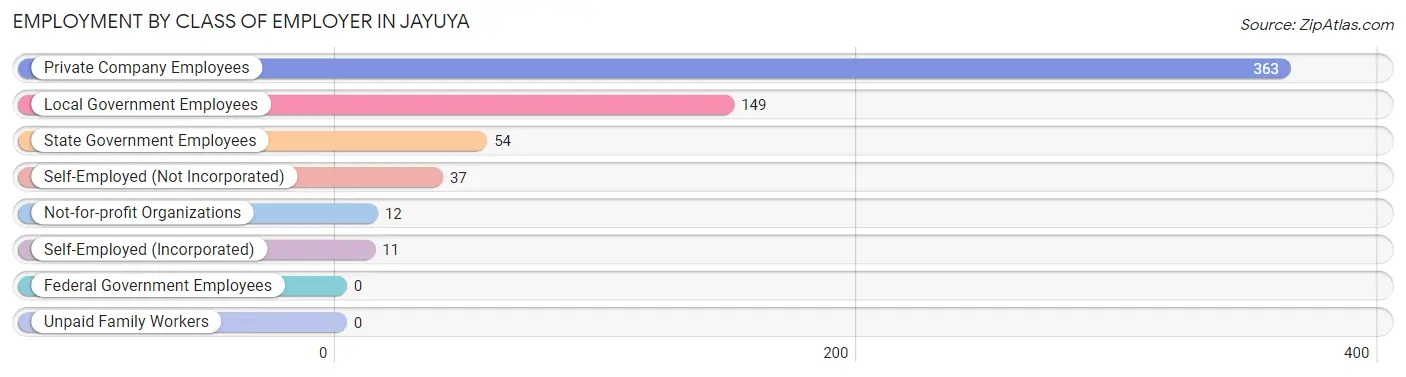
| Employer Class | # Employees | % Employees |
| Private Company Employees | 363 | 58.0% |
| Self-Employed (Incorporated) | 11 | 1.8% |
| Self-Employed (Not Incorporated) | 37 | 5.9% |
| Not-for-profit Organizations | 12 | 1.9% |
| Local Government Employees | 149 | 23.8% |
| State Government Employees | 54 | 8.6% |
| Federal Government Employees | 0 | 0.0% |
| Unpaid Family Workers | 0 | 0.0% |
| Total | 626 | 100.0% |
Employment Status by Age in Jayuya
According to the labor force statistics for Jayuya, out of the total population over 16 years of age (2,336), 40.2% or 939 individuals are in the labor force, with 31.3% or 294 of them unemployed. The age group with the highest labor force participation rate is 25 to 29 years, with 100.0% or 161 individuals in the labor force. Within the labor force, the 20 to 24 years age range has the highest percentage of unemployed individuals, with 100.0% or 60 of them being unemployed.
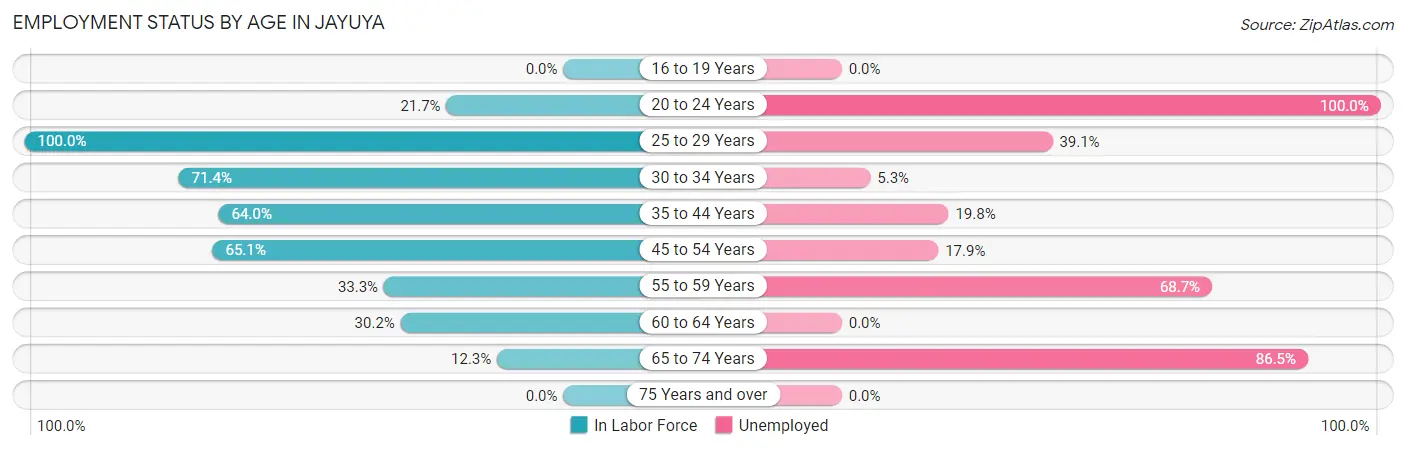
| Age Bracket | In Labor Force | Unemployed |
| 16 to 19 Years | 0 (0.0%) | 0 (0.0%) |
| 20 to 24 Years | 60 (21.7%) | 60 (100.0%) |
| 25 to 29 Years | 161 (100.0%) | 63 (39.1%) |
| 30 to 34 Years | 152 (71.4%) | 8 (5.3%) |
| 35 to 44 Years | 162 (64.0%) | 32 (19.8%) |
| 45 to 54 Years | 224 (65.1%) | 40 (17.9%) |
| 55 to 59 Years | 67 (33.3%) | 46 (68.7%) |
| 60 to 64 Years | 62 (30.2%) | 0 (0.0%) |
| 65 to 74 Years | 52 (12.3%) | 45 (86.5%) |
| 75 Years and over | 0 (0.0%) | 0 (0.0%) |
| Total | 939 (40.2%) | 294 (31.3%) |
Employment Status by Educational Attainment in Jayuya
According to labor force statistics for Jayuya, 60.1% of individuals (828) out of the total population between 25 and 64 years of age (1,377) are in the labor force, with 22.8% or 189 of them being unemployed. The group with the highest labor force participation rate are those with the educational attainment of college / associate degree, with 68.0% or 295 individuals in the labor force. Within the labor force, individuals with less than high school education have the highest percentage of unemployment, with 100.0% or 12 of them being unemployed.
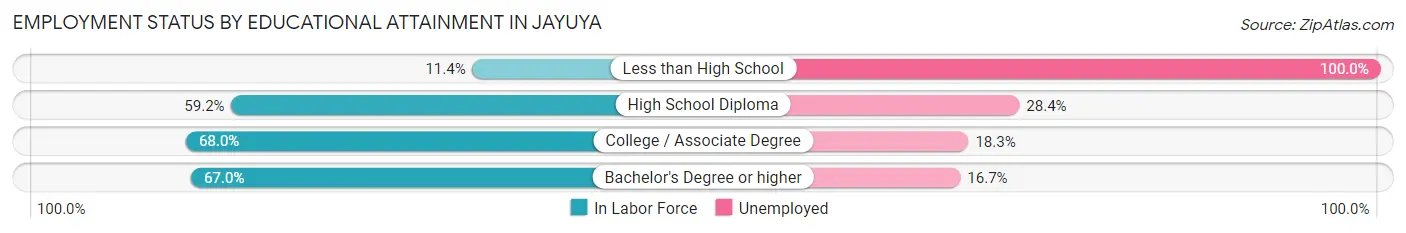
| Educational Attainment | In Labor Force | Unemployed |
| Less than High School | 12 (11.4%) | 105 (100.0%) |
| High School Diploma | 306 (59.2%) | 147 (28.4%) |
| College / Associate Degree | 295 (68.0%) | 79 (18.3%) |
| Bachelor's Degree or higher | 215 (67.0%) | 54 (16.7%) |
| Total | 828 (60.1%) | 314 (22.8%) |
Employment Occupations by Sex in Jayuya
Management, Business, Science and Arts Occupations
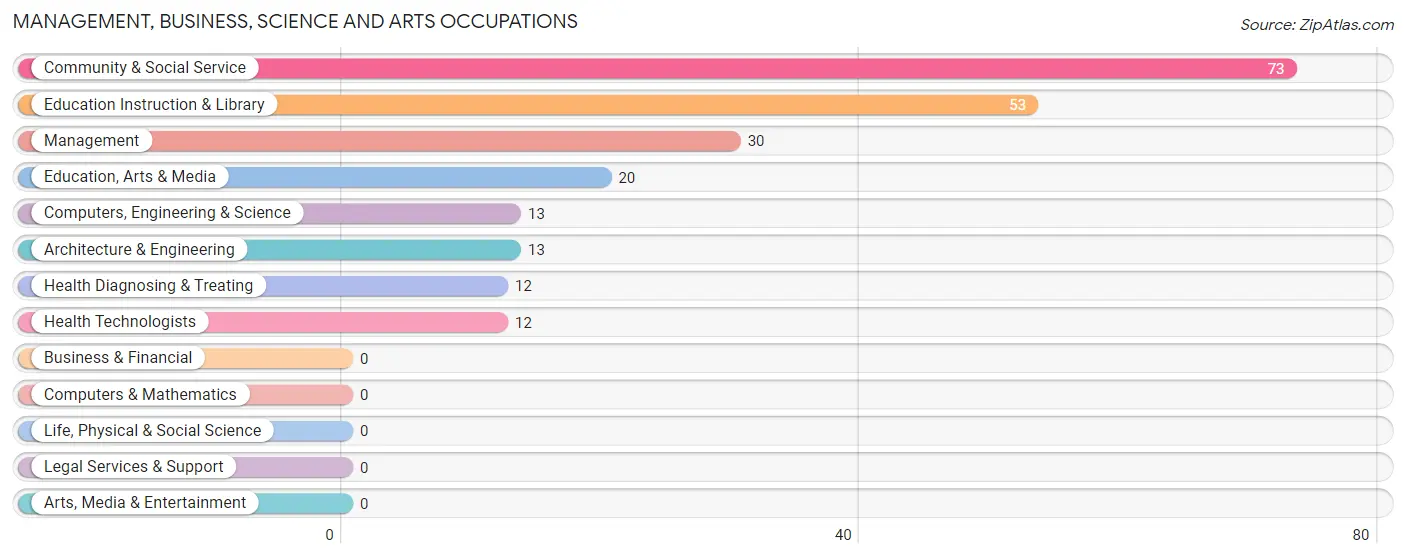
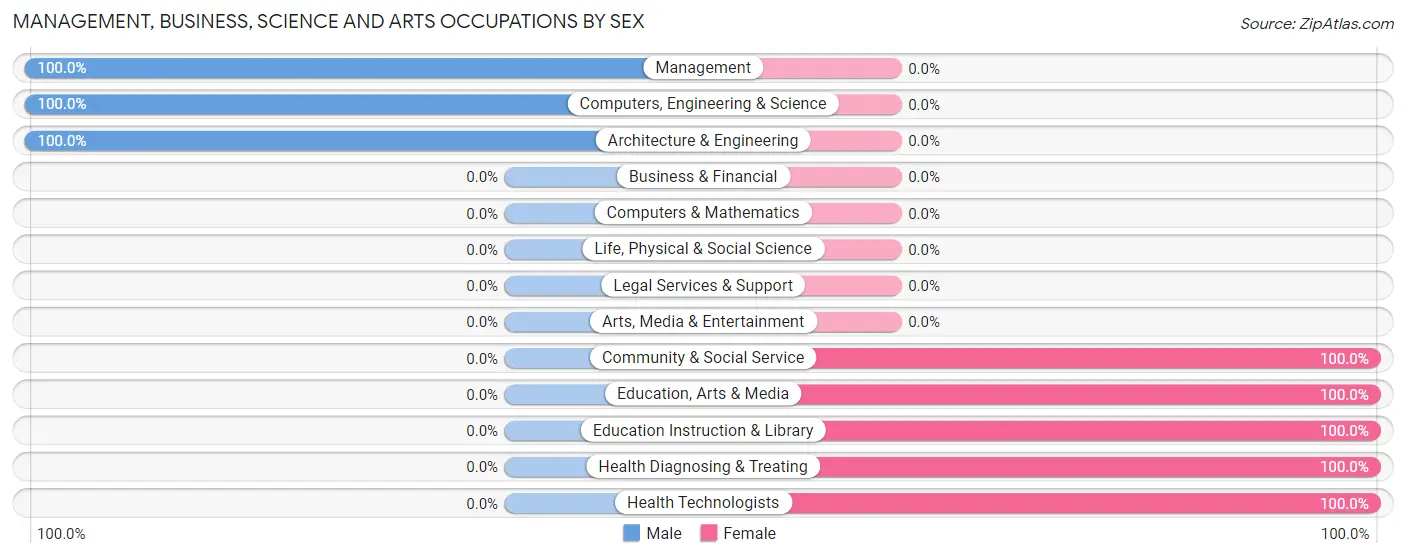
The most common Management, Business, Science and Arts occupations in Jayuya are Community & Social Service (73 | 11.3%), Education Instruction & Library (53 | 8.2%), Management (30 | 4.6%), Education, Arts & Media (20 | 3.1%), and Computers, Engineering & Science (13 | 2.0%).
Management, Business, Science and Arts Occupations by Sex
Within the Management, Business, Science and Arts occupations in Jayuya, the most male-oriented occupations are Management (100.0%), Computers, Engineering & Science (100.0%), and Architecture & Engineering (100.0%), while the most female-oriented occupations are Community & Social Service (100.0%), Education, Arts & Media (100.0%), and Education Instruction & Library (100.0%).
| Occupation | Male | Female |
| Management | 30 (100.0%) | 0 (0.0%) |
| Business & Financial | 0 (0.0%) | 0 (0.0%) |
| Computers, Engineering & Science | 13 (100.0%) | 0 (0.0%) |
| Computers & Mathematics | 0 (0.0%) | 0 (0.0%) |
| Architecture & Engineering | 13 (100.0%) | 0 (0.0%) |
| Life, Physical & Social Science | 0 (0.0%) | 0 (0.0%) |
| Community & Social Service | 0 (0.0%) | 73 (100.0%) |
| Education, Arts & Media | 0 (0.0%) | 20 (100.0%) |
| Legal Services & Support | 0 (0.0%) | 0 (0.0%) |
| Education Instruction & Library | 0 (0.0%) | 53 (100.0%) |
| Arts, Media & Entertainment | 0 (0.0%) | 0 (0.0%) |
| Health Diagnosing & Treating | 0 (0.0%) | 12 (100.0%) |
| Health Technologists | 0 (0.0%) | 12 (100.0%) |
| Total (Category) | 43 (33.6%) | 85 (66.4%) |
| Total (Overall) | 392 (60.7%) | 254 (39.3%) |
Services Occupations
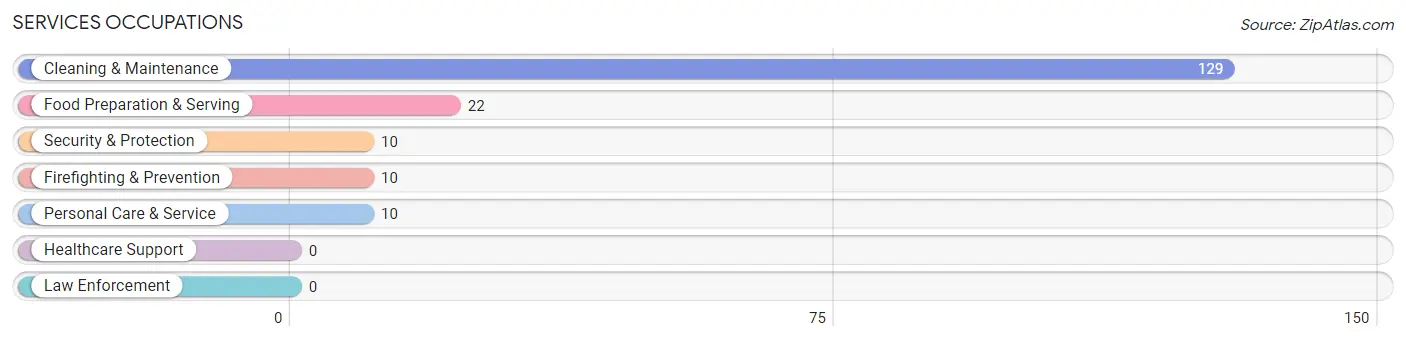
The most common Services occupations in Jayuya are Cleaning & Maintenance (129 | 20.0%), Food Preparation & Serving (22 | 3.4%), Security & Protection (10 | 1.5%), Firefighting & Prevention (10 | 1.5%), and Personal Care & Service (10 | 1.5%).
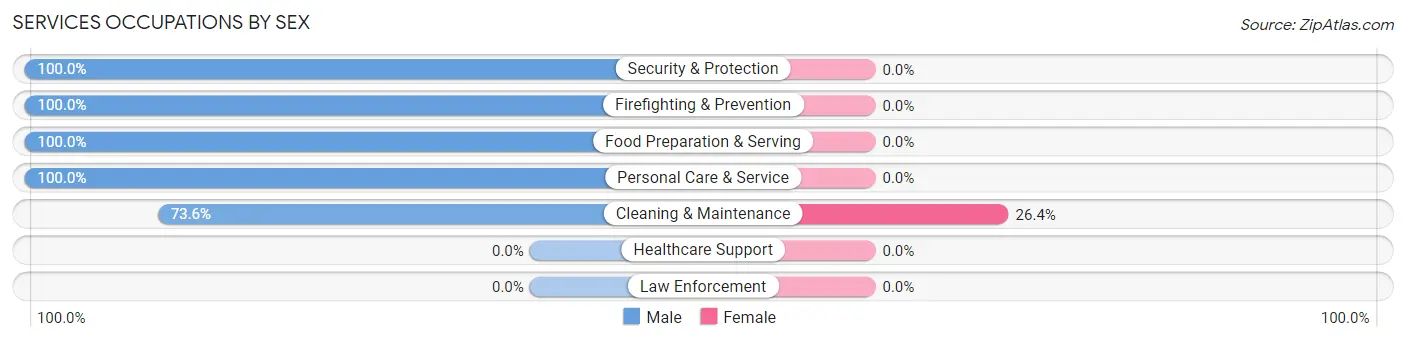
Services Occupations by Sex
| Occupation | Male | Female |
| Healthcare Support | 0 (0.0%) | 0 (0.0%) |
| Security & Protection | 10 (100.0%) | 0 (0.0%) |
| Firefighting & Prevention | 10 (100.0%) | 0 (0.0%) |
| Law Enforcement | 0 (0.0%) | 0 (0.0%) |
| Food Preparation & Serving | 22 (100.0%) | 0 (0.0%) |
| Cleaning & Maintenance | 95 (73.6%) | 34 (26.4%) |
| Personal Care & Service | 10 (100.0%) | 0 (0.0%) |
| Total (Category) | 137 (80.1%) | 34 (19.9%) |
| Total (Overall) | 392 (60.7%) | 254 (39.3%) |
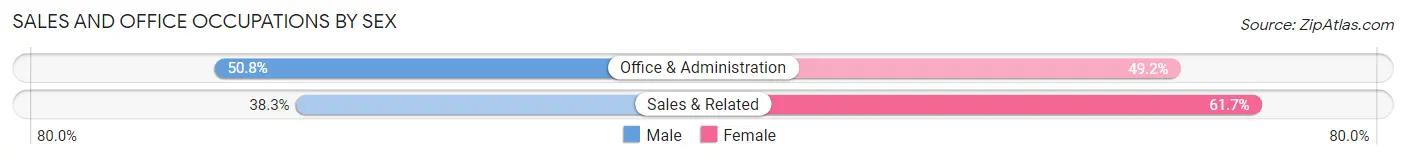
Sales and Office Occupations
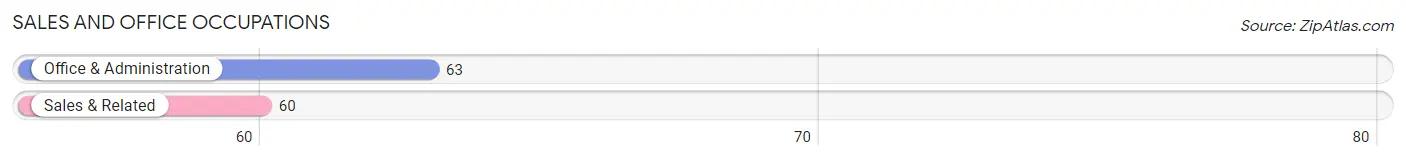
The most common Sales and Office occupations in Jayuya are Office & Administration (63 | 9.8%), and Sales & Related (60 | 9.3%).
Sales and Office Occupations by Sex
| Occupation | Male | Female |
| Sales & Related | 23 (38.3%) | 37 (61.7%) |
| Office & Administration | 32 (50.8%) | 31 (49.2%) |
| Total (Category) | 55 (44.7%) | 68 (55.3%) |
| Total (Overall) | 392 (60.7%) | 254 (39.3%) |
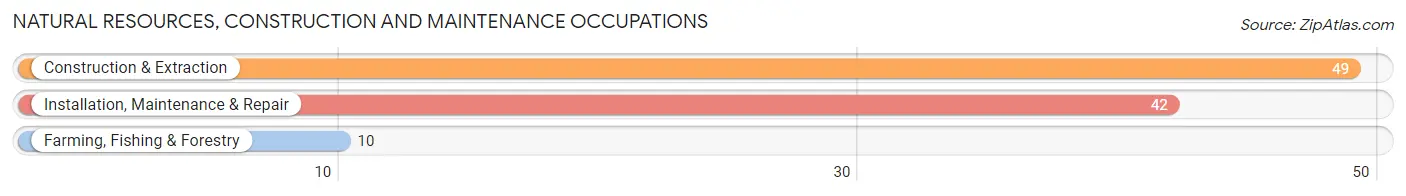
Natural Resources, Construction and Maintenance Occupations
The most common Natural Resources, Construction and Maintenance occupations in Jayuya are Construction & Extraction (49 | 7.6%), Installation, Maintenance & Repair (42 | 6.5%), and Farming, Fishing & Forestry (10 | 1.5%).
Natural Resources, Construction and Maintenance Occupations by Sex
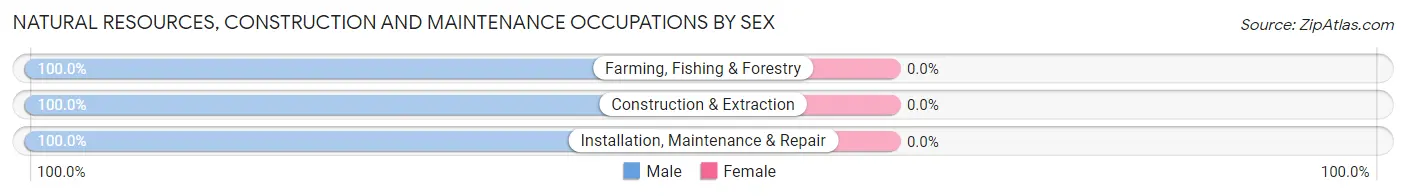
| Occupation | Male | Female |
| Farming, Fishing & Forestry | 10 (100.0%) | 0 (0.0%) |
| Construction & Extraction | 49 (100.0%) | 0 (0.0%) |
| Installation, Maintenance & Repair | 42 (100.0%) | 0 (0.0%) |
| Total (Category) | 101 (100.0%) | 0 (0.0%) |
| Total (Overall) | 392 (60.7%) | 254 (39.3%) |
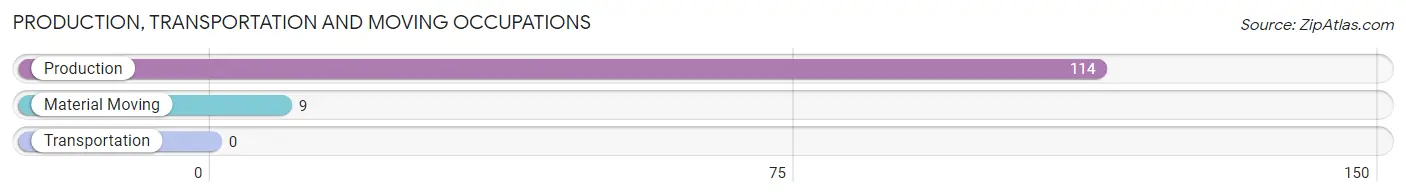
Production, Transportation and Moving Occupations
The most common Production, Transportation and Moving occupations in Jayuya are Production (114 | 17.6%), and Material Moving (9 | 1.4%).
Production, Transportation and Moving Occupations by Sex
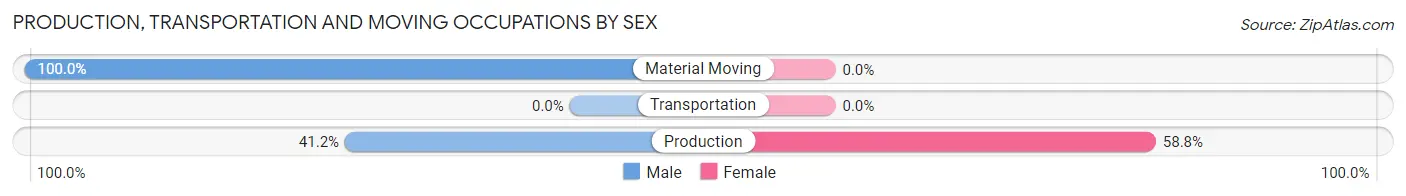
| Occupation | Male | Female |
| Production | 47 (41.2%) | 67 (58.8%) |
| Transportation | 0 (0.0%) | 0 (0.0%) |
| Material Moving | 9 (100.0%) | 0 (0.0%) |
| Total (Category) | 56 (45.5%) | 67 (54.5%) |
| Total (Overall) | 392 (60.7%) | 254 (39.3%) |
Employment Industries by Sex in Jayuya
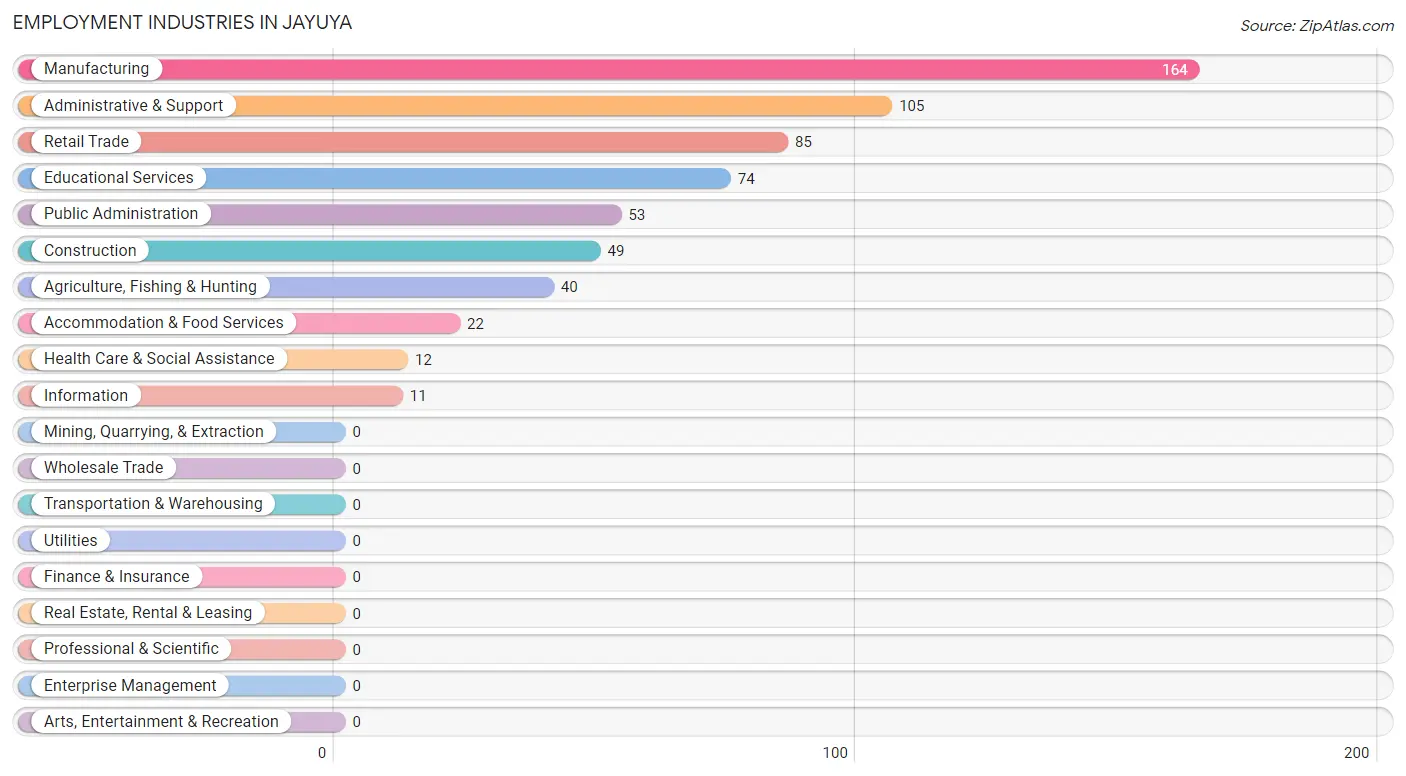
Employment Industries in Jayuya
The major employment industries in Jayuya include Manufacturing (164 | 25.4%), Administrative & Support (105 | 16.3%), Retail Trade (85 | 13.2%), Educational Services (74 | 11.5%), and Public Administration (53 | 8.2%).
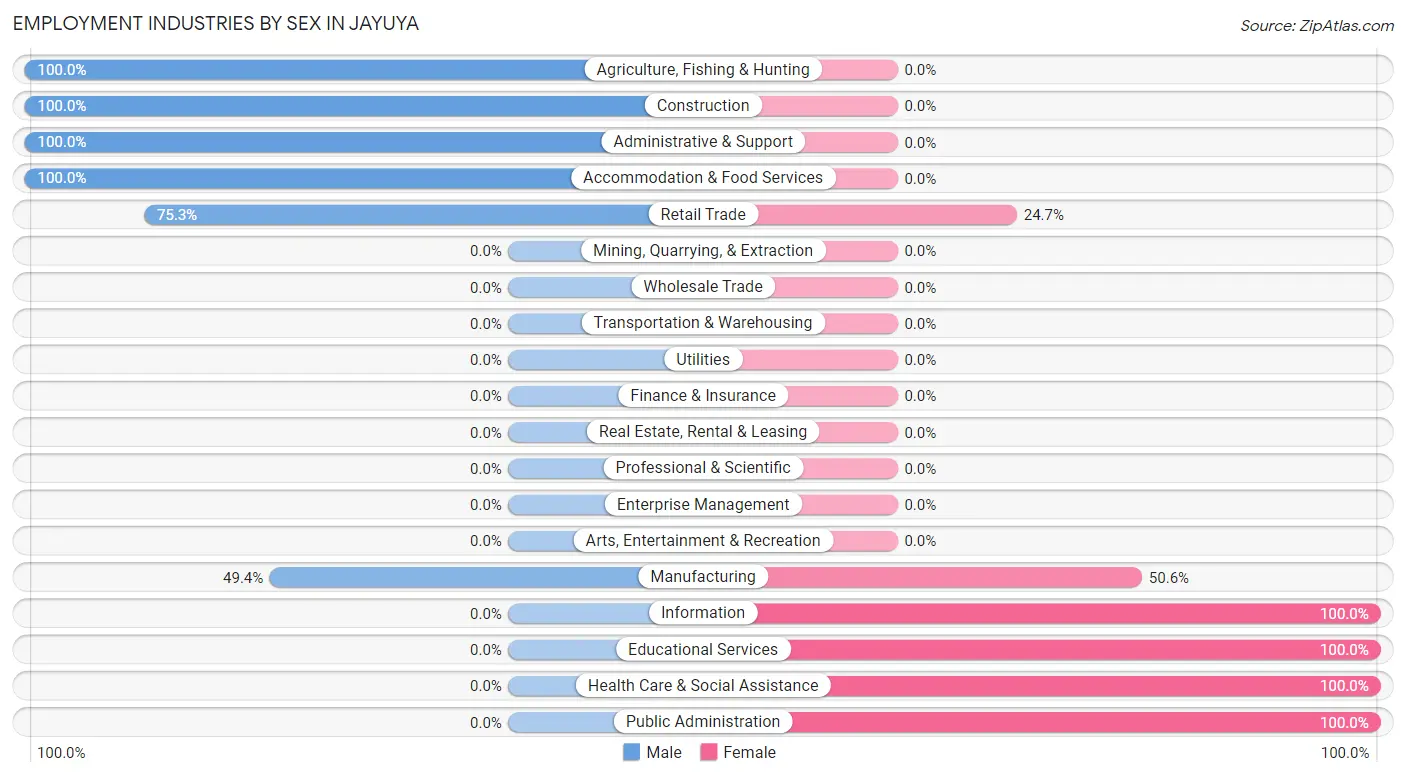
Employment Industries by Sex in Jayuya
The Jayuya industries that see more men than women are Agriculture, Fishing & Hunting (100.0%), Construction (100.0%), and Administrative & Support (100.0%), whereas the industries that tend to have a higher number of women are Information (100.0%), Educational Services (100.0%), and Health Care & Social Assistance (100.0%).
| Industry | Male | Female |
| Agriculture, Fishing & Hunting | 40 (100.0%) | 0 (0.0%) |
| Mining, Quarrying, & Extraction | 0 (0.0%) | 0 (0.0%) |
| Construction | 49 (100.0%) | 0 (0.0%) |
| Manufacturing | 81 (49.4%) | 83 (50.6%) |
| Wholesale Trade | 0 (0.0%) | 0 (0.0%) |
| Retail Trade | 64 (75.3%) | 21 (24.7%) |
| Transportation & Warehousing | 0 (0.0%) | 0 (0.0%) |
| Utilities | 0 (0.0%) | 0 (0.0%) |
| Information | 0 (0.0%) | 11 (100.0%) |
| Finance & Insurance | 0 (0.0%) | 0 (0.0%) |
| Real Estate, Rental & Leasing | 0 (0.0%) | 0 (0.0%) |
| Professional & Scientific | 0 (0.0%) | 0 (0.0%) |
| Enterprise Management | 0 (0.0%) | 0 (0.0%) |
| Administrative & Support | 105 (100.0%) | 0 (0.0%) |
| Educational Services | 0 (0.0%) | 74 (100.0%) |
| Health Care & Social Assistance | 0 (0.0%) | 12 (100.0%) |
| Arts, Entertainment & Recreation | 0 (0.0%) | 0 (0.0%) |
| Accommodation & Food Services | 22 (100.0%) | 0 (0.0%) |
| Public Administration | 0 (0.0%) | 53 (100.0%) |
| Total | 392 (60.7%) | 254 (39.3%) |
Education in Jayuya
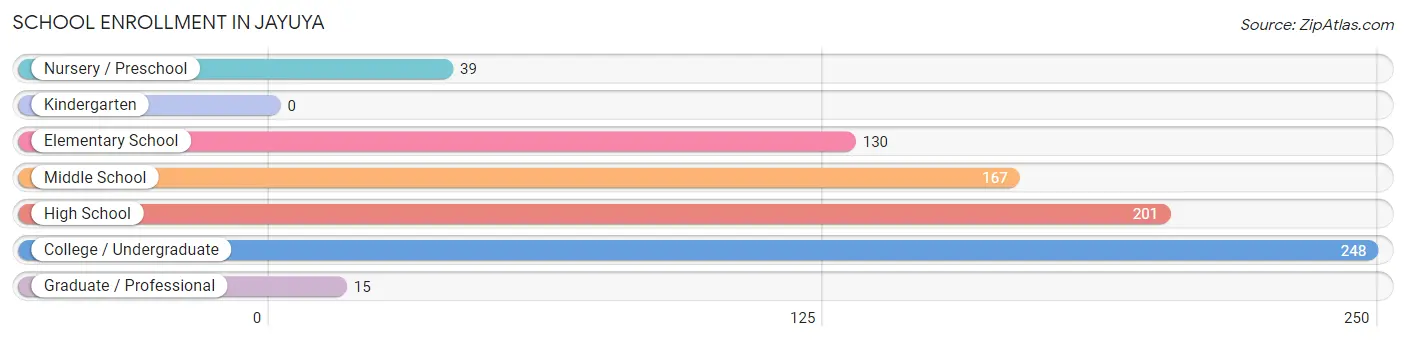
School Enrollment in Jayuya
The most common levels of schooling among the 800 students in Jayuya are college / undergraduate (248 | 31.0%), high school (201 | 25.1%), and middle school (167 | 20.9%).
| School Level | # Students | % Students |
| Nursery / Preschool | 39 | 4.9% |
| Kindergarten | 0 | 0.0% |
| Elementary School | 130 | 16.3% |
| Middle School | 167 | 20.9% |
| High School | 201 | 25.1% |
| College / Undergraduate | 248 | 31.0% |
| Graduate / Professional | 15 | 1.9% |
| Total | 800 | 100.0% |
School Enrollment by Age by Funding Source in Jayuya
Out of a total of 800 students who are enrolled in schools in Jayuya, 242 (30.3%) attend a private institution, while the remaining 558 (69.7%) are enrolled in public schools. The age group of 18 to 19 year olds has the highest likelihood of being enrolled in private schools, with 39 (100.0% in the age bracket) enrolled. Conversely, the age group of 3 to 4 year olds has the lowest likelihood of being enrolled in a private school, with 24 (100.0% in the age bracket) attending a public institution.
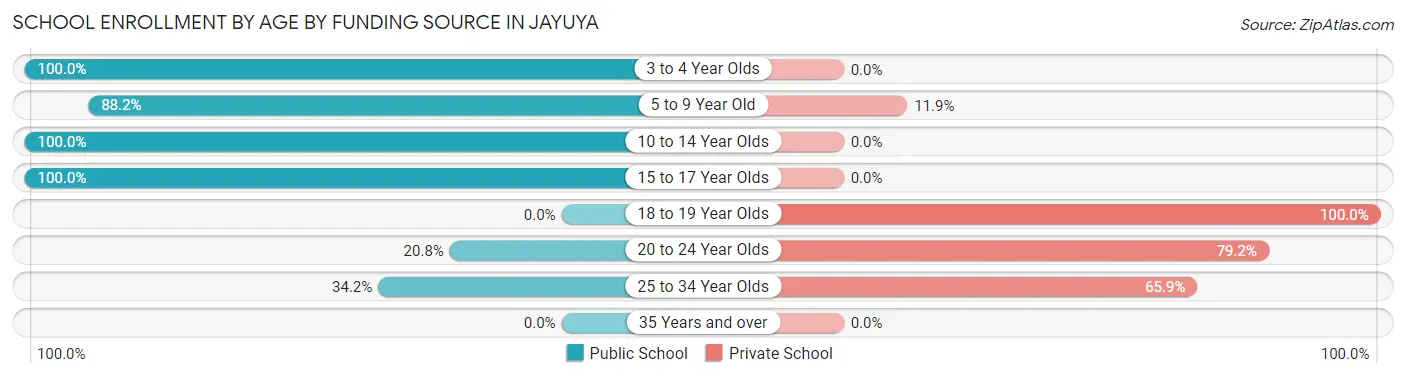
| Age Bracket | Public School | Private School |
| 3 to 4 Year Olds | 24 (100.0%) | 0 (0.0%) |
| 5 to 9 Year Old | 119 (88.1%) | 16 (11.8%) |
| 10 to 14 Year Olds | 217 (100.0%) | 0 (0.0%) |
| 15 to 17 Year Olds | 135 (100.0%) | 0 (0.0%) |
| 18 to 19 Year Olds | 0 (0.0%) | 39 (100.0%) |
| 20 to 24 Year Olds | 35 (20.8%) | 133 (79.2%) |
| 25 to 34 Year Olds | 28 (34.2%) | 54 (65.8%) |
| 35 Years and over | 0 (0.0%) | 0 (0.0%) |
| Total | 558 (69.8%) | 242 (30.3%) |
Educational Attainment by Field of Study in Jayuya
Business (183 | 38.5%), education (130 | 27.3%), science & technology (108 | 22.7%), arts & humanities (30 | 6.3%), and engineering (13 | 2.7%) are the most common fields of study among 476 individuals in Jayuya who have obtained a bachelor's degree or higher.
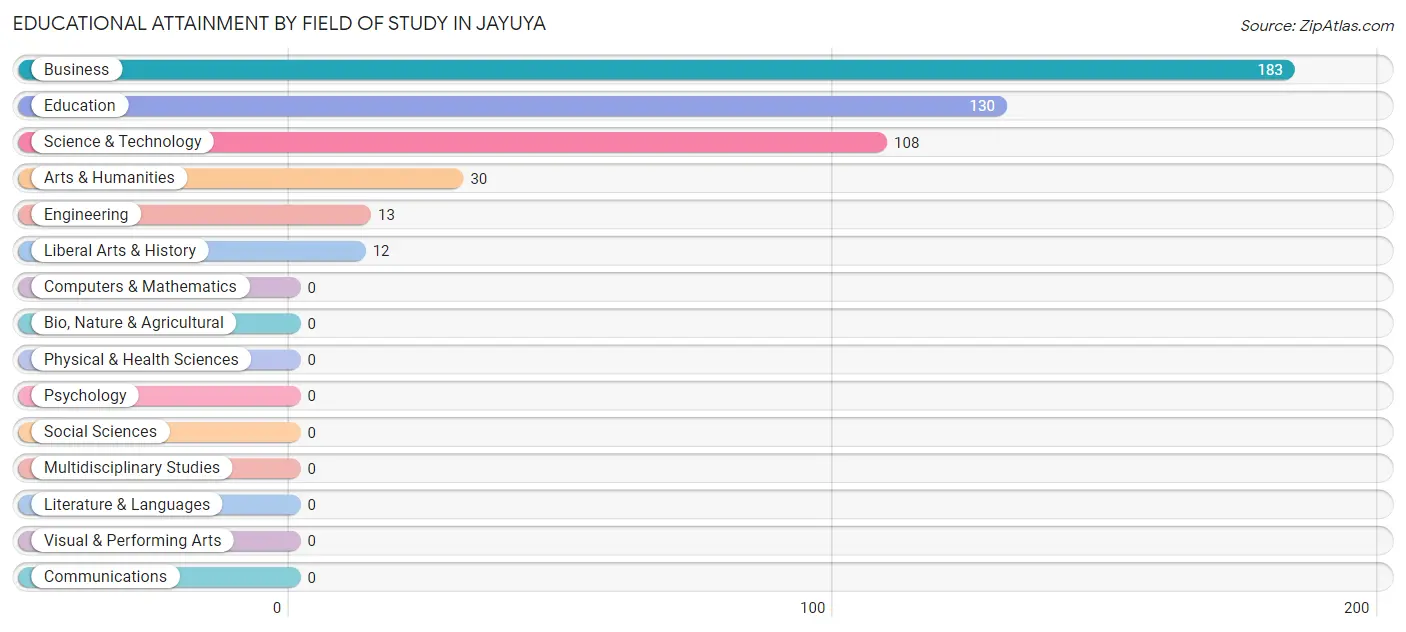
| Field of Study | # Graduates | % Graduates |
| Computers & Mathematics | 0 | 0.0% |
| Bio, Nature & Agricultural | 0 | 0.0% |
| Physical & Health Sciences | 0 | 0.0% |
| Psychology | 0 | 0.0% |
| Social Sciences | 0 | 0.0% |
| Engineering | 13 | 2.7% |
| Multidisciplinary Studies | 0 | 0.0% |
| Science & Technology | 108 | 22.7% |
| Business | 183 | 38.5% |
| Education | 130 | 27.3% |
| Literature & Languages | 0 | 0.0% |
| Liberal Arts & History | 12 | 2.5% |
| Visual & Performing Arts | 0 | 0.0% |
| Communications | 0 | 0.0% |
| Arts & Humanities | 30 | 6.3% |
| Total | 476 | 100.0% |
Transportation & Commute in Jayuya
Vehicle Availability by Sex in Jayuya
The most prevalent vehicle ownership categories in Jayuya are males with 2 vehicles (125, accounting for 31.9%) and females with 2 vehicles (76, making up 53.4%).
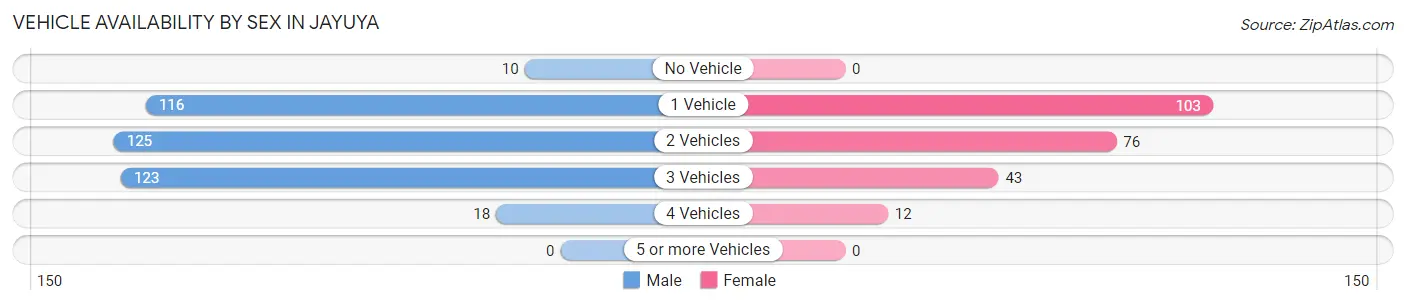
| Vehicles Available | Male | Female |
| No Vehicle | 10 (2.5%) | 0 (0.0%) |
| 1 Vehicle | 116 (29.6%) | 103 (44.0%) |
| 2 Vehicles | 125 (31.9%) | 76 (32.5%) |
| 3 Vehicles | 123 (31.4%) | 43 (18.4%) |
| 4 Vehicles | 18 (4.6%) | 12 (5.1%) |
| 5 or more Vehicles | 0 (0.0%) | 0 (0.0%) |
| Total | 392 (100.0%) | 234 (100.0%) |
Commute Time in Jayuya
The most frequently occuring commute durations in Jayuya are 10 to 14 minutes (264 commuters, 42.9%), 5 to 9 minutes (130 commuters, 21.1%), and 15 to 19 minutes (62 commuters, 10.1%).
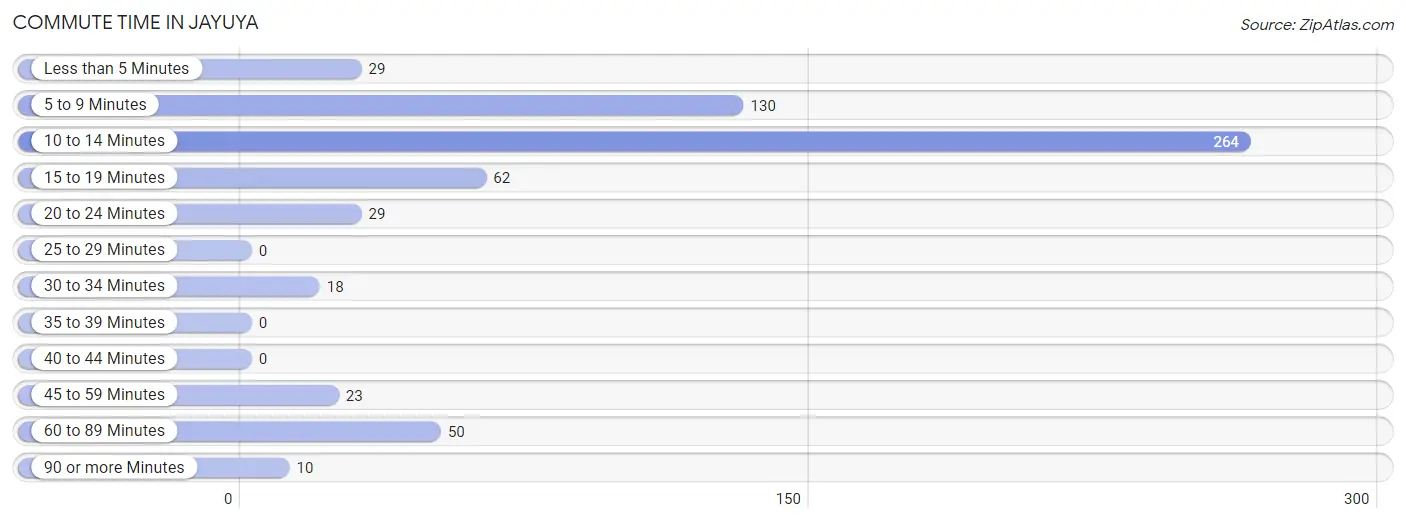
| Commute Time | # Commuters | % Commuters |
| Less than 5 Minutes | 29 | 4.7% |
| 5 to 9 Minutes | 130 | 21.1% |
| 10 to 14 Minutes | 264 | 42.9% |
| 15 to 19 Minutes | 62 | 10.1% |
| 20 to 24 Minutes | 29 | 4.7% |
| 25 to 29 Minutes | 0 | 0.0% |
| 30 to 34 Minutes | 18 | 2.9% |
| 35 to 39 Minutes | 0 | 0.0% |
| 40 to 44 Minutes | 0 | 0.0% |
| 45 to 59 Minutes | 23 | 3.7% |
| 60 to 89 Minutes | 50 | 8.1% |
| 90 or more Minutes | 10 | 1.6% |
Commute Time by Sex in Jayuya
The most common commute times in Jayuya are 10 to 14 minutes (134 commuters, 35.2%) for males and 10 to 14 minutes (130 commuters, 55.6%) for females.
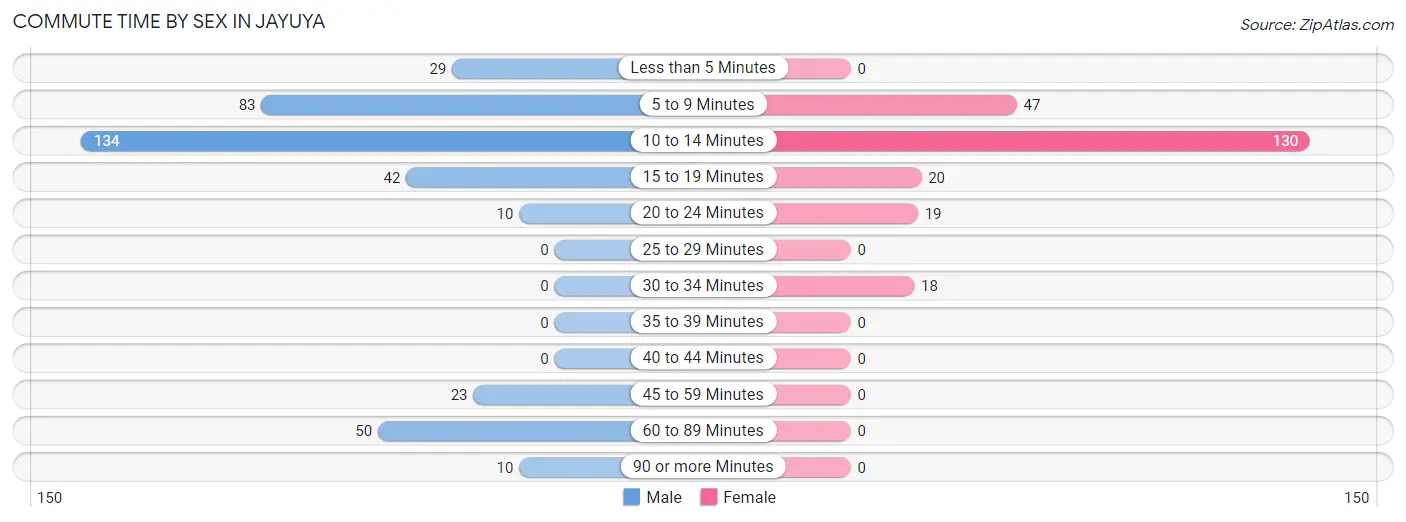
| Commute Time | Male | Female |
| Less than 5 Minutes | 29 (7.6%) | 0 (0.0%) |
| 5 to 9 Minutes | 83 (21.8%) | 47 (20.1%) |
| 10 to 14 Minutes | 134 (35.2%) | 130 (55.6%) |
| 15 to 19 Minutes | 42 (11.0%) | 20 (8.6%) |
| 20 to 24 Minutes | 10 (2.6%) | 19 (8.1%) |
| 25 to 29 Minutes | 0 (0.0%) | 0 (0.0%) |
| 30 to 34 Minutes | 0 (0.0%) | 18 (7.7%) |
| 35 to 39 Minutes | 0 (0.0%) | 0 (0.0%) |
| 40 to 44 Minutes | 0 (0.0%) | 0 (0.0%) |
| 45 to 59 Minutes | 23 (6.0%) | 0 (0.0%) |
| 60 to 89 Minutes | 50 (13.1%) | 0 (0.0%) |
| 90 or more Minutes | 10 (2.6%) | 0 (0.0%) |
Time of Departure to Work by Sex in Jayuya
The most frequent times of departure to work in Jayuya are 7:00 AM to 7:29 AM (82, 21.5%) for males and 6:30 AM to 6:59 AM (79, 33.8%) for females.
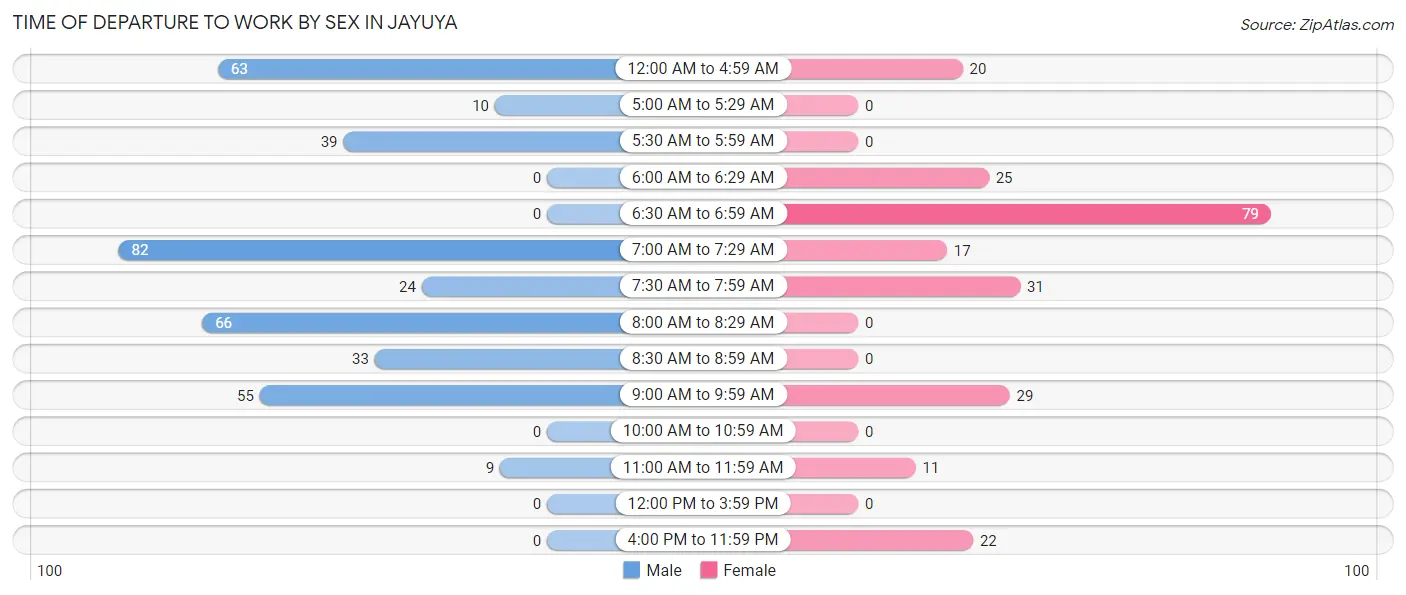
| Time of Departure | Male | Female |
| 12:00 AM to 4:59 AM | 63 (16.5%) | 20 (8.6%) |
| 5:00 AM to 5:29 AM | 10 (2.6%) | 0 (0.0%) |
| 5:30 AM to 5:59 AM | 39 (10.2%) | 0 (0.0%) |
| 6:00 AM to 6:29 AM | 0 (0.0%) | 25 (10.7%) |
| 6:30 AM to 6:59 AM | 0 (0.0%) | 79 (33.8%) |
| 7:00 AM to 7:29 AM | 82 (21.5%) | 17 (7.3%) |
| 7:30 AM to 7:59 AM | 24 (6.3%) | 31 (13.3%) |
| 8:00 AM to 8:29 AM | 66 (17.3%) | 0 (0.0%) |
| 8:30 AM to 8:59 AM | 33 (8.7%) | 0 (0.0%) |
| 9:00 AM to 9:59 AM | 55 (14.4%) | 29 (12.4%) |
| 10:00 AM to 10:59 AM | 0 (0.0%) | 0 (0.0%) |
| 11:00 AM to 11:59 AM | 9 (2.4%) | 11 (4.7%) |
| 12:00 PM to 3:59 PM | 0 (0.0%) | 0 (0.0%) |
| 4:00 PM to 11:59 PM | 0 (0.0%) | 22 (9.4%) |
| Total | 381 (100.0%) | 234 (100.0%) |
Housing Occupancy in Jayuya
Occupancy by Ownership in Jayuya
Of the total 1,040 dwellings in Jayuya, owner-occupied units account for 487 (46.8%), while renter-occupied units make up 553 (53.2%).
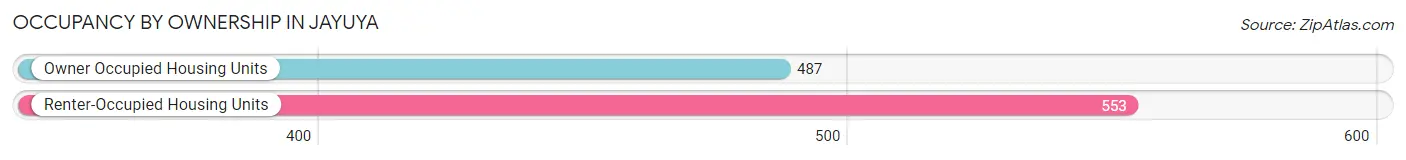
| Occupancy | # Housing Units | % Housing Units |
| Owner Occupied Housing Units | 487 | 46.8% |
| Renter-Occupied Housing Units | 553 | 53.2% |
| Total Occupied Housing Units | 1,040 | 100.0% |
Occupancy by Household Size in Jayuya
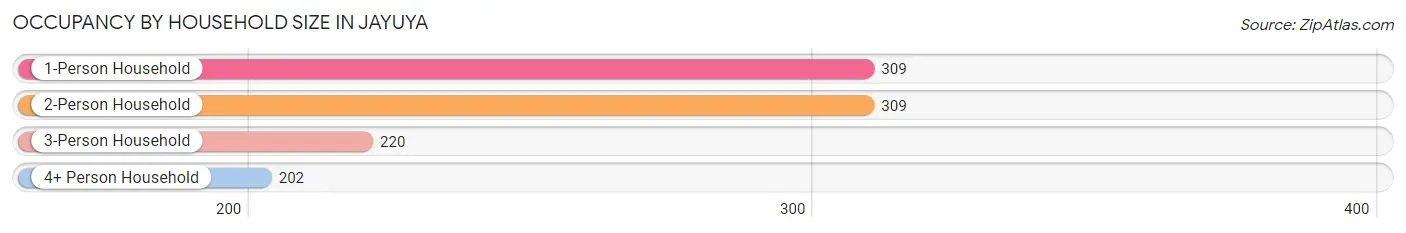
| Household Size | # Housing Units | % Housing Units |
| 1-Person Household | 309 | 29.7% |
| 2-Person Household | 309 | 29.7% |
| 3-Person Household | 220 | 21.1% |
| 4+ Person Household | 202 | 19.4% |
| Total Housing Units | 1,040 | 100.0% |
Occupancy by Ownership by Household Size in Jayuya
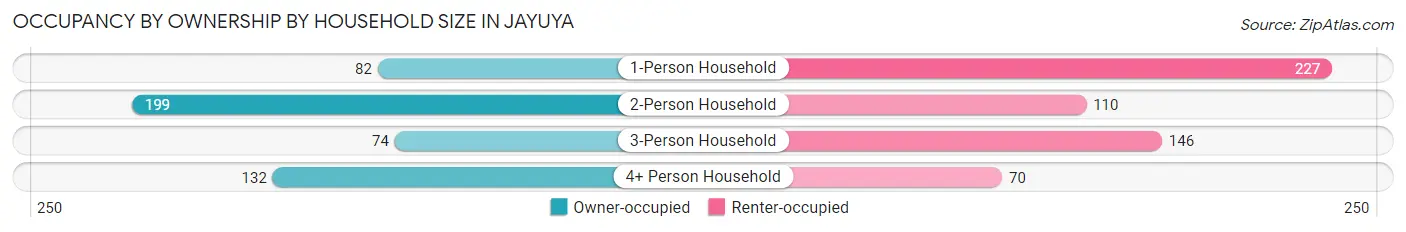
| Household Size | Owner-occupied | Renter-occupied |
| 1-Person Household | 82 (26.5%) | 227 (73.5%) |
| 2-Person Household | 199 (64.4%) | 110 (35.6%) |
| 3-Person Household | 74 (33.6%) | 146 (66.4%) |
| 4+ Person Household | 132 (65.3%) | 70 (34.6%) |
| Total Housing Units | 487 (46.8%) | 553 (53.2%) |
Occupancy by Educational Attainment in Jayuya
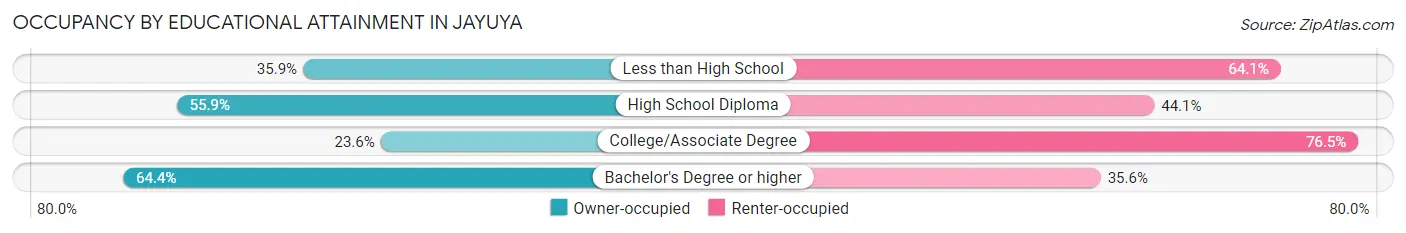
| Household Size | Owner-occupied | Renter-occupied |
| Less than High School | 52 (35.9%) | 93 (64.1%) |
| High School Diploma | 233 (55.9%) | 184 (44.1%) |
| College/Associate Degree | 61 (23.5%) | 198 (76.4%) |
| Bachelor's Degree or higher | 141 (64.4%) | 78 (35.6%) |
Occupancy by Age of Householder in Jayuya
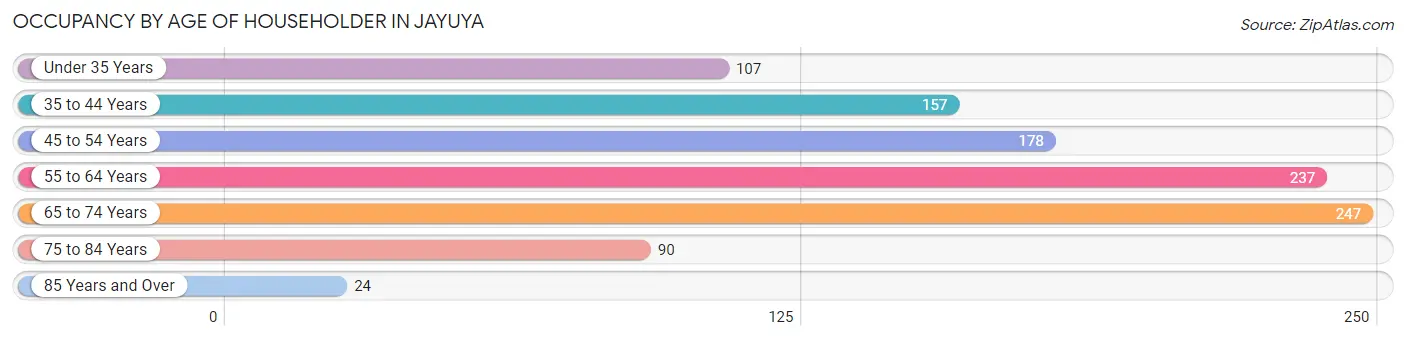
| Age Bracket | # Households | % Households |
| Under 35 Years | 107 | 10.3% |
| 35 to 44 Years | 157 | 15.1% |
| 45 to 54 Years | 178 | 17.1% |
| 55 to 64 Years | 237 | 22.8% |
| 65 to 74 Years | 247 | 23.7% |
| 75 to 84 Years | 90 | 8.6% |
| 85 Years and Over | 24 | 2.3% |
| Total | 1,040 | 100.0% |
Housing Finances in Jayuya
Median Income by Occupancy in Jayuya
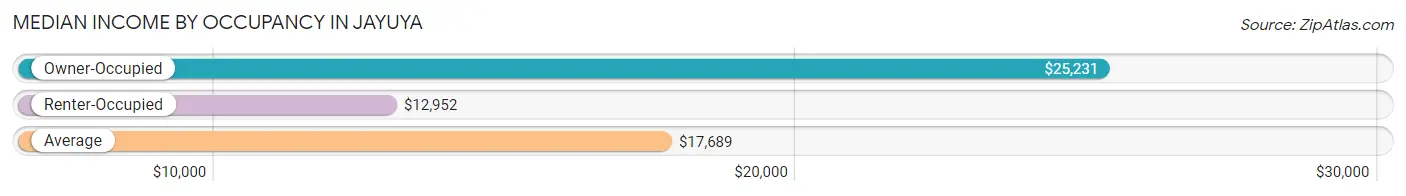
| Occupancy Type | # Households | Median Income |
| Owner-Occupied | 487 (46.8%) | $25,231 |
| Renter-Occupied | 553 (53.2%) | $12,952 |
| Average | 1,040 (100.0%) | $17,689 |
Occupancy by Householder Income Bracket in Jayuya
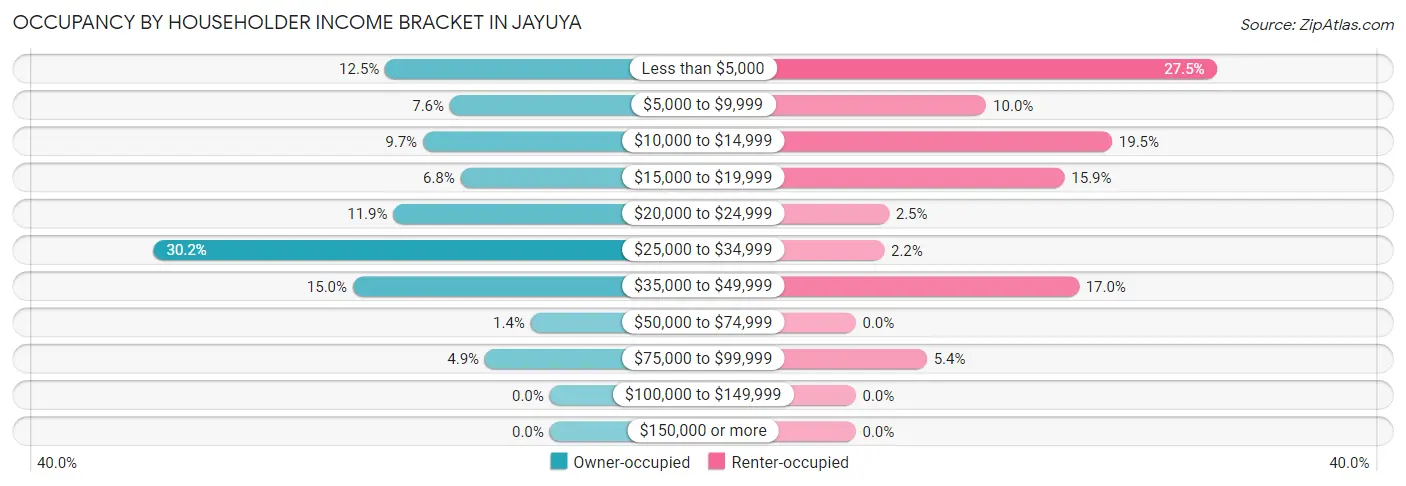
| Income Bracket | Owner-occupied | Renter-occupied |
| Less than $5,000 | 61 (12.5%) | 152 (27.5%) |
| $5,000 to $9,999 | 37 (7.6%) | 55 (10.0%) |
| $10,000 to $14,999 | 47 (9.7%) | 108 (19.5%) |
| $15,000 to $19,999 | 33 (6.8%) | 88 (15.9%) |
| $20,000 to $24,999 | 58 (11.9%) | 14 (2.5%) |
| $25,000 to $34,999 | 147 (30.2%) | 12 (2.2%) |
| $35,000 to $49,999 | 73 (15.0%) | 94 (17.0%) |
| $50,000 to $74,999 | 7 (1.4%) | 0 (0.0%) |
| $75,000 to $99,999 | 24 (4.9%) | 30 (5.4%) |
| $100,000 to $149,999 | 0 (0.0%) | 0 (0.0%) |
| $150,000 or more | 0 (0.0%) | 0 (0.0%) |
| Total | 487 (100.0%) | 553 (100.0%) |
Monthly Housing Cost Tiers in Jayuya
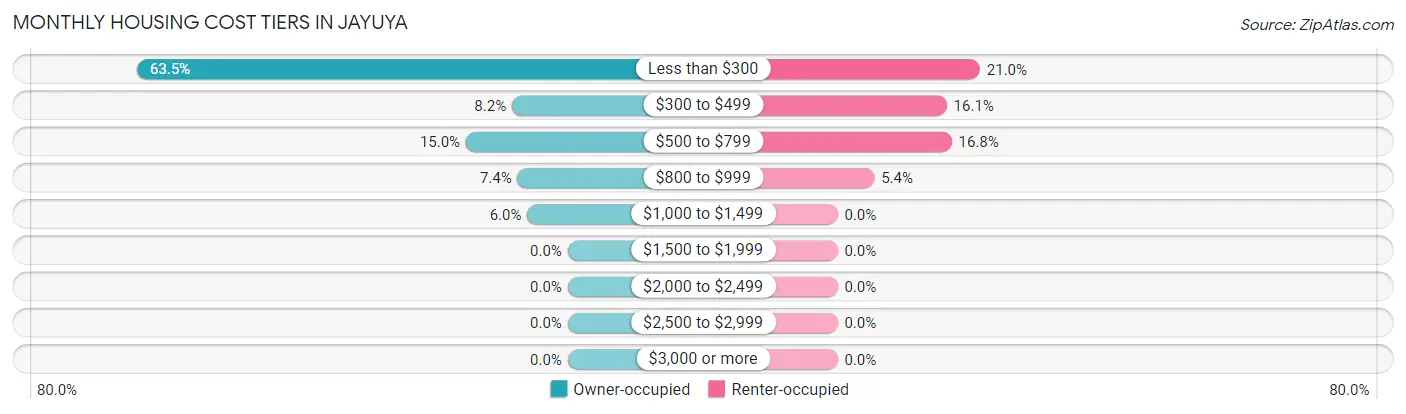
| Monthly Cost | Owner-occupied | Renter-occupied |
| Less than $300 | 309 (63.4%) | 116 (21.0%) |
| $300 to $499 | 40 (8.2%) | 89 (16.1%) |
| $500 to $799 | 73 (15.0%) | 93 (16.8%) |
| $800 to $999 | 36 (7.4%) | 30 (5.4%) |
| $1,000 to $1,499 | 29 (5.9%) | 0 (0.0%) |
| $1,500 to $1,999 | 0 (0.0%) | 0 (0.0%) |
| $2,000 to $2,499 | 0 (0.0%) | 0 (0.0%) |
| $2,500 to $2,999 | 0 (0.0%) | 0 (0.0%) |
| $3,000 or more | 0 (0.0%) | 0 (0.0%) |
| Total | 487 (100.0%) | 553 (100.0%) |
Physical Housing Characteristics in Jayuya
Housing Structures in Jayuya
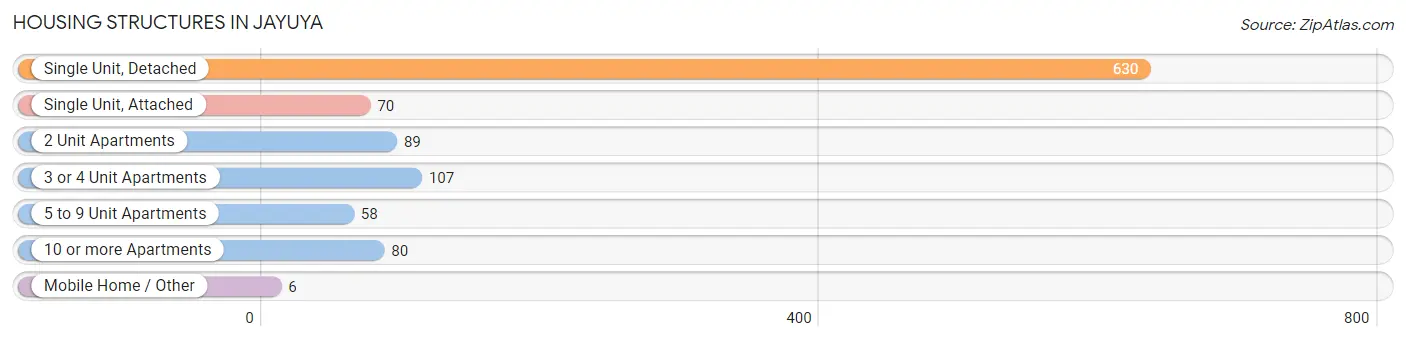
| Structure Type | # Housing Units | % Housing Units |
| Single Unit, Detached | 630 | 60.6% |
| Single Unit, Attached | 70 | 6.7% |
| 2 Unit Apartments | 89 | 8.6% |
| 3 or 4 Unit Apartments | 107 | 10.3% |
| 5 to 9 Unit Apartments | 58 | 5.6% |
| 10 or more Apartments | 80 | 7.7% |
| Mobile Home / Other | 6 | 0.6% |
| Total | 1,040 | 100.0% |
Housing Structures by Occupancy in Jayuya
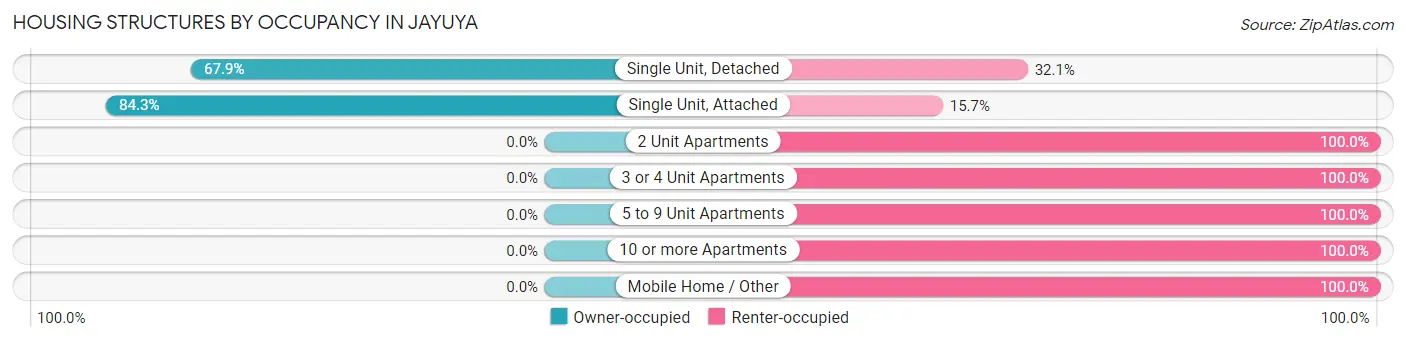
| Structure Type | Owner-occupied | Renter-occupied |
| Single Unit, Detached | 428 (67.9%) | 202 (32.1%) |
| Single Unit, Attached | 59 (84.3%) | 11 (15.7%) |
| 2 Unit Apartments | 0 (0.0%) | 89 (100.0%) |
| 3 or 4 Unit Apartments | 0 (0.0%) | 107 (100.0%) |
| 5 to 9 Unit Apartments | 0 (0.0%) | 58 (100.0%) |
| 10 or more Apartments | 0 (0.0%) | 80 (100.0%) |
| Mobile Home / Other | 0 (0.0%) | 6 (100.0%) |
| Total | 487 (46.8%) | 553 (53.2%) |
Housing Structures by Number of Rooms in Jayuya
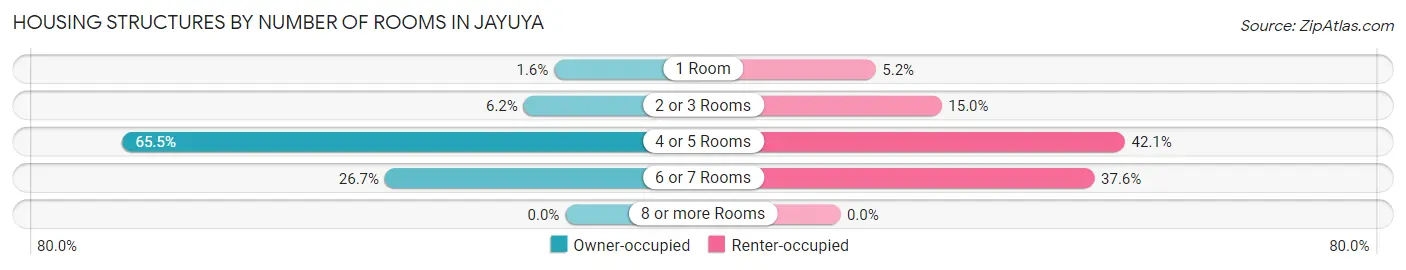
| Number of Rooms | Owner-occupied | Renter-occupied |
| 1 Room | 8 (1.6%) | 29 (5.2%) |
| 2 or 3 Rooms | 30 (6.2%) | 83 (15.0%) |
| 4 or 5 Rooms | 319 (65.5%) | 233 (42.1%) |
| 6 or 7 Rooms | 130 (26.7%) | 208 (37.6%) |
| 8 or more Rooms | 0 (0.0%) | 0 (0.0%) |
| Total | 487 (100.0%) | 553 (100.0%) |
Housing Structure by Heating Type in Jayuya
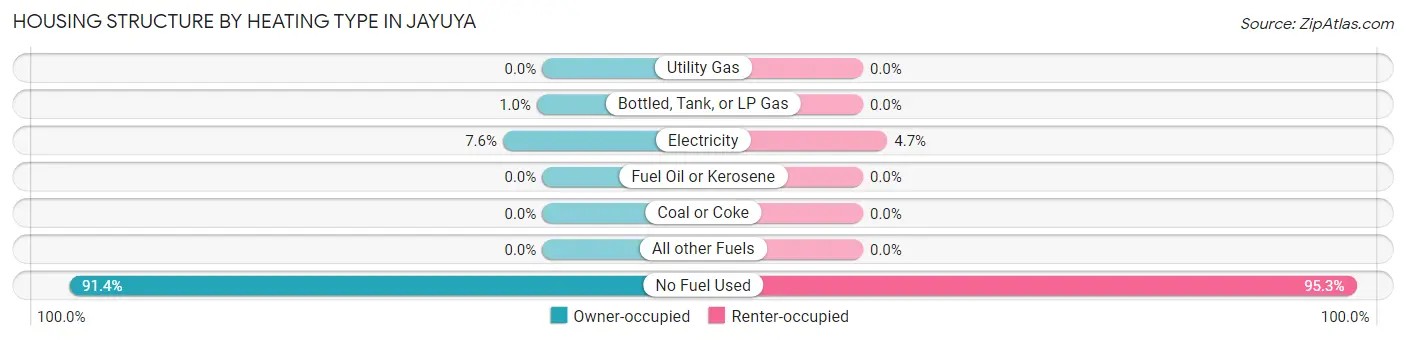
| Heating Type | Owner-occupied | Renter-occupied |
| Utility Gas | 0 (0.0%) | 0 (0.0%) |
| Bottled, Tank, or LP Gas | 5 (1.0%) | 0 (0.0%) |
| Electricity | 37 (7.6%) | 26 (4.7%) |
| Fuel Oil or Kerosene | 0 (0.0%) | 0 (0.0%) |
| Coal or Coke | 0 (0.0%) | 0 (0.0%) |
| All other Fuels | 0 (0.0%) | 0 (0.0%) |
| No Fuel Used | 445 (91.4%) | 527 (95.3%) |
| Total | 487 (100.0%) | 553 (100.0%) |
Household Vehicle Usage in Jayuya
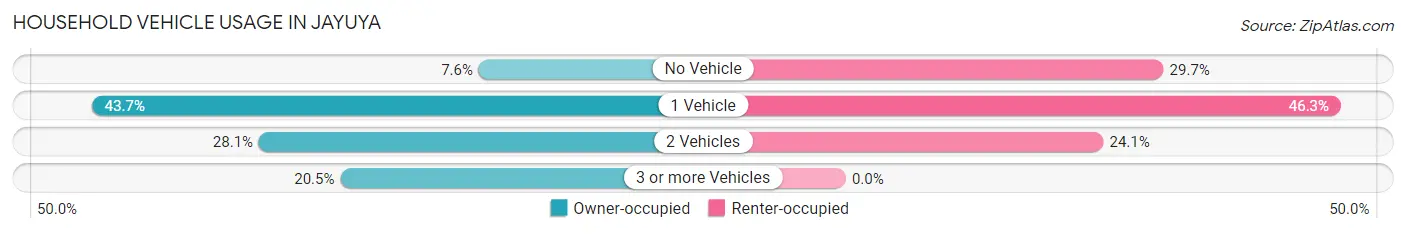
| Vehicles per Household | Owner-occupied | Renter-occupied |
| No Vehicle | 37 (7.6%) | 164 (29.7%) |
| 1 Vehicle | 213 (43.7%) | 256 (46.3%) |
| 2 Vehicles | 137 (28.1%) | 133 (24.0%) |
| 3 or more Vehicles | 100 (20.5%) | 0 (0.0%) |
| Total | 487 (100.0%) | 553 (100.0%) |
Real Estate & Mortgages in Jayuya
Real Estate and Mortgage Overview in Jayuya
| Characteristic | Without Mortgage | With Mortgage |
| Housing Units | 309 | 178 |
| Median Property Value | $92,000 | $139,300 |
| Median Household Income | $22,303 | $0 |
| Monthly Housing Costs | $144 | $0 |
| Real Estate Taxes | - | - |
Property Value by Mortgage Status in Jayuya
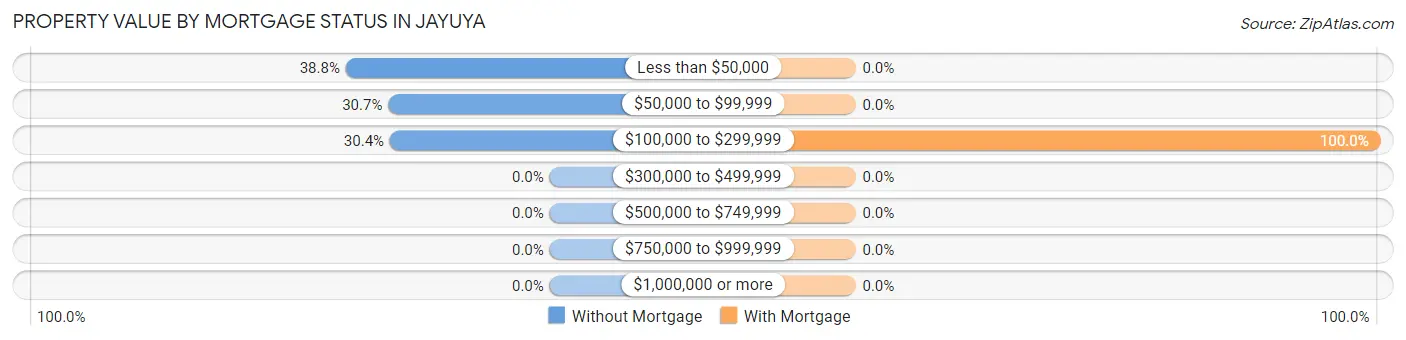
| Property Value | Without Mortgage | With Mortgage |
| Less than $50,000 | 120 (38.8%) | 0 (0.0%) |
| $50,000 to $99,999 | 95 (30.7%) | 0 (0.0%) |
| $100,000 to $299,999 | 94 (30.4%) | 178 (100.0%) |
| $300,000 to $499,999 | 0 (0.0%) | 0 (0.0%) |
| $500,000 to $749,999 | 0 (0.0%) | 0 (0.0%) |
| $750,000 to $999,999 | 0 (0.0%) | 0 (0.0%) |
| $1,000,000 or more | 0 (0.0%) | 0 (0.0%) |
| Total | 309 (100.0%) | 178 (100.0%) |
Household Income by Mortgage Status in Jayuya
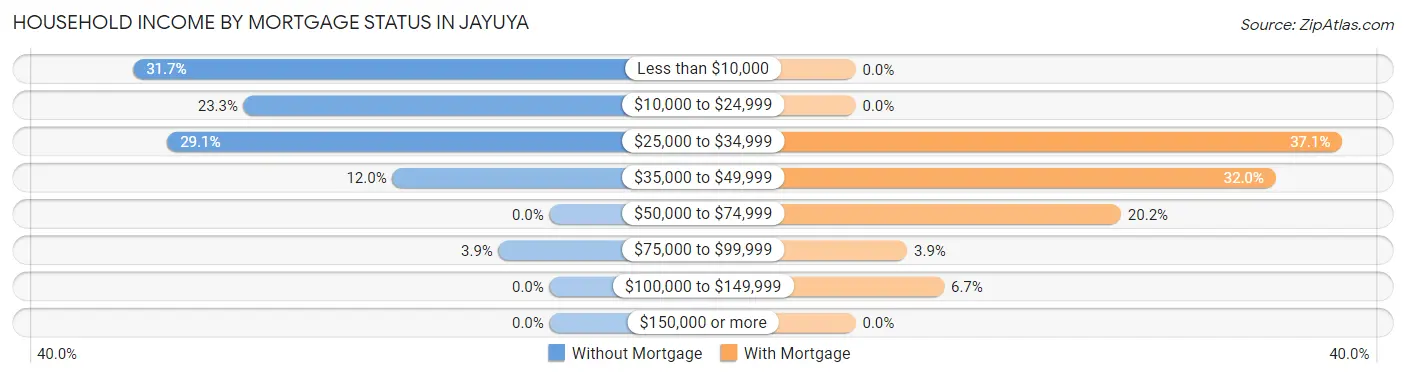
| Household Income | Without Mortgage | With Mortgage |
| Less than $10,000 | 98 (31.7%) | 0 (0.0%) |
| $10,000 to $24,999 | 72 (23.3%) | 0 (0.0%) |
| $25,000 to $34,999 | 90 (29.1%) | 66 (37.1%) |
| $35,000 to $49,999 | 37 (12.0%) | 57 (32.0%) |
| $50,000 to $74,999 | 0 (0.0%) | 36 (20.2%) |
| $75,000 to $99,999 | 12 (3.9%) | 7 (3.9%) |
| $100,000 to $149,999 | 0 (0.0%) | 12 (6.7%) |
| $150,000 or more | 0 (0.0%) | 0 (0.0%) |
| Total | 309 (100.0%) | 178 (100.0%) |
Property Value to Household Income Ratio in Jayuya
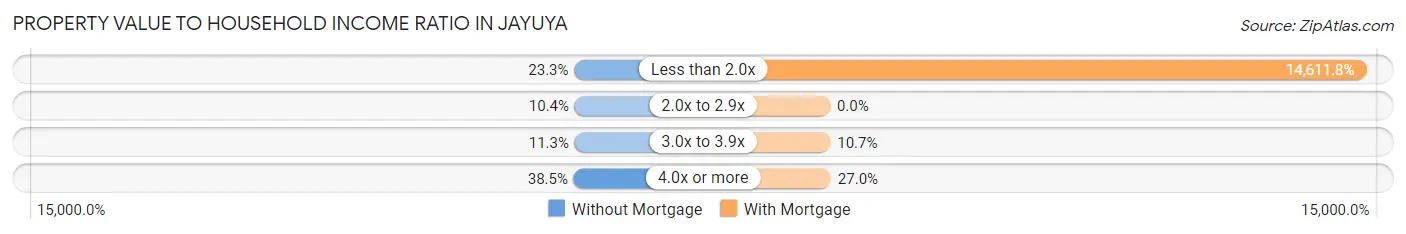
| Value-to-Income Ratio | Without Mortgage | With Mortgage |
| Less than 2.0x | 72 (23.3%) | 26,009 (14,611.8%) |
| 2.0x to 2.9x | 32 (10.4%) | 0 (0.0%) |
| 3.0x to 3.9x | 35 (11.3%) | 19 (10.7%) |
| 4.0x or more | 119 (38.5%) | 48 (27.0%) |
| Total | 309 (100.0%) | 178 (100.0%) |
Real Estate Taxes by Mortgage Status in Jayuya
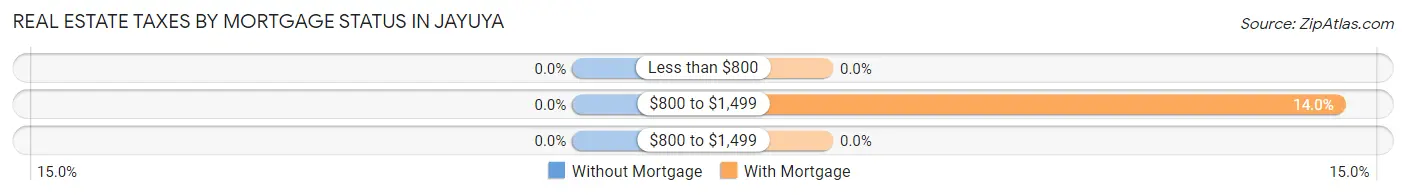
| Property Taxes | Without Mortgage | With Mortgage |
| Less than $800 | 0 (0.0%) | 0 (0.0%) |
| $800 to $1,499 | 0 (0.0%) | 25 (14.0%) |
| $800 to $1,499 | 0 (0.0%) | 0 (0.0%) |
| Total | 309 (100.0%) | 178 (100.0%) |
Health & Disability in Jayuya
Health Insurance Coverage by Age in Jayuya
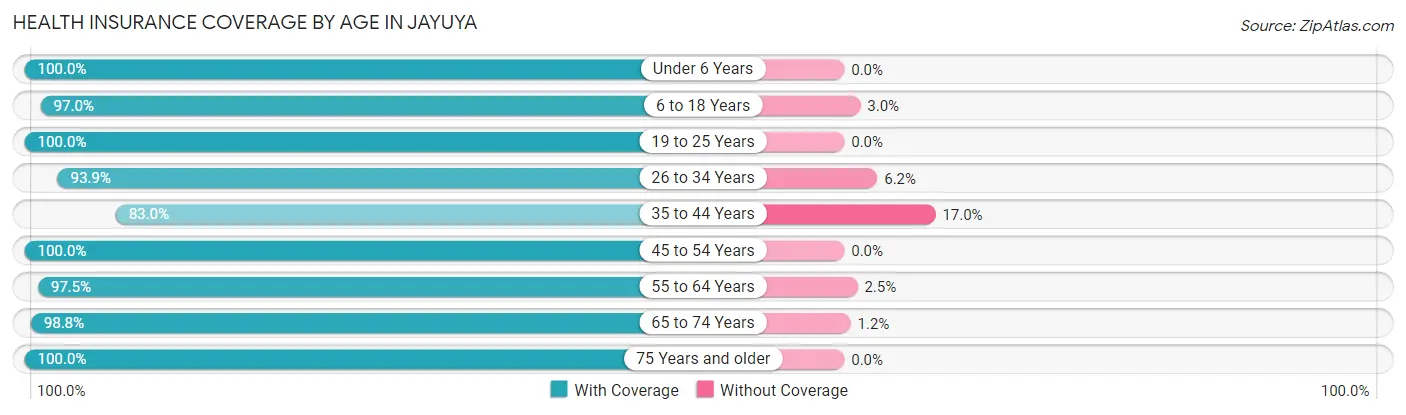
| Age Bracket | With Coverage | Without Coverage |
| Under 6 Years | 114 (100.0%) | 0 (0.0%) |
| 6 to 18 Years | 517 (97.0%) | 16 (3.0%) |
| 19 to 25 Years | 297 (100.0%) | 0 (0.0%) |
| 26 to 34 Years | 351 (93.9%) | 23 (6.1%) |
| 35 to 44 Years | 210 (83.0%) | 43 (17.0%) |
| 45 to 54 Years | 344 (100.0%) | 0 (0.0%) |
| 55 to 64 Years | 396 (97.5%) | 10 (2.5%) |
| 65 to 74 Years | 418 (98.8%) | 5 (1.2%) |
| 75 Years and older | 133 (100.0%) | 0 (0.0%) |
| Total | 2,780 (96.6%) | 97 (3.4%) |
Health Insurance Coverage by Citizenship Status in Jayuya
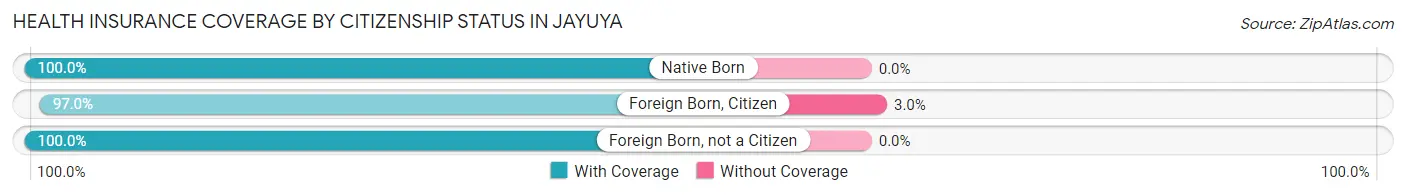
| Citizenship Status | With Coverage | Without Coverage |
| Native Born | 114 (100.0%) | 0 (0.0%) |
| Foreign Born, Citizen | 517 (97.0%) | 16 (3.0%) |
| Foreign Born, not a Citizen | 297 (100.0%) | 0 (0.0%) |
Health Insurance Coverage by Household Income in Jayuya
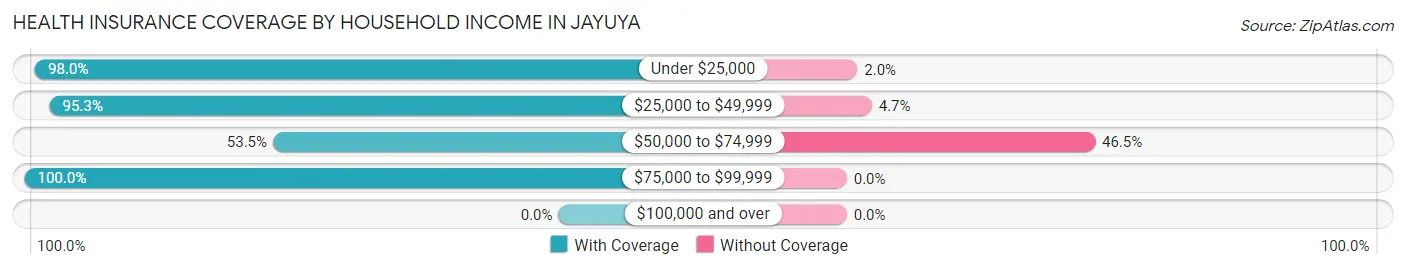
| Household Income | With Coverage | Without Coverage |
| Under $25,000 | 1,545 (98.0%) | 31 (2.0%) |
| $25,000 to $49,999 | 937 (95.3%) | 46 (4.7%) |
| $50,000 to $74,999 | 23 (53.5%) | 20 (46.5%) |
| $75,000 to $99,999 | 275 (100.0%) | 0 (0.0%) |
| $100,000 and over | 0 (0.0%) | 0 (0.0%) |
Public vs Private Health Insurance Coverage by Age in Jayuya
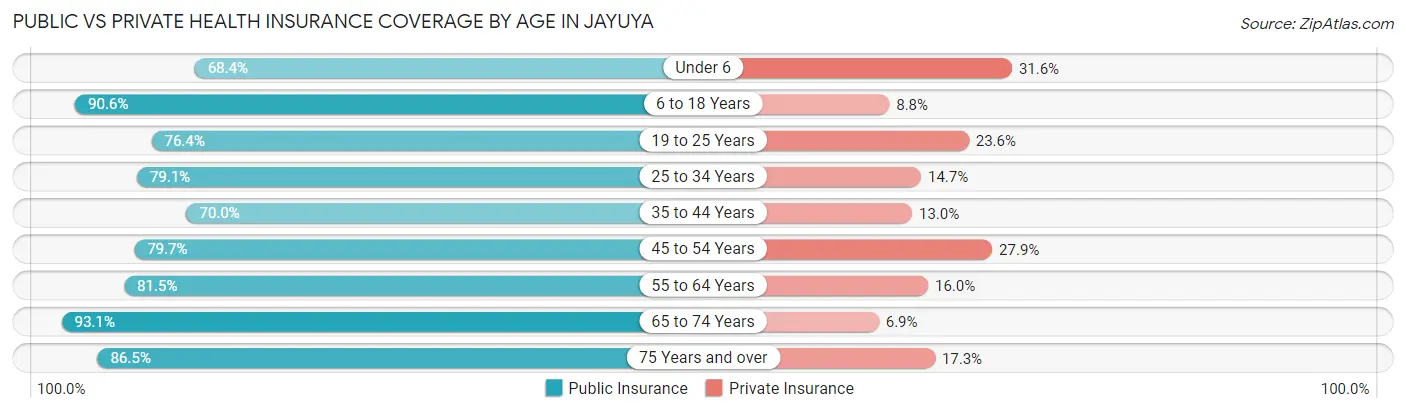
| Age Bracket | Public Insurance | Private Insurance |
| Under 6 | 78 (68.4%) | 36 (31.6%) |
| 6 to 18 Years | 483 (90.6%) | 47 (8.8%) |
| 19 to 25 Years | 227 (76.4%) | 70 (23.6%) |
| 25 to 34 Years | 296 (79.1%) | 55 (14.7%) |
| 35 to 44 Years | 177 (70.0%) | 33 (13.0%) |
| 45 to 54 Years | 274 (79.6%) | 96 (27.9%) |
| 55 to 64 Years | 331 (81.5%) | 65 (16.0%) |
| 65 to 74 Years | 394 (93.1%) | 29 (6.9%) |
| 75 Years and over | 115 (86.5%) | 23 (17.3%) |
| Total | 2,375 (82.6%) | 454 (15.8%) |
Disability Status by Sex by Age in Jayuya
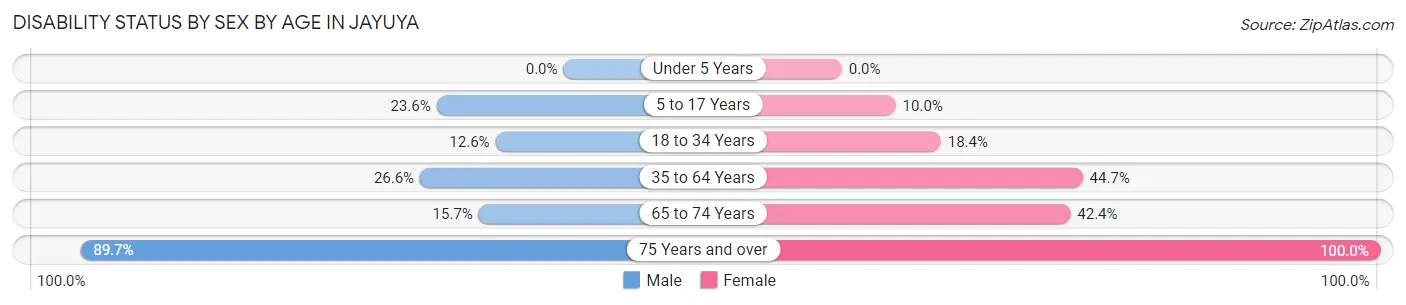
| Age Bracket | Male | Female |
| Under 5 Years | 0 (0.0%) | 0 (0.0%) |
| 5 to 17 Years | 61 (23.5%) | 25 (10.0%) |
| 18 to 34 Years | 60 (12.6%) | 43 (18.4%) |
| 35 to 64 Years | 111 (26.6%) | 262 (44.7%) |
| 65 to 74 Years | 25 (15.7%) | 112 (42.4%) |
| 75 Years and over | 52 (89.7%) | 75 (100.0%) |
Disability Class by Sex by Age in Jayuya
Disability Class: Hearing Difficulty
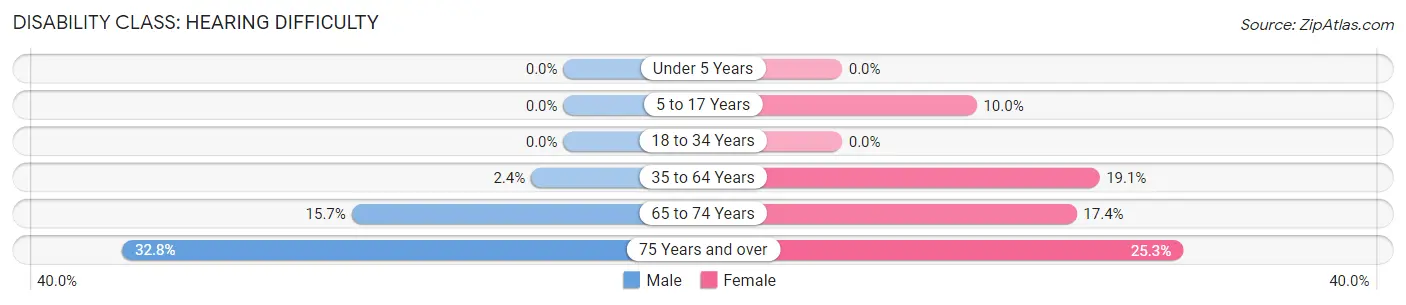
| Age Bracket | Male | Female |
| Under 5 Years | 0 (0.0%) | 0 (0.0%) |
| 5 to 17 Years | 0 (0.0%) | 25 (10.0%) |
| 18 to 34 Years | 0 (0.0%) | 0 (0.0%) |
| 35 to 64 Years | 10 (2.4%) | 112 (19.1%) |
| 65 to 74 Years | 25 (15.7%) | 46 (17.4%) |
| 75 Years and over | 19 (32.8%) | 19 (25.3%) |
Disability Class: Vision Difficulty
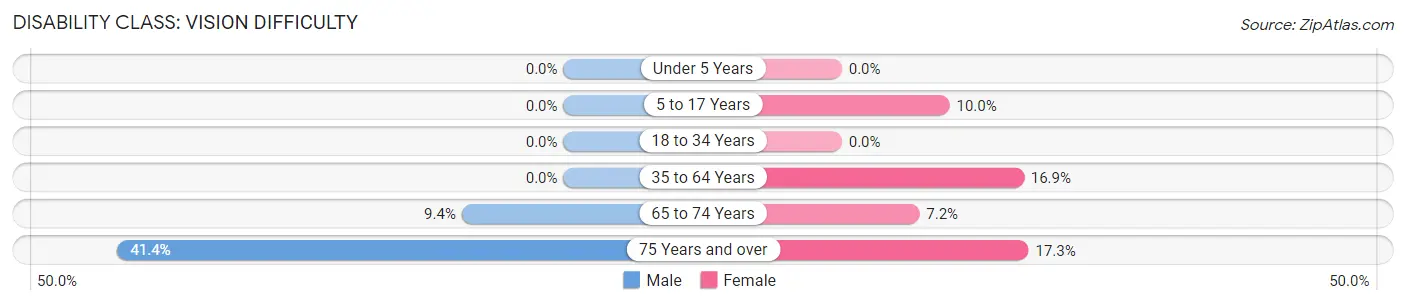
| Age Bracket | Male | Female |
| Under 5 Years | 0 (0.0%) | 0 (0.0%) |
| 5 to 17 Years | 0 (0.0%) | 25 (10.0%) |
| 18 to 34 Years | 0 (0.0%) | 0 (0.0%) |
| 35 to 64 Years | 0 (0.0%) | 99 (16.9%) |
| 65 to 74 Years | 15 (9.4%) | 19 (7.2%) |
| 75 Years and over | 24 (41.4%) | 13 (17.3%) |
Disability Class: Cognitive Difficulty
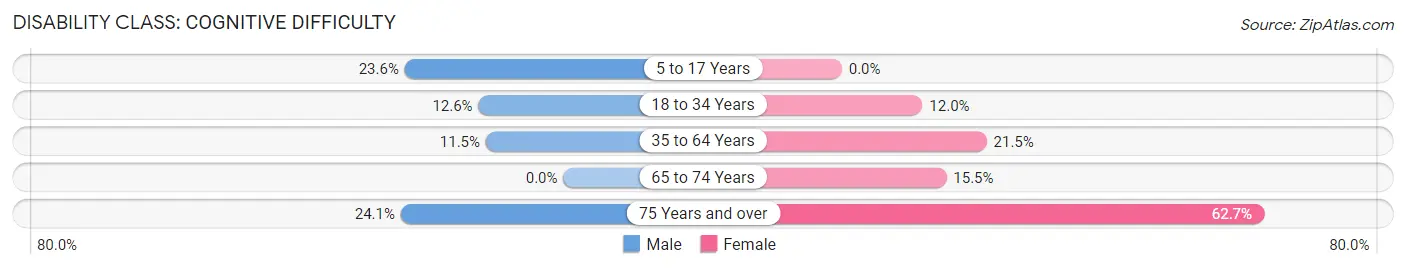
| Age Bracket | Male | Female |
| 5 to 17 Years | 61 (23.5%) | 0 (0.0%) |
| 18 to 34 Years | 60 (12.6%) | 28 (12.0%) |
| 35 to 64 Years | 48 (11.5%) | 126 (21.5%) |
| 65 to 74 Years | 0 (0.0%) | 41 (15.5%) |
| 75 Years and over | 14 (24.1%) | 47 (62.7%) |
Disability Class: Ambulatory Difficulty
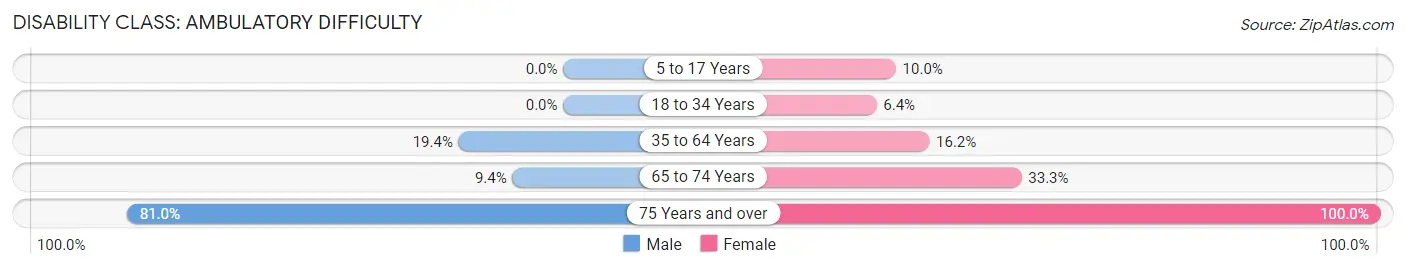
| Age Bracket | Male | Female |
| 5 to 17 Years | 0 (0.0%) | 25 (10.0%) |
| 18 to 34 Years | 0 (0.0%) | 15 (6.4%) |
| 35 to 64 Years | 81 (19.4%) | 95 (16.2%) |
| 65 to 74 Years | 15 (9.4%) | 88 (33.3%) |
| 75 Years and over | 47 (81.0%) | 75 (100.0%) |
Disability Class: Self-Care Difficulty
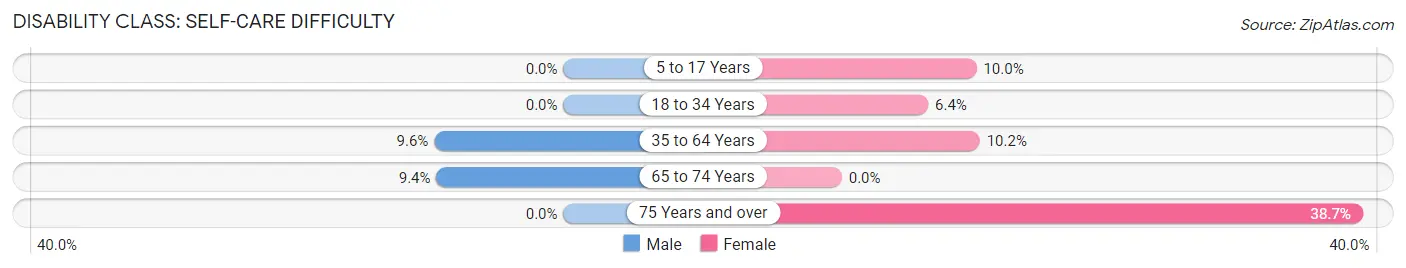
| Age Bracket | Male | Female |
| 5 to 17 Years | 0 (0.0%) | 25 (10.0%) |
| 18 to 34 Years | 0 (0.0%) | 15 (6.4%) |
| 35 to 64 Years | 40 (9.6%) | 60 (10.2%) |
| 65 to 74 Years | 15 (9.4%) | 0 (0.0%) |
| 75 Years and over | 0 (0.0%) | 29 (38.7%) |
Technology Access in Jayuya
Computing Device Access in Jayuya
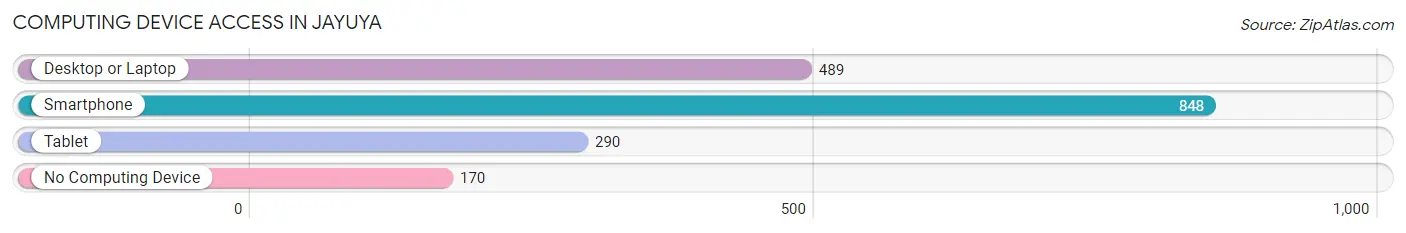
| Device Type | # Households | % Households |
| Desktop or Laptop | 489 | 47.0% |
| Smartphone | 848 | 81.5% |
| Tablet | 290 | 27.9% |
| No Computing Device | 170 | 16.4% |
| Total | 1,040 | 100.0% |
Internet Access in Jayuya
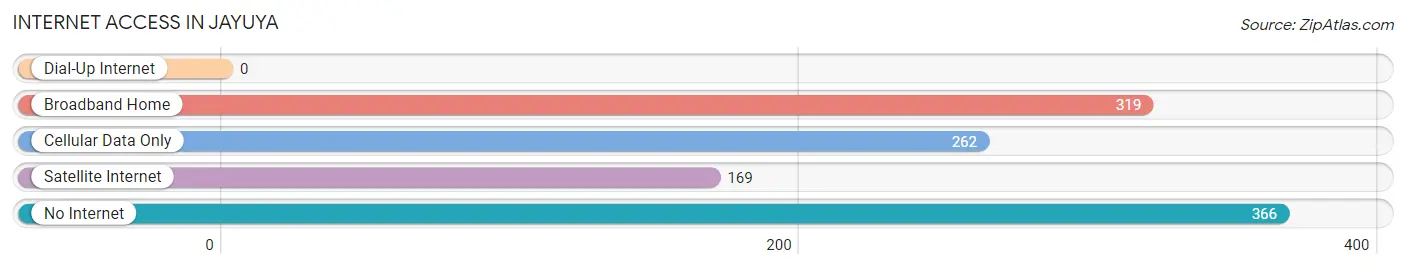
| Internet Type | # Households | % Households |
| Dial-Up Internet | 0 | 0.0% |
| Broadband Home | 319 | 30.7% |
| Cellular Data Only | 262 | 25.2% |
| Satellite Internet | 169 | 16.3% |
| No Internet | 366 | 35.2% |
| Total | 1,040 | 100.0% |
Jayuya Summary
Jayuya is a municipality located in the central mountainous region of Puerto Rico. It is the capital of the Jayuya district and is part of the Ponce metropolitan area. The town is known for its rich cultural heritage, its beautiful landscapes, and its vibrant economy.
Geography
Jayuya is located in the central mountainous region of Puerto Rico, in the Cordillera Central mountain range. It is situated at an elevation of 1,890 feet (576 meters) above sea level. The municipality covers an area of approximately 24 square miles (62 square kilometers). It is bordered by the municipalities of Utuado to the north, Ciales to the east, Ponce to the south, and Adjuntas to the west.
The terrain of Jayuya is mostly mountainous, with some flat areas in the lower elevations. The highest point in the municipality is Cerro La Torre, which has an elevation of 3,945 feet (1,202 meters). The climate in Jayuya is tropical, with temperatures ranging from the mid-70s to the mid-80s Fahrenheit (21-29 Celsius).
History
The area that is now Jayuya was originally inhabited by the Taíno people. The Taíno were a group of indigenous people who lived in the Caribbean before the arrival of Europeans. The Taíno called the area “Yayuya”, which means “place of the wind”.
In the early 16th century, the Spanish arrived in the area and began to colonize it. The town of Jayuya was founded in 1824 and was named after the Taíno name for the area. During the 19th century, the town grew and prospered due to its agricultural and livestock production.
In 1950, Jayuya was declared a municipality. Since then, the town has continued to grow and develop. In recent years, Jayuya has become a popular tourist destination due to its beautiful landscapes and cultural attractions.
Economy
The economy of Jayuya is largely based on agriculture and livestock production. The municipality is known for its production of coffee, plantains, bananas, and other fruits and vegetables. Livestock production is also important to the local economy, with cattle, pigs, and chickens being raised in the area.
In addition to agriculture and livestock production, Jayuya also has a growing tourism industry. The town is known for its beautiful landscapes, cultural attractions, and outdoor activities. Tourists come to the area to enjoy the scenery, visit the local museums, and explore the nearby forests and rivers.
Demographics
As of the 2010 census, Jayuya had a population of 11,845. The population is mostly of Puerto Rican descent, with a small percentage of people of other ethnic backgrounds. The majority of the population is Roman Catholic, with a small percentage of other religious affiliations.
The median household income in Jayuya is $17,845, which is lower than the national average. The unemployment rate in the municipality is also higher than the national average, at 11.2%.
Conclusion
Jayuya is a municipality located in the central mountainous region of Puerto Rico. It is known for its rich cultural heritage, its beautiful landscapes, and its vibrant economy. The economy of Jayuya is largely based on agriculture and livestock production, with tourism also playing an important role. The population of Jayuya is mostly of Puerto Rican descent, with a median household income of $17,845 and an unemployment rate of 11.2%.
Common Questions
What is Per Capita Income in Jayuya?
Per Capita income in Jayuya is $8,699.
What is the Median Family Income in Jayuya?
Median Family Income in Jayuya is $19,010.
What is the Median Household income in Jayuya?
Median Household Income in Jayuya is $17,689.
What is Income or Wage Gap in Jayuya?
Income or Wage Gap in Jayuya is 9.4%.
Women in Jayuya earn 90.6 cents for every dollar earned by a man.
What is Family Income Deficit in Jayuya?
Family Income Deficit in Jayuya is $11,686.
Families that are below poverty line in Jayuya earn $11,686 less on average than the poverty threshold level.
What is Inequality or Gini Index in Jayuya?
Inequality or Gini Index in Jayuya is 0.48.
What is the Total Population of Jayuya?
Total Population of Jayuya is 2,879.
What is the Total Male Population of Jayuya?
Total Male Population of Jayuya is 1,423.
What is the Total Female Population of Jayuya?
Total Female Population of Jayuya is 1,456.
What is the Ratio of Males per 100 Females in Jayuya?
There are 97.73 Males per 100 Females in Jayuya.
What is the Ratio of Females per 100 Males in Jayuya?
There are 102.32 Females per 100 Males in Jayuya.
What is the Median Population Age in Jayuya?
Median Population Age in Jayuya is 39.0 Years.
What is the Average Family Size in Jayuya
Average Family Size in Jayuya is 3.5 People.
What is the Average Household Size in Jayuya
Average Household Size in Jayuya is 2.8 People.
How Large is the Labor Force in Jayuya?
There are 939 People in the Labor Forcein in Jayuya.
What is the Percentage of People in the Labor Force in Jayuya?
40.2% of People are in the Labor Force in Jayuya.
What is the Unemployment Rate in Jayuya?
Unemployment Rate in Jayuya is 31.3%.