Florida, PR Map & Demographics
Florida Map
Florida Overview
$11,322
PER CAPITA INCOME
$28,603
AVG FAMILY INCOME
$23,292
AVG HOUSEHOLD INCOME
28.8%
WAGE / INCOME GAP [ % ]
71.2¢/ $1
WAGE / INCOME GAP [ $ ]
$11,037
FAMILY INCOME DEFICIT
0.43
INEQUALITY / GINI INDEX
4,193
TOTAL POPULATION
2,023
MALE POPULATION
2,170
FEMALE POPULATION
93.23
MALES / 100 FEMALES
107.27
FEMALES / 100 MALES
42.3
MEDIAN AGE
3.0
AVG FAMILY SIZE
2.5
AVG HOUSEHOLD SIZE
1,594
LABOR FORCE [ PEOPLE ]
44.8%
PERCENT IN LABOR FORCE
14.9%
UNEMPLOYMENT RATE
Florida Zip Codes
Income in Florida
Income Overview in Florida
Per Capita Income in Florida is $11,322, while median incomes of families and households are $28,603 and $23,292 respectively.
| Characteristic | Number | Measure |
| Per Capita Income | 4,193 | $11,322 |
| Median Family Income | 1,275 | $28,603 |
| Mean Family Income | 1,275 | $32,143 |
| Median Household Income | 1,672 | $23,292 |
| Mean Household Income | 1,672 | $27,996 |
| Income Deficit | 1,275 | $11,037 |
| Wage / Income Gap (%) | 4,193 | 28.83% |
| Wage / Income Gap ($) | 4,193 | 71.17¢ per $1 |
| Gini / Inequality Index | 4,193 | 0.43 |
Earnings by Sex in Florida
Average Earnings in Florida are $18,952, $20,996 for men and $14,943 for women, a difference of 28.8%.
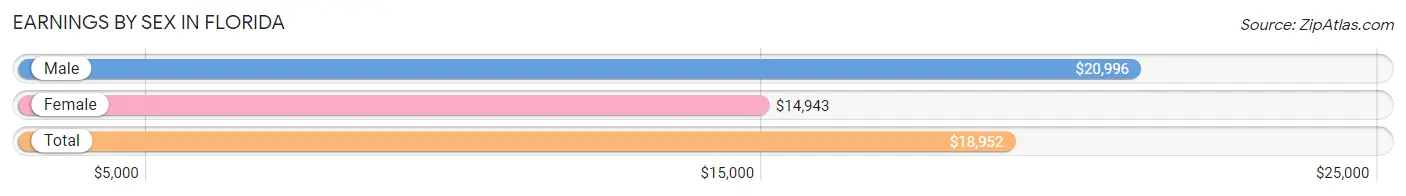
| Sex | Number | Average Earnings |
| Male | 823 (56.8%) | $20,996 |
| Female | 626 (43.2%) | $14,943 |
| Total | 1,449 (100.0%) | $18,952 |
Earnings by Sex by Income Bracket in Florida
The most common earnings brackets in Florida are $25,000 to $29,999 for men (171 | 20.8%) and $12,500 to $14,999 for women (132 | 21.1%).
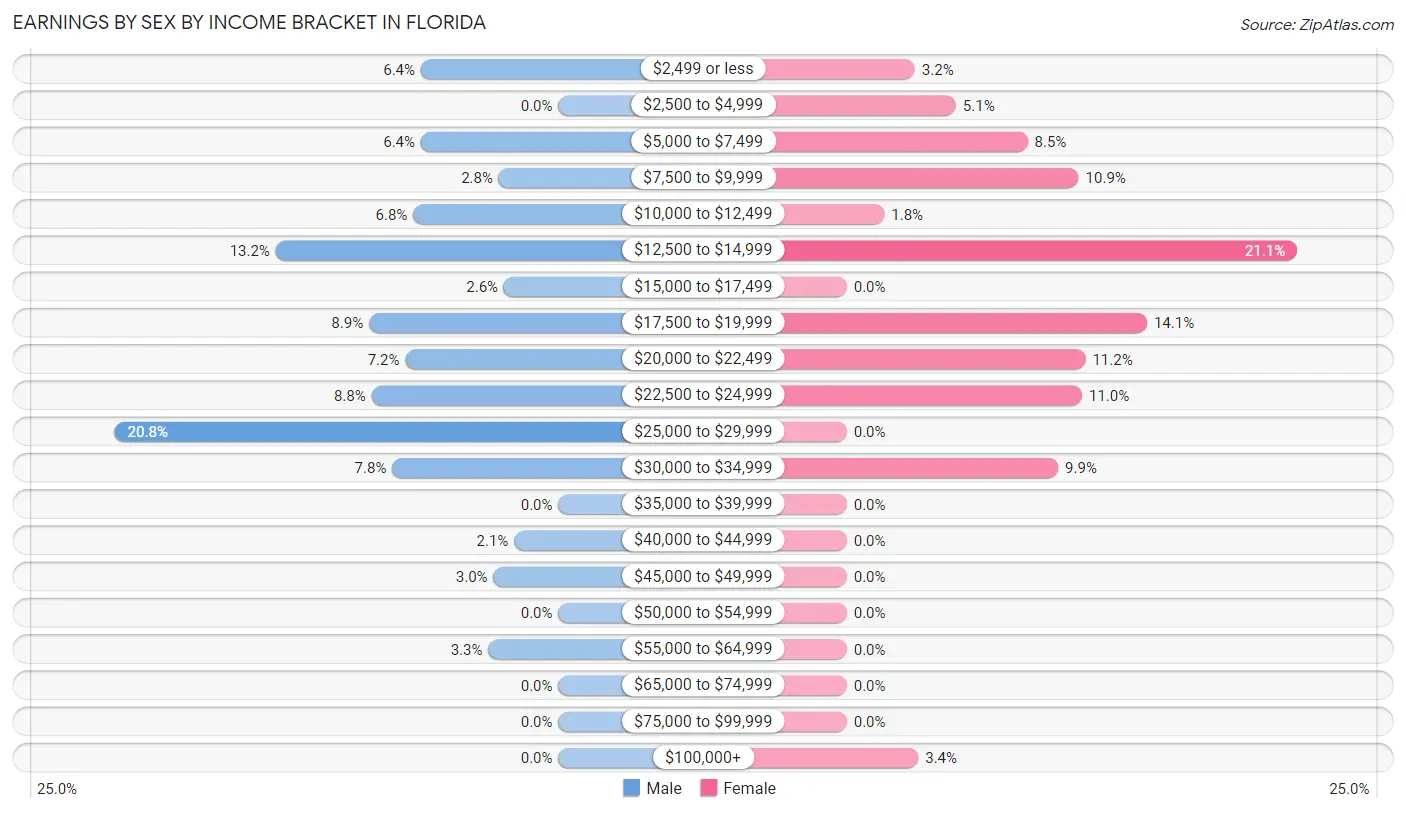
| Income | Male | Female |
| $2,499 or less | 53 (6.4%) | 20 (3.2%) |
| $2,500 to $4,999 | 0 (0.0%) | 32 (5.1%) |
| $5,000 to $7,499 | 53 (6.4%) | 53 (8.5%) |
| $7,500 to $9,999 | 23 (2.8%) | 68 (10.9%) |
| $10,000 to $12,499 | 56 (6.8%) | 11 (1.8%) |
| $12,500 to $14,999 | 109 (13.2%) | 132 (21.1%) |
| $15,000 to $17,499 | 21 (2.5%) | 0 (0.0%) |
| $17,500 to $19,999 | 73 (8.9%) | 88 (14.1%) |
| $20,000 to $22,499 | 59 (7.2%) | 70 (11.2%) |
| $22,500 to $24,999 | 72 (8.7%) | 69 (11.0%) |
| $25,000 to $29,999 | 171 (20.8%) | 0 (0.0%) |
| $30,000 to $34,999 | 64 (7.8%) | 62 (9.9%) |
| $35,000 to $39,999 | 0 (0.0%) | 0 (0.0%) |
| $40,000 to $44,999 | 17 (2.1%) | 0 (0.0%) |
| $45,000 to $49,999 | 25 (3.0%) | 0 (0.0%) |
| $50,000 to $54,999 | 0 (0.0%) | 0 (0.0%) |
| $55,000 to $64,999 | 27 (3.3%) | 0 (0.0%) |
| $65,000 to $74,999 | 0 (0.0%) | 0 (0.0%) |
| $75,000 to $99,999 | 0 (0.0%) | 0 (0.0%) |
| $100,000+ | 0 (0.0%) | 21 (3.4%) |
| Total | 823 (100.0%) | 626 (100.0%) |
Earnings by Sex by Educational Attainment in Florida
Average earnings in Florida are $21,928 for men and $19,744 for women, a difference of 10.0%. Men with an educational attainment of college or associate's degree enjoy the highest average annual earnings of $24,356, while those with less than high school education earn the least with $13,676. Women with an educational attainment of bachelor's degree earn the most with the average annual earnings of $20,568, while those with college or associate's degree education have the smallest earnings of $14,245.
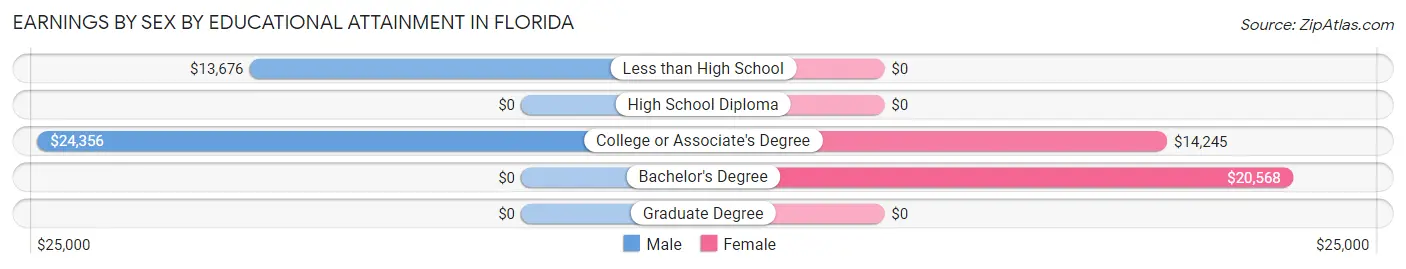
| Educational Attainment | Male Income | Female Income |
| Less than High School | $13,676 | $0 |
| High School Diploma | - | - |
| College or Associate's Degree | $24,356 | $14,245 |
| Bachelor's Degree | - | - |
| Graduate Degree | - | - |
| Total | $21,928 | $19,744 |
Family Income in Florida
Family Income Brackets in Florida
According to the Florida family income data, there are 274 families falling into the $35,000 to $49,999 income range, which is the most common income bracket and makes up 21.5% of all families.
| Income Bracket | # Families | % Families |
| Less than $10,000 | 179 | 14.0% |
| $10,000 to $14,999 | 110 | 8.6% |
| $15,000 to $24,999 | 272 | 21.3% |
| $25,000 to $34,999 | 185 | 14.5% |
| $35,000 to $49,999 | 274 | 21.5% |
| $50,000 to $74,999 | 222 | 17.4% |
| $75,000 to $99,999 | 13 | 1.0% |
| $100,000 to $149,999 | 20 | 1.6% |
| $150,000 to $199,999 | 0 | 0.0% |
| $200,000+ | 0 | 0.0% |
Family Income by Famaliy Size in Florida
3-person families (482 | 37.8%) account for the highest median family income in Florida with $38,810 per family, while 2-person families (594 | 46.6%) have the highest median income of $13,166 per family member.
| Income Bracket | # Families | Median Income |
| 2-Person Families | 594 (46.6%) | $26,333 |
| 3-Person Families | 482 (37.8%) | $38,810 |
| 4-Person Families | 159 (12.5%) | $0 |
| 5-Person Families | 40 (3.1%) | $0 |
| 6-Person Families | 0 (0.0%) | $0 |
| 7+ Person Families | 0 (0.0%) | $0 |
| Total | 1,275 (100.0%) | $28,603 |
Family Income by Number of Earners in Florida
| Number of Earners | # Families | Median Income |
| No Earners | 392 (30.7%) | $18,418 |
| 1 Earner | 596 (46.8%) | $30,385 |
| 2 Earners | 255 (20.0%) | $55,373 |
| 3+ Earners | 32 (2.5%) | $0 |
| Total | 1,275 (100.0%) | $28,603 |
Household Income in Florida
Household Income Brackets in Florida
With 383 households falling in the category, the less than $10,000 income range is the most frequent in Florida, accounting for 22.9% of all households.
| Income Bracket | # Households | % Households |
| Less than $10,000 | 383 | 22.9% |
| $10,000 to $14,999 | 181 | 10.8% |
| $15,000 to $24,999 | 354 | 21.2% |
| $25,000 to $34,999 | 186 | 11.1% |
| $35,000 to $49,999 | 313 | 18.7% |
| $50,000 to $74,999 | 222 | 13.3% |
| $75,000 to $99,999 | 13 | 0.8% |
| $100,000 to $149,999 | 22 | 1.3% |
| $150,000 to $199,999 | 0 | 0.0% |
| $200,000+ | 0 | 0.0% |
Household Income by Householder Age in Florida
The median household income in Florida is $23,292, with the highest median household income of $24,679 found in the 45 to 64 years age bracket for the primary householder. A total of 626 households (37.4%) fall into this category. Meanwhile, the 15 to 24 years age bracket for the primary householder has the lowest median household income of $0, with 53 households (3.2%) in this group.
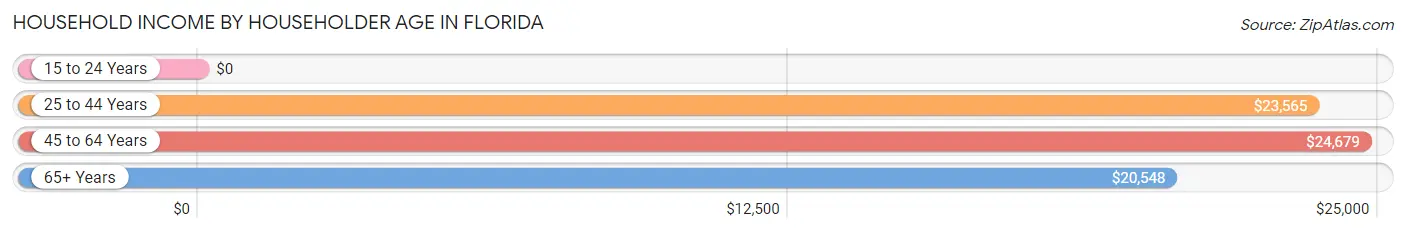
| Income Bracket | # Households | Median Income |
| 15 to 24 Years | 53 (3.2%) | $0 |
| 25 to 44 Years | 325 (19.4%) | $23,565 |
| 45 to 64 Years | 626 (37.4%) | $24,679 |
| 65+ Years | 668 (40.0%) | $20,548 |
| Total | 1,672 (100.0%) | $23,292 |
Poverty in Florida
Income Below Poverty by Sex and Age in Florida
With 43.0% poverty level for males and 52.4% for females among the residents of Florida, under 5 year old males and under 5 year old females are the most vulnerable to poverty, with 31 males (100.0%) and 141 females (80.6%) in their respective age groups living below the poverty level.
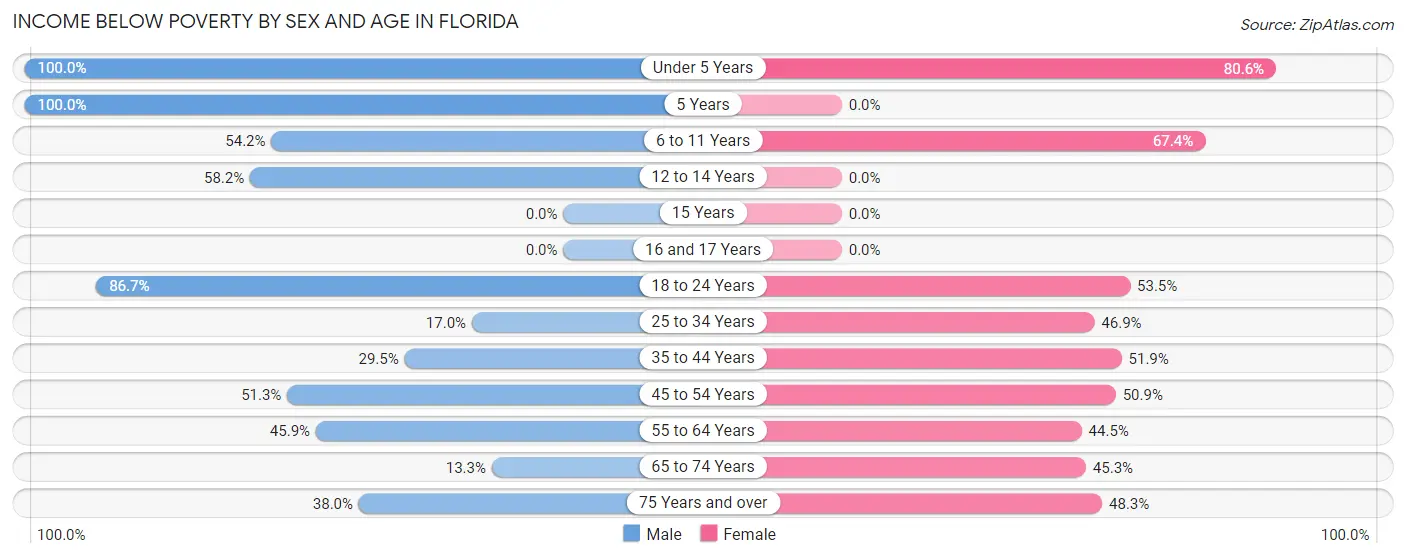
| Age Bracket | Male | Female |
| Under 5 Years | 31 (100.0%) | 141 (80.6%) |
| 5 Years | 23 (100.0%) | 0 (0.0%) |
| 6 to 11 Years | 71 (54.2%) | 91 (67.4%) |
| 12 to 14 Years | 82 (58.2%) | 0 (0.0%) |
| 15 Years | 0 (0.0%) | 0 (0.0%) |
| 16 and 17 Years | 0 (0.0%) | 0 (0.0%) |
| 18 to 24 Years | 202 (86.7%) | 152 (53.5%) |
| 25 to 34 Years | 56 (17.0%) | 83 (46.9%) |
| 35 to 44 Years | 74 (29.5%) | 147 (51.9%) |
| 45 to 54 Years | 122 (51.3%) | 90 (50.8%) |
| 55 to 64 Years | 96 (45.9%) | 138 (44.5%) |
| 65 to 74 Years | 19 (13.3%) | 145 (45.3%) |
| 75 Years and over | 93 (38.0%) | 144 (48.3%) |
| Total | 869 (43.0%) | 1,131 (52.4%) |
Income Above Poverty by Sex and Age in Florida
According to the poverty statistics in Florida, males aged 16 and 17 years and females aged 55 to 64 years are the age groups that are most secure financially, with 100.0% of males and 55.5% of females in these age groups living above the poverty line.
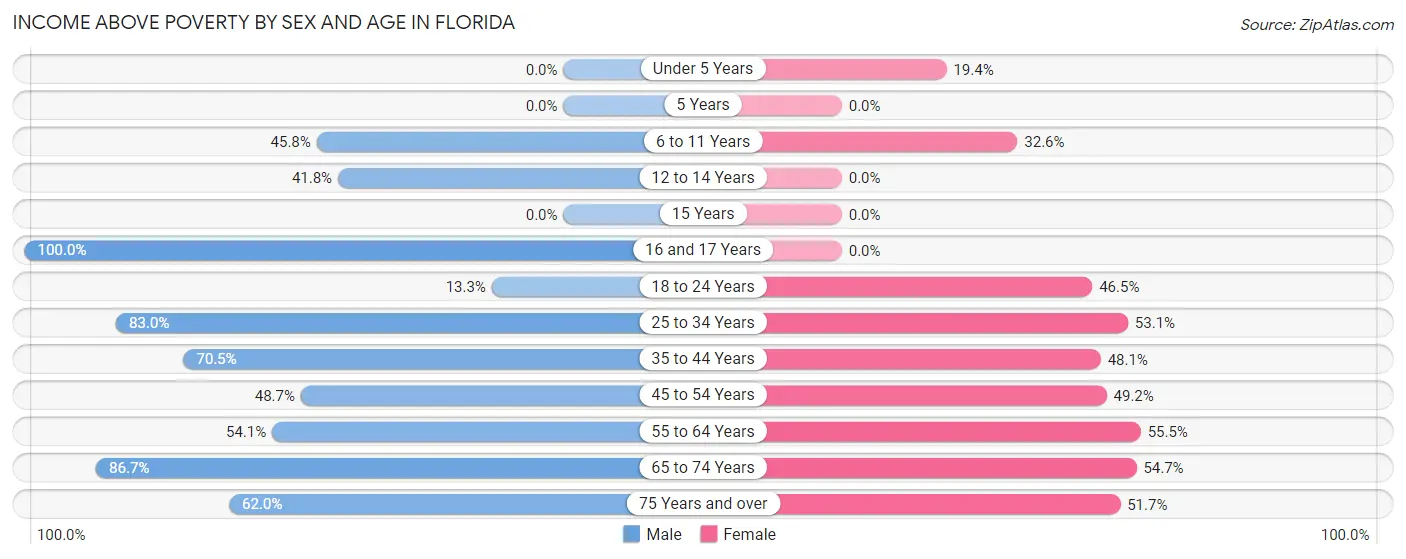
| Age Bracket | Male | Female |
| Under 5 Years | 0 (0.0%) | 34 (19.4%) |
| 5 Years | 0 (0.0%) | 0 (0.0%) |
| 6 to 11 Years | 60 (45.8%) | 44 (32.6%) |
| 12 to 14 Years | 59 (41.8%) | 0 (0.0%) |
| 15 Years | 0 (0.0%) | 0 (0.0%) |
| 16 and 17 Years | 48 (100.0%) | 0 (0.0%) |
| 18 to 24 Years | 31 (13.3%) | 132 (46.5%) |
| 25 to 34 Years | 274 (83.0%) | 94 (53.1%) |
| 35 to 44 Years | 177 (70.5%) | 136 (48.1%) |
| 45 to 54 Years | 116 (48.7%) | 87 (49.1%) |
| 55 to 64 Years | 113 (54.1%) | 172 (55.5%) |
| 65 to 74 Years | 124 (86.7%) | 175 (54.7%) |
| 75 Years and over | 152 (62.0%) | 154 (51.7%) |
| Total | 1,154 (57.0%) | 1,028 (47.6%) |
Income Below Poverty Among Married-Couple Families in Florida
The poverty statistics for married-couple families in Florida show that 34.6% or 245 of the total 707 families live below the poverty line. Families with 1 or 2 children have the highest poverty rate of 57.8%, comprising of 108 families. On the other hand, families with no children have the lowest poverty rate of 26.4%, which includes 137 families.
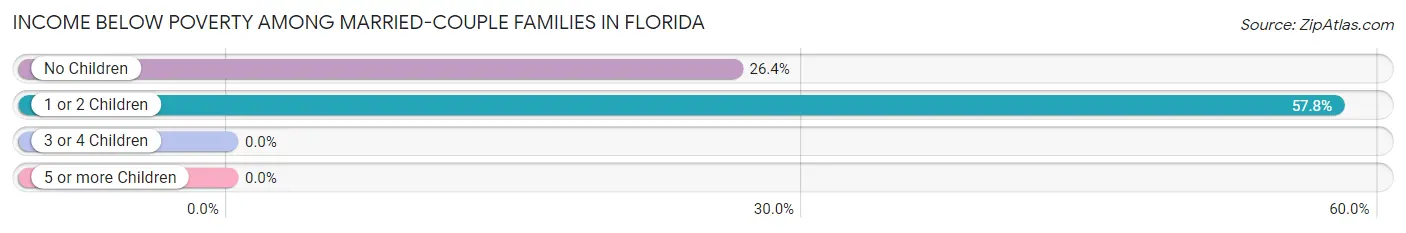
| Children | Above Poverty | Below Poverty |
| No Children | 383 (73.7%) | 137 (26.4%) |
| 1 or 2 Children | 79 (42.2%) | 108 (57.8%) |
| 3 or 4 Children | 0 (0.0%) | 0 (0.0%) |
| 5 or more Children | 0 (0.0%) | 0 (0.0%) |
| Total | 462 (65.3%) | 245 (34.6%) |
Income Below Poverty Among Single-Parent Households in Florida
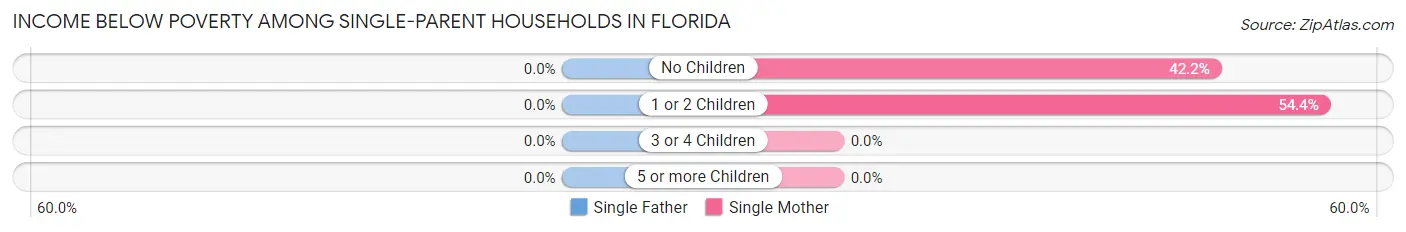
| Children | Single Father | Single Mother |
| No Children | 0 (0.0%) | 106 (42.2%) |
| 1 or 2 Children | 0 (0.0%) | 148 (54.4%) |
| 3 or 4 Children | 0 (0.0%) | 0 (0.0%) |
| 5 or more Children | 0 (0.0%) | 0 (0.0%) |
| Total | 0 (0.0%) | 254 (48.6%) |
Income Below Poverty Among Married-Couple vs Single-Parent Households in Florida
The poverty data for Florida shows that 245 of the married-couple family households (34.6%) and 254 of the single-parent households (44.7%) are living below the poverty level. Within the married-couple family households, those with 1 or 2 children have the highest poverty rate, with 108 households (57.8%) falling below the poverty line. Among the single-parent households, those with 1 or 2 children have the highest poverty rate, with 148 household (46.7%) living below poverty.
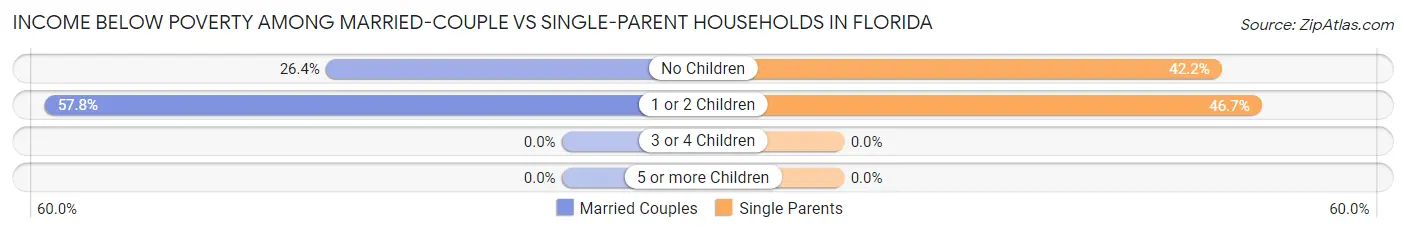
| Children | Married-Couple Families | Single-Parent Households |
| No Children | 137 (26.4%) | 106 (42.2%) |
| 1 or 2 Children | 108 (57.8%) | 148 (46.7%) |
| 3 or 4 Children | 0 (0.0%) | 0 (0.0%) |
| 5 or more Children | 0 (0.0%) | 0 (0.0%) |
| Total | 245 (34.6%) | 254 (44.7%) |
Race in Florida
The most populous races in Florida are Hispanic or Latino (4,175 | 99.6%), White / Caucasian (1,978 | 47.2%), and Two or more Races (1,501 | 35.8%).
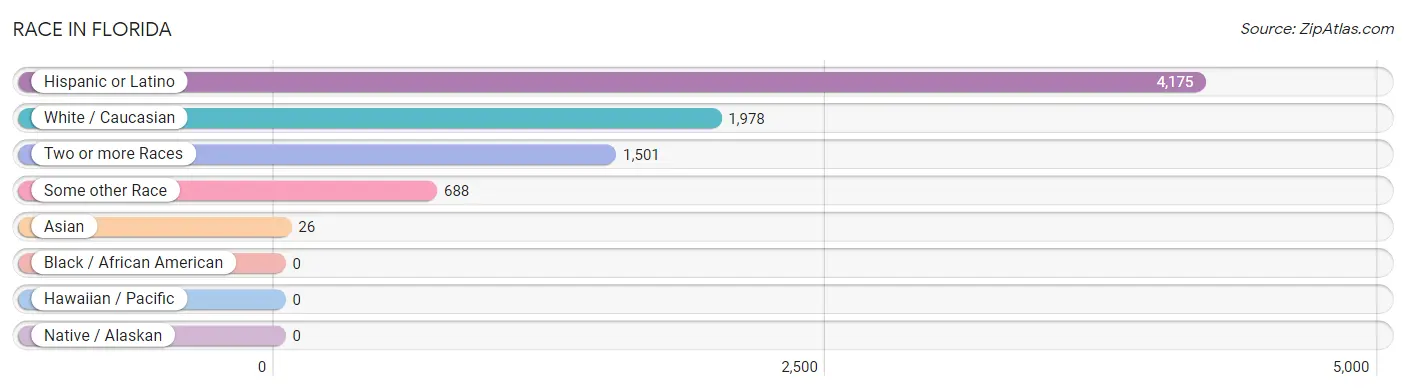
| Race | # Population | % Population |
| Asian | 26 | 0.6% |
| Black / African American | 0 | 0.0% |
| Hawaiian / Pacific | 0 | 0.0% |
| Hispanic or Latino | 4,175 | 99.6% |
| Native / Alaskan | 0 | 0.0% |
| White / Caucasian | 1,978 | 47.2% |
| Two or more Races | 1,501 | 35.8% |
| Some other Race | 688 | 16.4% |
| Total | 4,193 | 100.0% |
Ancestry in Florida
The most populous ancestries reported in Florida are Puerto Rican (4,175 | 99.6%), American (44 | 1.1%), and Thai (26 | 0.6%), together accounting for 101.2% of all Florida residents.
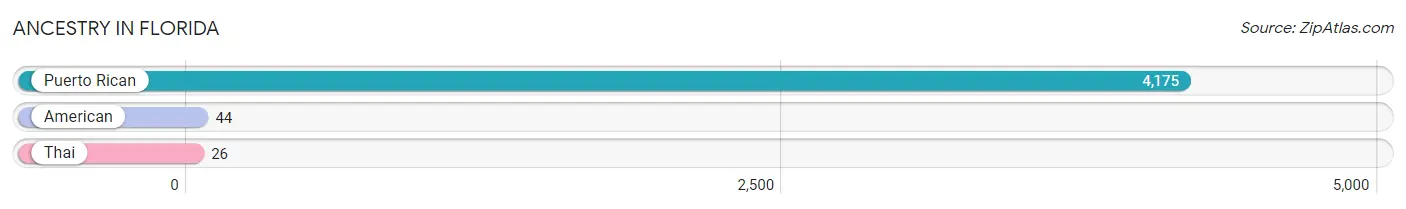
| Ancestry | # Population | % Population |
| American | 44 | 1.1% |
| Puerto Rican | 4,175 | 99.6% |
| Thai | 26 | 0.6% | View All 3 Rows |
Immigrants in Florida

| Immigration Origin | # Population | % Population | View All 0 Rows |
Sex and Age in Florida
Sex and Age in Florida
The most populous age groups in Florida are 30 to 34 Years (254 | 12.6%) for men and 20 to 24 Years (252 | 11.6%) for women.
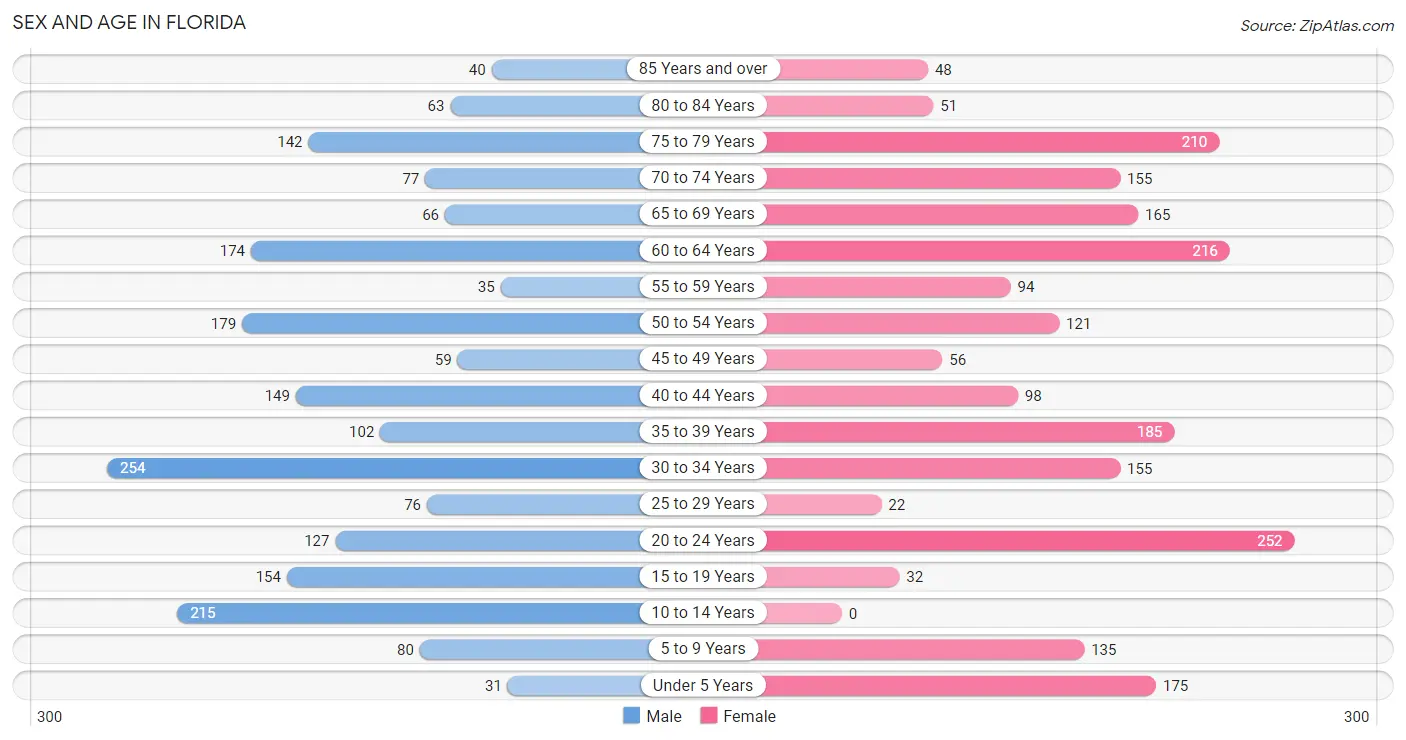
| Age Bracket | Male | Female |
| Under 5 Years | 31 (1.5%) | 175 (8.1%) |
| 5 to 9 Years | 80 (4.0%) | 135 (6.2%) |
| 10 to 14 Years | 215 (10.6%) | 0 (0.0%) |
| 15 to 19 Years | 154 (7.6%) | 32 (1.5%) |
| 20 to 24 Years | 127 (6.3%) | 252 (11.6%) |
| 25 to 29 Years | 76 (3.8%) | 22 (1.0%) |
| 30 to 34 Years | 254 (12.6%) | 155 (7.1%) |
| 35 to 39 Years | 102 (5.0%) | 185 (8.5%) |
| 40 to 44 Years | 149 (7.4%) | 98 (4.5%) |
| 45 to 49 Years | 59 (2.9%) | 56 (2.6%) |
| 50 to 54 Years | 179 (8.8%) | 121 (5.6%) |
| 55 to 59 Years | 35 (1.7%) | 94 (4.3%) |
| 60 to 64 Years | 174 (8.6%) | 216 (10.0%) |
| 65 to 69 Years | 66 (3.3%) | 165 (7.6%) |
| 70 to 74 Years | 77 (3.8%) | 155 (7.1%) |
| 75 to 79 Years | 142 (7.0%) | 210 (9.7%) |
| 80 to 84 Years | 63 (3.1%) | 51 (2.4%) |
| 85 Years and over | 40 (2.0%) | 48 (2.2%) |
| Total | 2,023 (100.0%) | 2,170 (100.0%) |
Families and Households in Florida
Median Family Size in Florida
The median family size in Florida is 2.96 persons per family, with single female/mother families (523 | 41.0%) accounting for the largest median family size of 2.99 persons per family. On the other hand, single male/father families (45 | 3.5%) represent the smallest median family size with 2.56 persons per family.
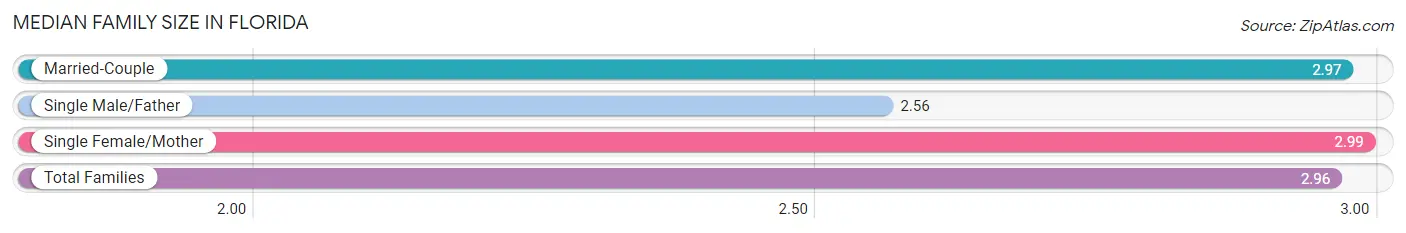
| Family Type | # Families | Family Size |
| Married-Couple | 707 (55.4%) | 2.97 |
| Single Male/Father | 45 (3.5%) | 2.56 |
| Single Female/Mother | 523 (41.0%) | 2.99 |
| Total Families | 1,275 (100.0%) | 2.96 |
Median Household Size in Florida
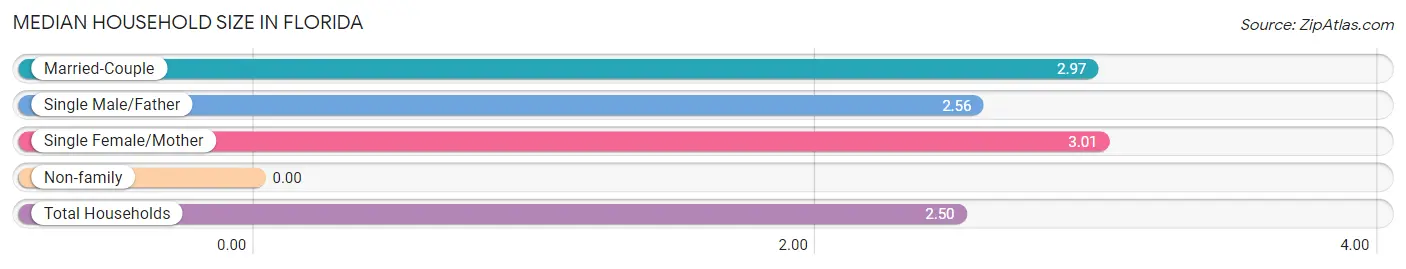
| Household Type | # Households | Household Size |
| Married-Couple | 707 (42.3%) | 2.97 |
| Single Male/Father | 45 (2.7%) | 2.56 |
| Single Female/Mother | 523 (31.3%) | 3.01 |
| Non-family | 397 (23.7%) | - |
| Total Households | 1,672 (100.0%) | 2.50 |
Household Size by Marriage Status in Florida
Out of a total of 1,672 households in Florida, 1,275 (76.3%) are family households, while 397 (23.7%) are nonfamily households. The most numerous type of family households are 2-person households, comprising 572, and the most common type of nonfamily households are 1-person households, comprising 397.
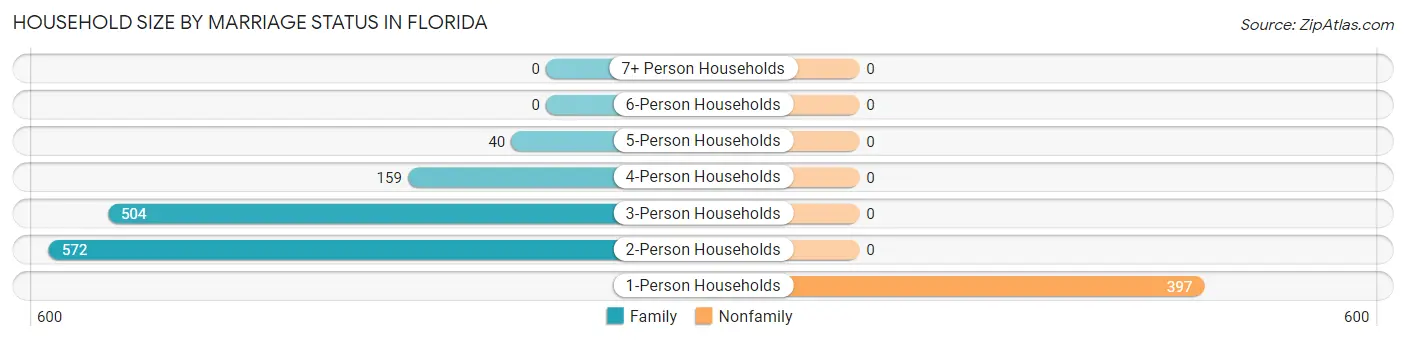
| Household Size | Family Households | Nonfamily Households |
| 1-Person Households | - | 397 (23.7%) |
| 2-Person Households | 572 (34.2%) | 0 (0.0%) |
| 3-Person Households | 504 (30.1%) | 0 (0.0%) |
| 4-Person Households | 159 (9.5%) | 0 (0.0%) |
| 5-Person Households | 40 (2.4%) | 0 (0.0%) |
| 6-Person Households | 0 (0.0%) | 0 (0.0%) |
| 7+ Person Households | 0 (0.0%) | 0 (0.0%) |
| Total | 1,275 (76.3%) | 397 (23.7%) |
Female Fertility in Florida
Fertility by Age in Florida
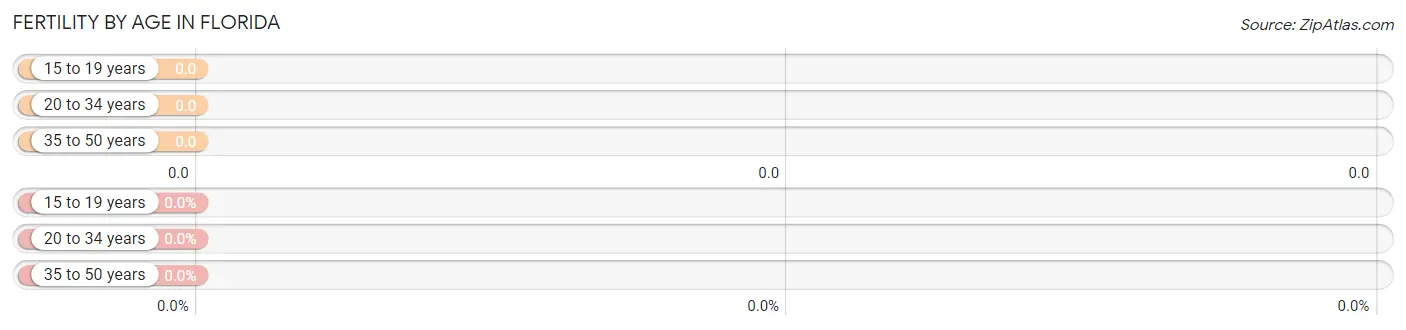
| Age Bracket | Women with Births | Births / 1,000 Women |
| 15 to 19 years | 0 (0.0%) | 0.0 |
| 20 to 34 years | 0 (0.0%) | 0.0 |
| 35 to 50 years | 0 (0.0%) | 0.0 |
| Total | 0 (0.0%) | 0.0 |
Fertility by Age by Marriage Status in Florida
| Age Bracket | Married | Unmarried |
| 15 to 19 years | 0 (0.0%) | 0 (0.0%) |
| 20 to 34 years | 0 (0.0%) | 0 (0.0%) |
| 35 to 50 years | 0 (0.0%) | 0 (0.0%) |
| Total | 0 (0.0%) | 0 (0.0%) |
Fertility by Education in Florida
| Educational Attainment | Women with Births | Births / 1,000 Women |
| Less than High School | 0 (0.0%) | 0.0 |
| High School Diploma | 0 (0.0%) | 0.0 |
| College or Associate's Degree | 0 (0.0%) | 0.0 |
| Bachelor's Degree | 0 (0.0%) | 0.0 |
| Graduate Degree | 0 (0.0%) | 0.0 |
| Total | 0 (0.0%) | 0.0 |
Fertility by Education by Marriage Status in Florida
| Educational Attainment | Married | Unmarried |
| Less than High School | 0 (0.0%) | 0 (0.0%) |
| High School Diploma | 0 (0.0%) | 0 (0.0%) |
| College or Associate's Degree | 0 (0.0%) | 0 (0.0%) |
| Bachelor's Degree | 0 (0.0%) | 0 (0.0%) |
| Graduate Degree | 0 (0.0%) | 0 (0.0%) |
| Total | 0 (0.0%) | 0 (0.0%) |
Employment Characteristics in Florida
Employment by Class of Employer in Florida
Among the 1,333 employed individuals in Florida, private company employees (796 | 59.7%), local government employees (201 | 15.1%), and not-for-profit organizations (104 | 7.8%) make up the most common classes of employment.
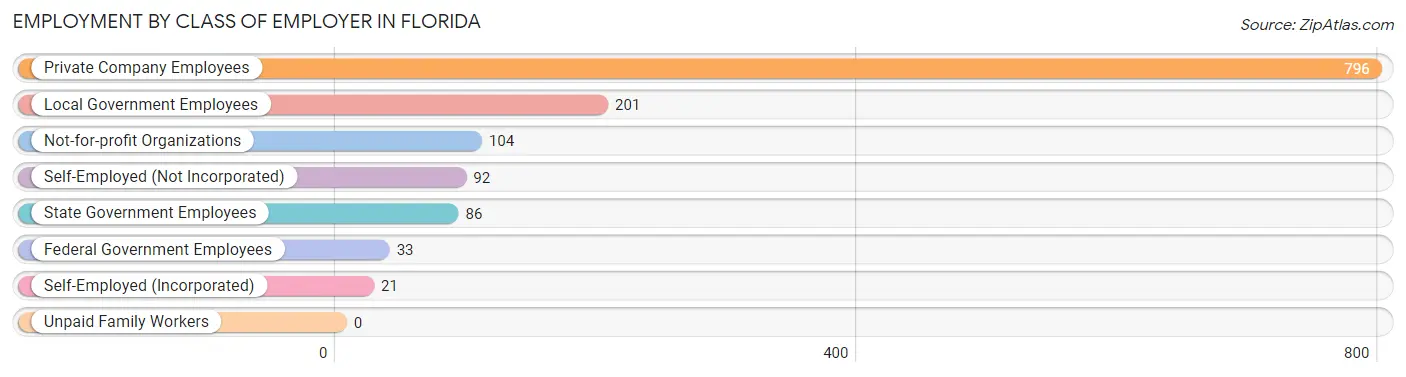
| Employer Class | # Employees | % Employees |
| Private Company Employees | 796 | 59.7% |
| Self-Employed (Incorporated) | 21 | 1.6% |
| Self-Employed (Not Incorporated) | 92 | 6.9% |
| Not-for-profit Organizations | 104 | 7.8% |
| Local Government Employees | 201 | 15.1% |
| State Government Employees | 86 | 6.5% |
| Federal Government Employees | 33 | 2.5% |
| Unpaid Family Workers | 0 | 0.0% |
| Total | 1,333 | 100.0% |
Employment Status by Age in Florida
According to the labor force statistics for Florida, out of the total population over 16 years of age (3,557), 44.8% or 1,594 individuals are in the labor force, with 14.9% or 238 of them unemployed. The age group with the highest labor force participation rate is 25 to 29 years, with 100.0% or 98 individuals in the labor force. Within the labor force, the 20 to 24 years age range has the highest percentage of unemployed individuals, with 39.3% or 114 of them being unemployed.
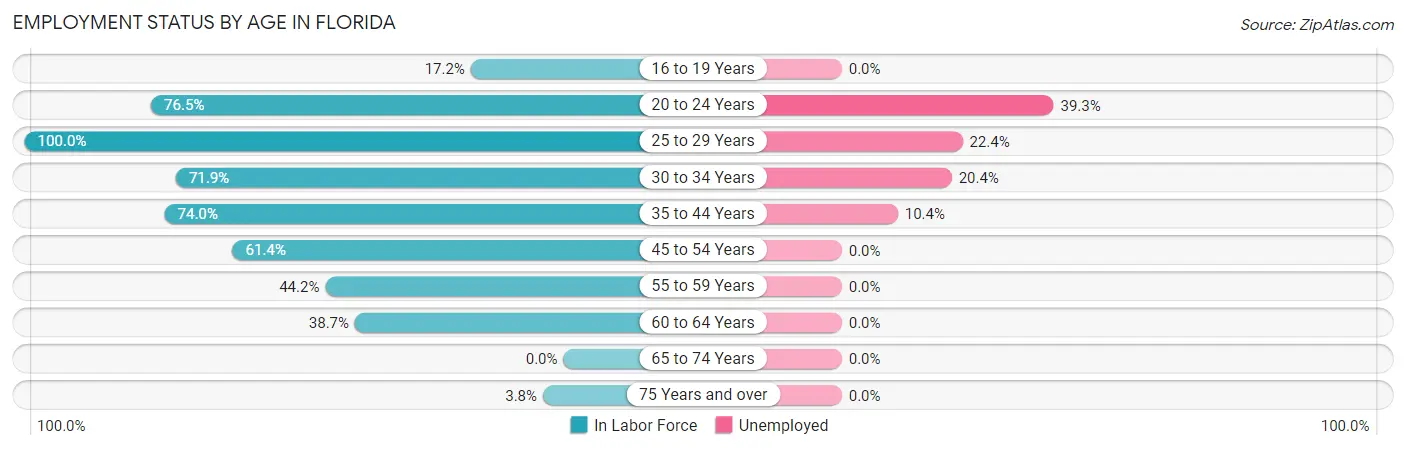
| Age Bracket | In Labor Force | Unemployed |
| 16 to 19 Years | 32 (17.2%) | 0 (0.0%) |
| 20 to 24 Years | 290 (76.5%) | 114 (39.3%) |
| 25 to 29 Years | 98 (100.0%) | 22 (22.4%) |
| 30 to 34 Years | 294 (71.9%) | 60 (20.4%) |
| 35 to 44 Years | 395 (74.0%) | 41 (10.4%) |
| 45 to 54 Years | 255 (61.4%) | 0 (0.0%) |
| 55 to 59 Years | 57 (44.2%) | 0 (0.0%) |
| 60 to 64 Years | 151 (38.7%) | 0 (0.0%) |
| 65 to 74 Years | 0 (0.0%) | 0 (0.0%) |
| 75 Years and over | 21 (3.8%) | 0 (0.0%) |
| Total | 1,594 (44.8%) | 238 (14.9%) |
Employment Status by Educational Attainment in Florida
According to labor force statistics for Florida, 63.3% of individuals (1,250) out of the total population between 25 and 64 years of age (1,975) are in the labor force, with 9.8% or 122 of them being unemployed. The group with the highest labor force participation rate are those with the educational attainment of college / associate degree, with 81.6% or 518 individuals in the labor force. Within the labor force, individuals with high school diploma education have the highest percentage of unemployment, with 24.5% or 84 of them being unemployed.
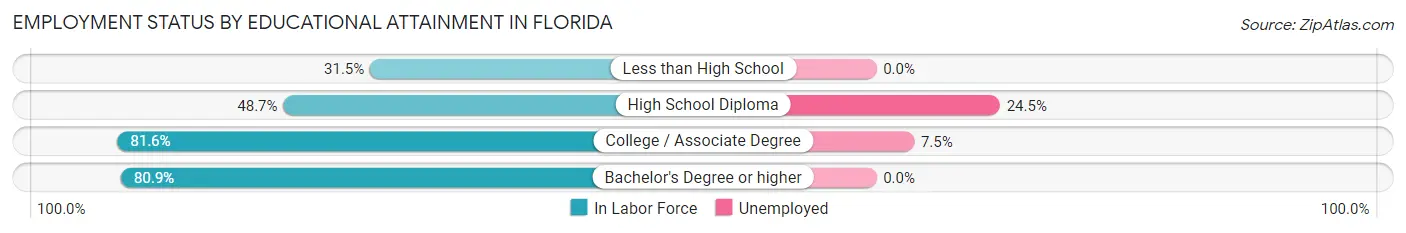
| Educational Attainment | In Labor Force | Unemployed |
| Less than High School | 80 (31.5%) | 0 (0.0%) |
| High School Diploma | 343 (48.7%) | 172 (24.5%) |
| College / Associate Degree | 518 (81.6%) | 48 (7.5%) |
| Bachelor's Degree or higher | 309 (80.9%) | 0 (0.0%) |
| Total | 1,250 (63.3%) | 194 (9.8%) |
Employment Occupations by Sex in Florida
Management, Business, Science and Arts Occupations
The most common Management, Business, Science and Arts occupations in Florida are Community & Social Service (148 | 10.9%), Education Instruction & Library (128 | 9.4%), Health Diagnosing & Treating (109 | 8.0%), Business & Financial (83 | 6.1%), and Management (51 | 3.8%).
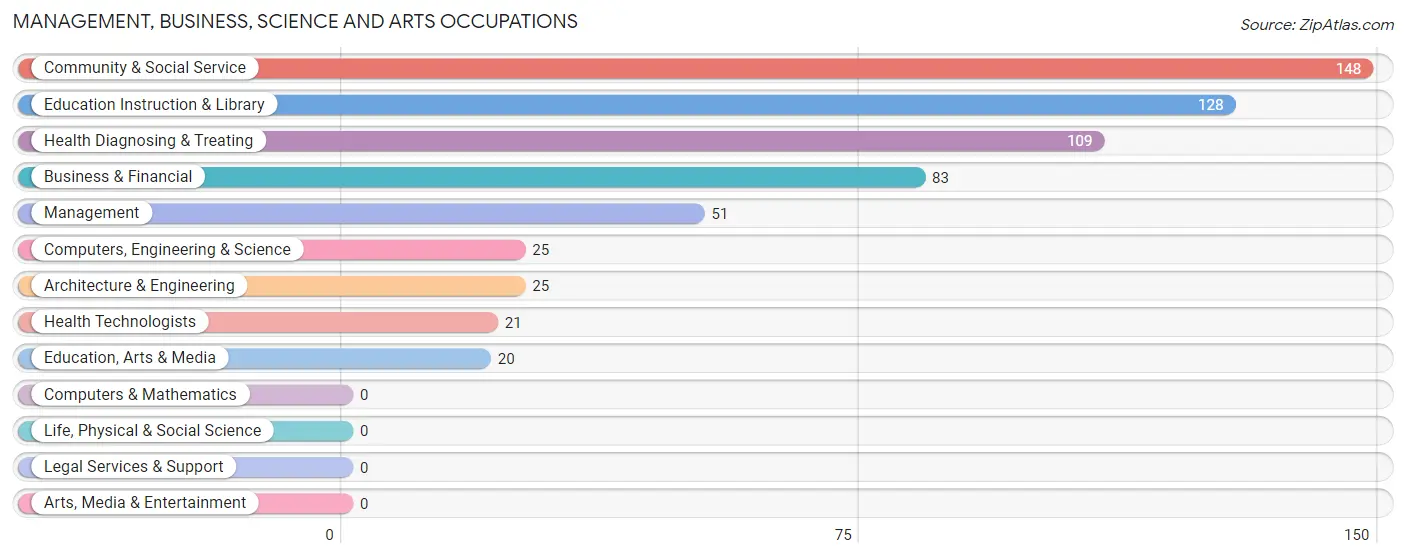
Management, Business, Science and Arts Occupations by Sex
Within the Management, Business, Science and Arts occupations in Florida, the most male-oriented occupations are Management (100.0%), Computers, Engineering & Science (100.0%), and Architecture & Engineering (100.0%), while the most female-oriented occupations are Community & Social Service (100.0%), Education, Arts & Media (100.0%), and Education Instruction & Library (100.0%).
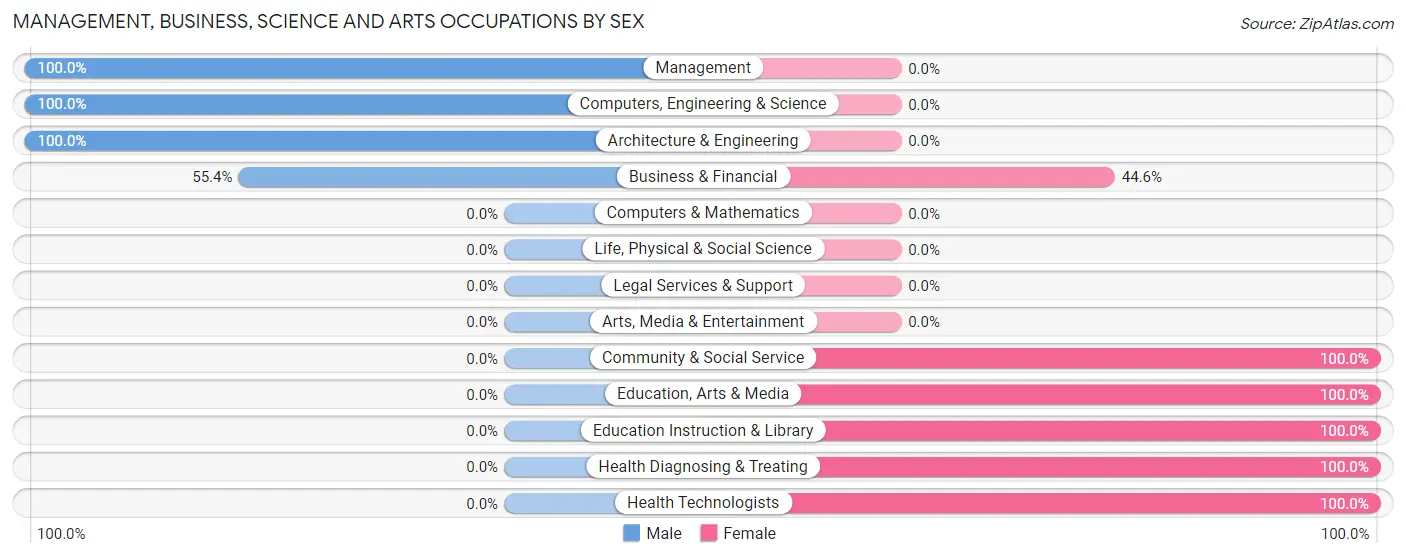
| Occupation | Male | Female |
| Management | 51 (100.0%) | 0 (0.0%) |
| Business & Financial | 46 (55.4%) | 37 (44.6%) |
| Computers, Engineering & Science | 25 (100.0%) | 0 (0.0%) |
| Computers & Mathematics | 0 (0.0%) | 0 (0.0%) |
| Architecture & Engineering | 25 (100.0%) | 0 (0.0%) |
| Life, Physical & Social Science | 0 (0.0%) | 0 (0.0%) |
| Community & Social Service | 0 (0.0%) | 148 (100.0%) |
| Education, Arts & Media | 0 (0.0%) | 20 (100.0%) |
| Legal Services & Support | 0 (0.0%) | 0 (0.0%) |
| Education Instruction & Library | 0 (0.0%) | 128 (100.0%) |
| Arts, Media & Entertainment | 0 (0.0%) | 0 (0.0%) |
| Health Diagnosing & Treating | 0 (0.0%) | 109 (100.0%) |
| Health Technologists | 0 (0.0%) | 21 (100.0%) |
| Total (Category) | 122 (29.3%) | 294 (70.7%) |
| Total (Overall) | 747 (55.1%) | 609 (44.9%) |
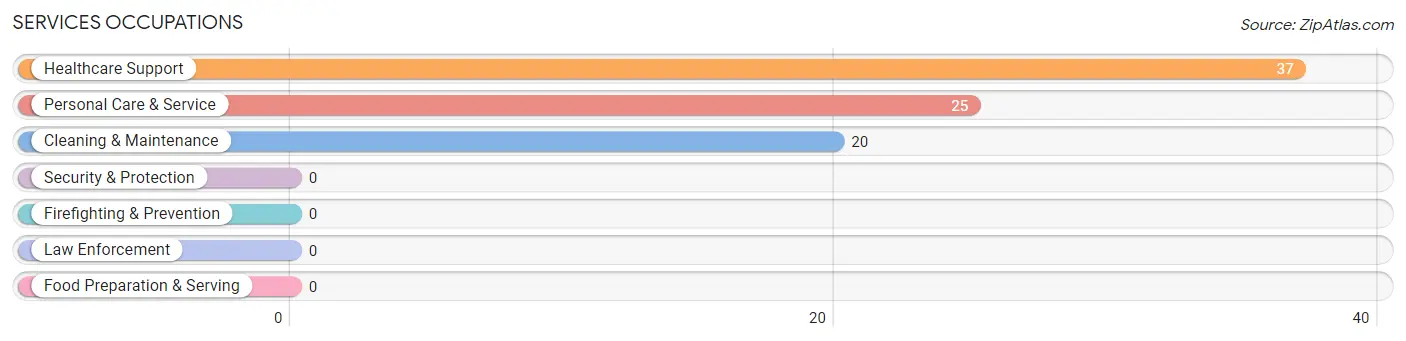
Services Occupations
The most common Services occupations in Florida are Healthcare Support (37 | 2.7%), Personal Care & Service (25 | 1.8%), and Cleaning & Maintenance (20 | 1.5%).
Services Occupations by Sex
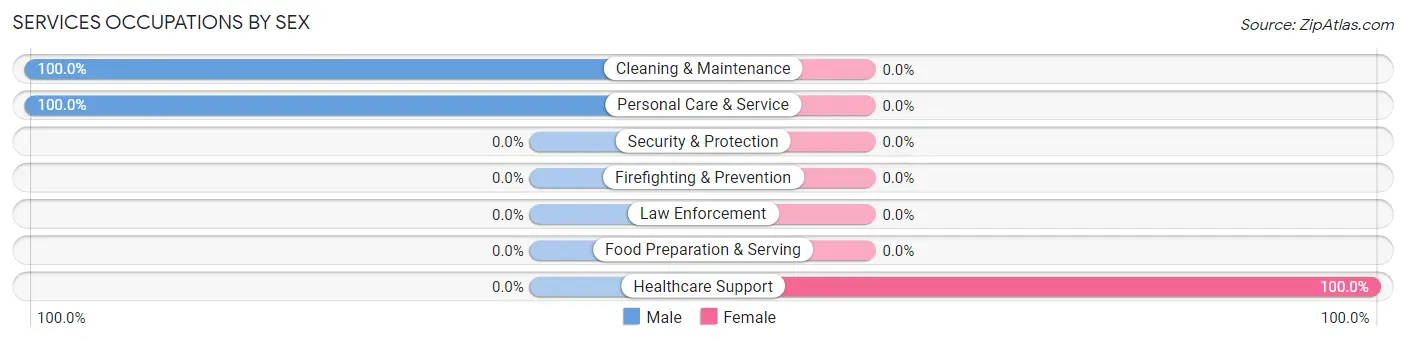
| Occupation | Male | Female |
| Healthcare Support | 0 (0.0%) | 37 (100.0%) |
| Security & Protection | 0 (0.0%) | 0 (0.0%) |
| Firefighting & Prevention | 0 (0.0%) | 0 (0.0%) |
| Law Enforcement | 0 (0.0%) | 0 (0.0%) |
| Food Preparation & Serving | 0 (0.0%) | 0 (0.0%) |
| Cleaning & Maintenance | 20 (100.0%) | 0 (0.0%) |
| Personal Care & Service | 25 (100.0%) | 0 (0.0%) |
| Total (Category) | 45 (54.9%) | 37 (45.1%) |
| Total (Overall) | 747 (55.1%) | 609 (44.9%) |
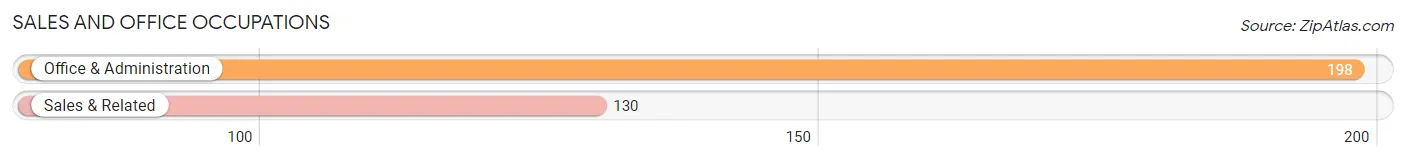
Sales and Office Occupations
The most common Sales and Office occupations in Florida are Office & Administration (198 | 14.6%), and Sales & Related (130 | 9.6%).
Sales and Office Occupations by Sex

| Occupation | Male | Female |
| Sales & Related | 83 (63.8%) | 47 (36.1%) |
| Office & Administration | 30 (15.1%) | 168 (84.9%) |
| Total (Category) | 113 (34.4%) | 215 (65.5%) |
| Total (Overall) | 747 (55.1%) | 609 (44.9%) |
Natural Resources, Construction and Maintenance Occupations
The most common Natural Resources, Construction and Maintenance occupations in Florida are Construction & Extraction (165 | 12.2%), Installation, Maintenance & Repair (113 | 8.3%), and Farming, Fishing & Forestry (18 | 1.3%).
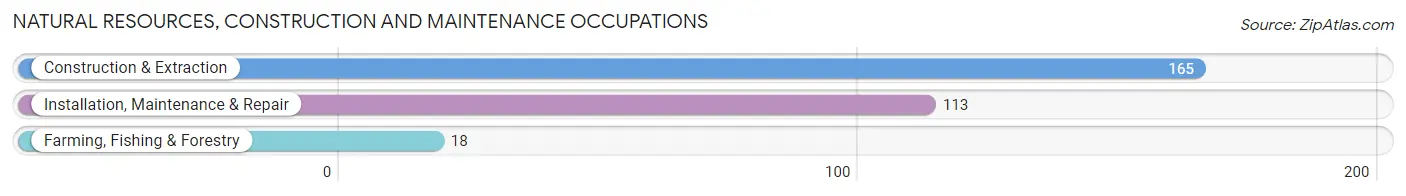
Natural Resources, Construction and Maintenance Occupations by Sex
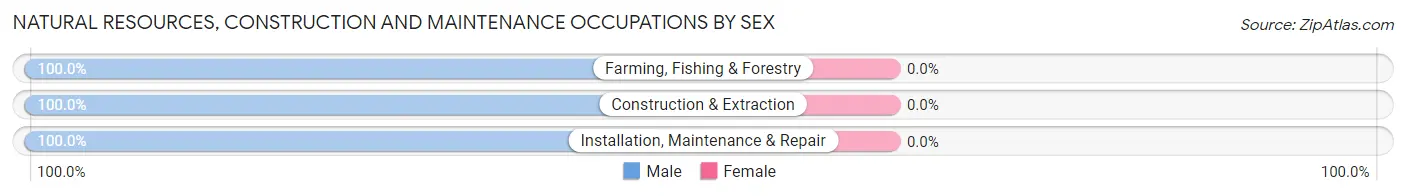
| Occupation | Male | Female |
| Farming, Fishing & Forestry | 18 (100.0%) | 0 (0.0%) |
| Construction & Extraction | 165 (100.0%) | 0 (0.0%) |
| Installation, Maintenance & Repair | 113 (100.0%) | 0 (0.0%) |
| Total (Category) | 296 (100.0%) | 0 (0.0%) |
| Total (Overall) | 747 (55.1%) | 609 (44.9%) |
Production, Transportation and Moving Occupations
The most common Production, Transportation and Moving occupations in Florida are Production (224 | 16.5%), and Material Moving (10 | 0.7%).
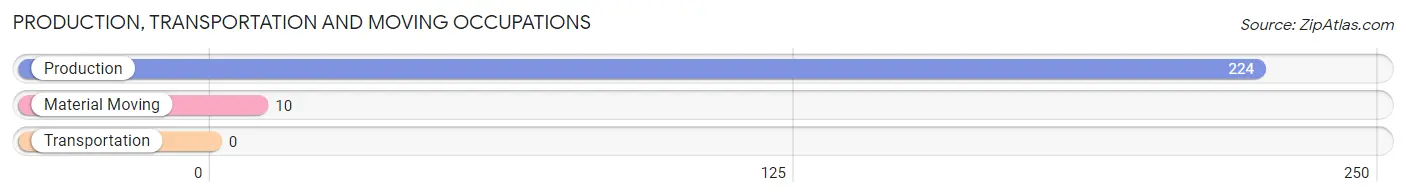
Production, Transportation and Moving Occupations by Sex
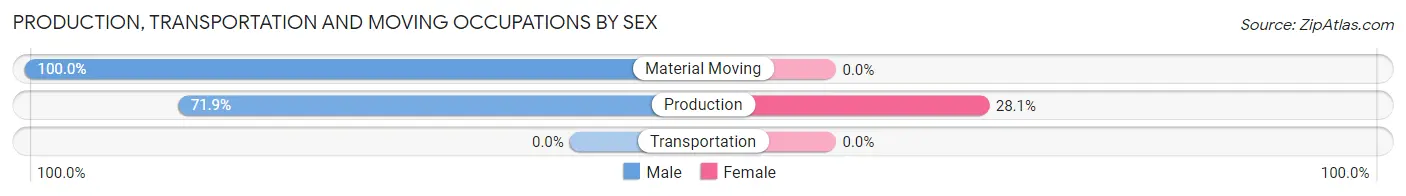
| Occupation | Male | Female |
| Production | 161 (71.9%) | 63 (28.1%) |
| Transportation | 0 (0.0%) | 0 (0.0%) |
| Material Moving | 10 (100.0%) | 0 (0.0%) |
| Total (Category) | 171 (73.1%) | 63 (26.9%) |
| Total (Overall) | 747 (55.1%) | 609 (44.9%) |
Employment Industries by Sex in Florida
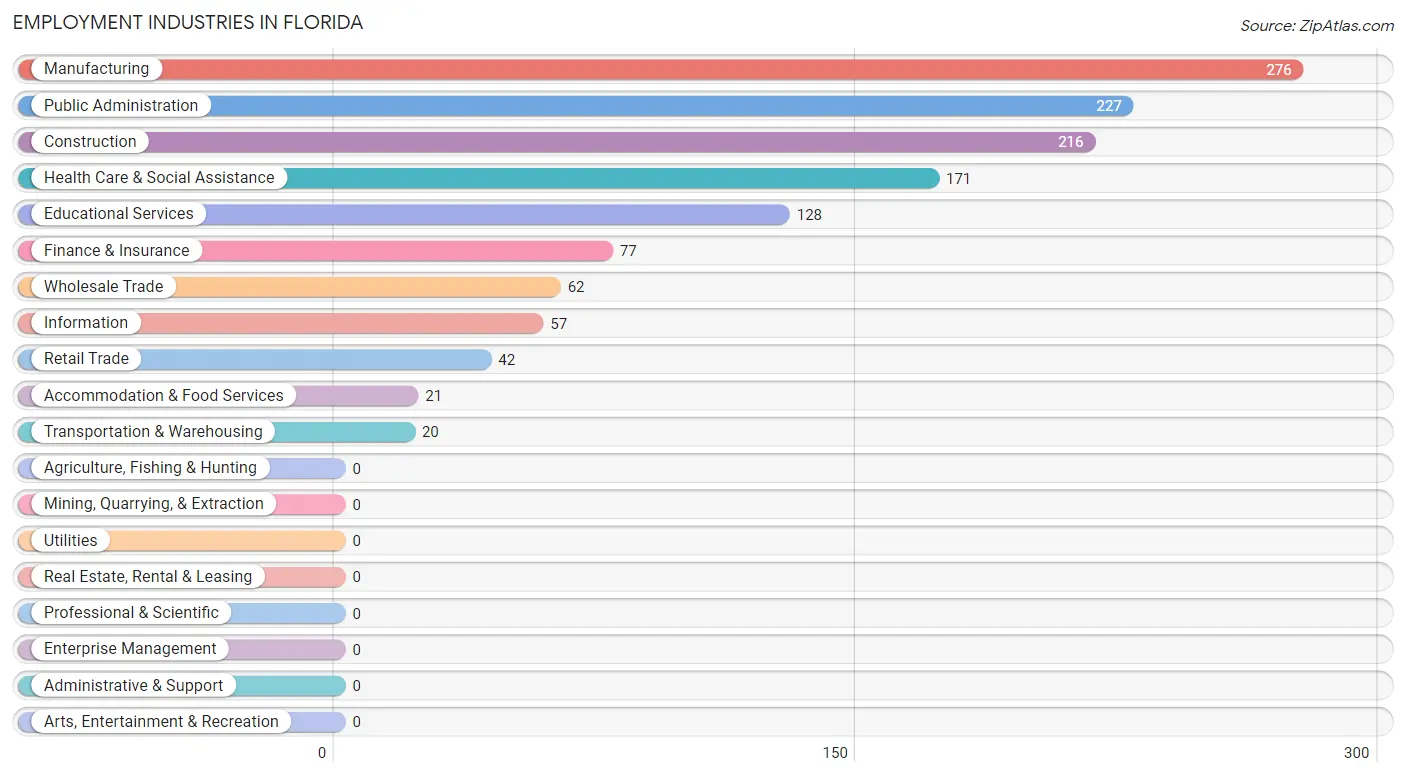
Employment Industries in Florida
The major employment industries in Florida include Manufacturing (276 | 20.3%), Public Administration (227 | 16.7%), Construction (216 | 15.9%), Health Care & Social Assistance (171 | 12.6%), and Educational Services (128 | 9.4%).
Employment Industries by Sex in Florida
The Florida industries that see more men than women are Construction (100.0%), Wholesale Trade (100.0%), and Transportation & Warehousing (100.0%), whereas the industries that tend to have a higher number of women are Information (100.0%), Finance & Insurance (100.0%), and Educational Services (100.0%).
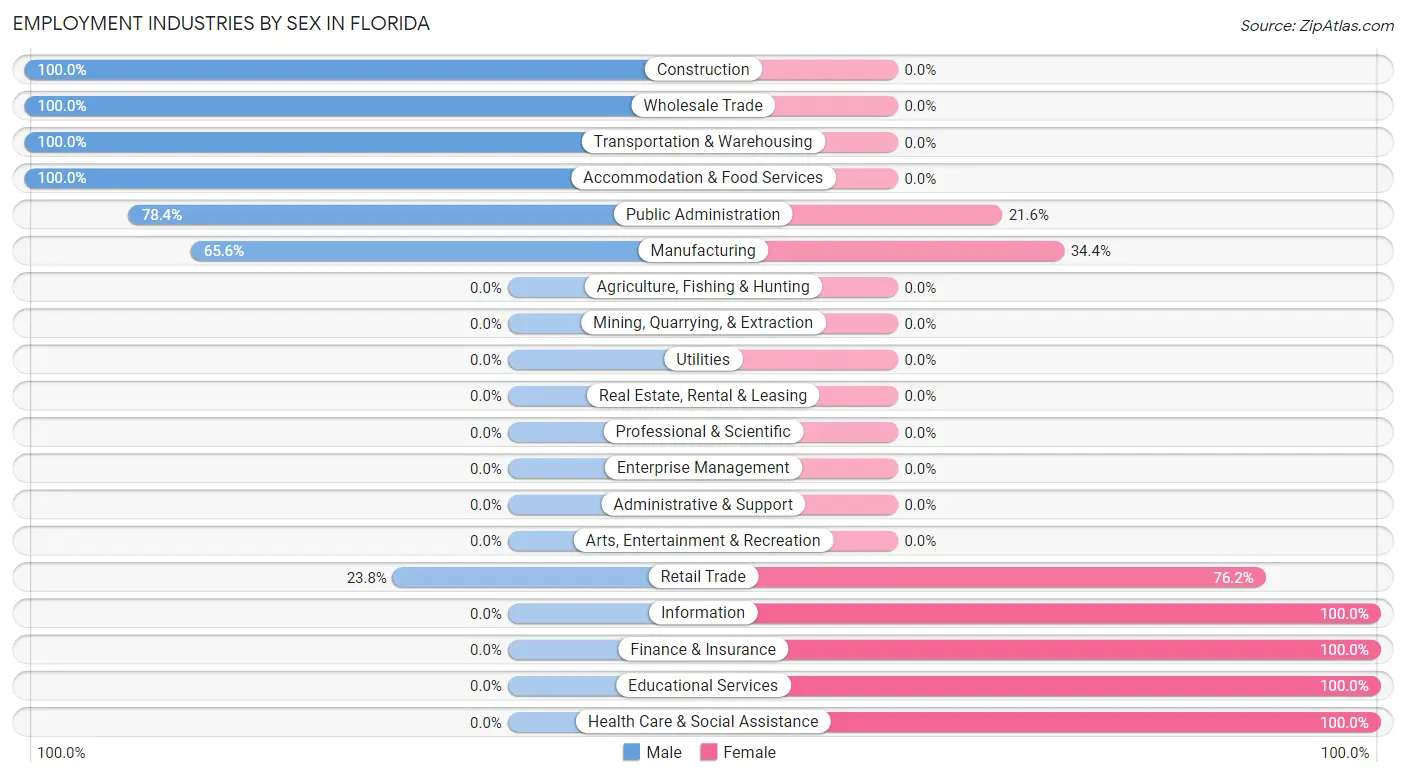
| Industry | Male | Female |
| Agriculture, Fishing & Hunting | 0 (0.0%) | 0 (0.0%) |
| Mining, Quarrying, & Extraction | 0 (0.0%) | 0 (0.0%) |
| Construction | 216 (100.0%) | 0 (0.0%) |
| Manufacturing | 181 (65.6%) | 95 (34.4%) |
| Wholesale Trade | 62 (100.0%) | 0 (0.0%) |
| Retail Trade | 10 (23.8%) | 32 (76.2%) |
| Transportation & Warehousing | 20 (100.0%) | 0 (0.0%) |
| Utilities | 0 (0.0%) | 0 (0.0%) |
| Information | 0 (0.0%) | 57 (100.0%) |
| Finance & Insurance | 0 (0.0%) | 77 (100.0%) |
| Real Estate, Rental & Leasing | 0 (0.0%) | 0 (0.0%) |
| Professional & Scientific | 0 (0.0%) | 0 (0.0%) |
| Enterprise Management | 0 (0.0%) | 0 (0.0%) |
| Administrative & Support | 0 (0.0%) | 0 (0.0%) |
| Educational Services | 0 (0.0%) | 128 (100.0%) |
| Health Care & Social Assistance | 0 (0.0%) | 171 (100.0%) |
| Arts, Entertainment & Recreation | 0 (0.0%) | 0 (0.0%) |
| Accommodation & Food Services | 21 (100.0%) | 0 (0.0%) |
| Public Administration | 178 (78.4%) | 49 (21.6%) |
| Total | 747 (55.1%) | 609 (44.9%) |
Education in Florida
School Enrollment in Florida
The most common levels of schooling among the 685 students in Florida are middle school (238 | 34.7%), elementary school (192 | 28.0%), and college / undergraduate (84 | 12.3%).
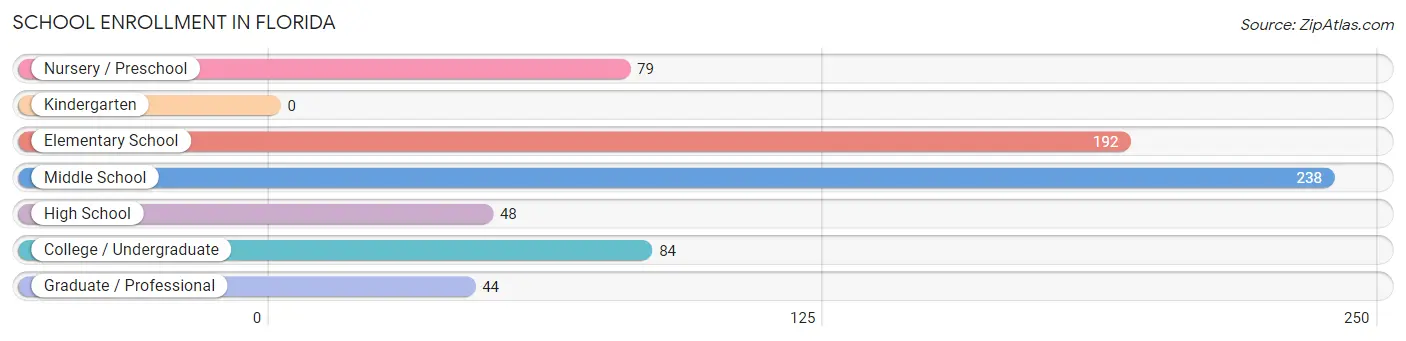
| School Level | # Students | % Students |
| Nursery / Preschool | 79 | 11.5% |
| Kindergarten | 0 | 0.0% |
| Elementary School | 192 | 28.0% |
| Middle School | 238 | 34.7% |
| High School | 48 | 7.0% |
| College / Undergraduate | 84 | 12.3% |
| Graduate / Professional | 44 | 6.4% |
| Total | 685 | 100.0% |
School Enrollment by Age by Funding Source in Florida
Out of a total of 685 students who are enrolled in schools in Florida, 277 (40.4%) attend a private institution, while the remaining 408 (59.6%) are enrolled in public schools. The age group of 18 to 19 year olds has the highest likelihood of being enrolled in private schools, with 31 (100.0% in the age bracket) enrolled. Conversely, the age group of 10 to 14 year olds has the lowest likelihood of being enrolled in a private school, with 215 (100.0% in the age bracket) attending a public institution.
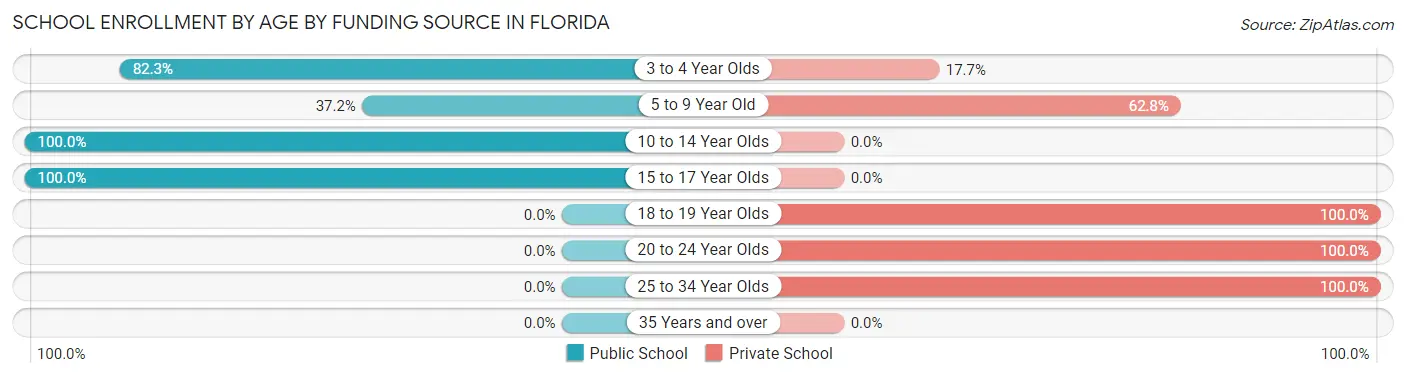
| Age Bracket | Public School | Private School |
| 3 to 4 Year Olds | 65 (82.3%) | 14 (17.7%) |
| 5 to 9 Year Old | 80 (37.2%) | 135 (62.8%) |
| 10 to 14 Year Olds | 215 (100.0%) | 0 (0.0%) |
| 15 to 17 Year Olds | 48 (100.0%) | 0 (0.0%) |
| 18 to 19 Year Olds | 0 (0.0%) | 31 (100.0%) |
| 20 to 24 Year Olds | 0 (0.0%) | 53 (100.0%) |
| 25 to 34 Year Olds | 0 (0.0%) | 44 (100.0%) |
| 35 Years and over | 0 (0.0%) | 0 (0.0%) |
| Total | 408 (59.6%) | 277 (40.4%) |
Educational Attainment by Field of Study in Florida
Business (233 | 50.5%), bio, nature & agricultural (123 | 26.7%), arts & humanities (44 | 9.5%), science & technology (21 | 4.6%), and social sciences (14 | 3.0%) are the most common fields of study among 461 individuals in Florida who have obtained a bachelor's degree or higher.
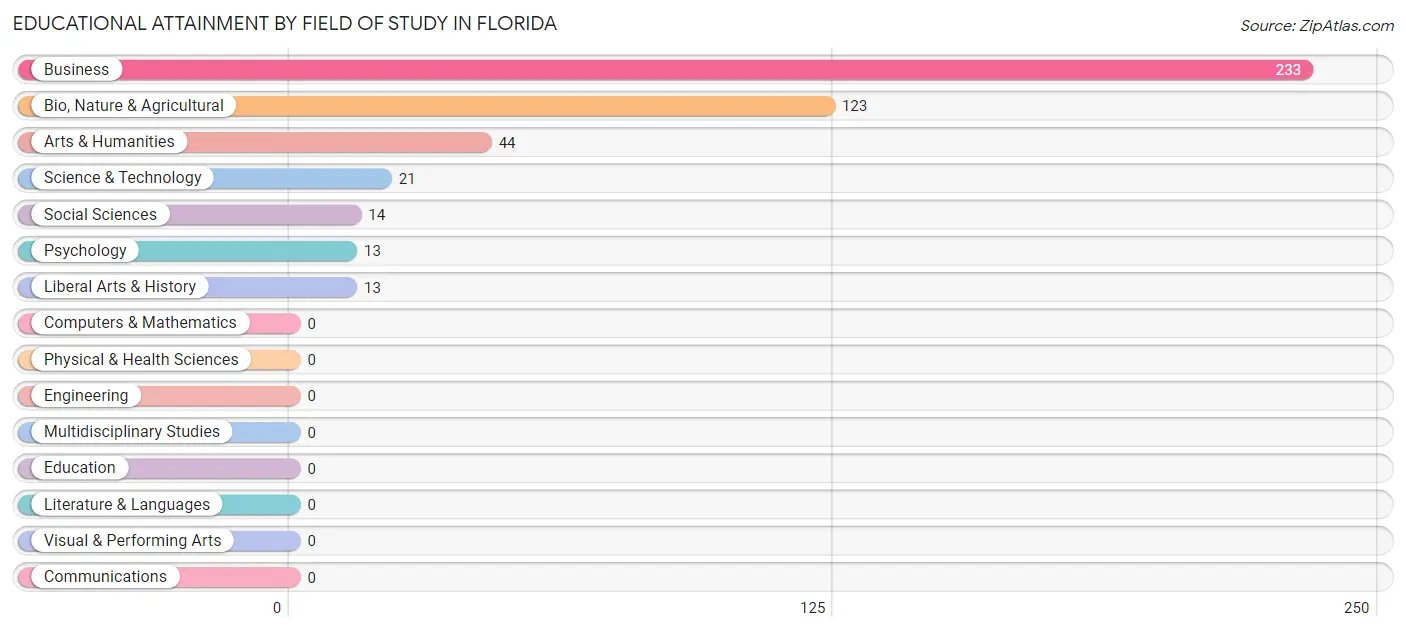
| Field of Study | # Graduates | % Graduates |
| Computers & Mathematics | 0 | 0.0% |
| Bio, Nature & Agricultural | 123 | 26.7% |
| Physical & Health Sciences | 0 | 0.0% |
| Psychology | 13 | 2.8% |
| Social Sciences | 14 | 3.0% |
| Engineering | 0 | 0.0% |
| Multidisciplinary Studies | 0 | 0.0% |
| Science & Technology | 21 | 4.6% |
| Business | 233 | 50.5% |
| Education | 0 | 0.0% |
| Literature & Languages | 0 | 0.0% |
| Liberal Arts & History | 13 | 2.8% |
| Visual & Performing Arts | 0 | 0.0% |
| Communications | 0 | 0.0% |
| Arts & Humanities | 44 | 9.5% |
| Total | 461 | 100.0% |
Transportation & Commute in Florida
Vehicle Availability by Sex in Florida
The most prevalent vehicle ownership categories in Florida are males with 2 vehicles (391, accounting for 54.0%) and females with 2 vehicles (194, making up 64.2%).
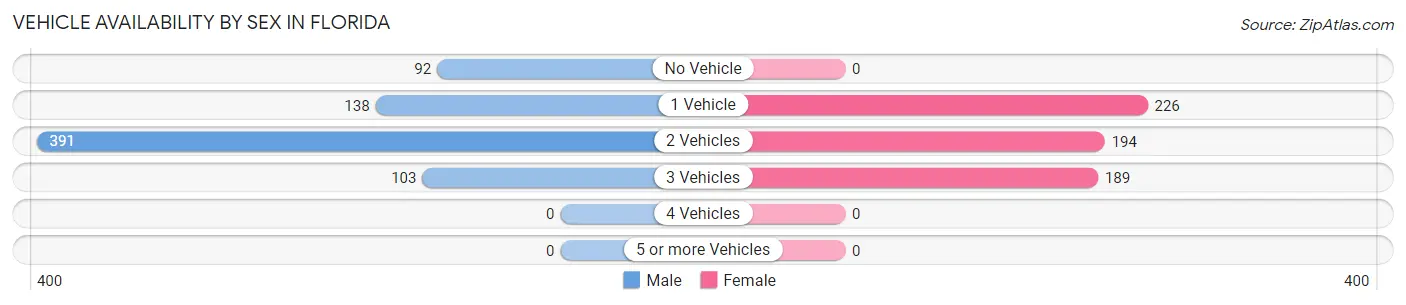
| Vehicles Available | Male | Female |
| No Vehicle | 92 (12.7%) | 0 (0.0%) |
| 1 Vehicle | 138 (19.1%) | 226 (37.1%) |
| 2 Vehicles | 391 (54.0%) | 194 (31.9%) |
| 3 Vehicles | 103 (14.2%) | 189 (31.0%) |
| 4 Vehicles | 0 (0.0%) | 0 (0.0%) |
| 5 or more Vehicles | 0 (0.0%) | 0 (0.0%) |
| Total | 724 (100.0%) | 609 (100.0%) |
Commute Time in Florida
The most frequently occuring commute durations in Florida are 30 to 34 minutes (261 commuters, 20.1%), 10 to 14 minutes (215 commuters, 16.5%), and 5 to 9 minutes (161 commuters, 12.4%).
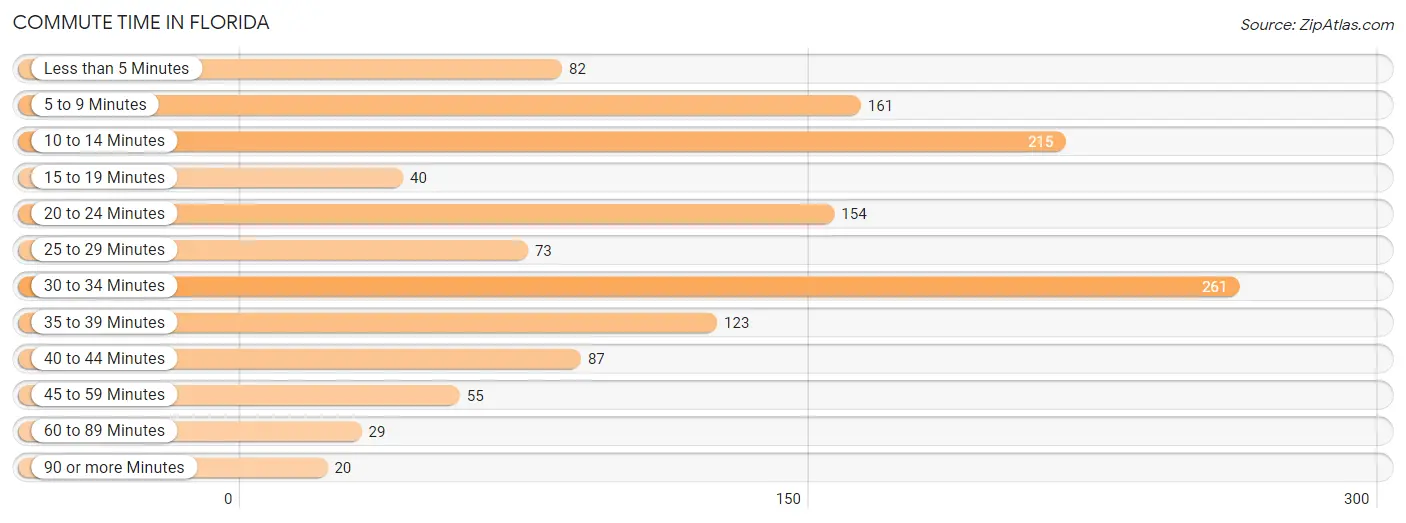
| Commute Time | # Commuters | % Commuters |
| Less than 5 Minutes | 82 | 6.3% |
| 5 to 9 Minutes | 161 | 12.4% |
| 10 to 14 Minutes | 215 | 16.5% |
| 15 to 19 Minutes | 40 | 3.1% |
| 20 to 24 Minutes | 154 | 11.8% |
| 25 to 29 Minutes | 73 | 5.6% |
| 30 to 34 Minutes | 261 | 20.1% |
| 35 to 39 Minutes | 123 | 9.5% |
| 40 to 44 Minutes | 87 | 6.7% |
| 45 to 59 Minutes | 55 | 4.2% |
| 60 to 89 Minutes | 29 | 2.2% |
| 90 or more Minutes | 20 | 1.5% |
Commute Time by Sex in Florida
The most common commute times in Florida are 30 to 34 minutes (199 commuters, 27.5%) for males and 10 to 14 minutes (98 commuters, 17.0%) for females.
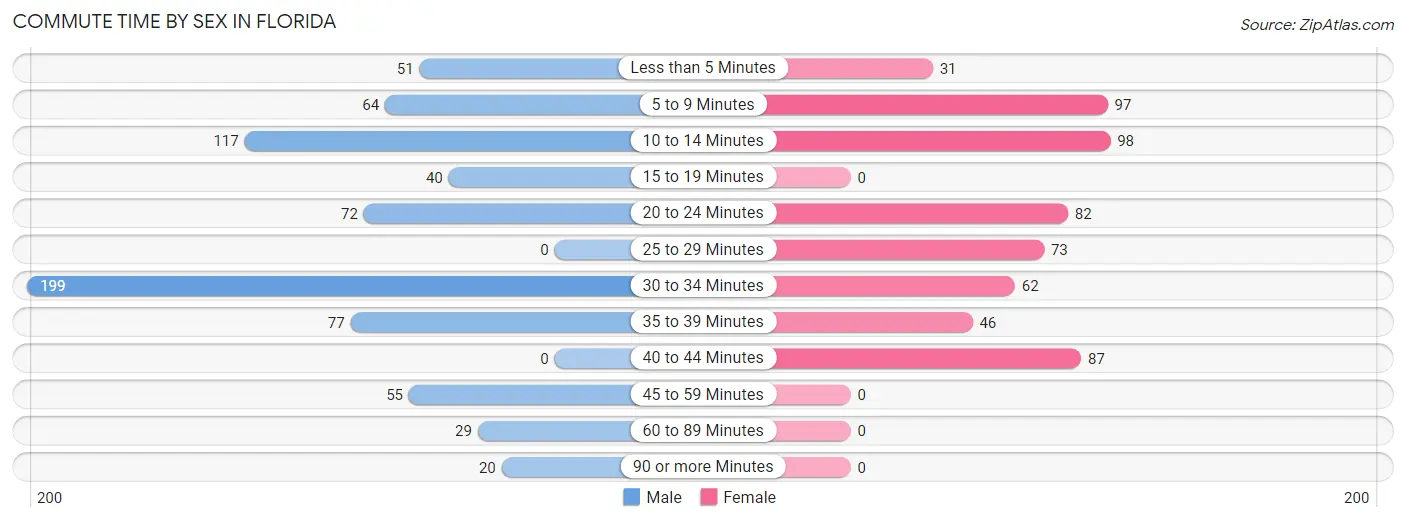
| Commute Time | Male | Female |
| Less than 5 Minutes | 51 (7.0%) | 31 (5.4%) |
| 5 to 9 Minutes | 64 (8.8%) | 97 (16.8%) |
| 10 to 14 Minutes | 117 (16.2%) | 98 (17.0%) |
| 15 to 19 Minutes | 40 (5.5%) | 0 (0.0%) |
| 20 to 24 Minutes | 72 (9.9%) | 82 (14.2%) |
| 25 to 29 Minutes | 0 (0.0%) | 73 (12.7%) |
| 30 to 34 Minutes | 199 (27.5%) | 62 (10.8%) |
| 35 to 39 Minutes | 77 (10.6%) | 46 (8.0%) |
| 40 to 44 Minutes | 0 (0.0%) | 87 (15.1%) |
| 45 to 59 Minutes | 55 (7.6%) | 0 (0.0%) |
| 60 to 89 Minutes | 29 (4.0%) | 0 (0.0%) |
| 90 or more Minutes | 20 (2.8%) | 0 (0.0%) |
Time of Departure to Work by Sex in Florida
The most frequent times of departure to work in Florida are 7:30 AM to 7:59 AM (239, 33.0%) for males and 7:00 AM to 7:29 AM (115, 20.0%) for females.
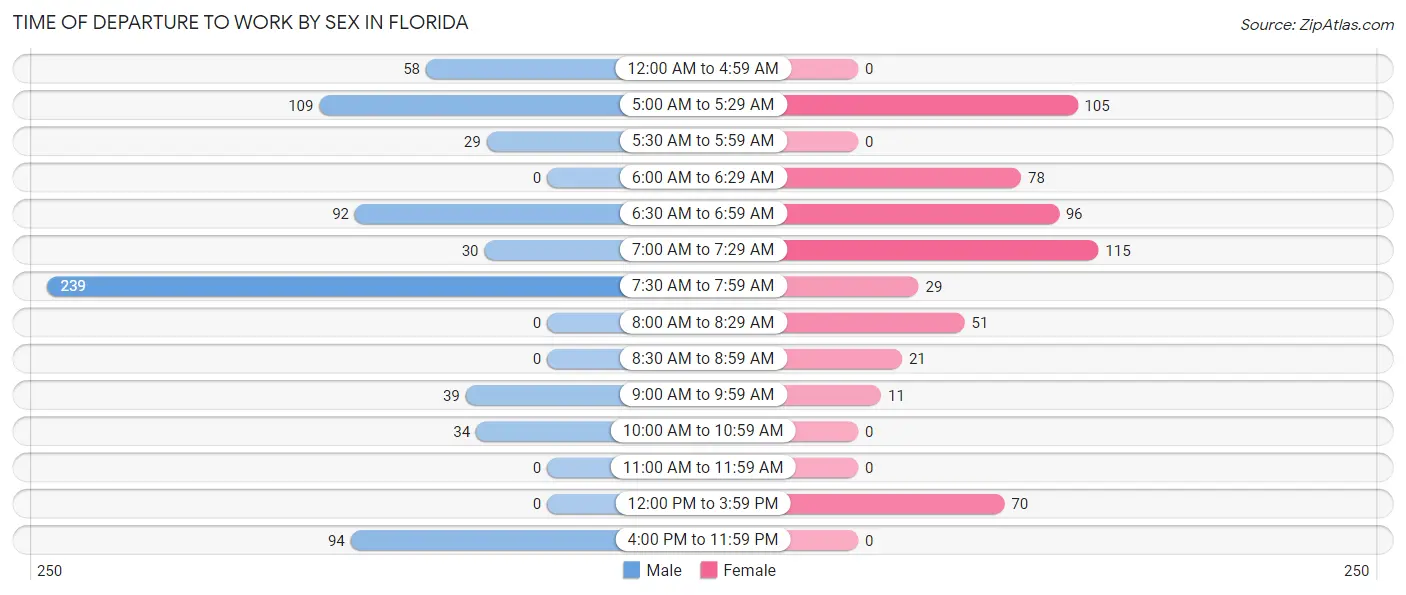
| Time of Departure | Male | Female |
| 12:00 AM to 4:59 AM | 58 (8.0%) | 0 (0.0%) |
| 5:00 AM to 5:29 AM | 109 (15.1%) | 105 (18.2%) |
| 5:30 AM to 5:59 AM | 29 (4.0%) | 0 (0.0%) |
| 6:00 AM to 6:29 AM | 0 (0.0%) | 78 (13.5%) |
| 6:30 AM to 6:59 AM | 92 (12.7%) | 96 (16.7%) |
| 7:00 AM to 7:29 AM | 30 (4.1%) | 115 (20.0%) |
| 7:30 AM to 7:59 AM | 239 (33.0%) | 29 (5.0%) |
| 8:00 AM to 8:29 AM | 0 (0.0%) | 51 (8.8%) |
| 8:30 AM to 8:59 AM | 0 (0.0%) | 21 (3.6%) |
| 9:00 AM to 9:59 AM | 39 (5.4%) | 11 (1.9%) |
| 10:00 AM to 10:59 AM | 34 (4.7%) | 0 (0.0%) |
| 11:00 AM to 11:59 AM | 0 (0.0%) | 0 (0.0%) |
| 12:00 PM to 3:59 PM | 0 (0.0%) | 70 (12.1%) |
| 4:00 PM to 11:59 PM | 94 (13.0%) | 0 (0.0%) |
| Total | 724 (100.0%) | 576 (100.0%) |
Housing Occupancy in Florida
Occupancy by Ownership in Florida
Of the total 1,672 dwellings in Florida, owner-occupied units account for 1,073 (64.2%), while renter-occupied units make up 599 (35.8%).
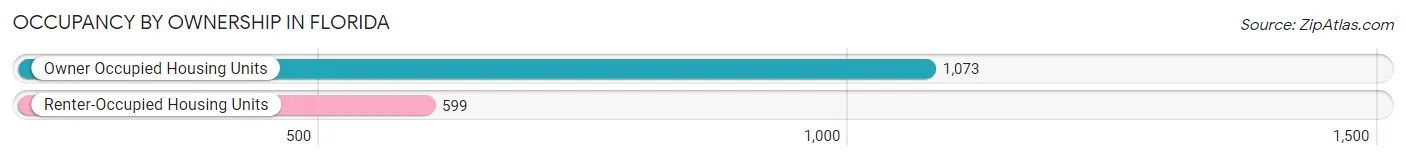
| Occupancy | # Housing Units | % Housing Units |
| Owner Occupied Housing Units | 1,073 | 64.2% |
| Renter-Occupied Housing Units | 599 | 35.8% |
| Total Occupied Housing Units | 1,672 | 100.0% |
Occupancy by Household Size in Florida
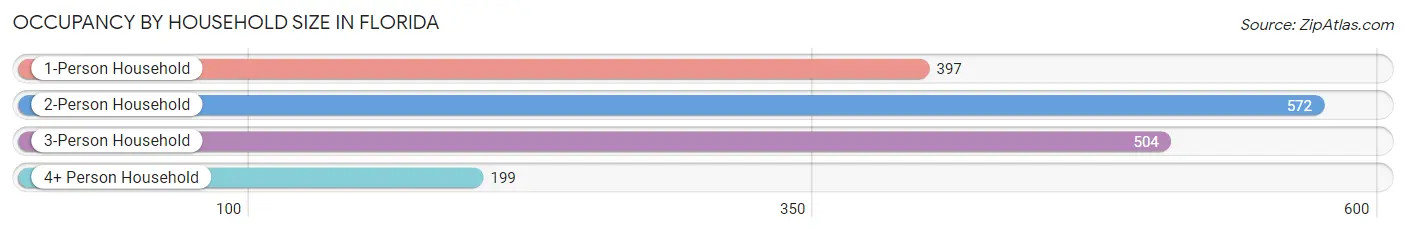
| Household Size | # Housing Units | % Housing Units |
| 1-Person Household | 397 | 23.7% |
| 2-Person Household | 572 | 34.2% |
| 3-Person Household | 504 | 30.1% |
| 4+ Person Household | 199 | 11.9% |
| Total Housing Units | 1,672 | 100.0% |
Occupancy by Ownership by Household Size in Florida
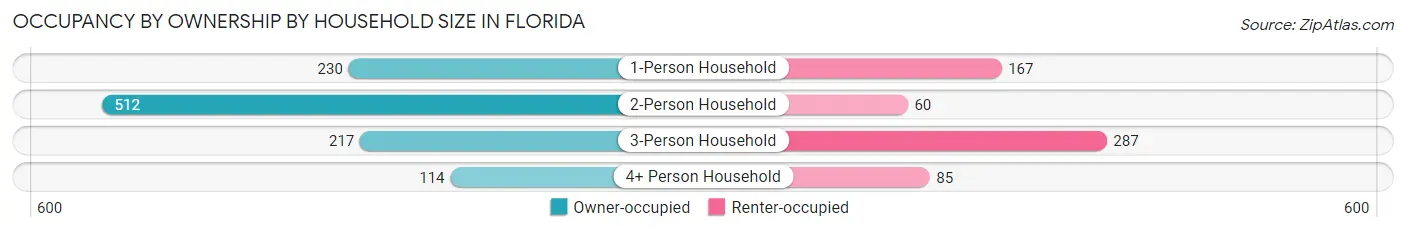
| Household Size | Owner-occupied | Renter-occupied |
| 1-Person Household | 230 (57.9%) | 167 (42.1%) |
| 2-Person Household | 512 (89.5%) | 60 (10.5%) |
| 3-Person Household | 217 (43.1%) | 287 (56.9%) |
| 4+ Person Household | 114 (57.3%) | 85 (42.7%) |
| Total Housing Units | 1,073 (64.2%) | 599 (35.8%) |
Occupancy by Educational Attainment in Florida
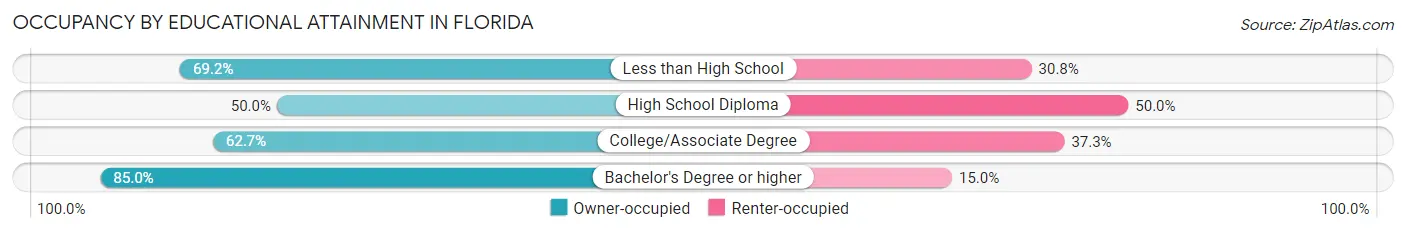
| Household Size | Owner-occupied | Renter-occupied |
| Less than High School | 339 (69.2%) | 151 (30.8%) |
| High School Diploma | 243 (50.0%) | 243 (50.0%) |
| College/Associate Degree | 282 (62.7%) | 168 (37.3%) |
| Bachelor's Degree or higher | 209 (85.0%) | 37 (15.0%) |
Occupancy by Age of Householder in Florida
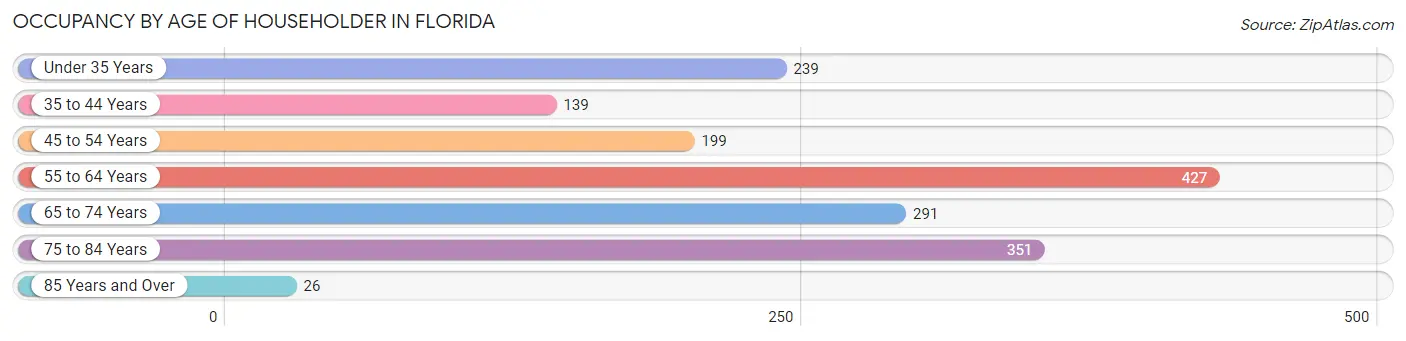
| Age Bracket | # Households | % Households |
| Under 35 Years | 239 | 14.3% |
| 35 to 44 Years | 139 | 8.3% |
| 45 to 54 Years | 199 | 11.9% |
| 55 to 64 Years | 427 | 25.5% |
| 65 to 74 Years | 291 | 17.4% |
| 75 to 84 Years | 351 | 21.0% |
| 85 Years and Over | 26 | 1.6% |
| Total | 1,672 | 100.0% |
Housing Finances in Florida
Median Income by Occupancy in Florida
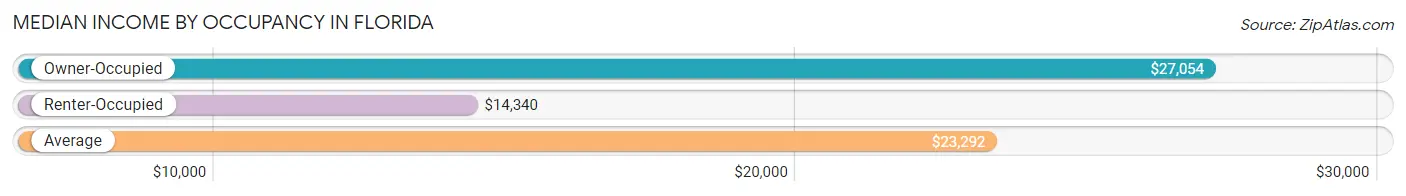
| Occupancy Type | # Households | Median Income |
| Owner-Occupied | 1,073 (64.2%) | $27,054 |
| Renter-Occupied | 599 (35.8%) | $14,340 |
| Average | 1,672 (100.0%) | $23,292 |
Occupancy by Householder Income Bracket in Florida
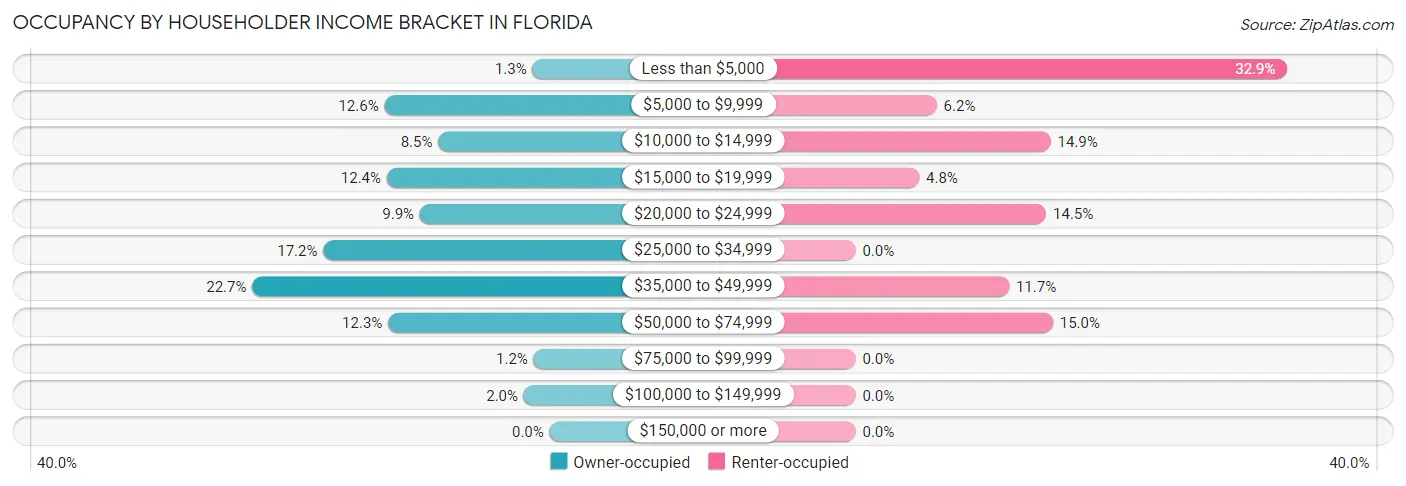
| Income Bracket | Owner-occupied | Renter-occupied |
| Less than $5,000 | 14 (1.3%) | 197 (32.9%) |
| $5,000 to $9,999 | 135 (12.6%) | 37 (6.2%) |
| $10,000 to $14,999 | 91 (8.5%) | 89 (14.9%) |
| $15,000 to $19,999 | 133 (12.4%) | 29 (4.8%) |
| $20,000 to $24,999 | 106 (9.9%) | 87 (14.5%) |
| $25,000 to $34,999 | 185 (17.2%) | 0 (0.0%) |
| $35,000 to $49,999 | 243 (22.7%) | 70 (11.7%) |
| $50,000 to $74,999 | 132 (12.3%) | 90 (15.0%) |
| $75,000 to $99,999 | 13 (1.2%) | 0 (0.0%) |
| $100,000 to $149,999 | 21 (2.0%) | 0 (0.0%) |
| $150,000 or more | 0 (0.0%) | 0 (0.0%) |
| Total | 1,073 (100.0%) | 599 (100.0%) |
Monthly Housing Cost Tiers in Florida
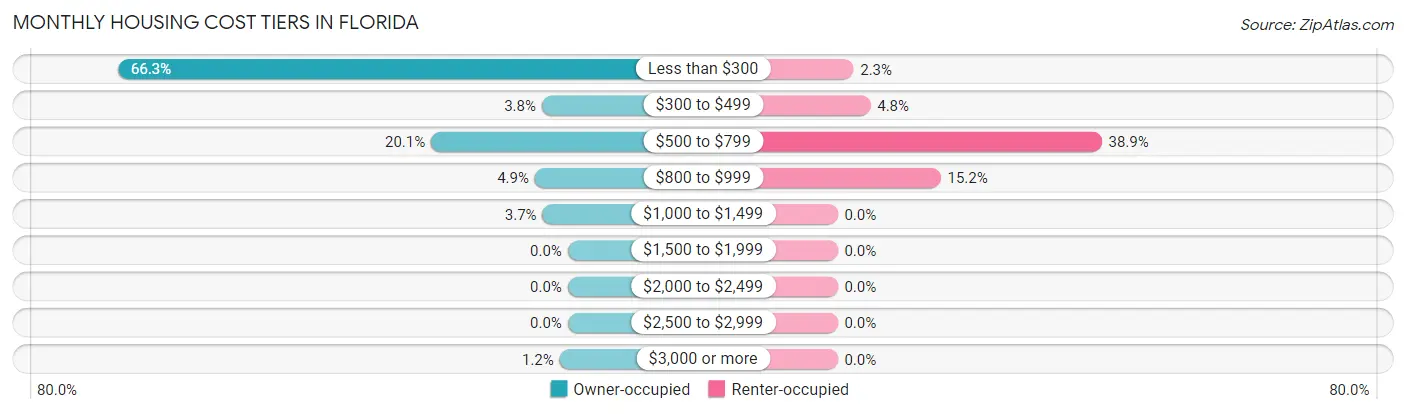
| Monthly Cost | Owner-occupied | Renter-occupied |
| Less than $300 | 711 (66.3%) | 14 (2.3%) |
| $300 to $499 | 41 (3.8%) | 29 (4.8%) |
| $500 to $799 | 216 (20.1%) | 233 (38.9%) |
| $800 to $999 | 52 (4.9%) | 91 (15.2%) |
| $1,000 to $1,499 | 40 (3.7%) | 0 (0.0%) |
| $1,500 to $1,999 | 0 (0.0%) | 0 (0.0%) |
| $2,000 to $2,499 | 0 (0.0%) | 0 (0.0%) |
| $2,500 to $2,999 | 0 (0.0%) | 0 (0.0%) |
| $3,000 or more | 13 (1.2%) | 0 (0.0%) |
| Total | 1,073 (100.0%) | 599 (100.0%) |
Physical Housing Characteristics in Florida
Housing Structures in Florida
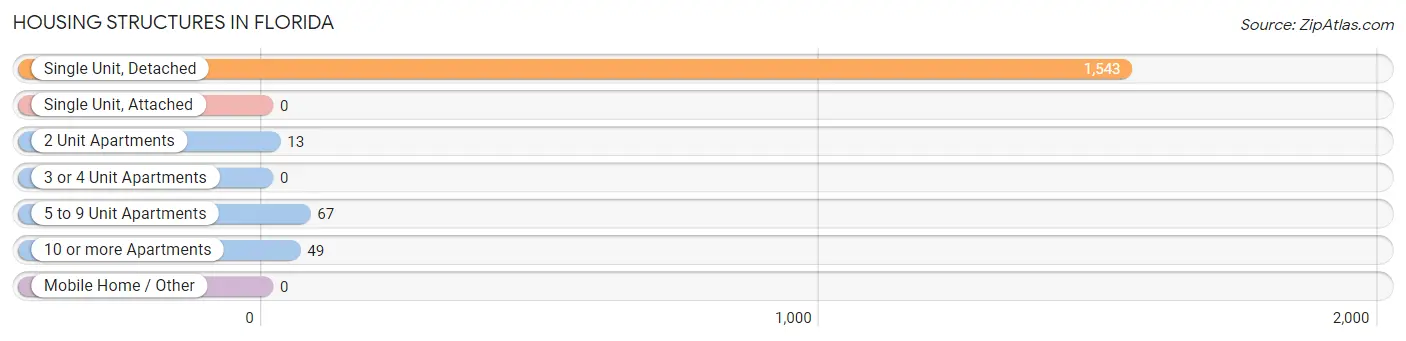
| Structure Type | # Housing Units | % Housing Units |
| Single Unit, Detached | 1,543 | 92.3% |
| Single Unit, Attached | 0 | 0.0% |
| 2 Unit Apartments | 13 | 0.8% |
| 3 or 4 Unit Apartments | 0 | 0.0% |
| 5 to 9 Unit Apartments | 67 | 4.0% |
| 10 or more Apartments | 49 | 2.9% |
| Mobile Home / Other | 0 | 0.0% |
| Total | 1,672 | 100.0% |
Housing Structures by Occupancy in Florida
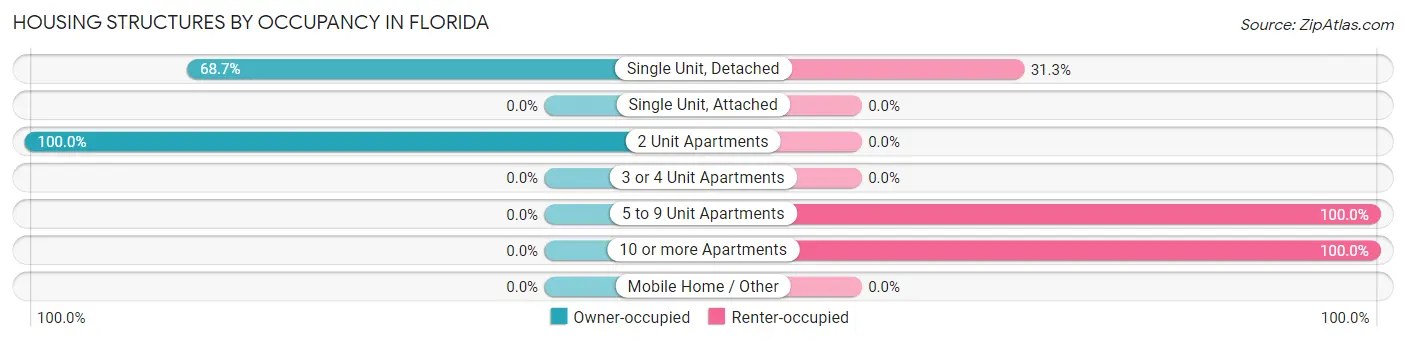
| Structure Type | Owner-occupied | Renter-occupied |
| Single Unit, Detached | 1,060 (68.7%) | 483 (31.3%) |
| Single Unit, Attached | 0 (0.0%) | 0 (0.0%) |
| 2 Unit Apartments | 13 (100.0%) | 0 (0.0%) |
| 3 or 4 Unit Apartments | 0 (0.0%) | 0 (0.0%) |
| 5 to 9 Unit Apartments | 0 (0.0%) | 67 (100.0%) |
| 10 or more Apartments | 0 (0.0%) | 49 (100.0%) |
| Mobile Home / Other | 0 (0.0%) | 0 (0.0%) |
| Total | 1,073 (64.2%) | 599 (35.8%) |
Housing Structures by Number of Rooms in Florida
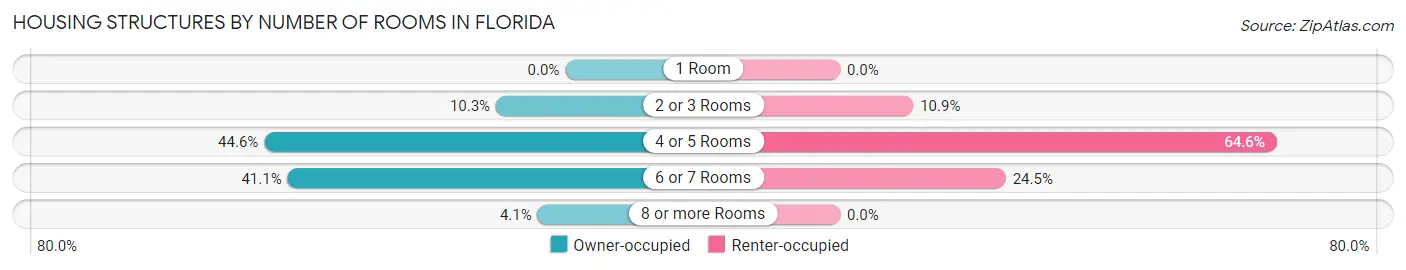
| Number of Rooms | Owner-occupied | Renter-occupied |
| 1 Room | 0 (0.0%) | 0 (0.0%) |
| 2 or 3 Rooms | 110 (10.2%) | 65 (10.8%) |
| 4 or 5 Rooms | 478 (44.6%) | 387 (64.6%) |
| 6 or 7 Rooms | 441 (41.1%) | 147 (24.5%) |
| 8 or more Rooms | 44 (4.1%) | 0 (0.0%) |
| Total | 1,073 (100.0%) | 599 (100.0%) |
Housing Structure by Heating Type in Florida
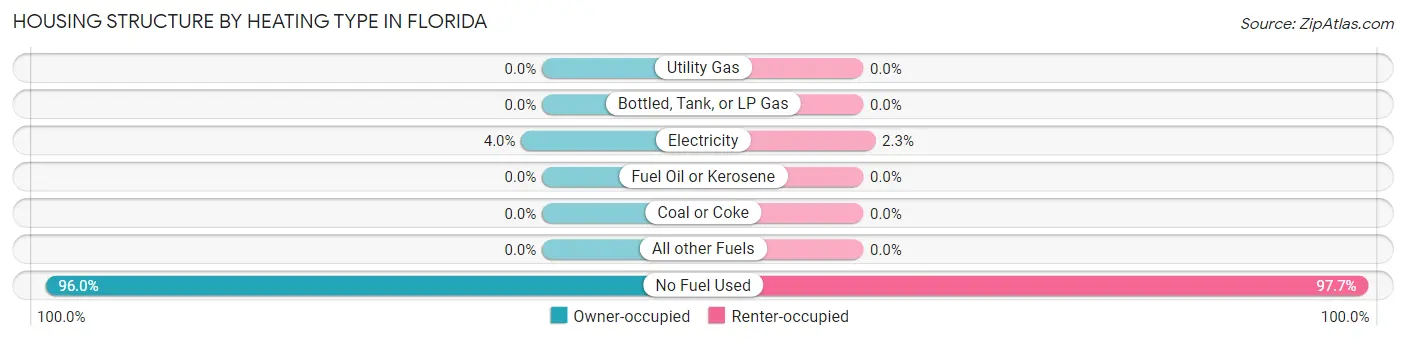
| Heating Type | Owner-occupied | Renter-occupied |
| Utility Gas | 0 (0.0%) | 0 (0.0%) |
| Bottled, Tank, or LP Gas | 0 (0.0%) | 0 (0.0%) |
| Electricity | 43 (4.0%) | 14 (2.3%) |
| Fuel Oil or Kerosene | 0 (0.0%) | 0 (0.0%) |
| Coal or Coke | 0 (0.0%) | 0 (0.0%) |
| All other Fuels | 0 (0.0%) | 0 (0.0%) |
| No Fuel Used | 1,030 (96.0%) | 585 (97.7%) |
| Total | 1,073 (100.0%) | 599 (100.0%) |
Household Vehicle Usage in Florida
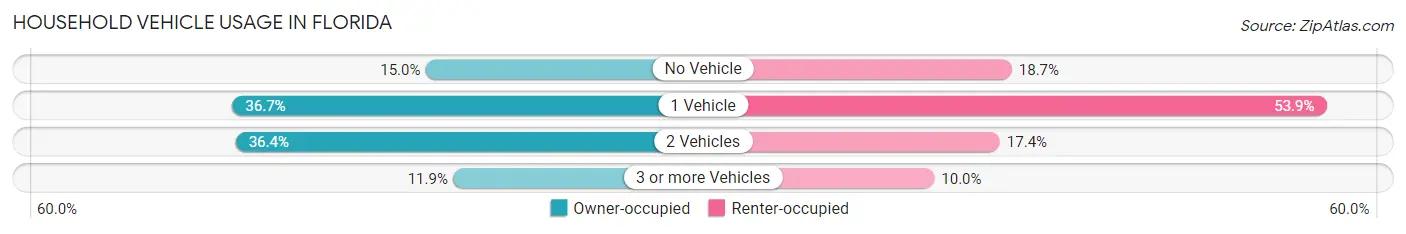
| Vehicles per Household | Owner-occupied | Renter-occupied |
| No Vehicle | 161 (15.0%) | 112 (18.7%) |
| 1 Vehicle | 394 (36.7%) | 323 (53.9%) |
| 2 Vehicles | 390 (36.3%) | 104 (17.4%) |
| 3 or more Vehicles | 128 (11.9%) | 60 (10.0%) |
| Total | 1,073 (100.0%) | 599 (100.0%) |
Real Estate & Mortgages in Florida
Real Estate and Mortgage Overview in Florida
| Characteristic | Without Mortgage | With Mortgage |
| Housing Units | 711 | 362 |
| Median Property Value | $89,700 | $100,200 |
| Median Household Income | $22,357 | $0 |
| Monthly Housing Costs | $157 | $13 |
| Real Estate Taxes | - | - |
Property Value by Mortgage Status in Florida
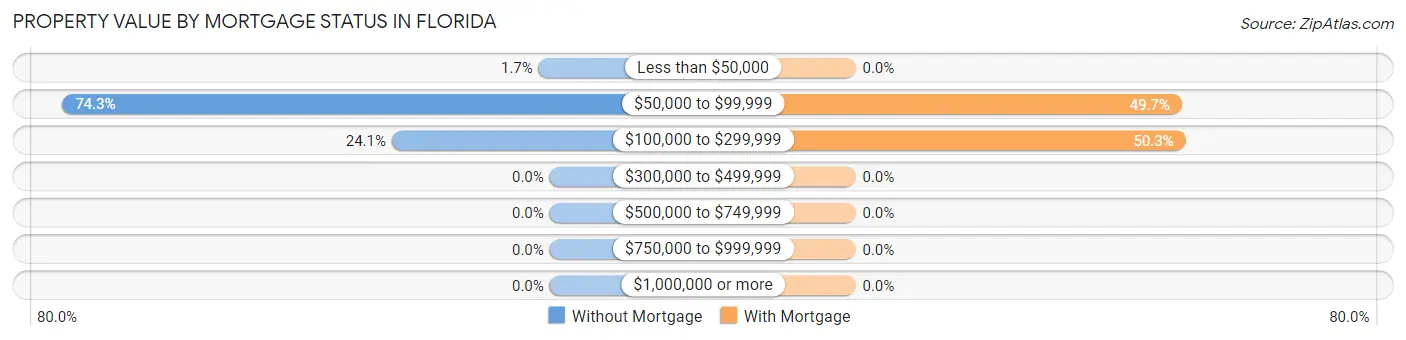
| Property Value | Without Mortgage | With Mortgage |
| Less than $50,000 | 12 (1.7%) | 0 (0.0%) |
| $50,000 to $99,999 | 528 (74.3%) | 180 (49.7%) |
| $100,000 to $299,999 | 171 (24.0%) | 182 (50.3%) |
| $300,000 to $499,999 | 0 (0.0%) | 0 (0.0%) |
| $500,000 to $749,999 | 0 (0.0%) | 0 (0.0%) |
| $750,000 to $999,999 | 0 (0.0%) | 0 (0.0%) |
| $1,000,000 or more | 0 (0.0%) | 0 (0.0%) |
| Total | 711 (100.0%) | 362 (100.0%) |
Household Income by Mortgage Status in Florida
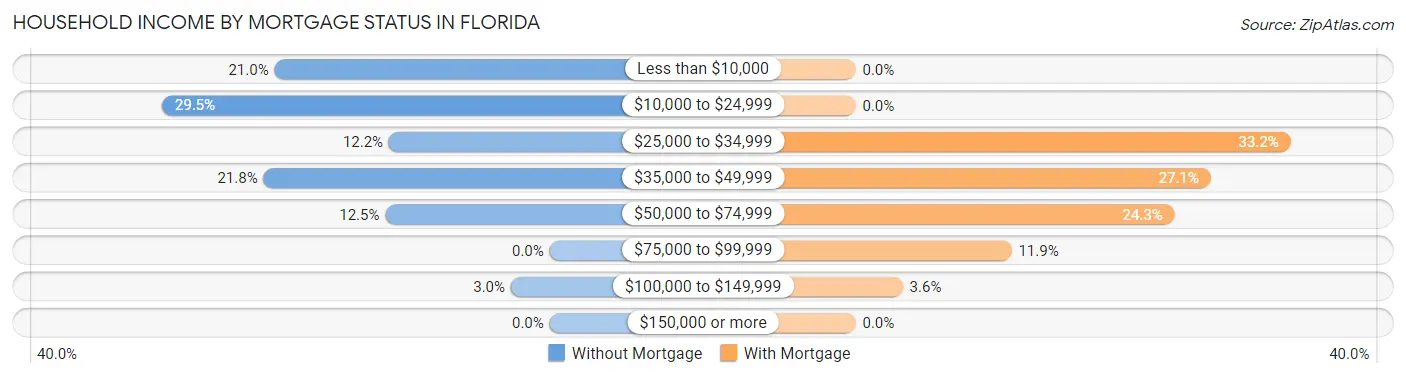
| Household Income | Without Mortgage | With Mortgage |
| Less than $10,000 | 149 (21.0%) | 0 (0.0%) |
| $10,000 to $24,999 | 210 (29.5%) | 0 (0.0%) |
| $25,000 to $34,999 | 87 (12.2%) | 120 (33.2%) |
| $35,000 to $49,999 | 155 (21.8%) | 98 (27.1%) |
| $50,000 to $74,999 | 89 (12.5%) | 88 (24.3%) |
| $75,000 to $99,999 | 0 (0.0%) | 43 (11.9%) |
| $100,000 to $149,999 | 21 (2.9%) | 13 (3.6%) |
| $150,000 or more | 0 (0.0%) | 0 (0.0%) |
| Total | 711 (100.0%) | 362 (100.0%) |
Property Value to Household Income Ratio in Florida
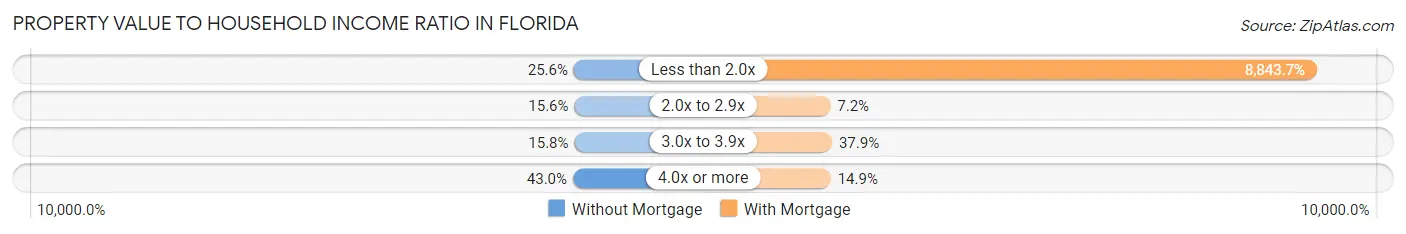
| Value-to-Income Ratio | Without Mortgage | With Mortgage |
| Less than 2.0x | 182 (25.6%) | 32,014 (8,843.6%) |
| 2.0x to 2.9x | 111 (15.6%) | 26 (7.2%) |
| 3.0x to 3.9x | 112 (15.8%) | 137 (37.9%) |
| 4.0x or more | 306 (43.0%) | 54 (14.9%) |
| Total | 711 (100.0%) | 362 (100.0%) |
Real Estate Taxes by Mortgage Status in Florida
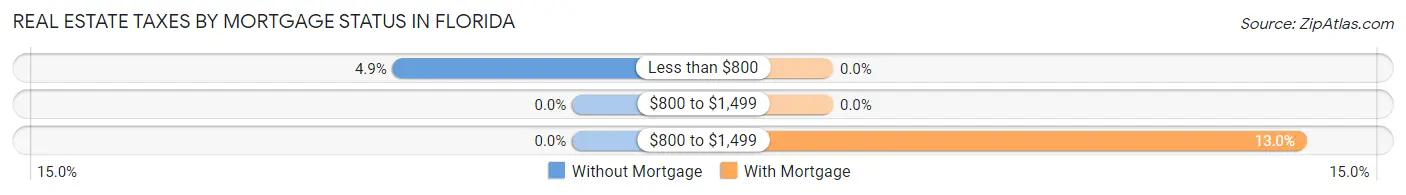
| Property Taxes | Without Mortgage | With Mortgage |
| Less than $800 | 35 (4.9%) | 0 (0.0%) |
| $800 to $1,499 | 0 (0.0%) | 0 (0.0%) |
| $800 to $1,499 | 0 (0.0%) | 47 (13.0%) |
| Total | 711 (100.0%) | 362 (100.0%) |
Health & Disability in Florida
Health Insurance Coverage by Age in Florida
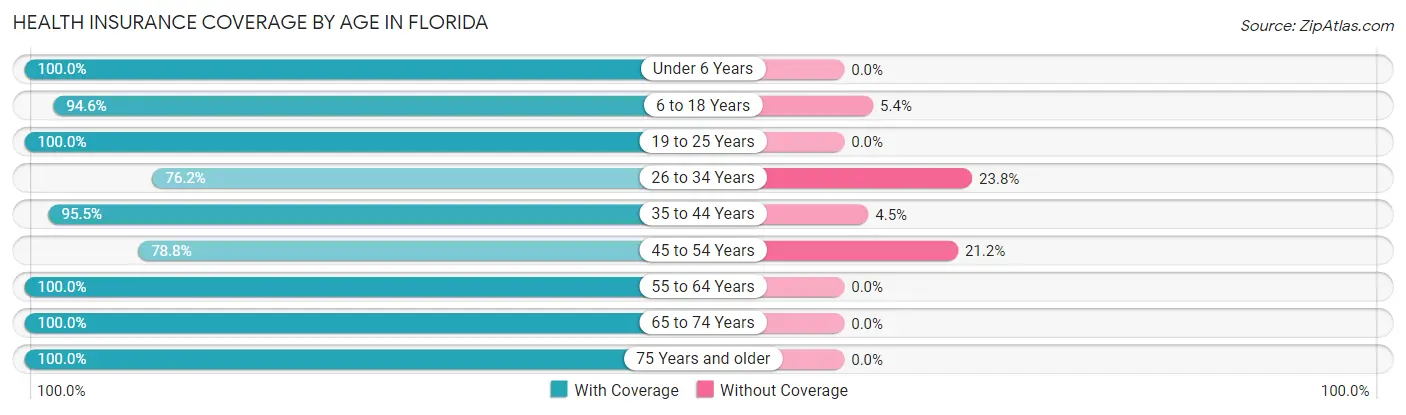
| Age Bracket | With Coverage | Without Coverage |
| Under 6 Years | 229 (100.0%) | 0 (0.0%) |
| 6 to 18 Years | 492 (94.6%) | 28 (5.4%) |
| 19 to 25 Years | 485 (100.0%) | 0 (0.0%) |
| 26 to 34 Years | 361 (76.2%) | 113 (23.8%) |
| 35 to 44 Years | 510 (95.5%) | 24 (4.5%) |
| 45 to 54 Years | 327 (78.8%) | 88 (21.2%) |
| 55 to 64 Years | 519 (100.0%) | 0 (0.0%) |
| 65 to 74 Years | 463 (100.0%) | 0 (0.0%) |
| 75 Years and older | 543 (100.0%) | 0 (0.0%) |
| Total | 3,929 (94.0%) | 253 (6.0%) |
Health Insurance Coverage by Citizenship Status in Florida
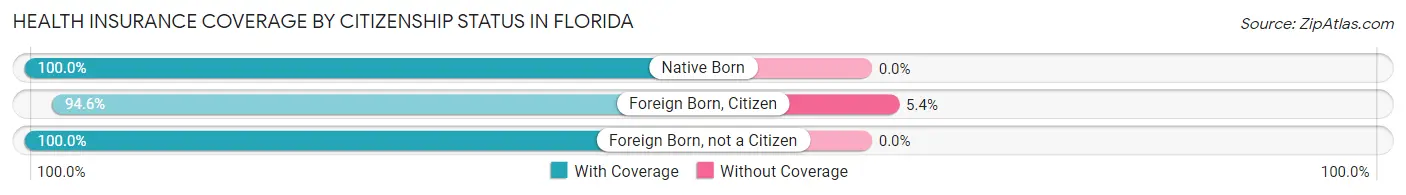
| Citizenship Status | With Coverage | Without Coverage |
| Native Born | 229 (100.0%) | 0 (0.0%) |
| Foreign Born, Citizen | 492 (94.6%) | 28 (5.4%) |
| Foreign Born, not a Citizen | 485 (100.0%) | 0 (0.0%) |
Health Insurance Coverage by Household Income in Florida
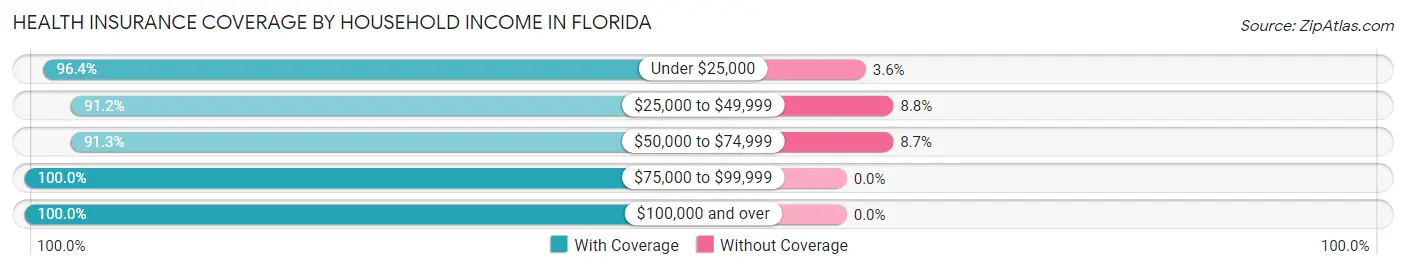
| Household Income | With Coverage | Without Coverage |
| Under $25,000 | 1,969 (96.4%) | 73 (3.6%) |
| $25,000 to $49,999 | 1,343 (91.2%) | 129 (8.8%) |
| $50,000 to $74,999 | 535 (91.3%) | 51 (8.7%) |
| $75,000 to $99,999 | 43 (100.0%) | 0 (0.0%) |
| $100,000 and over | 39 (100.0%) | 0 (0.0%) |
Public vs Private Health Insurance Coverage by Age in Florida
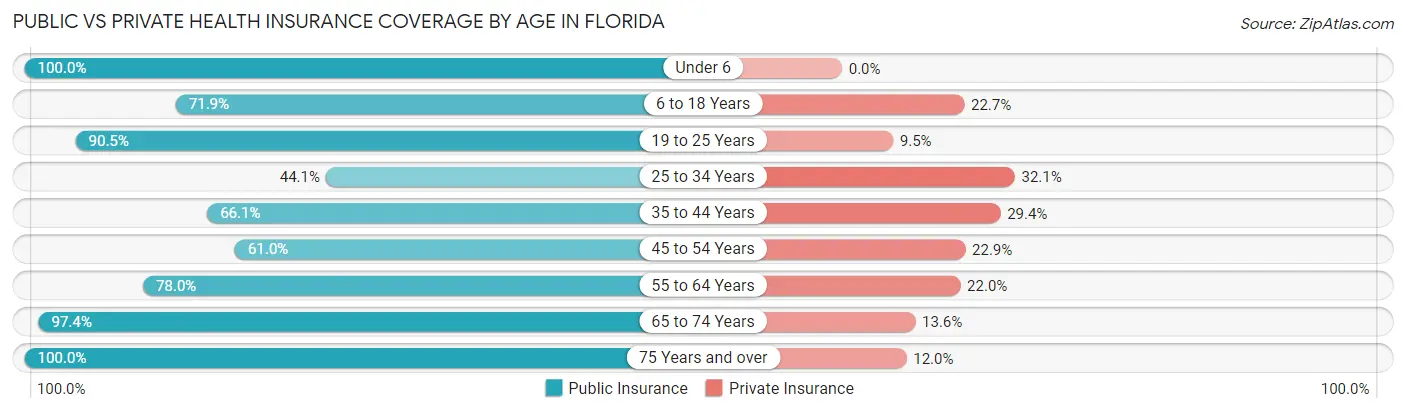
| Age Bracket | Public Insurance | Private Insurance |
| Under 6 | 229 (100.0%) | 0 (0.0%) |
| 6 to 18 Years | 374 (71.9%) | 118 (22.7%) |
| 19 to 25 Years | 439 (90.5%) | 46 (9.5%) |
| 25 to 34 Years | 209 (44.1%) | 152 (32.1%) |
| 35 to 44 Years | 353 (66.1%) | 157 (29.4%) |
| 45 to 54 Years | 253 (61.0%) | 95 (22.9%) |
| 55 to 64 Years | 405 (78.0%) | 114 (22.0%) |
| 65 to 74 Years | 451 (97.4%) | 63 (13.6%) |
| 75 Years and over | 543 (100.0%) | 65 (12.0%) |
| Total | 3,256 (77.9%) | 810 (19.4%) |
Disability Status by Sex by Age in Florida
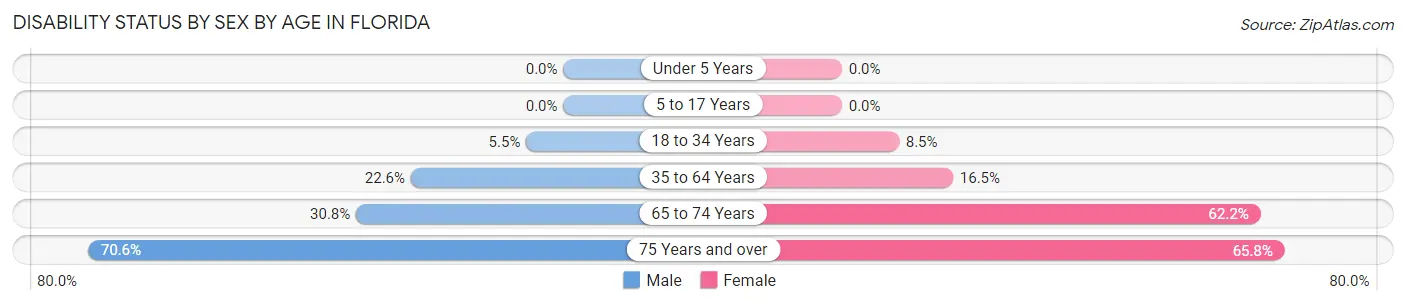
| Age Bracket | Male | Female |
| Under 5 Years | 0 (0.0%) | 0 (0.0%) |
| 5 to 17 Years | 0 (0.0%) | 0 (0.0%) |
| 18 to 34 Years | 31 (5.5%) | 39 (8.5%) |
| 35 to 64 Years | 158 (22.6%) | 127 (16.5%) |
| 65 to 74 Years | 44 (30.8%) | 199 (62.2%) |
| 75 Years and over | 173 (70.6%) | 196 (65.8%) |
Disability Class by Sex by Age in Florida
Disability Class: Hearing Difficulty
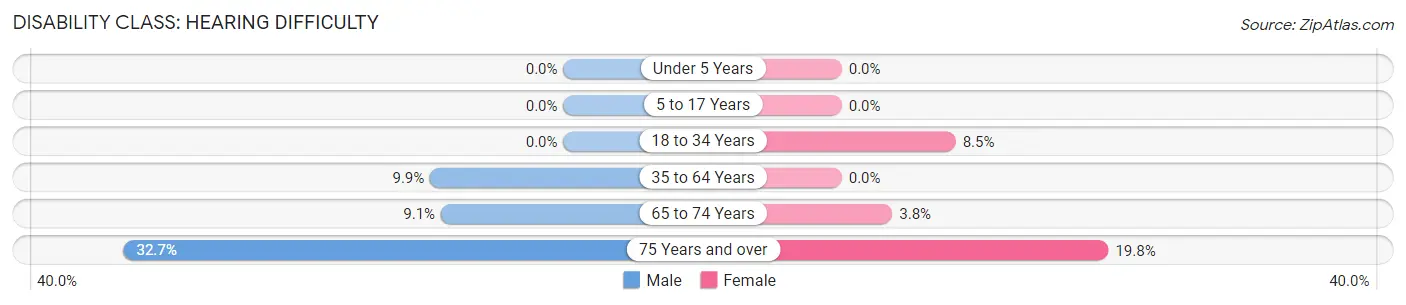
| Age Bracket | Male | Female |
| Under 5 Years | 0 (0.0%) | 0 (0.0%) |
| 5 to 17 Years | 0 (0.0%) | 0 (0.0%) |
| 18 to 34 Years | 0 (0.0%) | 39 (8.5%) |
| 35 to 64 Years | 69 (9.9%) | 0 (0.0%) |
| 65 to 74 Years | 13 (9.1%) | 12 (3.7%) |
| 75 Years and over | 80 (32.7%) | 59 (19.8%) |
Disability Class: Vision Difficulty
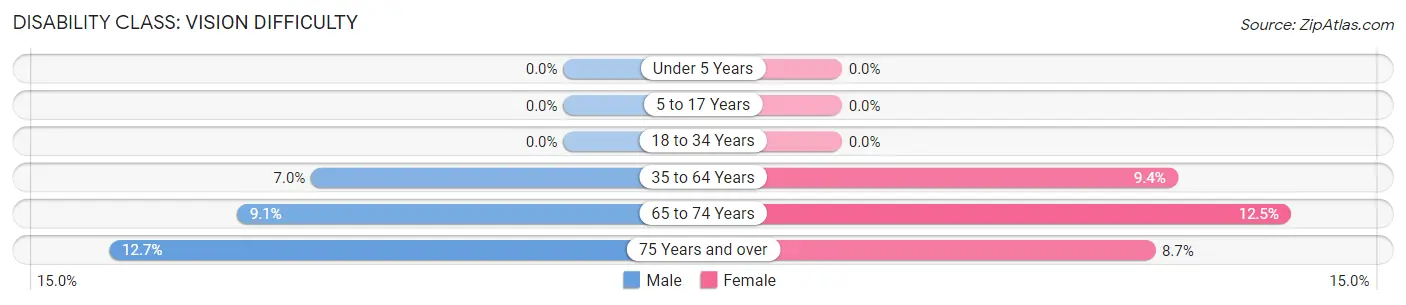
| Age Bracket | Male | Female |
| Under 5 Years | 0 (0.0%) | 0 (0.0%) |
| 5 to 17 Years | 0 (0.0%) | 0 (0.0%) |
| 18 to 34 Years | 0 (0.0%) | 0 (0.0%) |
| 35 to 64 Years | 49 (7.0%) | 72 (9.3%) |
| 65 to 74 Years | 13 (9.1%) | 40 (12.5%) |
| 75 Years and over | 31 (12.7%) | 26 (8.7%) |
Disability Class: Cognitive Difficulty
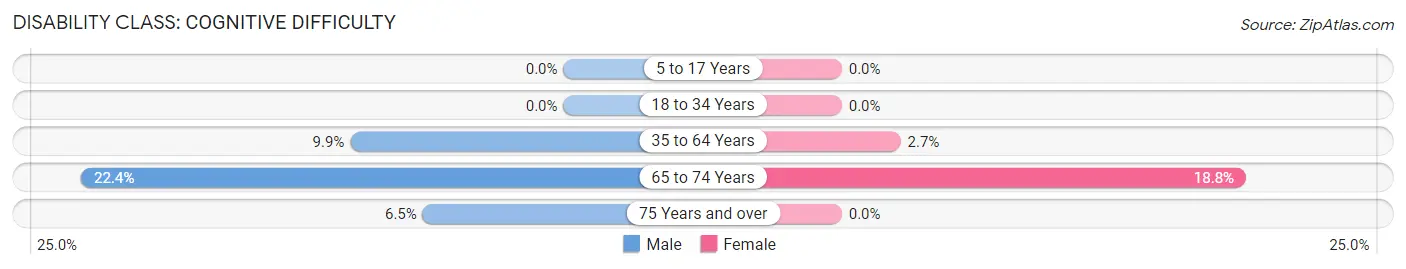
| Age Bracket | Male | Female |
| 5 to 17 Years | 0 (0.0%) | 0 (0.0%) |
| 18 to 34 Years | 0 (0.0%) | 0 (0.0%) |
| 35 to 64 Years | 69 (9.9%) | 21 (2.7%) |
| 65 to 74 Years | 32 (22.4%) | 60 (18.8%) |
| 75 Years and over | 16 (6.5%) | 0 (0.0%) |
Disability Class: Ambulatory Difficulty
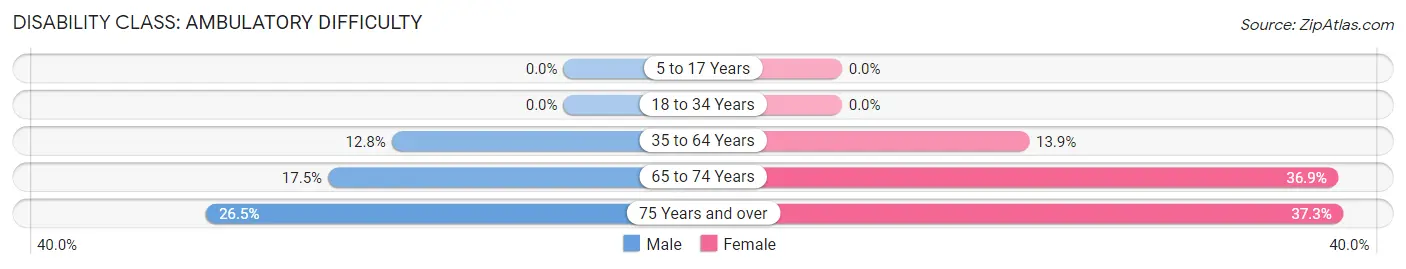
| Age Bracket | Male | Female |
| 5 to 17 Years | 0 (0.0%) | 0 (0.0%) |
| 18 to 34 Years | 0 (0.0%) | 0 (0.0%) |
| 35 to 64 Years | 89 (12.8%) | 107 (13.9%) |
| 65 to 74 Years | 25 (17.5%) | 118 (36.9%) |
| 75 Years and over | 65 (26.5%) | 111 (37.2%) |
Disability Class: Self-Care Difficulty
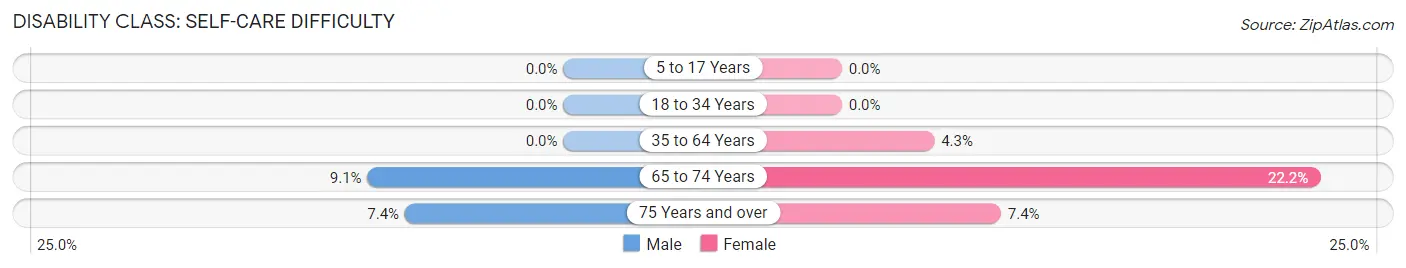
| Age Bracket | Male | Female |
| 5 to 17 Years | 0 (0.0%) | 0 (0.0%) |
| 18 to 34 Years | 0 (0.0%) | 0 (0.0%) |
| 35 to 64 Years | 0 (0.0%) | 33 (4.3%) |
| 65 to 74 Years | 13 (9.1%) | 71 (22.2%) |
| 75 Years and over | 18 (7.3%) | 22 (7.4%) |
Technology Access in Florida
Computing Device Access in Florida
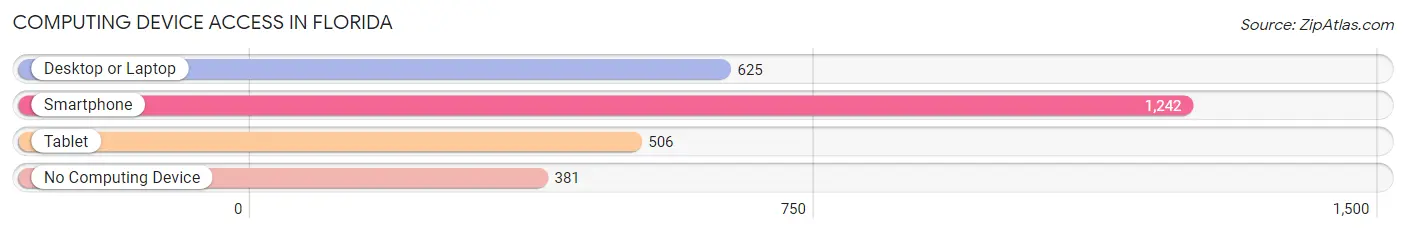
| Device Type | # Households | % Households |
| Desktop or Laptop | 625 | 37.4% |
| Smartphone | 1,242 | 74.3% |
| Tablet | 506 | 30.3% |
| No Computing Device | 381 | 22.8% |
| Total | 1,672 | 100.0% |
Internet Access in Florida
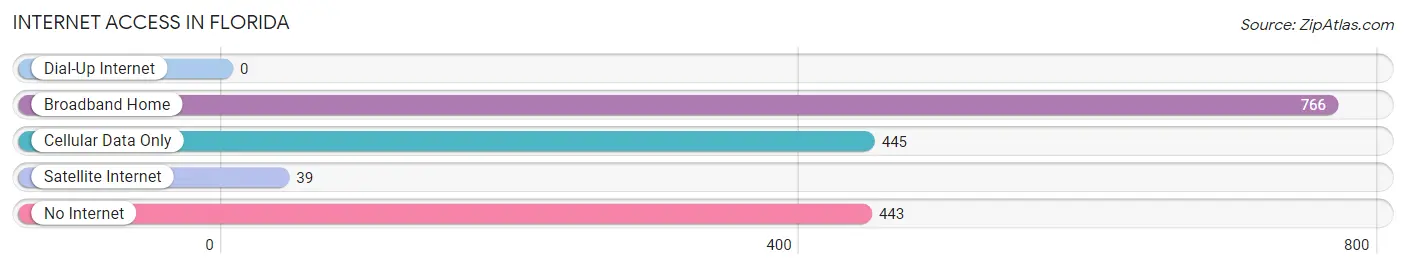
| Internet Type | # Households | % Households |
| Dial-Up Internet | 0 | 0.0% |
| Broadband Home | 766 | 45.8% |
| Cellular Data Only | 445 | 26.6% |
| Satellite Internet | 39 | 2.3% |
| No Internet | 443 | 26.5% |
| Total | 1,672 | 100.0% |
Florida Summary
Florida is a state located in the southeastern region of the United States. It is bordered by Alabama to the northwest, Georgia to the north, and the Gulf of Mexico to the south and west. Florida is the 22nd most populous state in the United States, with a population of over 21 million people as of 2019.
History
The first known inhabitants of Florida were the Paleo-Indians, who arrived in the region around 12,000 years ago. The first Europeans to explore the area were Spanish explorers, who arrived in the early 16th century. The Spanish established several settlements in the region, including St. Augustine, which is the oldest continuously inhabited European settlement in the United States.
In 1821, Florida became a United States territory, and in 1845 it was admitted as the 27th state. During the American Civil War, Florida seceded from the Union and joined the Confederate States of America. After the war, Florida experienced a period of rapid growth and development, becoming a major tourist destination and a hub for the citrus industry.
Geography
Florida is the 22nd largest state in the United States, covering an area of 65,755 square miles. It is the only state in the United States that borders both the Atlantic Ocean and the Gulf of Mexico. The state is divided into 67 counties, and its capital is Tallahassee.
Florida is home to a variety of landscapes, including beaches, swamps, forests, and wetlands. The highest point in the state is Britton Hill, which stands at 345 feet above sea level. The state is also home to several major rivers, including the St. Johns, the Suwannee, and the Apalachicola.
Economy
Florida has a diverse and vibrant economy. The state is a major tourist destination, and tourism is one of the largest industries in the state. Other major industries include agriculture, aerospace, and technology.
The state is also home to several major corporations, including Walt Disney World, Universal Studios, and SeaWorld. Florida is also a major hub for the aerospace industry, with companies such as Lockheed Martin and Boeing having a presence in the state.
Demographics
As of 2019, the population of Florida was estimated to be over 21 million people. The state is home to a diverse population, with the largest ethnic groups being White (64.5%), Hispanic or Latino (25.7%), and Black or African American (15.5%).
The median household income in Florida is $53,267, and the median home value is $219,000. The state has a poverty rate of 14.3%, and the unemployment rate is 3.3%.
Conclusion
Florida is a state located in the southeastern region of the United States. It has a rich history, diverse geography, and vibrant economy. The state is home to a diverse population, with the largest ethnic groups being White, Hispanic or Latino, and Black or African American. Florida is a major tourist destination, and tourism is one of the largest industries in the state. The state is also home to several major corporations, and it is a major hub for the aerospace industry.
Common Questions
What is Per Capita Income in Florida?
Per Capita income in Florida is $11,322.
What is the Median Family Income in Florida?
Median Family Income in Florida is $28,603.
What is the Median Household income in Florida?
Median Household Income in Florida is $23,292.
What is Income or Wage Gap in Florida?
Income or Wage Gap in Florida is 28.8%.
Women in Florida earn 71.2 cents for every dollar earned by a man.
What is Family Income Deficit in Florida?
Family Income Deficit in Florida is $11,037.
Families that are below poverty line in Florida earn $11,037 less on average than the poverty threshold level.
What is Inequality or Gini Index in Florida?
Inequality or Gini Index in Florida is 0.43.
What is the Total Population of Florida?
Total Population of Florida is 4,193.
What is the Total Male Population of Florida?
Total Male Population of Florida is 2,023.
What is the Total Female Population of Florida?
Total Female Population of Florida is 2,170.
What is the Ratio of Males per 100 Females in Florida?
There are 93.23 Males per 100 Females in Florida.
What is the Ratio of Females per 100 Males in Florida?
There are 107.27 Females per 100 Males in Florida.
What is the Median Population Age in Florida?
Median Population Age in Florida is 42.3 Years.
What is the Average Family Size in Florida
Average Family Size in Florida is 3.0 People.
What is the Average Household Size in Florida
Average Household Size in Florida is 2.5 People.
How Large is the Labor Force in Florida?
There are 1,594 People in the Labor Forcein in Florida.
What is the Percentage of People in the Labor Force in Florida?
44.8% of People are in the Labor Force in Florida.
What is the Unemployment Rate in Florida?
Unemployment Rate in Florida is 14.9%.