Monte Grande, PR Map & Demographics
Monte Grande Map
Monte Grande Overview
$13,672
PER CAPITA INCOME
$36,250
AVG FAMILY INCOME
$25,747
AVG HOUSEHOLD INCOME
21.2%
WAGE / INCOME GAP [ % ]
78.8¢/ $1
WAGE / INCOME GAP [ $ ]
$8,769
FAMILY INCOME DEFICIT
0.41
INEQUALITY / GINI INDEX
2,902
TOTAL POPULATION
1,520
MALE POPULATION
1,382
FEMALE POPULATION
109.99
MALES / 100 FEMALES
90.92
FEMALES / 100 MALES
42.0
MEDIAN AGE
3.8
AVG FAMILY SIZE
2.8
AVG HOUSEHOLD SIZE
1,354
LABOR FORCE [ PEOPLE ]
56.2%
PERCENT IN LABOR FORCE
10.3%
UNEMPLOYMENT RATE
Income in Monte Grande
Income Overview in Monte Grande
Per Capita Income in Monte Grande is $13,672, while median incomes of families and households are $36,250 and $25,747 respectively.
| Characteristic | Number | Measure |
| Per Capita Income | 2,902 | $13,672 |
| Median Family Income | 628 | $36,250 |
| Mean Family Income | 628 | $41,387 |
| Median Household Income | 1,039 | $25,747 |
| Mean Household Income | 1,039 | $32,874 |
| Income Deficit | 628 | $8,769 |
| Wage / Income Gap (%) | 2,902 | 21.25% |
| Wage / Income Gap ($) | 2,902 | 78.75¢ per $1 |
| Gini / Inequality Index | 2,902 | 0.41 |
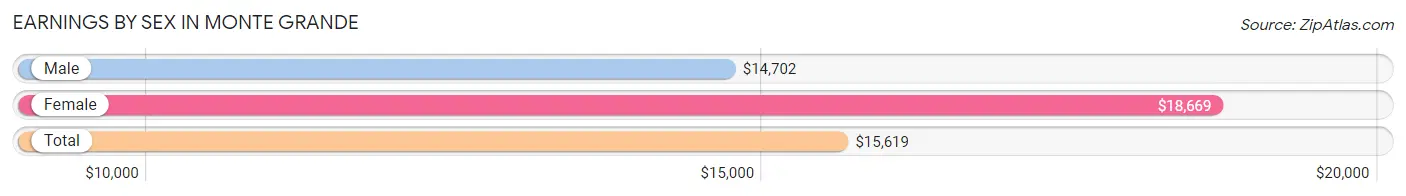
Earnings by Sex in Monte Grande
Average Earnings in Monte Grande are $15,619, $14,702 for men and $18,669 for women, a difference of 21.2%.
| Sex | Number | Average Earnings |
| Male | 705 (55.3%) | $14,702 |
| Female | 570 (44.7%) | $18,669 |
| Total | 1,275 (100.0%) | $15,619 |
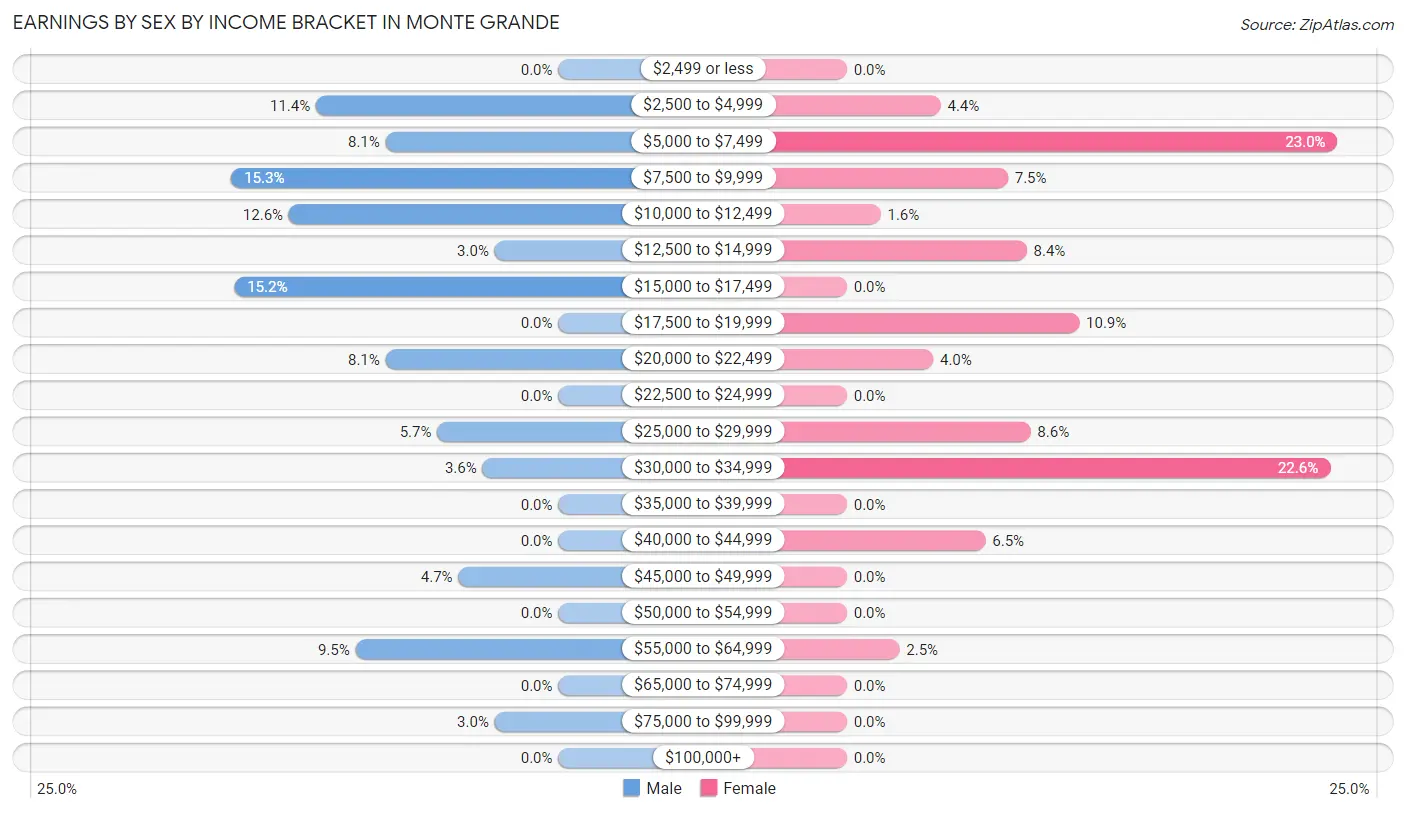
Earnings by Sex by Income Bracket in Monte Grande
The most common earnings brackets in Monte Grande are $7,500 to $9,999 for men (108 | 15.3%) and $5,000 to $7,499 for women (131 | 23.0%).
| Income | Male | Female |
| $2,499 or less | 0 (0.0%) | 0 (0.0%) |
| $2,500 to $4,999 | 80 (11.4%) | 25 (4.4%) |
| $5,000 to $7,499 | 57 (8.1%) | 131 (23.0%) |
| $7,500 to $9,999 | 108 (15.3%) | 43 (7.5%) |
| $10,000 to $12,499 | 89 (12.6%) | 9 (1.6%) |
| $12,500 to $14,999 | 21 (3.0%) | 48 (8.4%) |
| $15,000 to $17,499 | 107 (15.2%) | 0 (0.0%) |
| $17,500 to $19,999 | 0 (0.0%) | 62 (10.9%) |
| $20,000 to $22,499 | 57 (8.1%) | 23 (4.0%) |
| $22,500 to $24,999 | 0 (0.0%) | 0 (0.0%) |
| $25,000 to $29,999 | 40 (5.7%) | 49 (8.6%) |
| $30,000 to $34,999 | 25 (3.5%) | 129 (22.6%) |
| $35,000 to $39,999 | 0 (0.0%) | 0 (0.0%) |
| $40,000 to $44,999 | 0 (0.0%) | 37 (6.5%) |
| $45,000 to $49,999 | 33 (4.7%) | 0 (0.0%) |
| $50,000 to $54,999 | 0 (0.0%) | 0 (0.0%) |
| $55,000 to $64,999 | 67 (9.5%) | 14 (2.5%) |
| $65,000 to $74,999 | 0 (0.0%) | 0 (0.0%) |
| $75,000 to $99,999 | 21 (3.0%) | 0 (0.0%) |
| $100,000+ | 0 (0.0%) | 0 (0.0%) |
| Total | 705 (100.0%) | 570 (100.0%) |
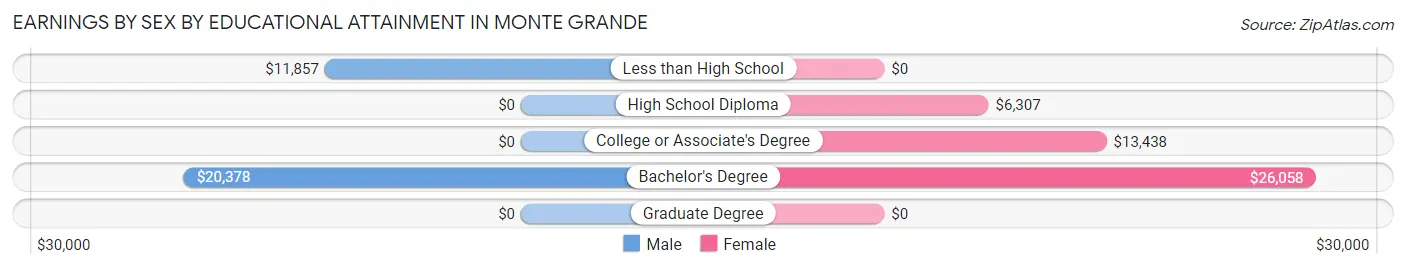
Earnings by Sex by Educational Attainment in Monte Grande
Average earnings in Monte Grande are $16,484 for men and $18,911 for women, a difference of 12.8%. Men with an educational attainment of bachelor's degree enjoy the highest average annual earnings of $20,378, while those with less than high school education earn the least with $11,857. Women with an educational attainment of bachelor's degree earn the most with the average annual earnings of $26,058, while those with high school diploma education have the smallest earnings of $6,307.
| Educational Attainment | Male Income | Female Income |
| Less than High School | $11,857 | $0 |
| High School Diploma | - | - |
| College or Associate's Degree | - | - |
| Bachelor's Degree | $20,378 | $26,058 |
| Graduate Degree | - | - |
| Total | $16,484 | $18,911 |
Family Income in Monte Grande
Family Income Brackets in Monte Grande
According to the Monte Grande family income data, there are 137 families falling into the $50,000 to $74,999 income range, which is the most common income bracket and makes up 21.8% of all families.
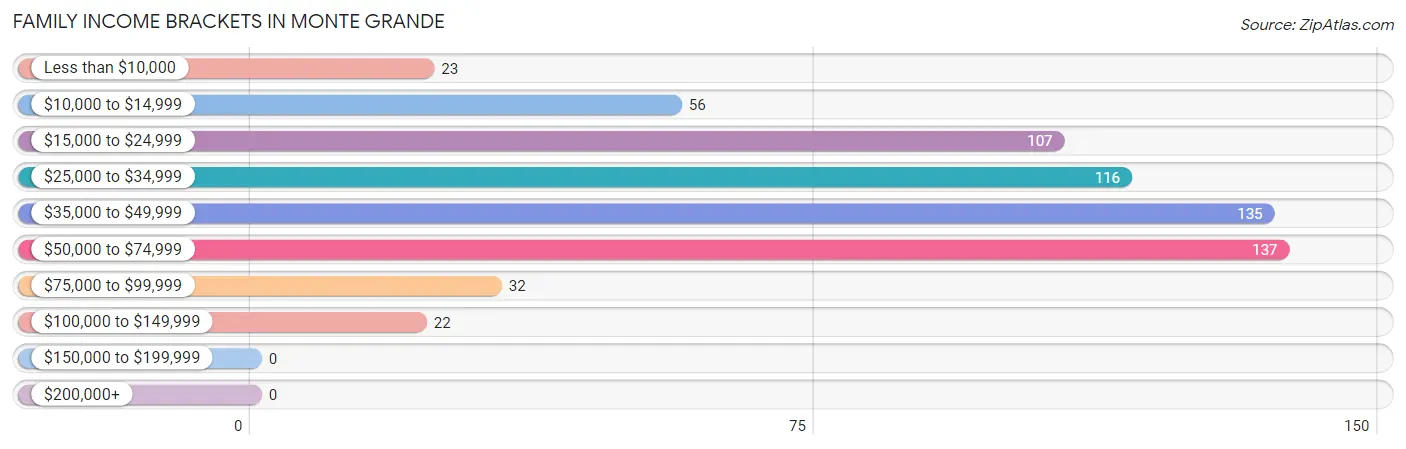
| Income Bracket | # Families | % Families |
| Less than $10,000 | 23 | 3.7% |
| $10,000 to $14,999 | 56 | 8.9% |
| $15,000 to $24,999 | 107 | 17.0% |
| $25,000 to $34,999 | 116 | 18.5% |
| $35,000 to $49,999 | 135 | 21.5% |
| $50,000 to $74,999 | 137 | 21.8% |
| $75,000 to $99,999 | 32 | 5.1% |
| $100,000 to $149,999 | 22 | 3.5% |
| $150,000 to $199,999 | 0 | 0.0% |
| $200,000+ | 0 | 0.0% |
Family Income by Famaliy Size in Monte Grande
4-person families (190 | 30.2%) account for the highest median family income in Monte Grande with $44,063 per family, while 3-person families (185 | 29.5%) have the highest median income of $14,479 per family member.
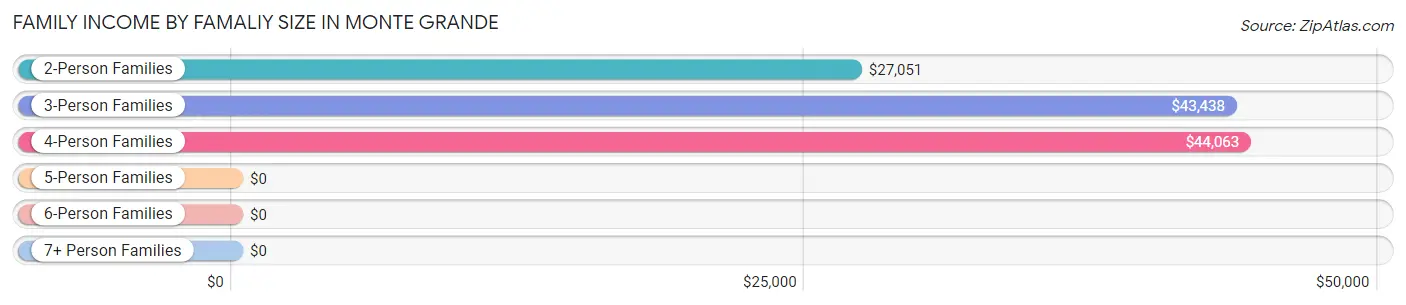
| Income Bracket | # Families | Median Income |
| 2-Person Families | 218 (34.7%) | $27,051 |
| 3-Person Families | 185 (29.5%) | $43,438 |
| 4-Person Families | 190 (30.2%) | $44,063 |
| 5-Person Families | 0 (0.0%) | $0 |
| 6-Person Families | 35 (5.6%) | $0 |
| 7+ Person Families | 0 (0.0%) | $0 |
| Total | 628 (100.0%) | $36,250 |
Family Income by Number of Earners in Monte Grande
The median family income in Monte Grande is $36,250, with families comprising 2 earners (241) having the highest median family income of $53,277, while families with no earners (201) have the lowest median family income of $21,895, accounting for 38.4% and 32.0% of families, respectively.
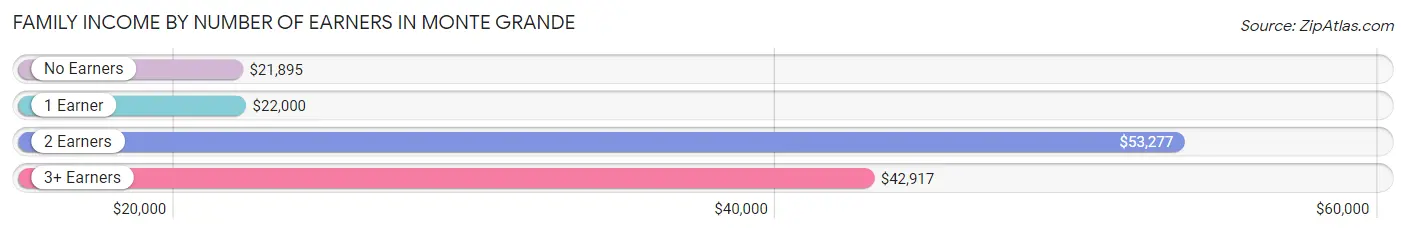
| Number of Earners | # Families | Median Income |
| No Earners | 201 (32.0%) | $21,895 |
| 1 Earner | 112 (17.8%) | $22,000 |
| 2 Earners | 241 (38.4%) | $53,277 |
| 3+ Earners | 74 (11.8%) | $42,917 |
| Total | 628 (100.0%) | $36,250 |
Household Income in Monte Grande
Household Income Brackets in Monte Grande
With 227 households falling in the category, the $15,000 to $24,999 income range is the most frequent in Monte Grande, accounting for 21.8% of all households.
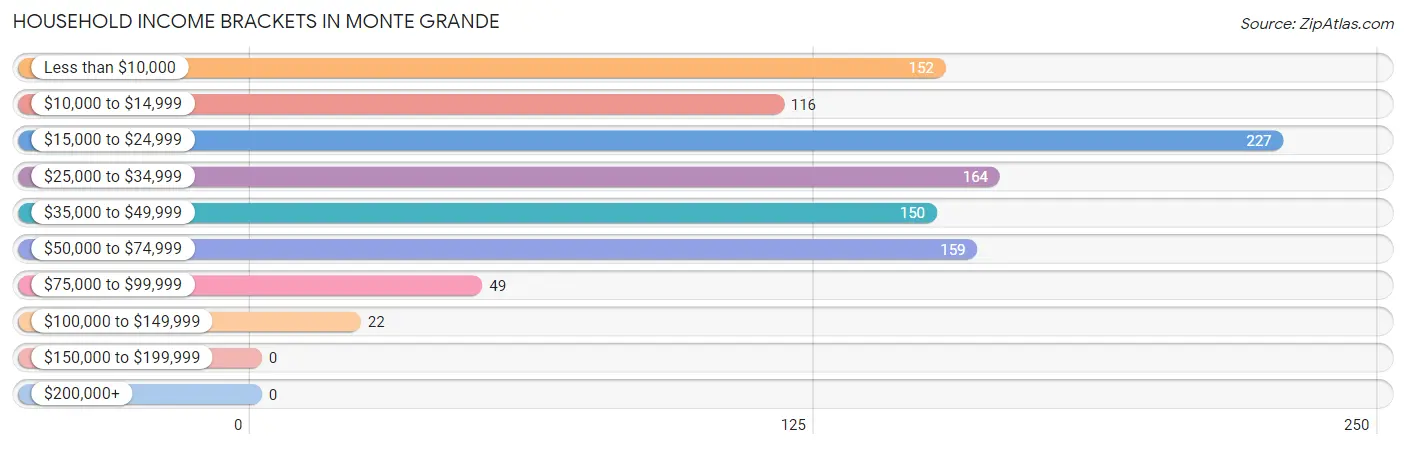
| Income Bracket | # Households | % Households |
| Less than $10,000 | 152 | 14.6% |
| $10,000 to $14,999 | 116 | 11.2% |
| $15,000 to $24,999 | 227 | 21.8% |
| $25,000 to $34,999 | 164 | 15.8% |
| $35,000 to $49,999 | 150 | 14.4% |
| $50,000 to $74,999 | 159 | 15.3% |
| $75,000 to $99,999 | 49 | 4.7% |
| $100,000 to $149,999 | 22 | 2.1% |
| $150,000 to $199,999 | 0 | 0.0% |
| $200,000+ | 0 | 0.0% |
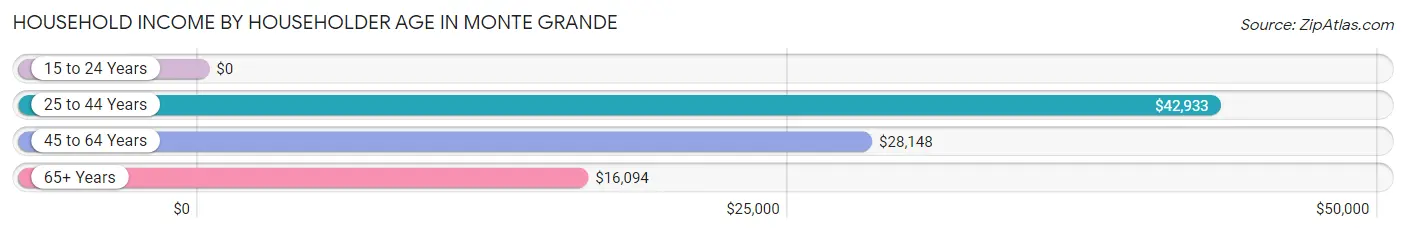
Household Income by Householder Age in Monte Grande
The median household income in Monte Grande is $25,747, with the highest median household income of $42,933 found in the 25 to 44 years age bracket for the primary householder. A total of 267 households (25.7%) fall into this category.
| Income Bracket | # Households | Median Income |
| 15 to 24 Years | 0 (0.0%) | $0 |
| 25 to 44 Years | 267 (25.7%) | $42,933 |
| 45 to 64 Years | 440 (42.3%) | $28,148 |
| 65+ Years | 332 (32.0%) | $16,094 |
| Total | 1,039 (100.0%) | $25,747 |
Poverty in Monte Grande
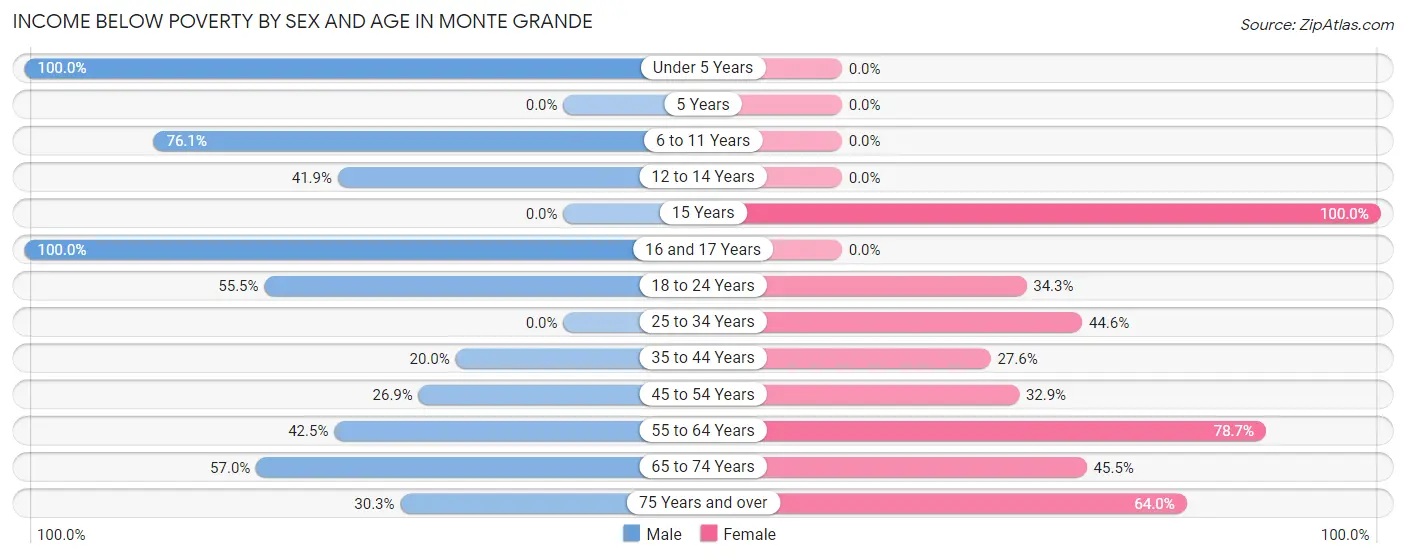
Income Below Poverty by Sex and Age in Monte Grande
With 39.6% poverty level for males and 40.5% for females among the residents of Monte Grande, under 5 year old males and 15 year old females are the most vulnerable to poverty, with 24 males (100.0%) and 13 females (100.0%) in their respective age groups living below the poverty level.
| Age Bracket | Male | Female |
| Under 5 Years | 24 (100.0%) | 0 (0.0%) |
| 5 Years | 0 (0.0%) | 0 (0.0%) |
| 6 to 11 Years | 162 (76.1%) | 0 (0.0%) |
| 12 to 14 Years | 18 (41.9%) | 0 (0.0%) |
| 15 Years | 0 (0.0%) | 13 (100.0%) |
| 16 and 17 Years | 17 (100.0%) | 0 (0.0%) |
| 18 to 24 Years | 116 (55.5%) | 25 (34.3%) |
| 25 to 34 Years | 0 (0.0%) | 66 (44.6%) |
| 35 to 44 Years | 21 (20.0%) | 69 (27.6%) |
| 45 to 54 Years | 65 (26.9%) | 72 (32.9%) |
| 55 to 64 Years | 74 (42.5%) | 170 (78.7%) |
| 65 to 74 Years | 69 (57.0%) | 65 (45.5%) |
| 75 Years and over | 36 (30.2%) | 80 (64.0%) |
| Total | 602 (39.6%) | 560 (40.5%) |
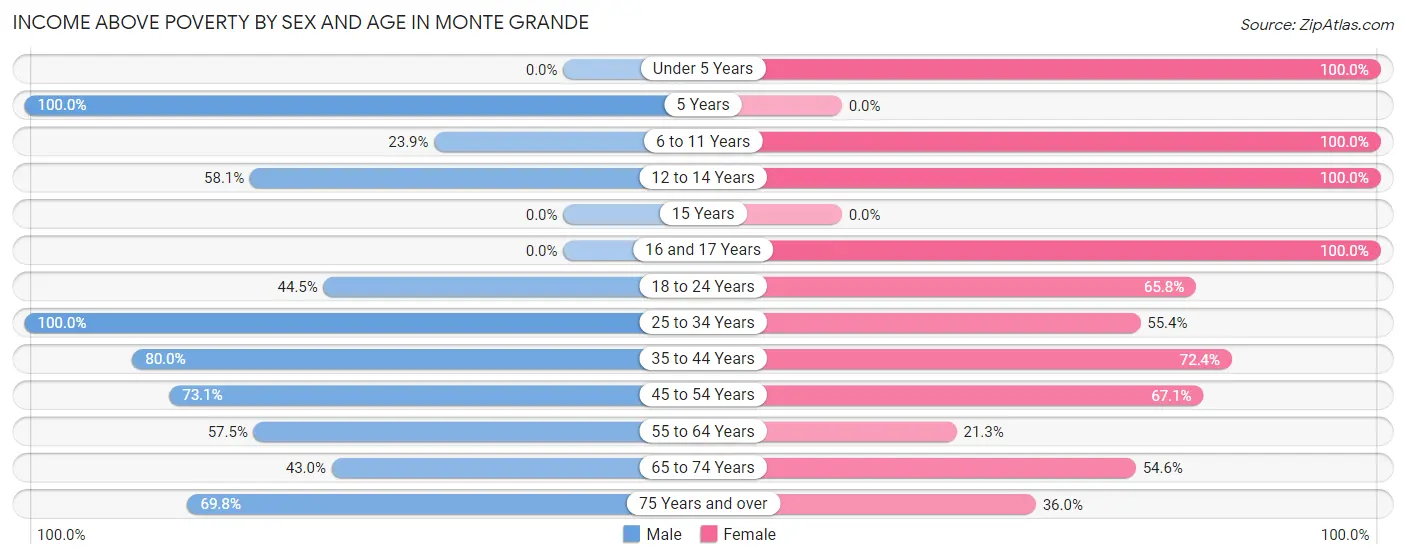
Income Above Poverty by Sex and Age in Monte Grande
According to the poverty statistics in Monte Grande, males aged 5 years and females aged under 5 years are the age groups that are most secure financially, with 100.0% of males and 100.0% of females in these age groups living above the poverty line.
| Age Bracket | Male | Female |
| Under 5 Years | 0 (0.0%) | 48 (100.0%) |
| 5 Years | 36 (100.0%) | 0 (0.0%) |
| 6 to 11 Years | 51 (23.9%) | 34 (100.0%) |
| 12 to 14 Years | 25 (58.1%) | 81 (100.0%) |
| 15 Years | 0 (0.0%) | 0 (0.0%) |
| 16 and 17 Years | 0 (0.0%) | 32 (100.0%) |
| 18 to 24 Years | 93 (44.5%) | 48 (65.7%) |
| 25 to 34 Years | 217 (100.0%) | 82 (55.4%) |
| 35 to 44 Years | 84 (80.0%) | 181 (72.4%) |
| 45 to 54 Years | 177 (73.1%) | 147 (67.1%) |
| 55 to 64 Years | 100 (57.5%) | 46 (21.3%) |
| 65 to 74 Years | 52 (43.0%) | 78 (54.5%) |
| 75 Years and over | 83 (69.8%) | 45 (36.0%) |
| Total | 918 (60.4%) | 822 (59.5%) |
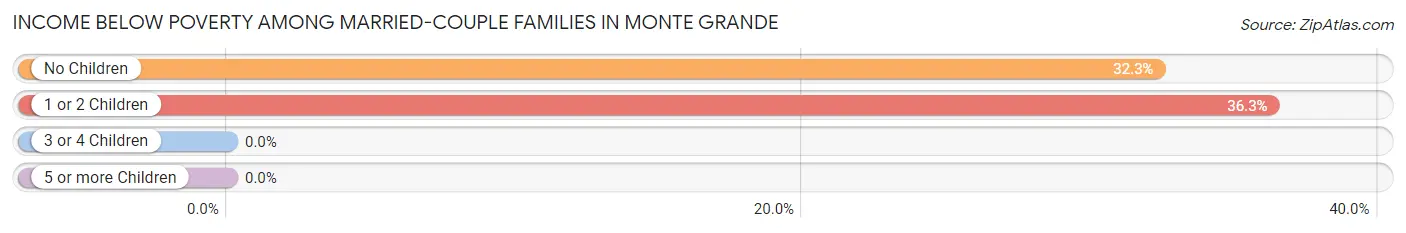
Income Below Poverty Among Married-Couple Families in Monte Grande
The poverty statistics for married-couple families in Monte Grande show that 34.0% or 134 of the total 394 families live below the poverty line. Families with 1 or 2 children have the highest poverty rate of 36.3%, comprising of 62 families. On the other hand, families with no children have the lowest poverty rate of 32.3%, which includes 72 families.
| Children | Above Poverty | Below Poverty |
| No Children | 151 (67.7%) | 72 (32.3%) |
| 1 or 2 Children | 109 (63.7%) | 62 (36.3%) |
| 3 or 4 Children | 0 (0.0%) | 0 (0.0%) |
| 5 or more Children | 0 (0.0%) | 0 (0.0%) |
| Total | 260 (66.0%) | 134 (34.0%) |
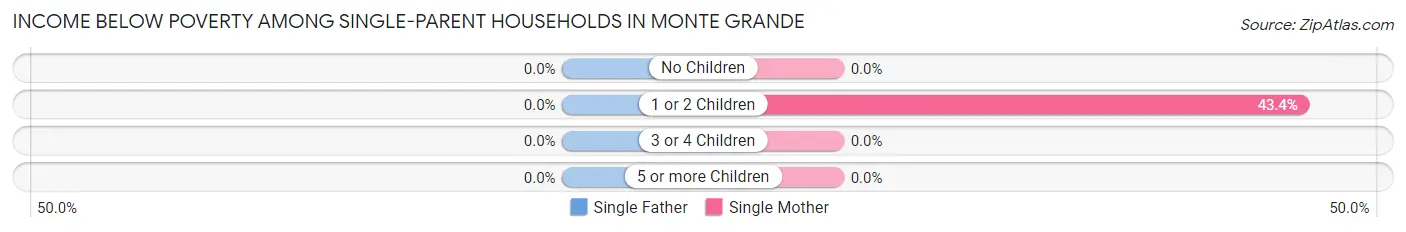
Income Below Poverty Among Single-Parent Households in Monte Grande
| Children | Single Father | Single Mother |
| No Children | 0 (0.0%) | 0 (0.0%) |
| 1 or 2 Children | 0 (0.0%) | 69 (43.4%) |
| 3 or 4 Children | 0 (0.0%) | 0 (0.0%) |
| 5 or more Children | 0 (0.0%) | 0 (0.0%) |
| Total | 0 (0.0%) | 69 (29.5%) |
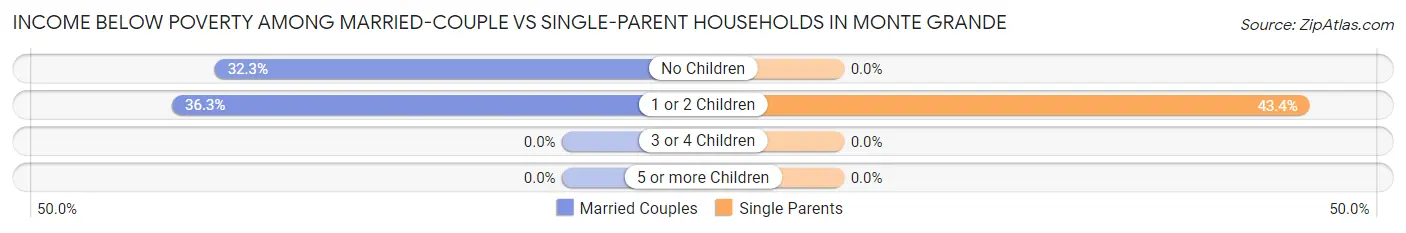
Income Below Poverty Among Married-Couple vs Single-Parent Households in Monte Grande
The poverty data for Monte Grande shows that 134 of the married-couple family households (34.0%) and 69 of the single-parent households (29.5%) are living below the poverty level. Within the married-couple family households, those with 1 or 2 children have the highest poverty rate, with 62 households (36.3%) falling below the poverty line. Among the single-parent households, those with 1 or 2 children have the highest poverty rate, with 69 household (43.4%) living below poverty.
| Children | Married-Couple Families | Single-Parent Households |
| No Children | 72 (32.3%) | 0 (0.0%) |
| 1 or 2 Children | 62 (36.3%) | 69 (43.4%) |
| 3 or 4 Children | 0 (0.0%) | 0 (0.0%) |
| 5 or more Children | 0 (0.0%) | 0 (0.0%) |
| Total | 134 (34.0%) | 69 (29.5%) |
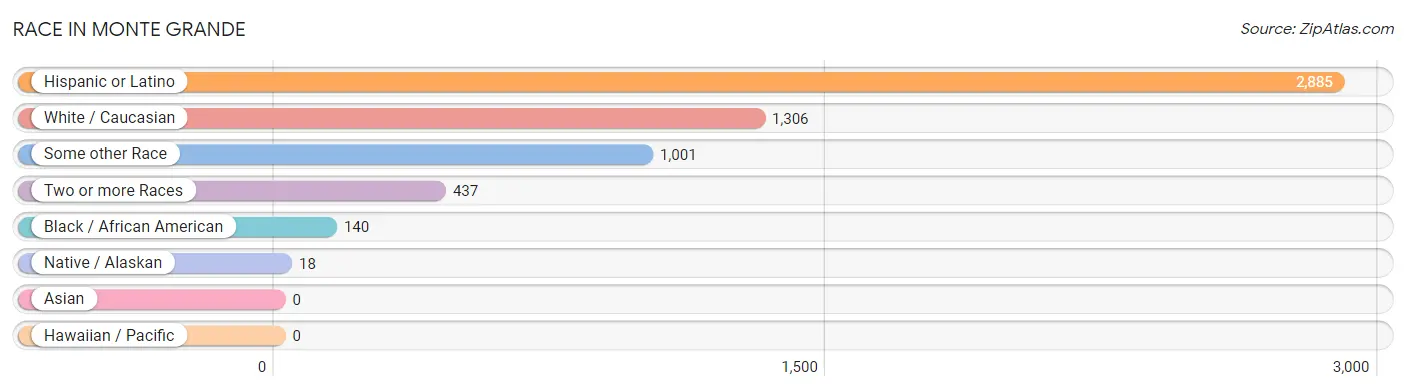
Race in Monte Grande
The most populous races in Monte Grande are Hispanic or Latino (2,885 | 99.4%), White / Caucasian (1,306 | 45.0%), and Some other Race (1,001 | 34.5%).
| Race | # Population | % Population |
| Asian | 0 | 0.0% |
| Black / African American | 140 | 4.8% |
| Hawaiian / Pacific | 0 | 0.0% |
| Hispanic or Latino | 2,885 | 99.4% |
| Native / Alaskan | 18 | 0.6% |
| White / Caucasian | 1,306 | 45.0% |
| Two or more Races | 437 | 15.1% |
| Some other Race | 1,001 | 34.5% |
| Total | 2,902 | 100.0% |
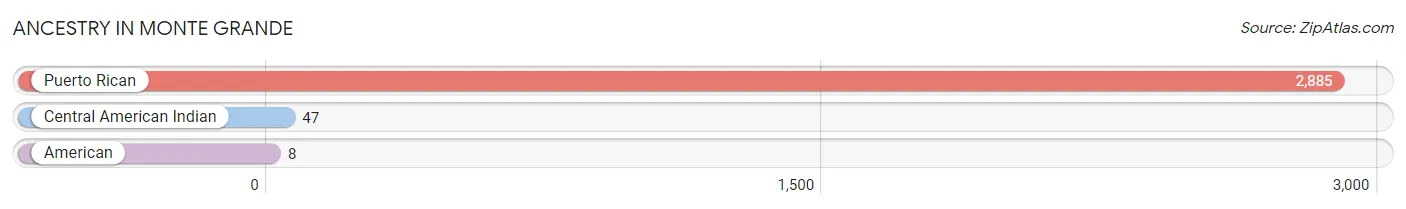
Ancestry in Monte Grande
The most populous ancestries reported in Monte Grande are Puerto Rican (2,885 | 99.4%), Central American Indian (47 | 1.6%), and American (8 | 0.3%), together accounting for 101.3% of all Monte Grande residents.
| Ancestry | # Population | % Population |
| American | 8 | 0.3% |
| Central American Indian | 47 | 1.6% |
| Puerto Rican | 2,885 | 99.4% | View All 3 Rows |
Immigrants in Monte Grande

| Immigration Origin | # Population | % Population | View All 0 Rows |
Sex and Age in Monte Grande
Sex and Age in Monte Grande
The most populous age groups in Monte Grande are 25 to 29 Years (168 | 11.1%) for men and 60 to 64 Years (182 | 13.2%) for women.
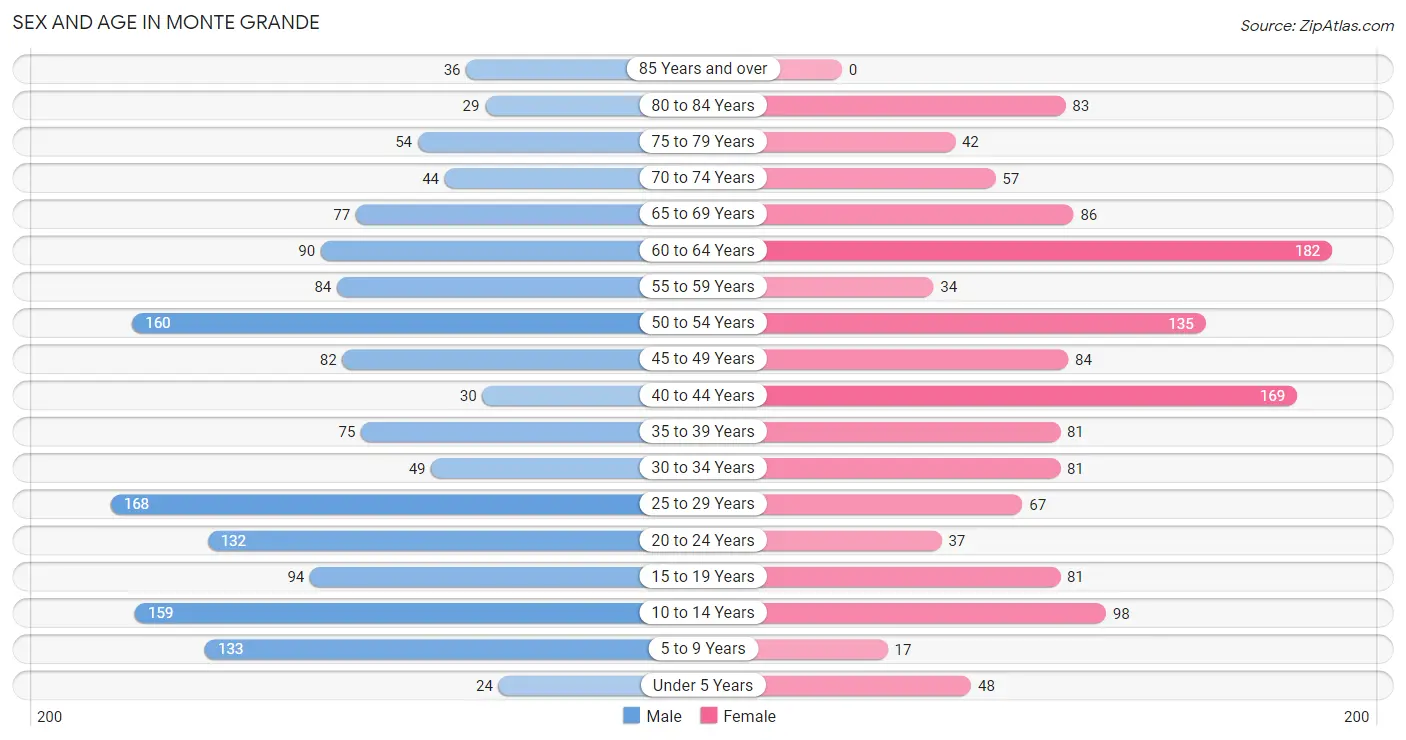
| Age Bracket | Male | Female |
| Under 5 Years | 24 (1.6%) | 48 (3.5%) |
| 5 to 9 Years | 133 (8.7%) | 17 (1.2%) |
| 10 to 14 Years | 159 (10.5%) | 98 (7.1%) |
| 15 to 19 Years | 94 (6.2%) | 81 (5.9%) |
| 20 to 24 Years | 132 (8.7%) | 37 (2.7%) |
| 25 to 29 Years | 168 (11.1%) | 67 (4.9%) |
| 30 to 34 Years | 49 (3.2%) | 81 (5.9%) |
| 35 to 39 Years | 75 (4.9%) | 81 (5.9%) |
| 40 to 44 Years | 30 (2.0%) | 169 (12.2%) |
| 45 to 49 Years | 82 (5.4%) | 84 (6.1%) |
| 50 to 54 Years | 160 (10.5%) | 135 (9.8%) |
| 55 to 59 Years | 84 (5.5%) | 34 (2.5%) |
| 60 to 64 Years | 90 (5.9%) | 182 (13.2%) |
| 65 to 69 Years | 77 (5.1%) | 86 (6.2%) |
| 70 to 74 Years | 44 (2.9%) | 57 (4.1%) |
| 75 to 79 Years | 54 (3.5%) | 42 (3.0%) |
| 80 to 84 Years | 29 (1.9%) | 83 (6.0%) |
| 85 Years and over | 36 (2.4%) | 0 (0.0%) |
| Total | 1,520 (100.0%) | 1,382 (100.0%) |
Families and Households in Monte Grande
Median Family Size in Monte Grande
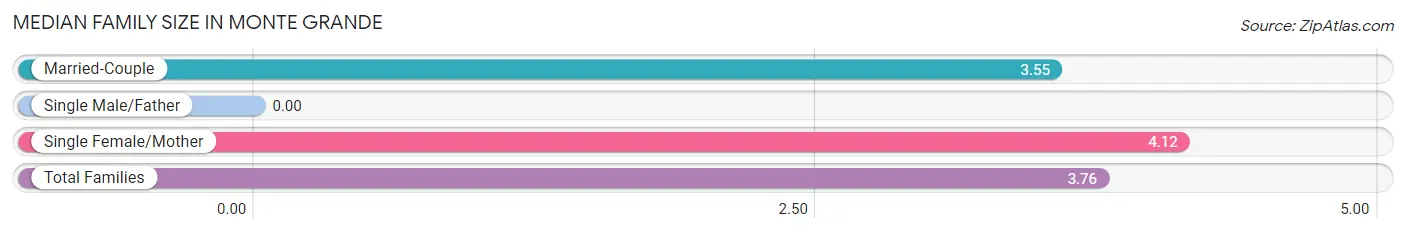
| Family Type | # Families | Family Size |
| Married-Couple | 394 (62.7%) | 3.55 |
| Single Male/Father | 0 (0.0%) | - |
| Single Female/Mother | 234 (37.3%) | 4.12 |
| Total Families | 628 (100.0%) | 3.76 |
Median Household Size in Monte Grande
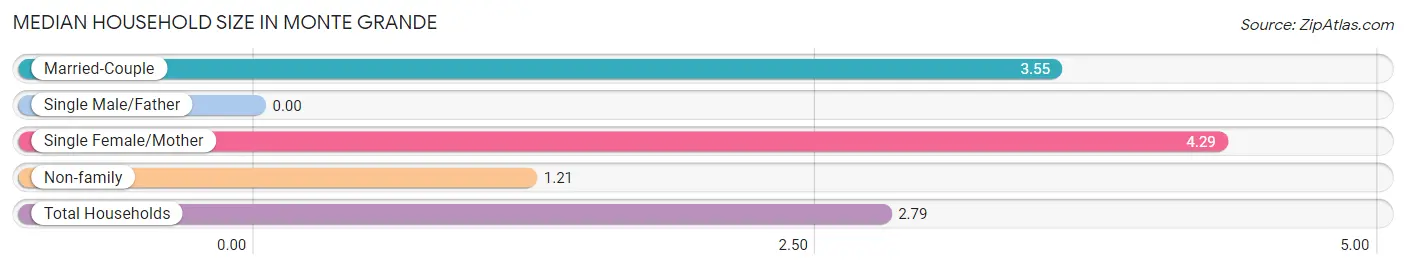
| Household Type | # Households | Household Size |
| Married-Couple | 394 (37.9%) | 3.55 |
| Single Male/Father | 0 (0.0%) | - |
| Single Female/Mother | 234 (22.5%) | 4.29 |
| Non-family | 411 (39.6%) | 1.21 |
| Total Households | 1,039 (100.0%) | 2.79 |
Household Size by Marriage Status in Monte Grande
Out of a total of 1,039 households in Monte Grande, 628 (60.4%) are family households, while 411 (39.6%) are nonfamily households. The most numerous type of family households are 2-person households, comprising 210, and the most common type of nonfamily households are 1-person households, comprising 337.
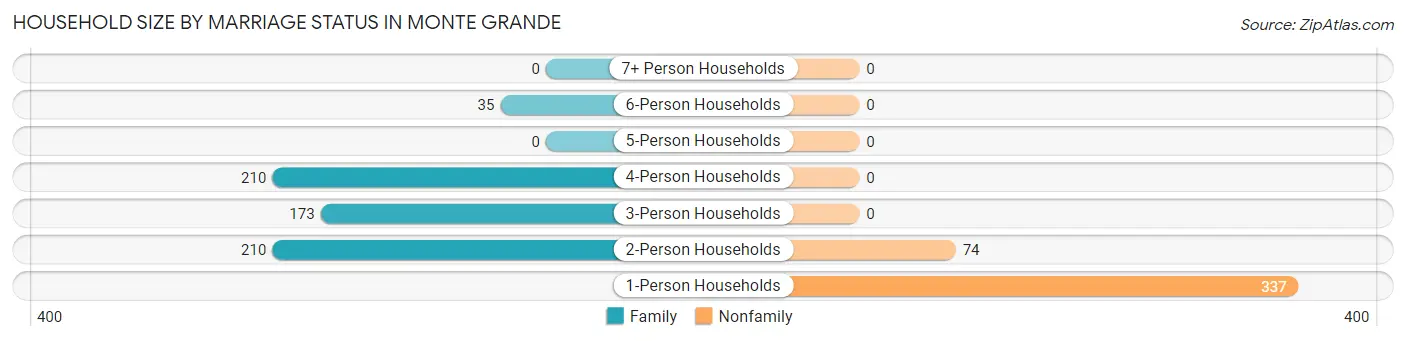
| Household Size | Family Households | Nonfamily Households |
| 1-Person Households | - | 337 (32.4%) |
| 2-Person Households | 210 (20.2%) | 74 (7.1%) |
| 3-Person Households | 173 (16.7%) | 0 (0.0%) |
| 4-Person Households | 210 (20.2%) | 0 (0.0%) |
| 5-Person Households | 0 (0.0%) | 0 (0.0%) |
| 6-Person Households | 35 (3.4%) | 0 (0.0%) |
| 7+ Person Households | 0 (0.0%) | 0 (0.0%) |
| Total | 628 (60.4%) | 411 (39.6%) |
Female Fertility in Monte Grande
Fertility by Age in Monte Grande
| Age Bracket | Women with Births | Births / 1,000 Women |
| 15 to 19 years | 0 (0.0%) | 0.0 |
| 20 to 34 years | 0 (0.0%) | 0.0 |
| 35 to 50 years | 0 (0.0%) | 0.0 |
| Total | 0 (0.0%) | 0.0 |
Fertility by Age by Marriage Status in Monte Grande
| Age Bracket | Married | Unmarried |
| 15 to 19 years | 0 (0.0%) | 0 (0.0%) |
| 20 to 34 years | 0 (0.0%) | 0 (0.0%) |
| 35 to 50 years | 0 (0.0%) | 0 (0.0%) |
| Total | 0 (0.0%) | 0 (0.0%) |
Fertility by Education in Monte Grande
| Educational Attainment | Women with Births | Births / 1,000 Women |
| Less than High School | 0 (0.0%) | 0.0 |
| High School Diploma | 0 (0.0%) | 0.0 |
| College or Associate's Degree | 0 (0.0%) | 0.0 |
| Bachelor's Degree | 0 (0.0%) | 0.0 |
| Graduate Degree | 0 (0.0%) | 0.0 |
| Total | 0 (0.0%) | 0.0 |
Fertility by Education by Marriage Status in Monte Grande
| Educational Attainment | Married | Unmarried |
| Less than High School | 0 (0.0%) | 0 (0.0%) |
| High School Diploma | 0 (0.0%) | 0 (0.0%) |
| College or Associate's Degree | 0 (0.0%) | 0 (0.0%) |
| Bachelor's Degree | 0 (0.0%) | 0 (0.0%) |
| Graduate Degree | 0 (0.0%) | 0 (0.0%) |
| Total | 0 (0.0%) | 0 (0.0%) |
Employment Characteristics in Monte Grande
Employment by Class of Employer in Monte Grande
Among the 1,153 employed individuals in Monte Grande, private company employees (909 | 78.8%), local government employees (55 | 4.8%), and not-for-profit organizations (52 | 4.5%) make up the most common classes of employment.
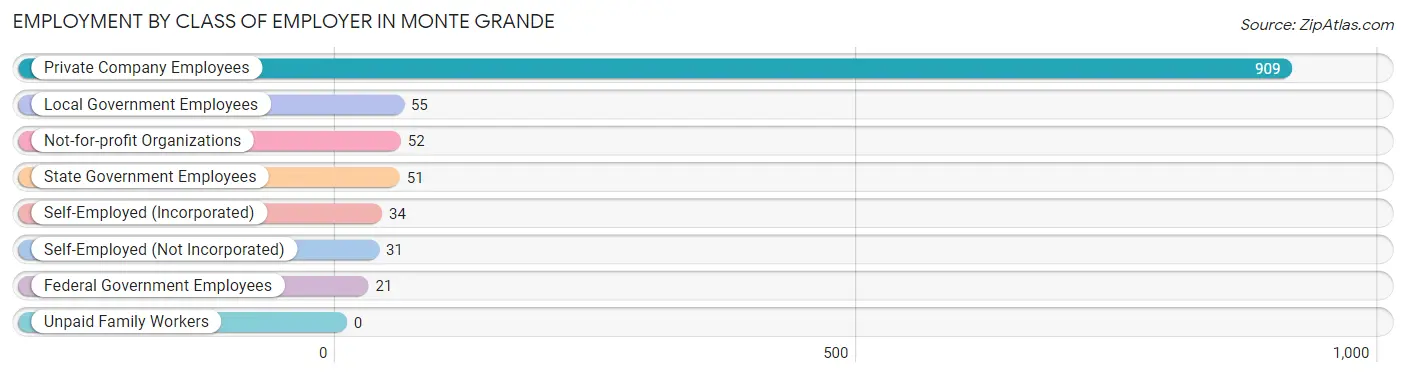
| Employer Class | # Employees | % Employees |
| Private Company Employees | 909 | 78.8% |
| Self-Employed (Incorporated) | 34 | 2.9% |
| Self-Employed (Not Incorporated) | 31 | 2.7% |
| Not-for-profit Organizations | 52 | 4.5% |
| Local Government Employees | 55 | 4.8% |
| State Government Employees | 51 | 4.4% |
| Federal Government Employees | 21 | 1.8% |
| Unpaid Family Workers | 0 | 0.0% |
| Total | 1,153 | 100.0% |
Employment Status by Age in Monte Grande
According to the labor force statistics for Monte Grande, out of the total population over 16 years of age (2,410), 56.2% or 1,354 individuals are in the labor force, with 10.3% or 139 of them unemployed. The age group with the highest labor force participation rate is 25 to 29 years, with 100.0% or 235 individuals in the labor force. Within the labor force, the 16 to 19 years age range has the highest percentage of unemployed individuals, with 100.0% or 86 of them being unemployed.
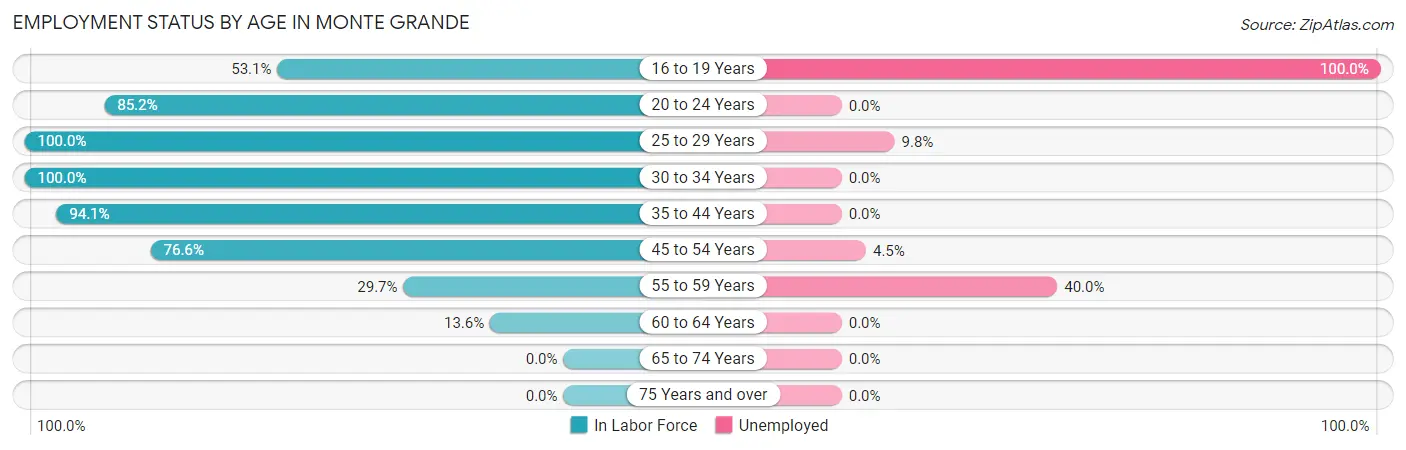
| Age Bracket | In Labor Force | Unemployed |
| 16 to 19 Years | 86 (53.1%) | 86 (100.0%) |
| 20 to 24 Years | 144 (85.2%) | 0 (0.0%) |
| 25 to 29 Years | 235 (100.0%) | 23 (9.8%) |
| 30 to 34 Years | 130 (100.0%) | 0 (0.0%) |
| 35 to 44 Years | 334 (94.1%) | 0 (0.0%) |
| 45 to 54 Years | 353 (76.6%) | 16 (4.5%) |
| 55 to 59 Years | 35 (29.7%) | 14 (40.0%) |
| 60 to 64 Years | 37 (13.6%) | 0 (0.0%) |
| 65 to 74 Years | 0 (0.0%) | 0 (0.0%) |
| 75 Years and over | 0 (0.0%) | 0 (0.0%) |
| Total | 1,354 (56.2%) | 139 (10.3%) |
Employment Status by Educational Attainment in Monte Grande
According to labor force statistics for Monte Grande, 71.5% of individuals (1,123) out of the total population between 25 and 64 years of age (1,571) are in the labor force, with 4.7% or 53 of them being unemployed. The group with the highest labor force participation rate are those with the educational attainment of bachelor's degree or higher, with 89.5% or 459 individuals in the labor force. Within the labor force, individuals with high school diploma education have the highest percentage of unemployment, with 8.2% or 14 of them being unemployed.
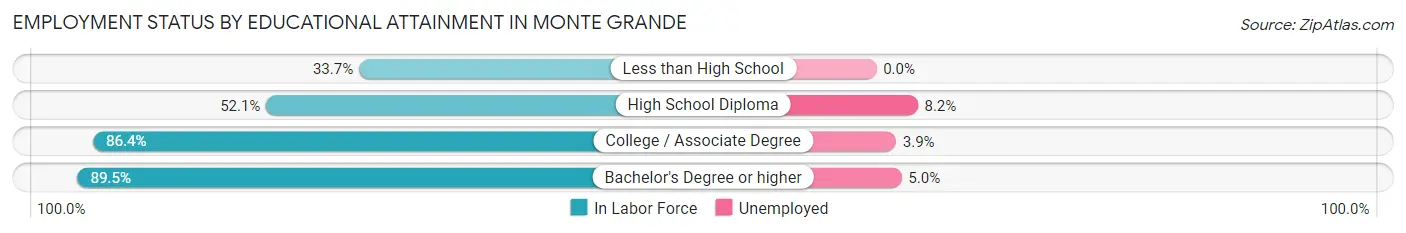
| Educational Attainment | In Labor Force | Unemployed |
| Less than High School | 88 (33.7%) | 0 (0.0%) |
| High School Diploma | 170 (52.1%) | 27 (8.2%) |
| College / Associate Degree | 407 (86.4%) | 18 (3.9%) |
| Bachelor's Degree or higher | 459 (89.5%) | 26 (5.0%) |
| Total | 1,123 (71.5%) | 74 (4.7%) |
Employment Occupations by Sex in Monte Grande
Management, Business, Science and Arts Occupations
The most common Management, Business, Science and Arts occupations in Monte Grande are Community & Social Service (102 | 8.4%), Education Instruction & Library (102 | 8.4%), Health Diagnosing & Treating (102 | 8.4%), Health Technologists (86 | 7.1%), and Business & Financial (63 | 5.2%).
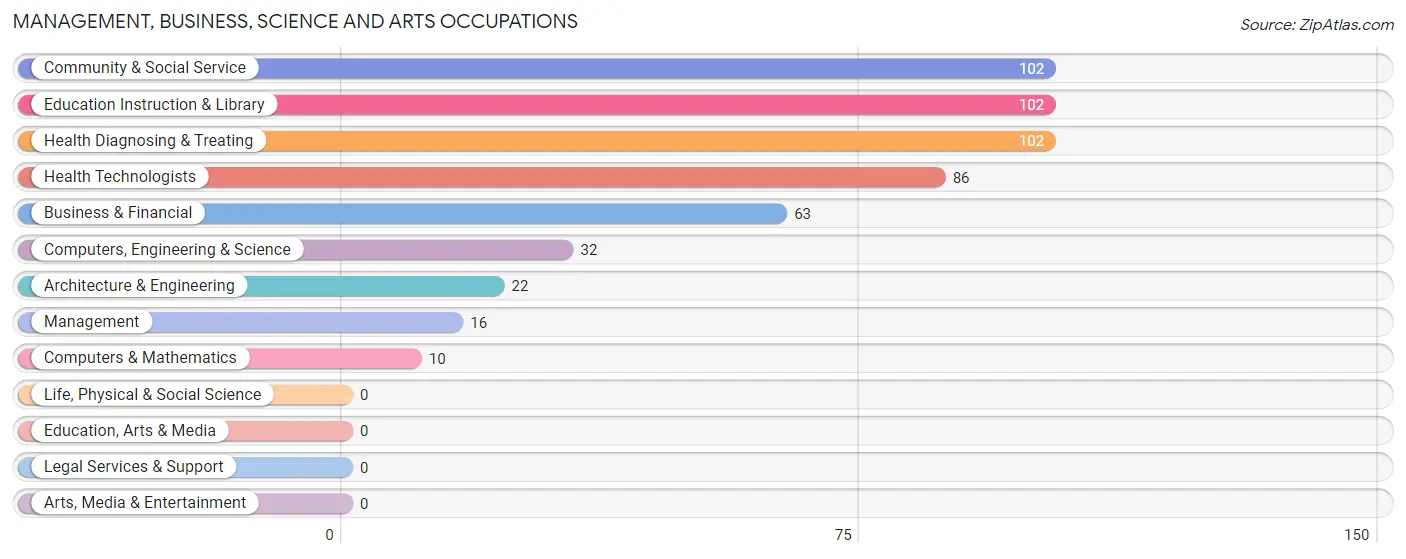
Management, Business, Science and Arts Occupations by Sex
Within the Management, Business, Science and Arts occupations in Monte Grande, the most male-oriented occupations are Management (100.0%), Computers & Mathematics (100.0%), and Business & Financial (33.3%), while the most female-oriented occupations are Architecture & Engineering (100.0%), Community & Social Service (100.0%), and Education Instruction & Library (100.0%).
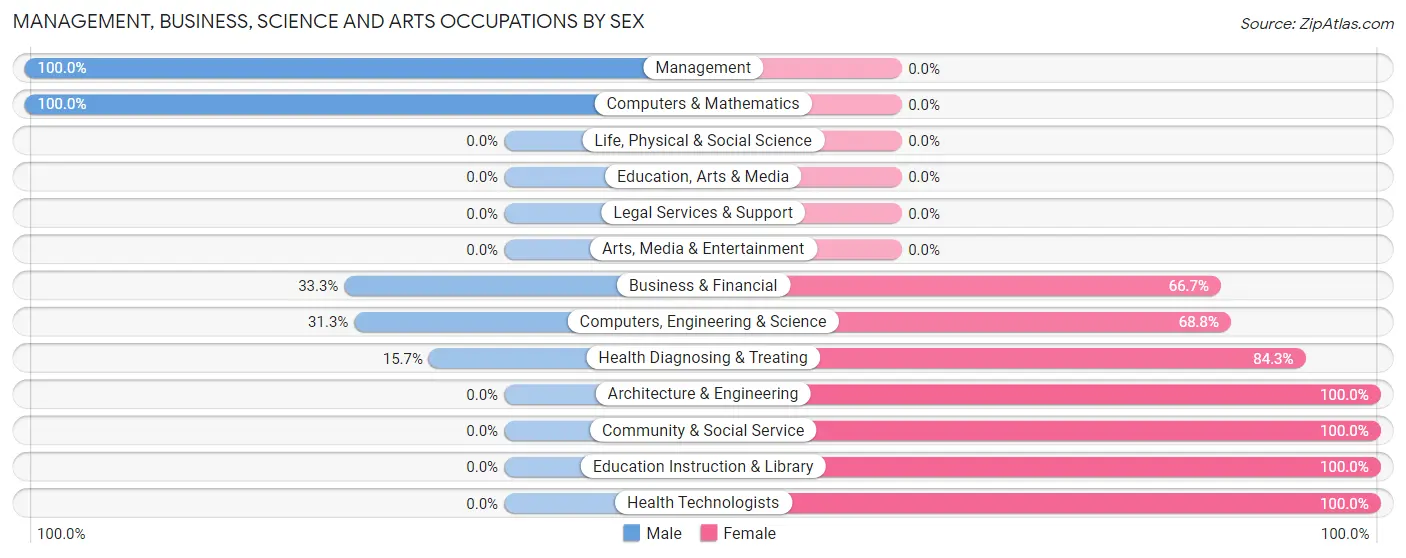
| Occupation | Male | Female |
| Management | 16 (100.0%) | 0 (0.0%) |
| Business & Financial | 21 (33.3%) | 42 (66.7%) |
| Computers, Engineering & Science | 10 (31.2%) | 22 (68.8%) |
| Computers & Mathematics | 10 (100.0%) | 0 (0.0%) |
| Architecture & Engineering | 0 (0.0%) | 22 (100.0%) |
| Life, Physical & Social Science | 0 (0.0%) | 0 (0.0%) |
| Community & Social Service | 0 (0.0%) | 102 (100.0%) |
| Education, Arts & Media | 0 (0.0%) | 0 (0.0%) |
| Legal Services & Support | 0 (0.0%) | 0 (0.0%) |
| Education Instruction & Library | 0 (0.0%) | 102 (100.0%) |
| Arts, Media & Entertainment | 0 (0.0%) | 0 (0.0%) |
| Health Diagnosing & Treating | 16 (15.7%) | 86 (84.3%) |
| Health Technologists | 0 (0.0%) | 86 (100.0%) |
| Total (Category) | 63 (20.0%) | 252 (80.0%) |
| Total (Overall) | 661 (54.4%) | 554 (45.6%) |
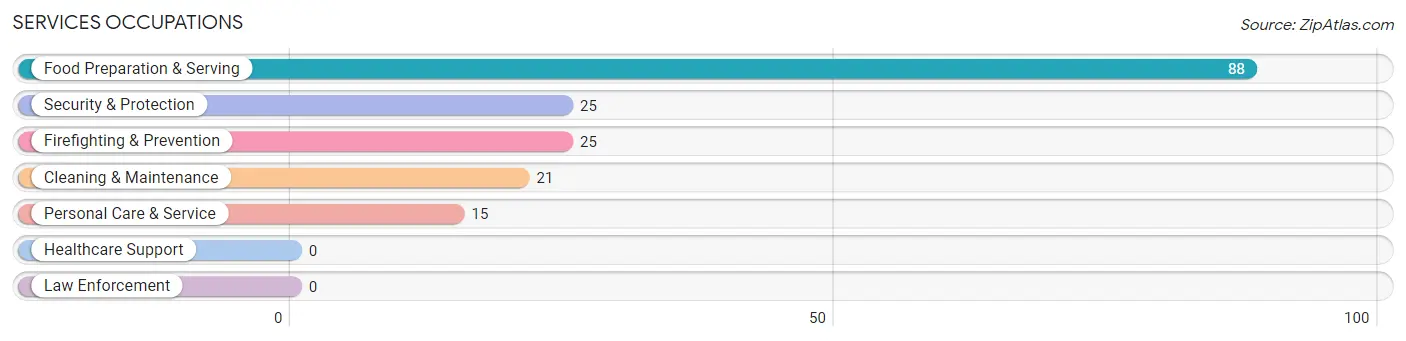
Services Occupations
The most common Services occupations in Monte Grande are Food Preparation & Serving (88 | 7.2%), Security & Protection (25 | 2.1%), Firefighting & Prevention (25 | 2.1%), Cleaning & Maintenance (21 | 1.7%), and Personal Care & Service (15 | 1.2%).
Services Occupations by Sex
Within the Services occupations in Monte Grande, the most male-oriented occupations are Food Preparation & Serving (100.0%), and Cleaning & Maintenance (100.0%), while the most female-oriented occupations are Security & Protection (100.0%), Firefighting & Prevention (100.0%), and Personal Care & Service (100.0%).
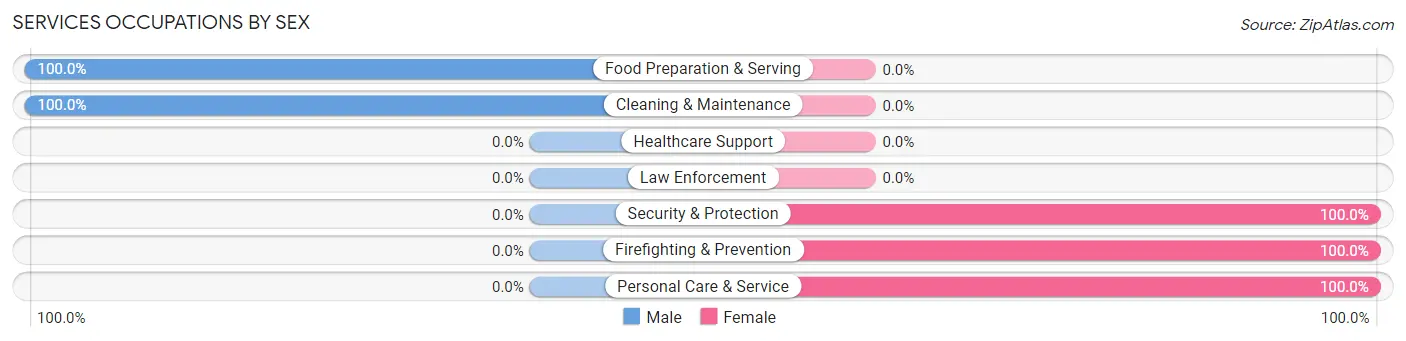
| Occupation | Male | Female |
| Healthcare Support | 0 (0.0%) | 0 (0.0%) |
| Security & Protection | 0 (0.0%) | 25 (100.0%) |
| Firefighting & Prevention | 0 (0.0%) | 25 (100.0%) |
| Law Enforcement | 0 (0.0%) | 0 (0.0%) |
| Food Preparation & Serving | 88 (100.0%) | 0 (0.0%) |
| Cleaning & Maintenance | 21 (100.0%) | 0 (0.0%) |
| Personal Care & Service | 0 (0.0%) | 15 (100.0%) |
| Total (Category) | 109 (73.2%) | 40 (26.9%) |
| Total (Overall) | 661 (54.4%) | 554 (45.6%) |
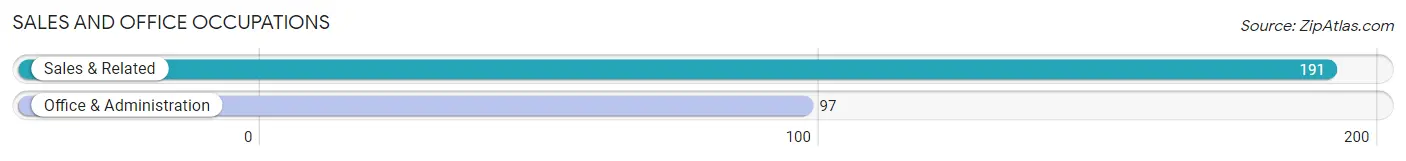
Sales and Office Occupations
The most common Sales and Office occupations in Monte Grande are Sales & Related (191 | 15.7%), and Office & Administration (97 | 8.0%).
Sales and Office Occupations by Sex
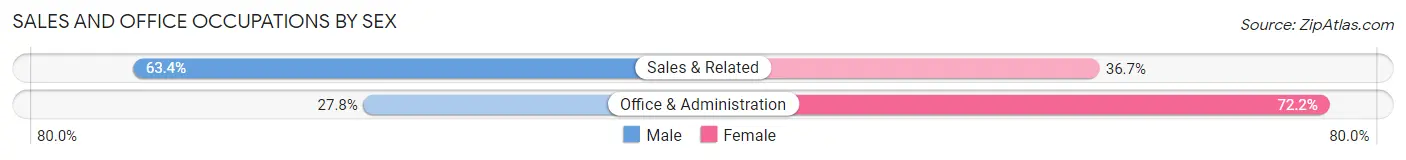
| Occupation | Male | Female |
| Sales & Related | 121 (63.3%) | 70 (36.6%) |
| Office & Administration | 27 (27.8%) | 70 (72.2%) |
| Total (Category) | 148 (51.4%) | 140 (48.6%) |
| Total (Overall) | 661 (54.4%) | 554 (45.6%) |
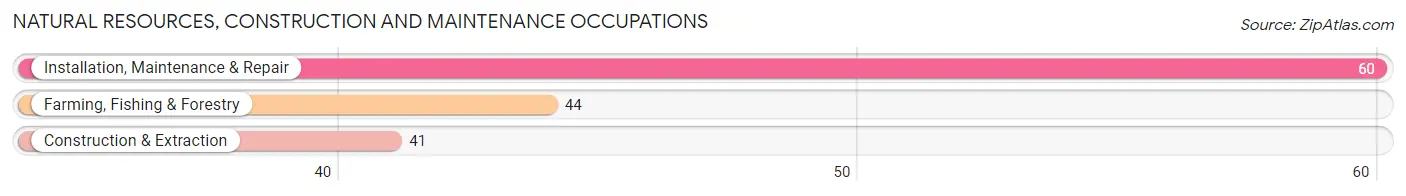
Natural Resources, Construction and Maintenance Occupations
The most common Natural Resources, Construction and Maintenance occupations in Monte Grande are Installation, Maintenance & Repair (60 | 4.9%), Farming, Fishing & Forestry (44 | 3.6%), and Construction & Extraction (41 | 3.4%).
Natural Resources, Construction and Maintenance Occupations by Sex
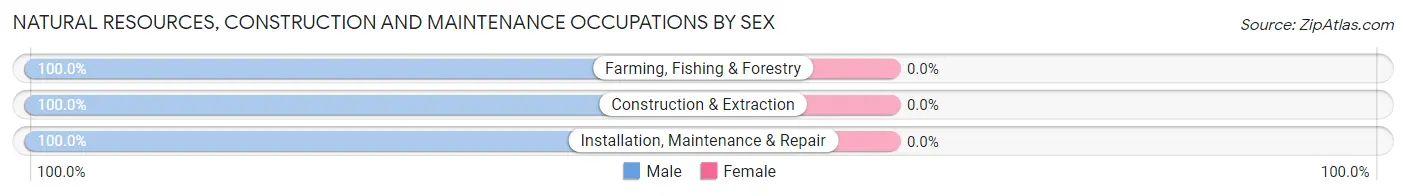
| Occupation | Male | Female |
| Farming, Fishing & Forestry | 44 (100.0%) | 0 (0.0%) |
| Construction & Extraction | 41 (100.0%) | 0 (0.0%) |
| Installation, Maintenance & Repair | 60 (100.0%) | 0 (0.0%) |
| Total (Category) | 145 (100.0%) | 0 (0.0%) |
| Total (Overall) | 661 (54.4%) | 554 (45.6%) |
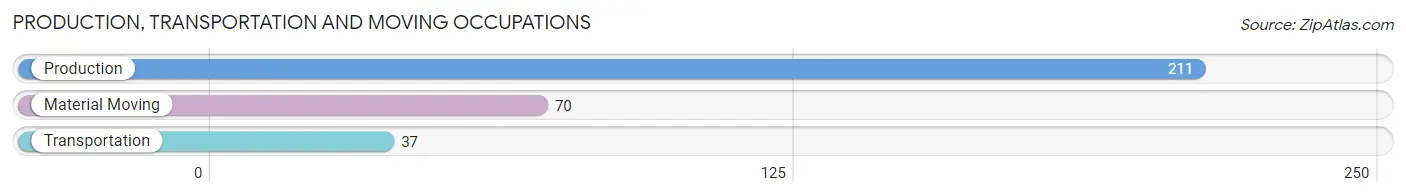
Production, Transportation and Moving Occupations
The most common Production, Transportation and Moving occupations in Monte Grande are Production (211 | 17.4%), Material Moving (70 | 5.8%), and Transportation (37 | 3.0%).
Production, Transportation and Moving Occupations by Sex
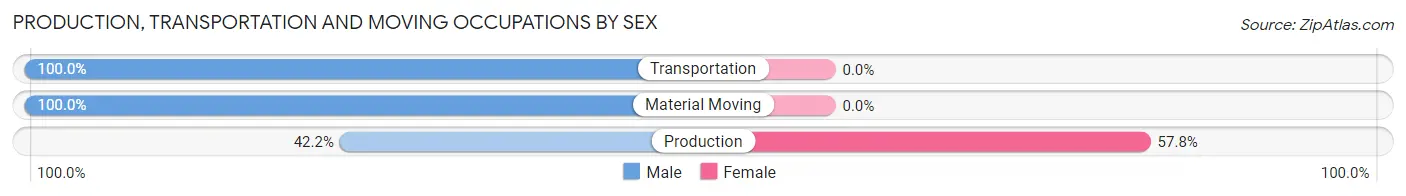
| Occupation | Male | Female |
| Production | 89 (42.2%) | 122 (57.8%) |
| Transportation | 37 (100.0%) | 0 (0.0%) |
| Material Moving | 70 (100.0%) | 0 (0.0%) |
| Total (Category) | 196 (61.6%) | 122 (38.4%) |
| Total (Overall) | 661 (54.4%) | 554 (45.6%) |
Employment Industries by Sex in Monte Grande
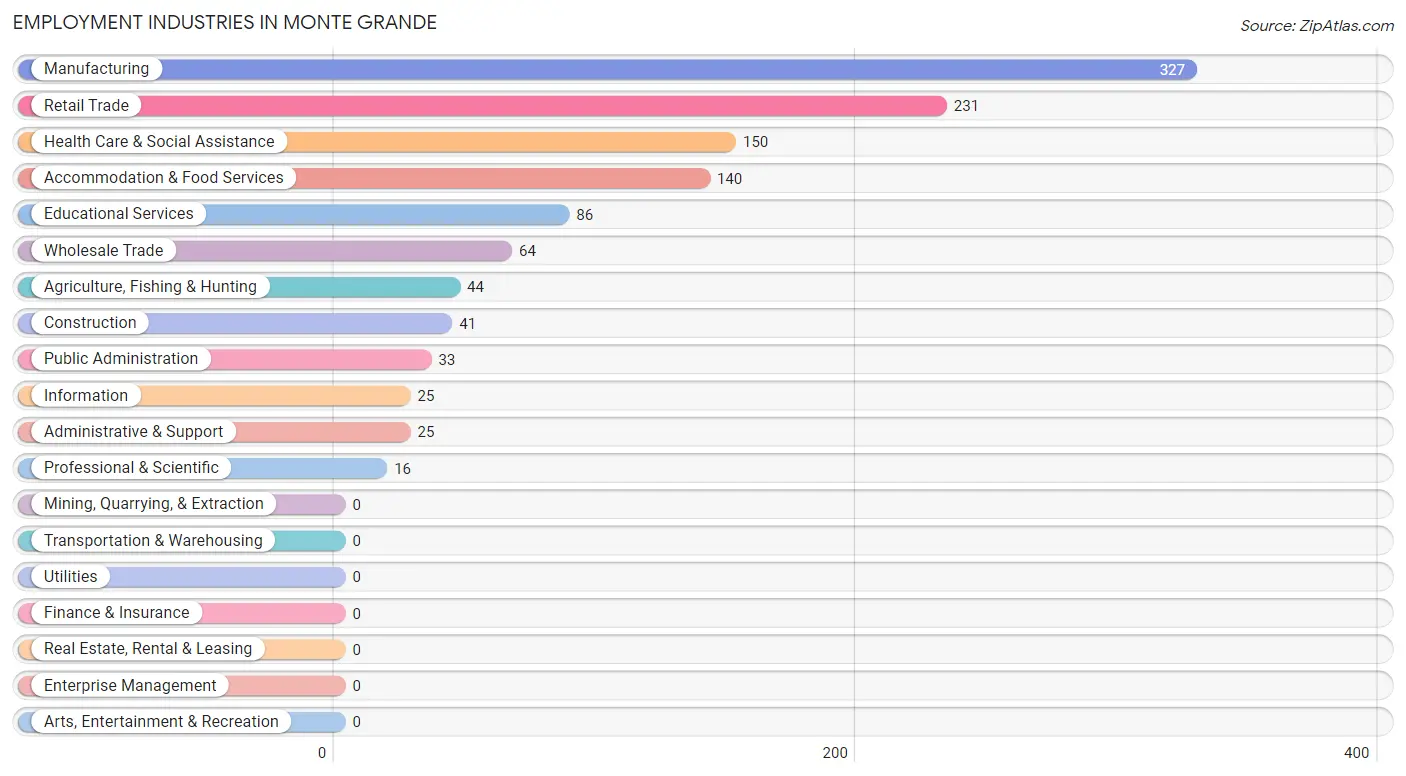
Employment Industries in Monte Grande
The major employment industries in Monte Grande include Manufacturing (327 | 26.9%), Retail Trade (231 | 19.0%), Health Care & Social Assistance (150 | 12.3%), Accommodation & Food Services (140 | 11.5%), and Educational Services (86 | 7.1%).
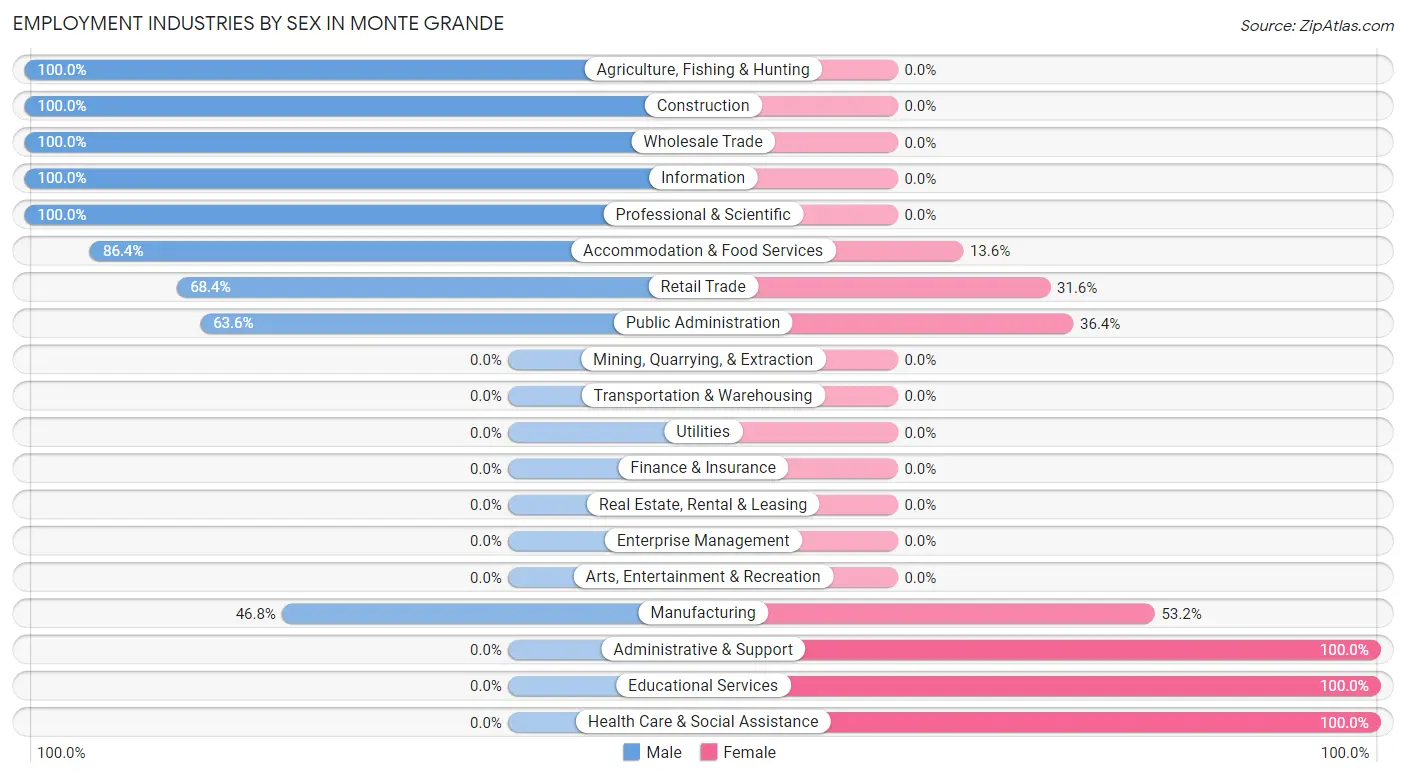
Employment Industries by Sex in Monte Grande
The Monte Grande industries that see more men than women are Agriculture, Fishing & Hunting (100.0%), Construction (100.0%), and Wholesale Trade (100.0%), whereas the industries that tend to have a higher number of women are Administrative & Support (100.0%), Educational Services (100.0%), and Health Care & Social Assistance (100.0%).
| Industry | Male | Female |
| Agriculture, Fishing & Hunting | 44 (100.0%) | 0 (0.0%) |
| Mining, Quarrying, & Extraction | 0 (0.0%) | 0 (0.0%) |
| Construction | 41 (100.0%) | 0 (0.0%) |
| Manufacturing | 153 (46.8%) | 174 (53.2%) |
| Wholesale Trade | 64 (100.0%) | 0 (0.0%) |
| Retail Trade | 158 (68.4%) | 73 (31.6%) |
| Transportation & Warehousing | 0 (0.0%) | 0 (0.0%) |
| Utilities | 0 (0.0%) | 0 (0.0%) |
| Information | 25 (100.0%) | 0 (0.0%) |
| Finance & Insurance | 0 (0.0%) | 0 (0.0%) |
| Real Estate, Rental & Leasing | 0 (0.0%) | 0 (0.0%) |
| Professional & Scientific | 16 (100.0%) | 0 (0.0%) |
| Enterprise Management | 0 (0.0%) | 0 (0.0%) |
| Administrative & Support | 0 (0.0%) | 25 (100.0%) |
| Educational Services | 0 (0.0%) | 86 (100.0%) |
| Health Care & Social Assistance | 0 (0.0%) | 150 (100.0%) |
| Arts, Entertainment & Recreation | 0 (0.0%) | 0 (0.0%) |
| Accommodation & Food Services | 121 (86.4%) | 19 (13.6%) |
| Public Administration | 21 (63.6%) | 12 (36.4%) |
| Total | 661 (54.4%) | 554 (45.6%) |
Education in Monte Grande
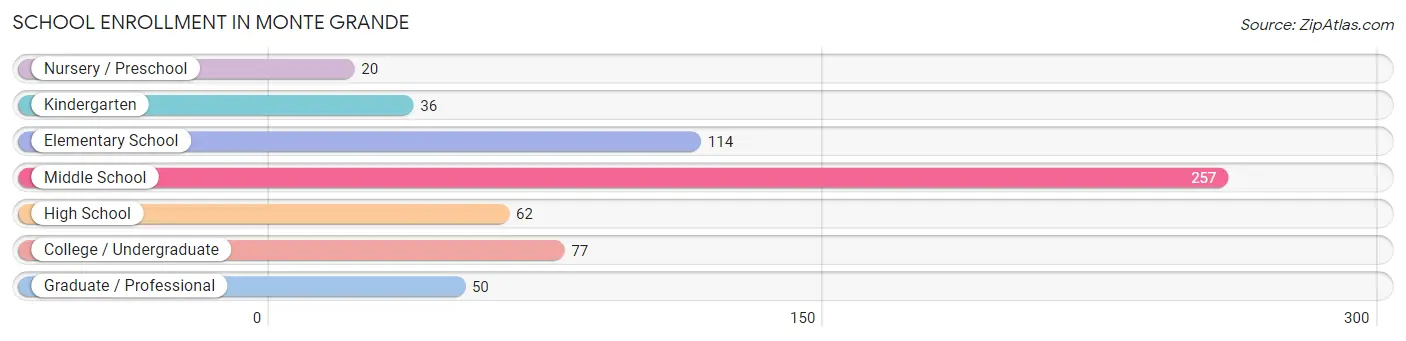
School Enrollment in Monte Grande
The most common levels of schooling among the 616 students in Monte Grande are middle school (257 | 41.7%), elementary school (114 | 18.5%), and college / undergraduate (77 | 12.5%).
| School Level | # Students | % Students |
| Nursery / Preschool | 20 | 3.3% |
| Kindergarten | 36 | 5.8% |
| Elementary School | 114 | 18.5% |
| Middle School | 257 | 41.7% |
| High School | 62 | 10.1% |
| College / Undergraduate | 77 | 12.5% |
| Graduate / Professional | 50 | 8.1% |
| Total | 616 | 100.0% |
School Enrollment by Age by Funding Source in Monte Grande
Out of a total of 616 students who are enrolled in schools in Monte Grande, 280 (45.5%) attend a private institution, while the remaining 336 (54.5%) are enrolled in public schools. The age group of 3 to 4 year olds has the highest likelihood of being enrolled in private schools, with 20 (100.0% in the age bracket) enrolled. Conversely, the age group of 15 to 17 year olds has the lowest likelihood of being enrolled in a private school, with 62 (100.0% in the age bracket) attending a public institution.
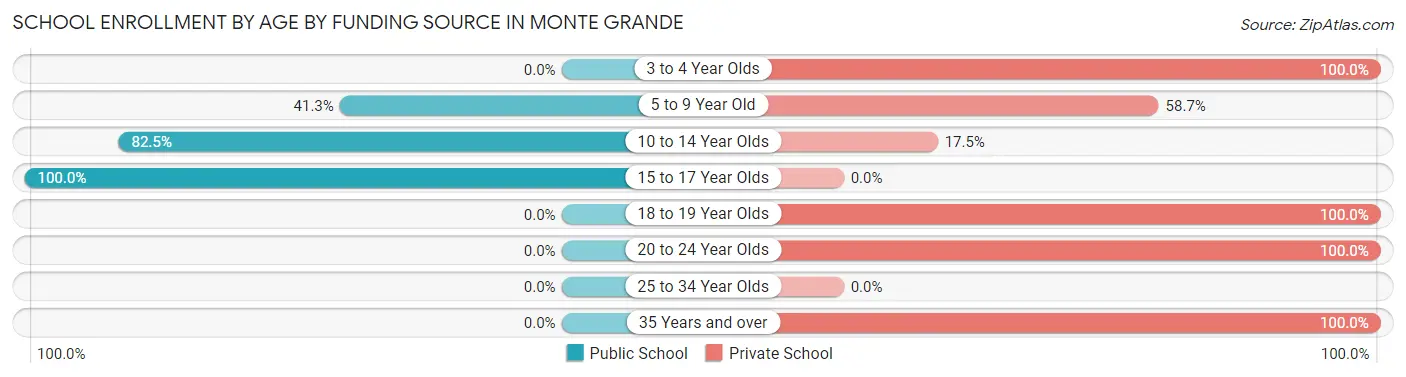
| Age Bracket | Public School | Private School |
| 3 to 4 Year Olds | 0 (0.0%) | 20 (100.0%) |
| 5 to 9 Year Old | 62 (41.3%) | 88 (58.7%) |
| 10 to 14 Year Olds | 212 (82.5%) | 45 (17.5%) |
| 15 to 17 Year Olds | 62 (100.0%) | 0 (0.0%) |
| 18 to 19 Year Olds | 0 (0.0%) | 52 (100.0%) |
| 20 to 24 Year Olds | 0 (0.0%) | 25 (100.0%) |
| 25 to 34 Year Olds | 0 (0.0%) | 0 (0.0%) |
| 35 Years and over | 0 (0.0%) | 50 (100.0%) |
| Total | 336 (54.5%) | 280 (45.5%) |
Educational Attainment by Field of Study in Monte Grande
Education (156 | 30.4%), bio, nature & agricultural (97 | 18.9%), business (96 | 18.7%), science & technology (70 | 13.7%), and communications (41 | 8.0%) are the most common fields of study among 513 individuals in Monte Grande who have obtained a bachelor's degree or higher.
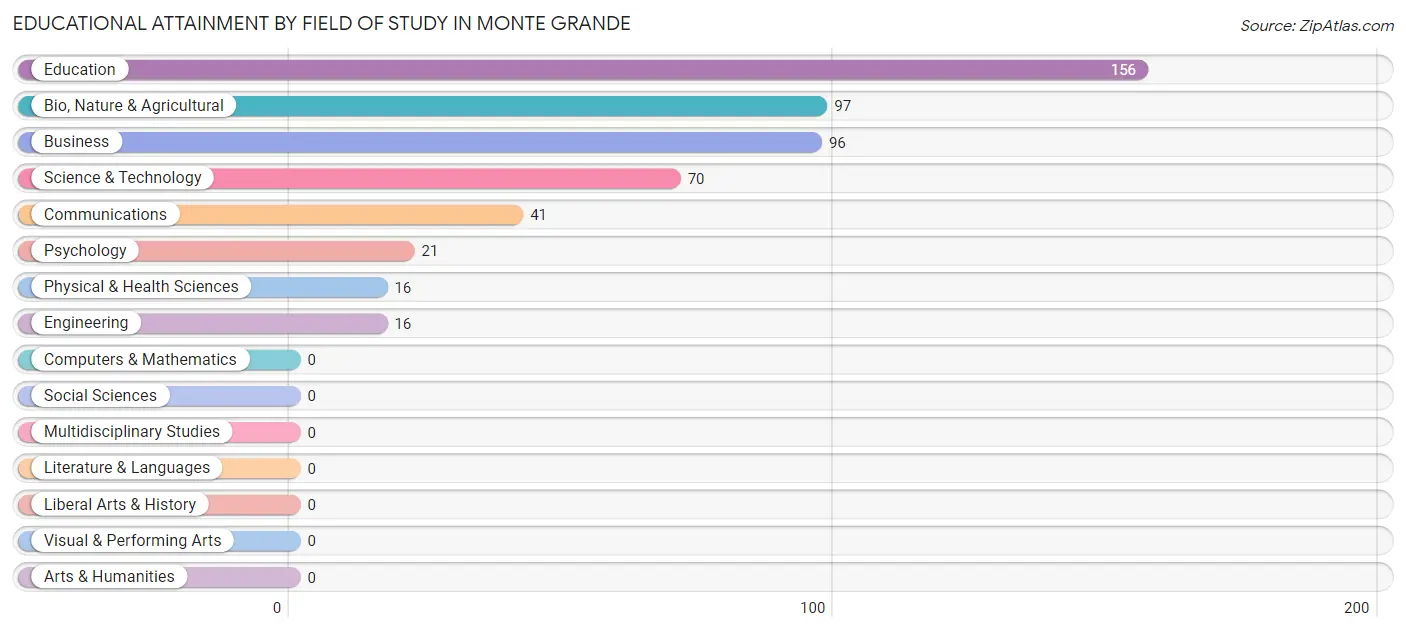
| Field of Study | # Graduates | % Graduates |
| Computers & Mathematics | 0 | 0.0% |
| Bio, Nature & Agricultural | 97 | 18.9% |
| Physical & Health Sciences | 16 | 3.1% |
| Psychology | 21 | 4.1% |
| Social Sciences | 0 | 0.0% |
| Engineering | 16 | 3.1% |
| Multidisciplinary Studies | 0 | 0.0% |
| Science & Technology | 70 | 13.7% |
| Business | 96 | 18.7% |
| Education | 156 | 30.4% |
| Literature & Languages | 0 | 0.0% |
| Liberal Arts & History | 0 | 0.0% |
| Visual & Performing Arts | 0 | 0.0% |
| Communications | 41 | 8.0% |
| Arts & Humanities | 0 | 0.0% |
| Total | 513 | 100.0% |
Transportation & Commute in Monte Grande
Vehicle Availability by Sex in Monte Grande
The most prevalent vehicle ownership categories in Monte Grande are males with 2 vehicles (299, accounting for 47.2%) and females with 2 vehicles (260, making up 57.6%).
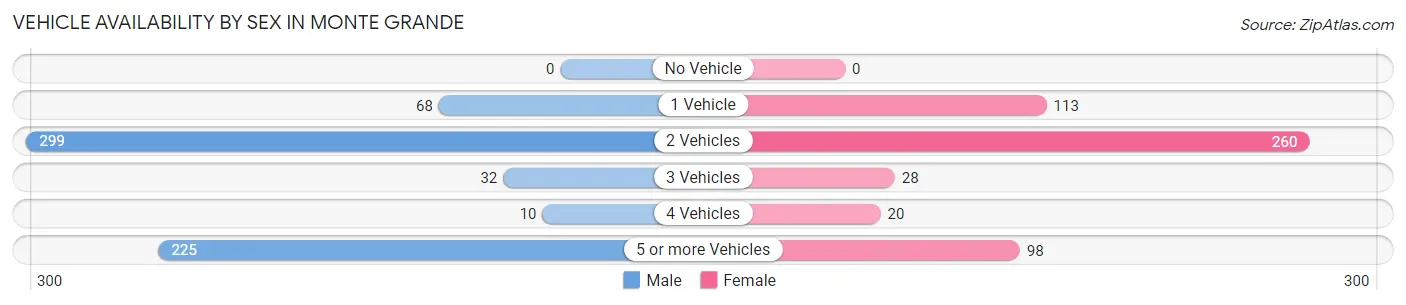
| Vehicles Available | Male | Female |
| No Vehicle | 0 (0.0%) | 0 (0.0%) |
| 1 Vehicle | 68 (10.7%) | 113 (21.8%) |
| 2 Vehicles | 299 (47.2%) | 260 (50.1%) |
| 3 Vehicles | 32 (5.1%) | 28 (5.4%) |
| 4 Vehicles | 10 (1.6%) | 20 (3.8%) |
| 5 or more Vehicles | 225 (35.5%) | 98 (18.9%) |
| Total | 634 (100.0%) | 519 (100.0%) |
Commute Time in Monte Grande
The most frequently occuring commute durations in Monte Grande are 20 to 24 minutes (226 commuters, 19.6%), 60 to 89 minutes (199 commuters, 17.3%), and 30 to 34 minutes (174 commuters, 15.1%).
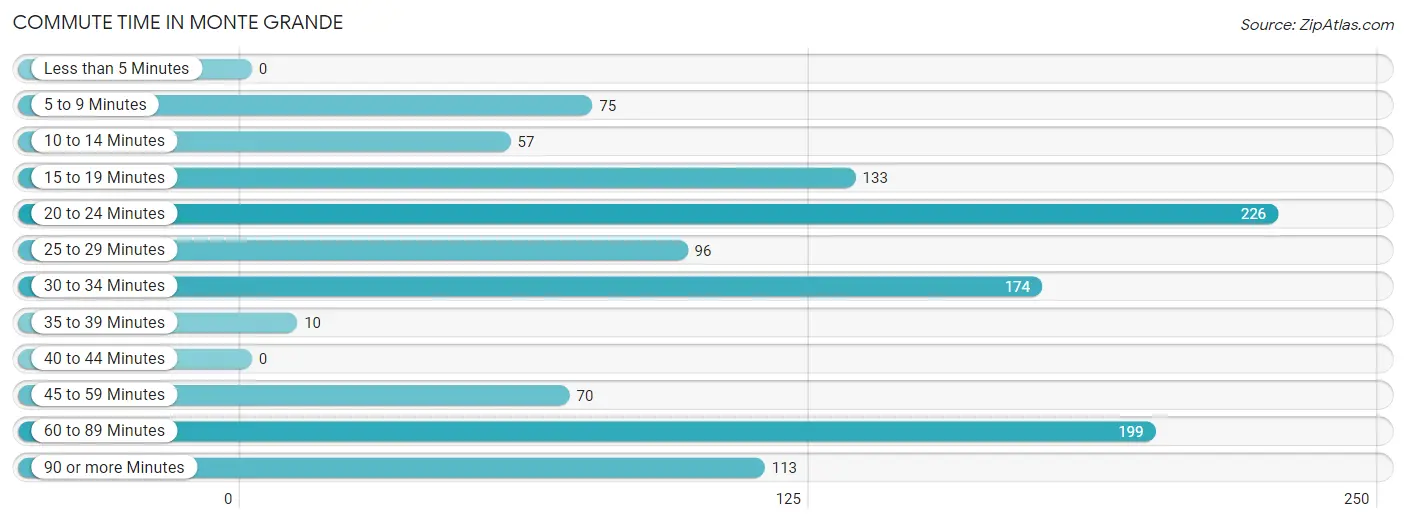
| Commute Time | # Commuters | % Commuters |
| Less than 5 Minutes | 0 | 0.0% |
| 5 to 9 Minutes | 75 | 6.5% |
| 10 to 14 Minutes | 57 | 4.9% |
| 15 to 19 Minutes | 133 | 11.5% |
| 20 to 24 Minutes | 226 | 19.6% |
| 25 to 29 Minutes | 96 | 8.3% |
| 30 to 34 Minutes | 174 | 15.1% |
| 35 to 39 Minutes | 10 | 0.9% |
| 40 to 44 Minutes | 0 | 0.0% |
| 45 to 59 Minutes | 70 | 6.1% |
| 60 to 89 Minutes | 199 | 17.3% |
| 90 or more Minutes | 113 | 9.8% |
Commute Time by Sex in Monte Grande
The most common commute times in Monte Grande are 20 to 24 minutes (182 commuters, 28.7%) for males and 15 to 19 minutes (116 commuters, 22.4%) for females.
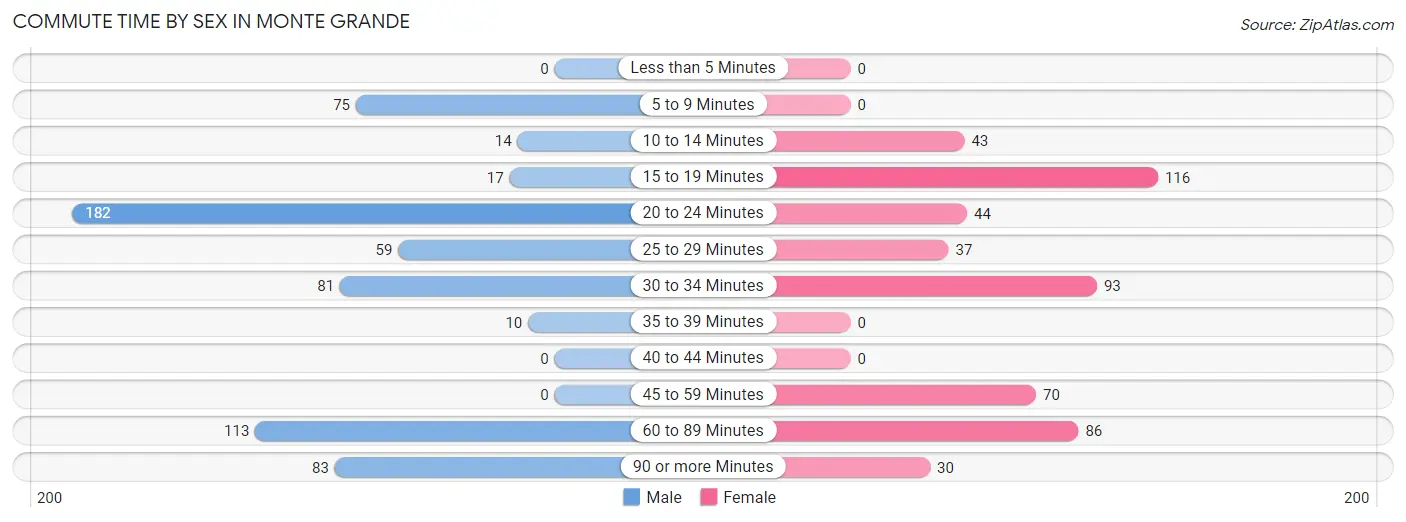
| Commute Time | Male | Female |
| Less than 5 Minutes | 0 (0.0%) | 0 (0.0%) |
| 5 to 9 Minutes | 75 (11.8%) | 0 (0.0%) |
| 10 to 14 Minutes | 14 (2.2%) | 43 (8.3%) |
| 15 to 19 Minutes | 17 (2.7%) | 116 (22.4%) |
| 20 to 24 Minutes | 182 (28.7%) | 44 (8.5%) |
| 25 to 29 Minutes | 59 (9.3%) | 37 (7.1%) |
| 30 to 34 Minutes | 81 (12.8%) | 93 (17.9%) |
| 35 to 39 Minutes | 10 (1.6%) | 0 (0.0%) |
| 40 to 44 Minutes | 0 (0.0%) | 0 (0.0%) |
| 45 to 59 Minutes | 0 (0.0%) | 70 (13.5%) |
| 60 to 89 Minutes | 113 (17.8%) | 86 (16.6%) |
| 90 or more Minutes | 83 (13.1%) | 30 (5.8%) |
Time of Departure to Work by Sex in Monte Grande
The most frequent times of departure to work in Monte Grande are 7:30 AM to 7:59 AM (157, 24.8%) for males and 5:00 AM to 5:29 AM (96, 18.5%) for females.
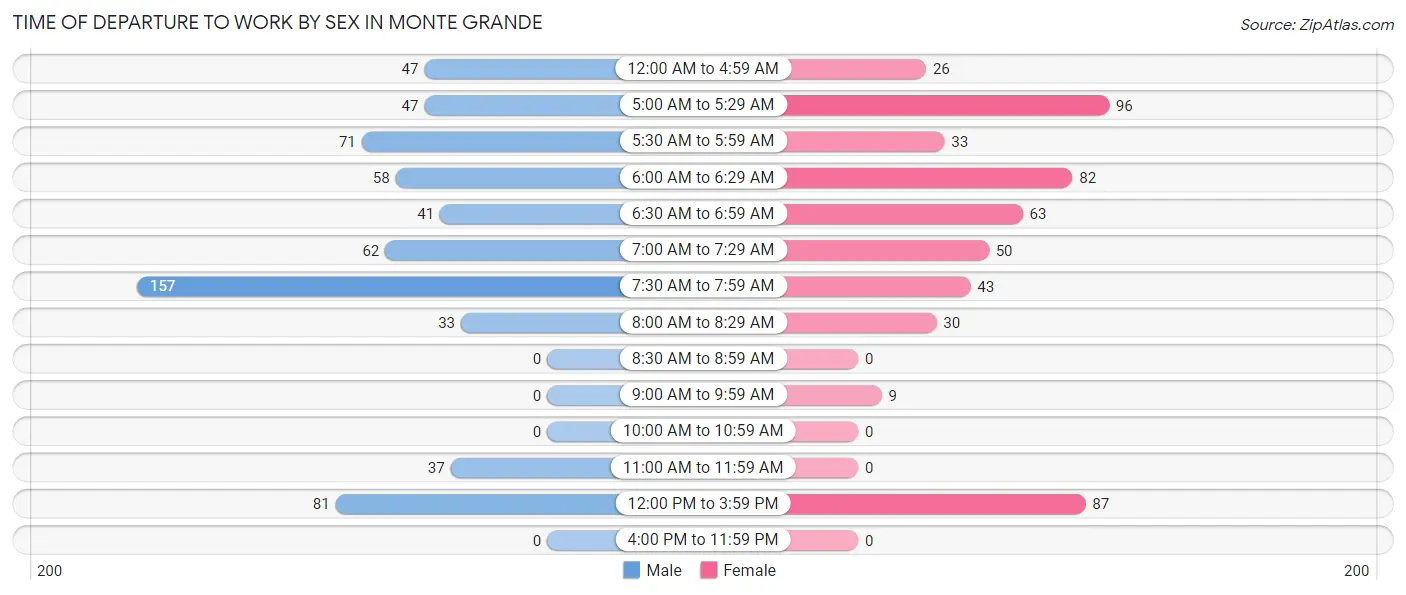
| Time of Departure | Male | Female |
| 12:00 AM to 4:59 AM | 47 (7.4%) | 26 (5.0%) |
| 5:00 AM to 5:29 AM | 47 (7.4%) | 96 (18.5%) |
| 5:30 AM to 5:59 AM | 71 (11.2%) | 33 (6.4%) |
| 6:00 AM to 6:29 AM | 58 (9.1%) | 82 (15.8%) |
| 6:30 AM to 6:59 AM | 41 (6.5%) | 63 (12.1%) |
| 7:00 AM to 7:29 AM | 62 (9.8%) | 50 (9.6%) |
| 7:30 AM to 7:59 AM | 157 (24.8%) | 43 (8.3%) |
| 8:00 AM to 8:29 AM | 33 (5.2%) | 30 (5.8%) |
| 8:30 AM to 8:59 AM | 0 (0.0%) | 0 (0.0%) |
| 9:00 AM to 9:59 AM | 0 (0.0%) | 9 (1.7%) |
| 10:00 AM to 10:59 AM | 0 (0.0%) | 0 (0.0%) |
| 11:00 AM to 11:59 AM | 37 (5.8%) | 0 (0.0%) |
| 12:00 PM to 3:59 PM | 81 (12.8%) | 87 (16.8%) |
| 4:00 PM to 11:59 PM | 0 (0.0%) | 0 (0.0%) |
| Total | 634 (100.0%) | 519 (100.0%) |
Housing Occupancy in Monte Grande
Occupancy by Ownership in Monte Grande
Of the total 1,039 dwellings in Monte Grande, owner-occupied units account for 719 (69.2%), while renter-occupied units make up 320 (30.8%).
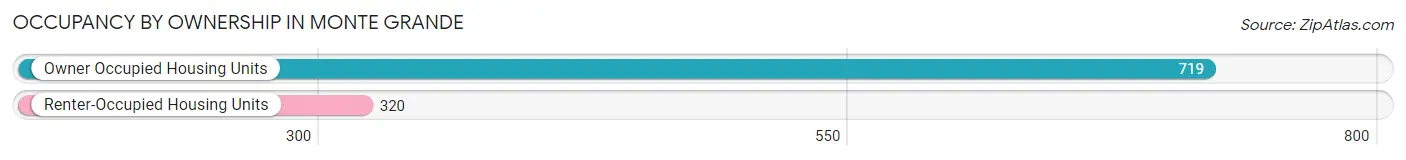
| Occupancy | # Housing Units | % Housing Units |
| Owner Occupied Housing Units | 719 | 69.2% |
| Renter-Occupied Housing Units | 320 | 30.8% |
| Total Occupied Housing Units | 1,039 | 100.0% |
Occupancy by Household Size in Monte Grande
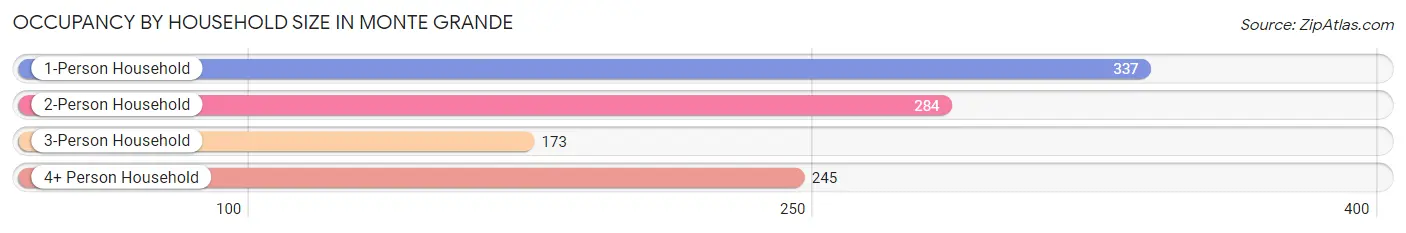
| Household Size | # Housing Units | % Housing Units |
| 1-Person Household | 337 | 32.4% |
| 2-Person Household | 284 | 27.3% |
| 3-Person Household | 173 | 16.7% |
| 4+ Person Household | 245 | 23.6% |
| Total Housing Units | 1,039 | 100.0% |
Occupancy by Ownership by Household Size in Monte Grande
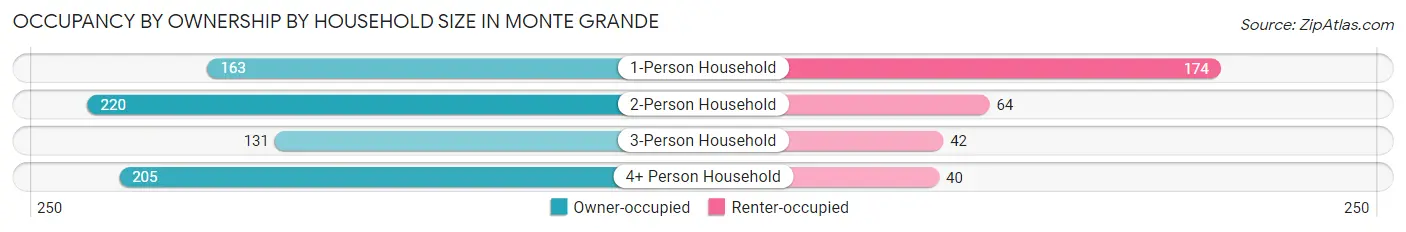
| Household Size | Owner-occupied | Renter-occupied |
| 1-Person Household | 163 (48.4%) | 174 (51.6%) |
| 2-Person Household | 220 (77.5%) | 64 (22.5%) |
| 3-Person Household | 131 (75.7%) | 42 (24.3%) |
| 4+ Person Household | 205 (83.7%) | 40 (16.3%) |
| Total Housing Units | 719 (69.2%) | 320 (30.8%) |
Occupancy by Educational Attainment in Monte Grande
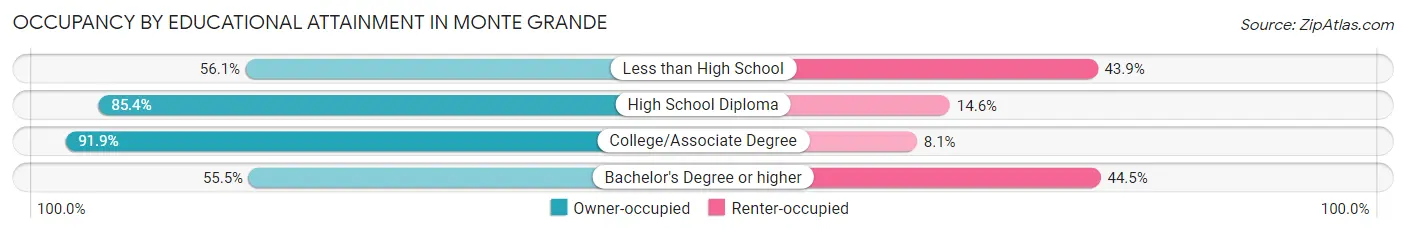
| Household Size | Owner-occupied | Renter-occupied |
| Less than High School | 188 (56.1%) | 147 (43.9%) |
| High School Diploma | 181 (85.4%) | 31 (14.6%) |
| College/Associate Degree | 194 (91.9%) | 17 (8.1%) |
| Bachelor's Degree or higher | 156 (55.5%) | 125 (44.5%) |
Occupancy by Age of Householder in Monte Grande
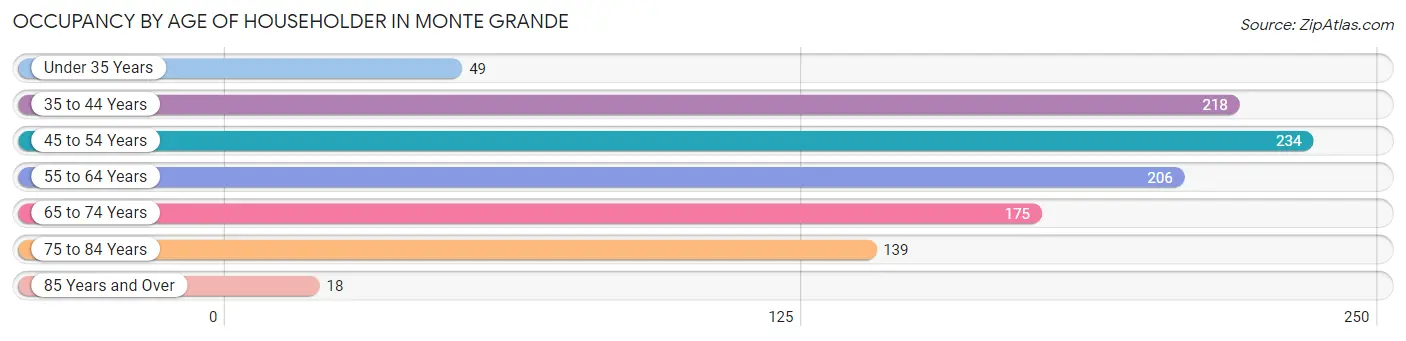
| Age Bracket | # Households | % Households |
| Under 35 Years | 49 | 4.7% |
| 35 to 44 Years | 218 | 21.0% |
| 45 to 54 Years | 234 | 22.5% |
| 55 to 64 Years | 206 | 19.8% |
| 65 to 74 Years | 175 | 16.8% |
| 75 to 84 Years | 139 | 13.4% |
| 85 Years and Over | 18 | 1.7% |
| Total | 1,039 | 100.0% |
Housing Finances in Monte Grande
Median Income by Occupancy in Monte Grande
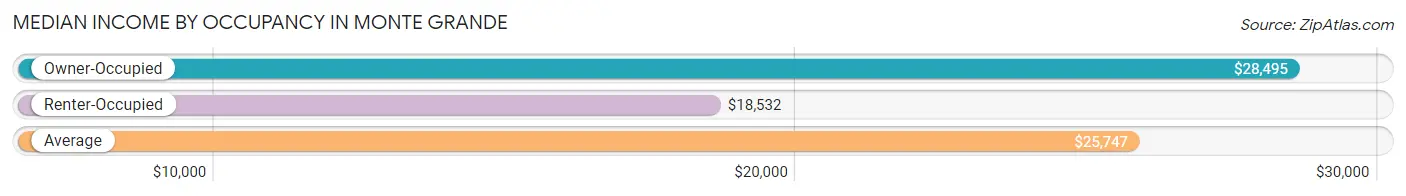
| Occupancy Type | # Households | Median Income |
| Owner-Occupied | 719 (69.2%) | $28,495 |
| Renter-Occupied | 320 (30.8%) | $18,532 |
| Average | 1,039 (100.0%) | $25,747 |
Occupancy by Householder Income Bracket in Monte Grande
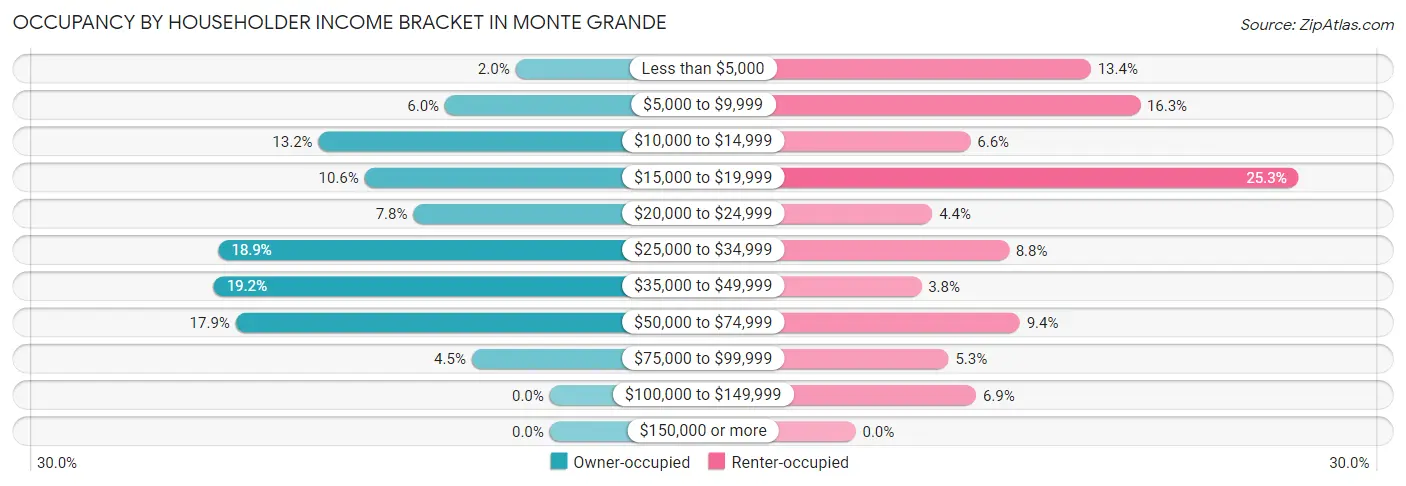
| Income Bracket | Owner-occupied | Renter-occupied |
| Less than $5,000 | 14 (1.9%) | 43 (13.4%) |
| $5,000 to $9,999 | 43 (6.0%) | 52 (16.3%) |
| $10,000 to $14,999 | 95 (13.2%) | 21 (6.6%) |
| $15,000 to $19,999 | 76 (10.6%) | 81 (25.3%) |
| $20,000 to $24,999 | 56 (7.8%) | 14 (4.4%) |
| $25,000 to $34,999 | 136 (18.9%) | 28 (8.7%) |
| $35,000 to $49,999 | 138 (19.2%) | 12 (3.7%) |
| $50,000 to $74,999 | 129 (17.9%) | 30 (9.4%) |
| $75,000 to $99,999 | 32 (4.4%) | 17 (5.3%) |
| $100,000 to $149,999 | 0 (0.0%) | 22 (6.9%) |
| $150,000 or more | 0 (0.0%) | 0 (0.0%) |
| Total | 719 (100.0%) | 320 (100.0%) |
Monthly Housing Cost Tiers in Monte Grande
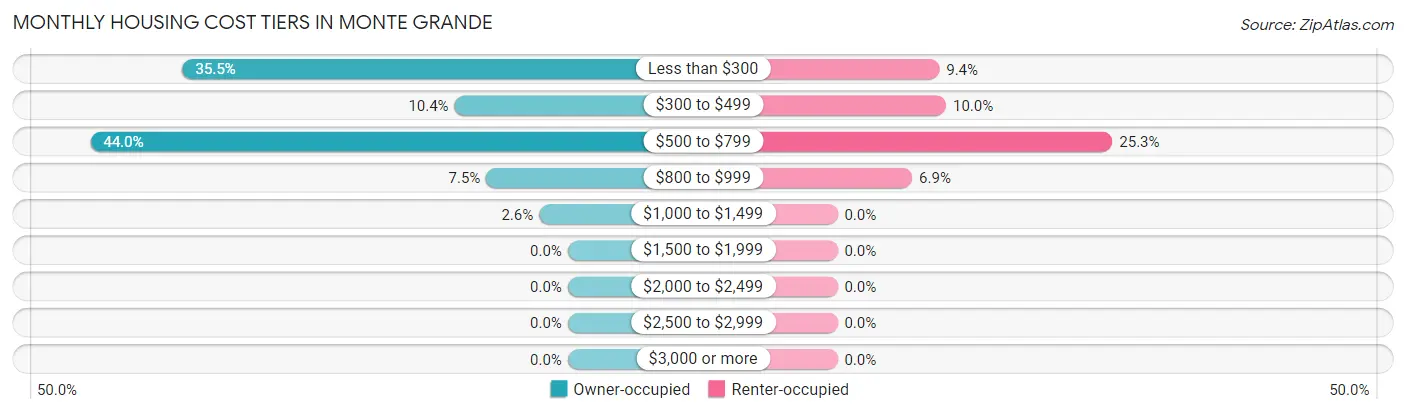
| Monthly Cost | Owner-occupied | Renter-occupied |
| Less than $300 | 255 (35.5%) | 30 (9.4%) |
| $300 to $499 | 75 (10.4%) | 32 (10.0%) |
| $500 to $799 | 316 (44.0%) | 81 (25.3%) |
| $800 to $999 | 54 (7.5%) | 22 (6.9%) |
| $1,000 to $1,499 | 19 (2.6%) | 0 (0.0%) |
| $1,500 to $1,999 | 0 (0.0%) | 0 (0.0%) |
| $2,000 to $2,499 | 0 (0.0%) | 0 (0.0%) |
| $2,500 to $2,999 | 0 (0.0%) | 0 (0.0%) |
| $3,000 or more | 0 (0.0%) | 0 (0.0%) |
| Total | 719 (100.0%) | 320 (100.0%) |
Physical Housing Characteristics in Monte Grande
Housing Structures in Monte Grande
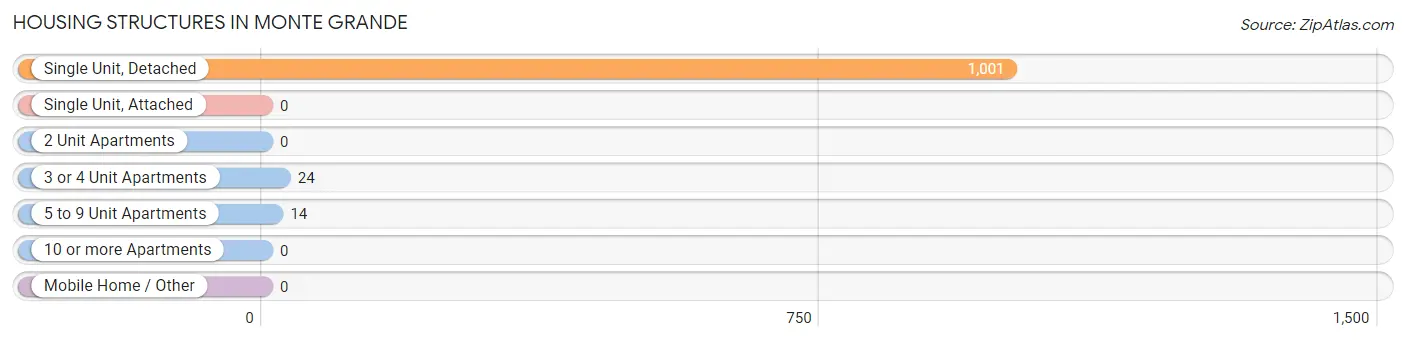
| Structure Type | # Housing Units | % Housing Units |
| Single Unit, Detached | 1,001 | 96.3% |
| Single Unit, Attached | 0 | 0.0% |
| 2 Unit Apartments | 0 | 0.0% |
| 3 or 4 Unit Apartments | 24 | 2.3% |
| 5 to 9 Unit Apartments | 14 | 1.3% |
| 10 or more Apartments | 0 | 0.0% |
| Mobile Home / Other | 0 | 0.0% |
| Total | 1,039 | 100.0% |
Housing Structures by Occupancy in Monte Grande
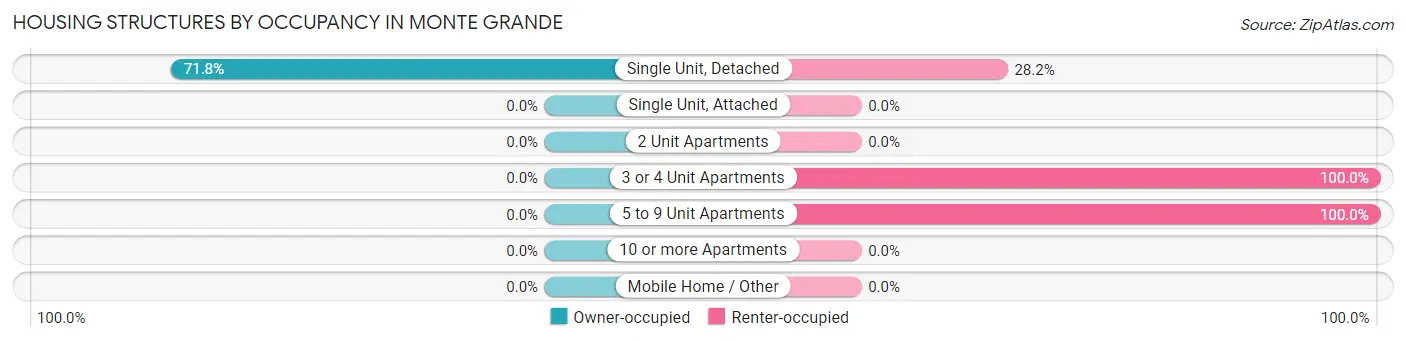
| Structure Type | Owner-occupied | Renter-occupied |
| Single Unit, Detached | 719 (71.8%) | 282 (28.2%) |
| Single Unit, Attached | 0 (0.0%) | 0 (0.0%) |
| 2 Unit Apartments | 0 (0.0%) | 0 (0.0%) |
| 3 or 4 Unit Apartments | 0 (0.0%) | 24 (100.0%) |
| 5 to 9 Unit Apartments | 0 (0.0%) | 14 (100.0%) |
| 10 or more Apartments | 0 (0.0%) | 0 (0.0%) |
| Mobile Home / Other | 0 (0.0%) | 0 (0.0%) |
| Total | 719 (69.2%) | 320 (30.8%) |
Housing Structures by Number of Rooms in Monte Grande
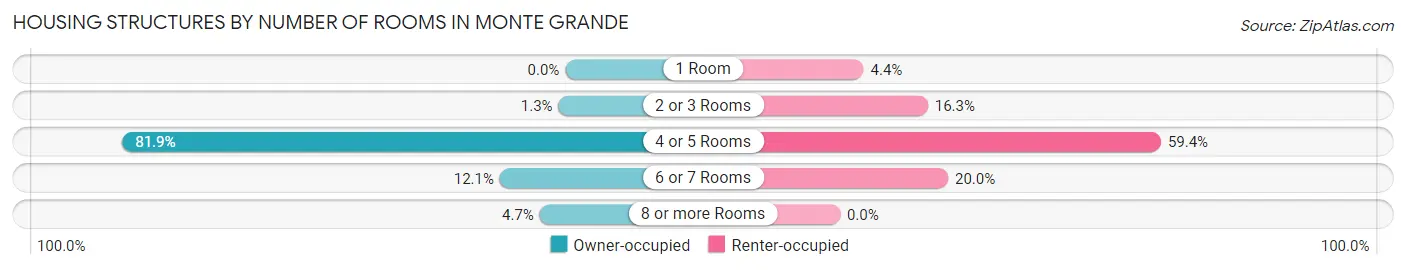
| Number of Rooms | Owner-occupied | Renter-occupied |
| 1 Room | 0 (0.0%) | 14 (4.4%) |
| 2 or 3 Rooms | 9 (1.3%) | 52 (16.3%) |
| 4 or 5 Rooms | 589 (81.9%) | 190 (59.4%) |
| 6 or 7 Rooms | 87 (12.1%) | 64 (20.0%) |
| 8 or more Rooms | 34 (4.7%) | 0 (0.0%) |
| Total | 719 (100.0%) | 320 (100.0%) |
Housing Structure by Heating Type in Monte Grande
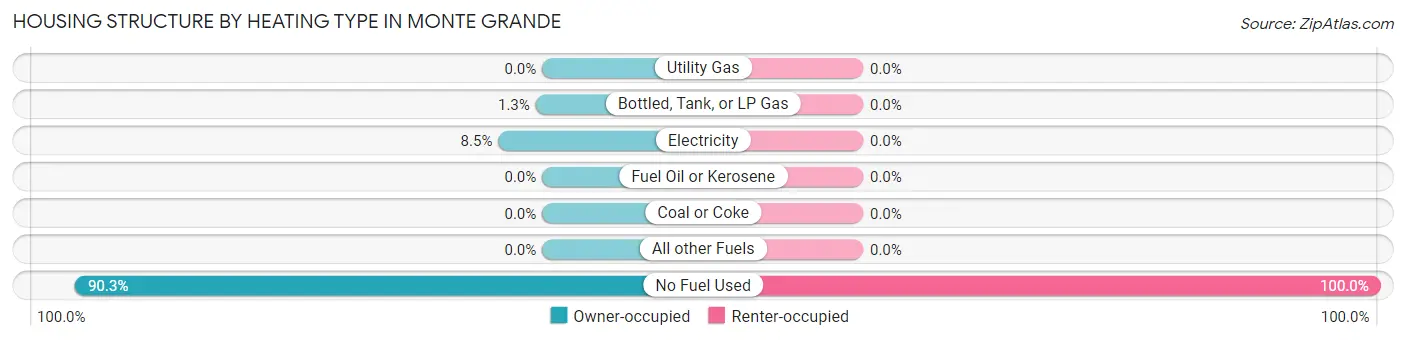
| Heating Type | Owner-occupied | Renter-occupied |
| Utility Gas | 0 (0.0%) | 0 (0.0%) |
| Bottled, Tank, or LP Gas | 9 (1.3%) | 0 (0.0%) |
| Electricity | 61 (8.5%) | 0 (0.0%) |
| Fuel Oil or Kerosene | 0 (0.0%) | 0 (0.0%) |
| Coal or Coke | 0 (0.0%) | 0 (0.0%) |
| All other Fuels | 0 (0.0%) | 0 (0.0%) |
| No Fuel Used | 649 (90.3%) | 320 (100.0%) |
| Total | 719 (100.0%) | 320 (100.0%) |
Household Vehicle Usage in Monte Grande
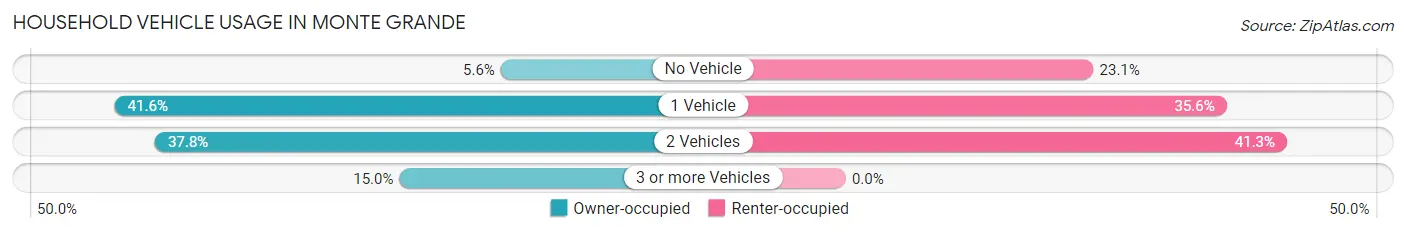
| Vehicles per Household | Owner-occupied | Renter-occupied |
| No Vehicle | 40 (5.6%) | 74 (23.1%) |
| 1 Vehicle | 299 (41.6%) | 114 (35.6%) |
| 2 Vehicles | 272 (37.8%) | 132 (41.2%) |
| 3 or more Vehicles | 108 (15.0%) | 0 (0.0%) |
| Total | 719 (100.0%) | 320 (100.0%) |
Real Estate & Mortgages in Monte Grande
Real Estate and Mortgage Overview in Monte Grande
| Characteristic | Without Mortgage | With Mortgage |
| Housing Units | 307 | 412 |
| Median Property Value | $81,200 | $117,900 |
| Median Household Income | $17,824 | $0 |
| Monthly Housing Costs | $177 | $0 |
| Real Estate Taxes | - | - |
Property Value by Mortgage Status in Monte Grande
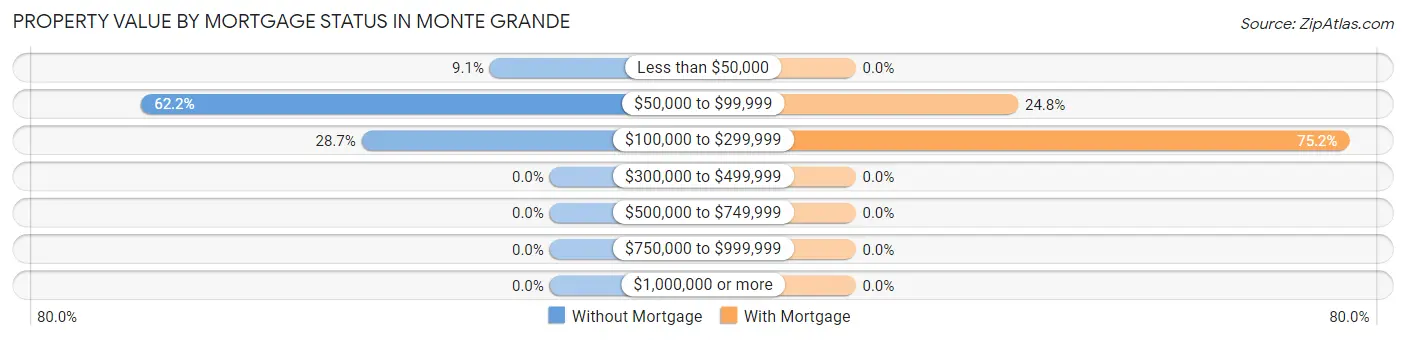
| Property Value | Without Mortgage | With Mortgage |
| Less than $50,000 | 28 (9.1%) | 0 (0.0%) |
| $50,000 to $99,999 | 191 (62.2%) | 102 (24.8%) |
| $100,000 to $299,999 | 88 (28.7%) | 310 (75.2%) |
| $300,000 to $499,999 | 0 (0.0%) | 0 (0.0%) |
| $500,000 to $749,999 | 0 (0.0%) | 0 (0.0%) |
| $750,000 to $999,999 | 0 (0.0%) | 0 (0.0%) |
| $1,000,000 or more | 0 (0.0%) | 0 (0.0%) |
| Total | 307 (100.0%) | 412 (100.0%) |
Household Income by Mortgage Status in Monte Grande
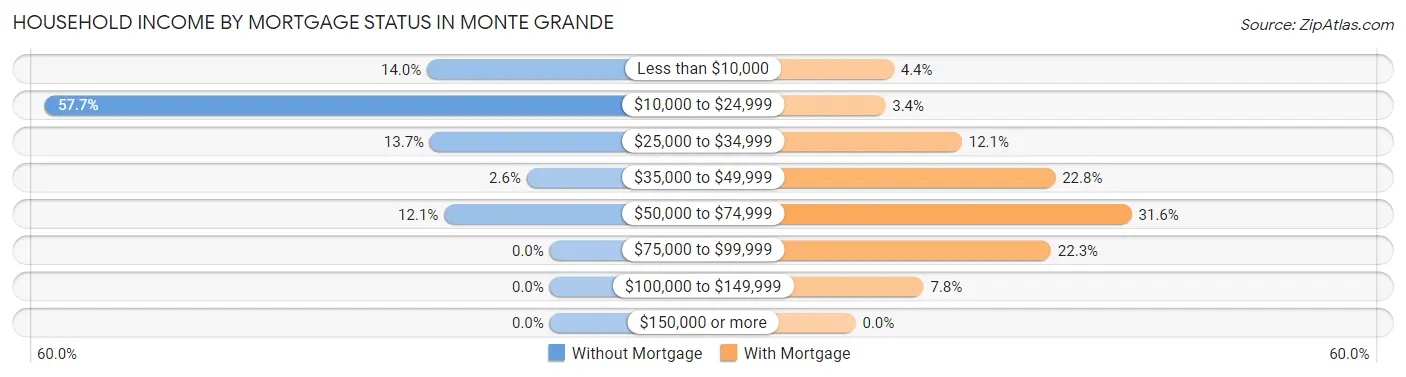
| Household Income | Without Mortgage | With Mortgage |
| Less than $10,000 | 43 (14.0%) | 18 (4.4%) |
| $10,000 to $24,999 | 177 (57.7%) | 14 (3.4%) |
| $25,000 to $34,999 | 42 (13.7%) | 50 (12.1%) |
| $35,000 to $49,999 | 8 (2.6%) | 94 (22.8%) |
| $50,000 to $74,999 | 37 (12.0%) | 130 (31.6%) |
| $75,000 to $99,999 | 0 (0.0%) | 92 (22.3%) |
| $100,000 to $149,999 | 0 (0.0%) | 32 (7.8%) |
| $150,000 or more | 0 (0.0%) | 0 (0.0%) |
| Total | 307 (100.0%) | 412 (100.0%) |
Property Value to Household Income Ratio in Monte Grande
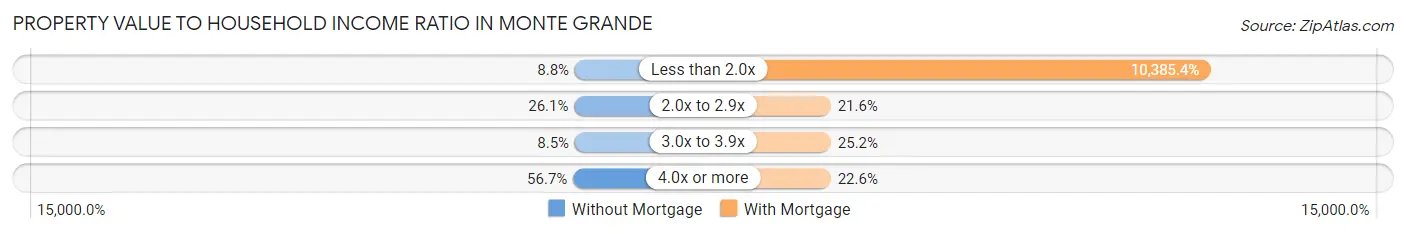
| Value-to-Income Ratio | Without Mortgage | With Mortgage |
| Less than 2.0x | 27 (8.8%) | 42,788 (10,385.4%) |
| 2.0x to 2.9x | 80 (26.1%) | 89 (21.6%) |
| 3.0x to 3.9x | 26 (8.5%) | 104 (25.2%) |
| 4.0x or more | 174 (56.7%) | 93 (22.6%) |
| Total | 307 (100.0%) | 412 (100.0%) |
Real Estate Taxes by Mortgage Status in Monte Grande
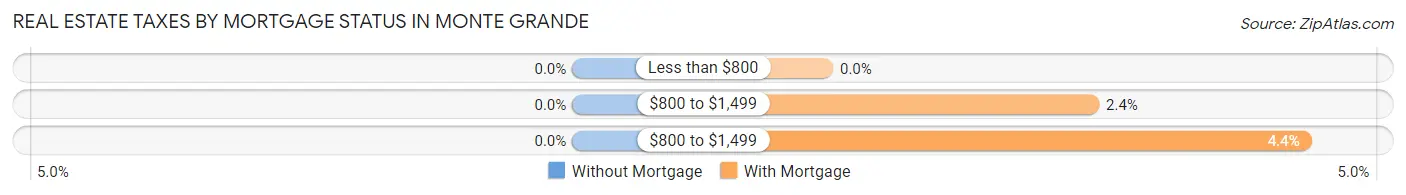
| Property Taxes | Without Mortgage | With Mortgage |
| Less than $800 | 0 (0.0%) | 0 (0.0%) |
| $800 to $1,499 | 0 (0.0%) | 10 (2.4%) |
| $800 to $1,499 | 0 (0.0%) | 18 (4.4%) |
| Total | 307 (100.0%) | 412 (100.0%) |
Health & Disability in Monte Grande
Health Insurance Coverage by Age in Monte Grande
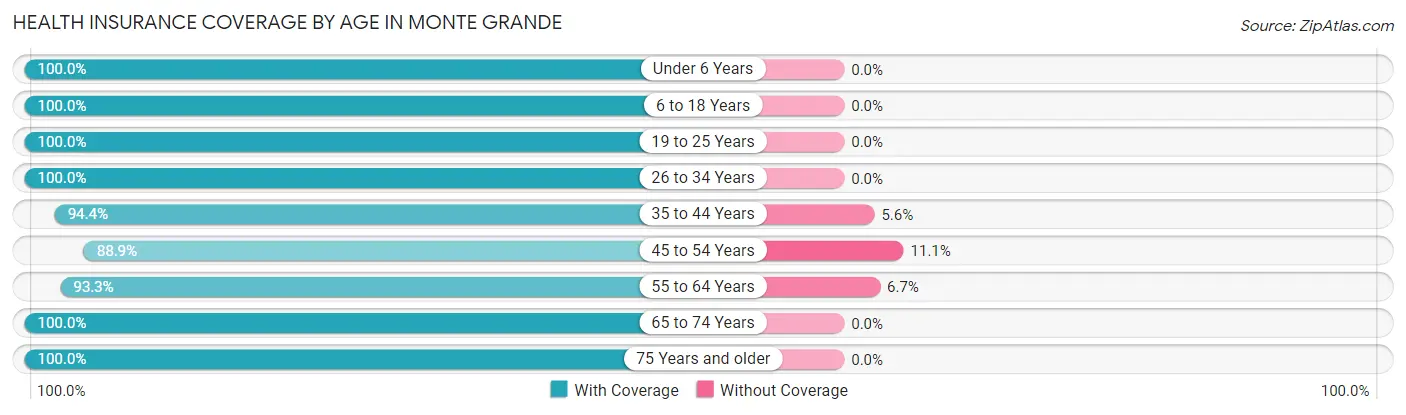
| Age Bracket | With Coverage | Without Coverage |
| Under 6 Years | 108 (100.0%) | 0 (0.0%) |
| 6 to 18 Years | 474 (100.0%) | 0 (0.0%) |
| 19 to 25 Years | 264 (100.0%) | 0 (0.0%) |
| 26 to 34 Years | 342 (100.0%) | 0 (0.0%) |
| 35 to 44 Years | 335 (94.4%) | 20 (5.6%) |
| 45 to 54 Years | 410 (88.9%) | 51 (11.1%) |
| 55 to 64 Years | 364 (93.3%) | 26 (6.7%) |
| 65 to 74 Years | 264 (100.0%) | 0 (0.0%) |
| 75 Years and older | 244 (100.0%) | 0 (0.0%) |
| Total | 2,805 (96.7%) | 97 (3.3%) |
Health Insurance Coverage by Citizenship Status in Monte Grande
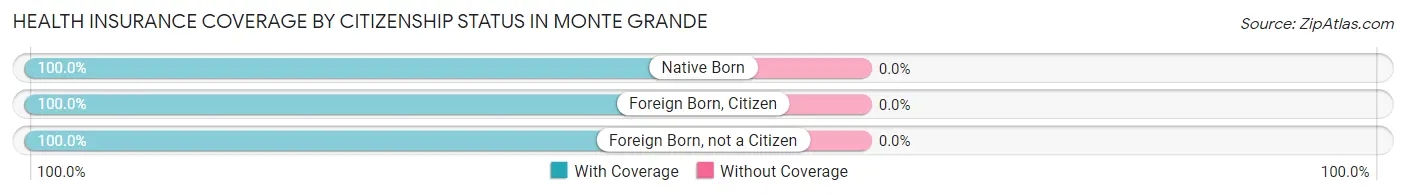
| Citizenship Status | With Coverage | Without Coverage |
| Native Born | 108 (100.0%) | 0 (0.0%) |
| Foreign Born, Citizen | 474 (100.0%) | 0 (0.0%) |
| Foreign Born, not a Citizen | 264 (100.0%) | 0 (0.0%) |
Health Insurance Coverage by Household Income in Monte Grande
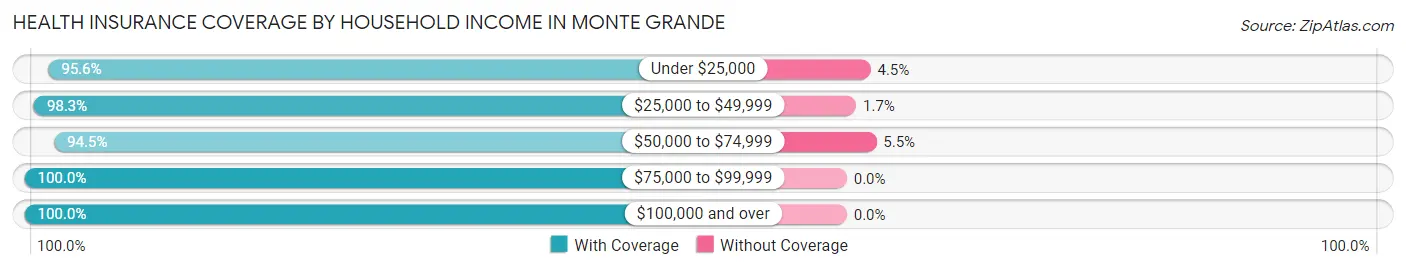
| Household Income | With Coverage | Without Coverage |
| Under $25,000 | 858 (95.6%) | 40 (4.4%) |
| $25,000 to $49,999 | 1,128 (98.3%) | 20 (1.7%) |
| $50,000 to $74,999 | 632 (94.5%) | 37 (5.5%) |
| $75,000 to $99,999 | 96 (100.0%) | 0 (0.0%) |
| $100,000 and over | 91 (100.0%) | 0 (0.0%) |
Public vs Private Health Insurance Coverage by Age in Monte Grande
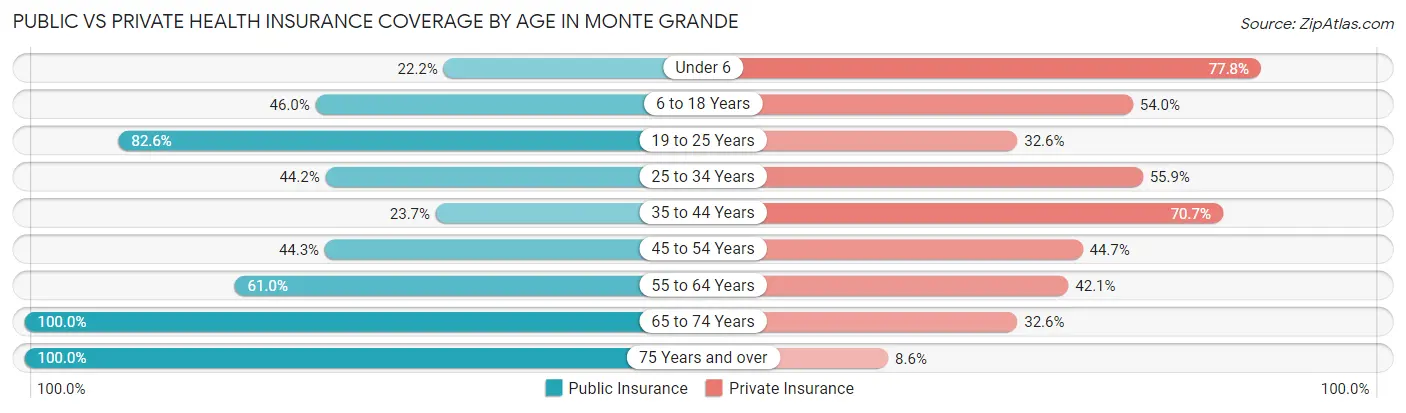
| Age Bracket | Public Insurance | Private Insurance |
| Under 6 | 24 (22.2%) | 84 (77.8%) |
| 6 to 18 Years | 218 (46.0%) | 256 (54.0%) |
| 19 to 25 Years | 218 (82.6%) | 86 (32.6%) |
| 25 to 34 Years | 151 (44.2%) | 191 (55.8%) |
| 35 to 44 Years | 84 (23.7%) | 251 (70.7%) |
| 45 to 54 Years | 204 (44.3%) | 206 (44.7%) |
| 55 to 64 Years | 238 (61.0%) | 164 (42.0%) |
| 65 to 74 Years | 264 (100.0%) | 86 (32.6%) |
| 75 Years and over | 244 (100.0%) | 21 (8.6%) |
| Total | 1,645 (56.7%) | 1,345 (46.4%) |
Disability Status by Sex by Age in Monte Grande
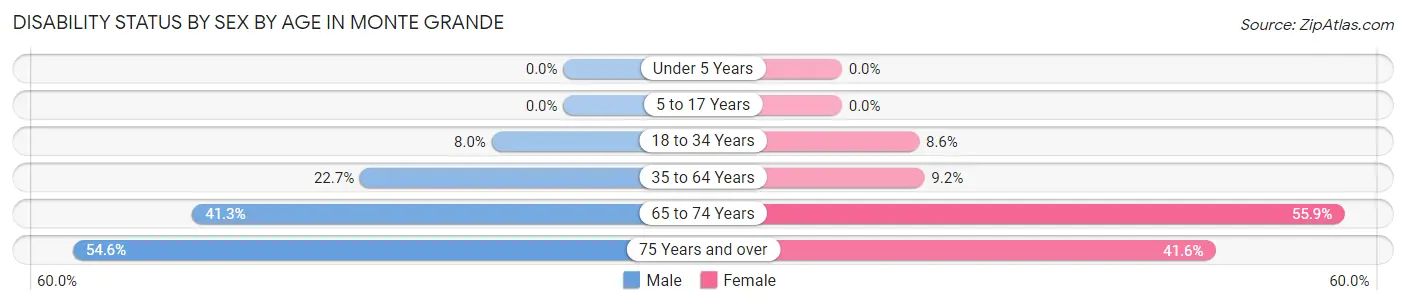
| Age Bracket | Male | Female |
| Under 5 Years | 0 (0.0%) | 0 (0.0%) |
| 5 to 17 Years | 0 (0.0%) | 0 (0.0%) |
| 18 to 34 Years | 34 (8.0%) | 19 (8.6%) |
| 35 to 64 Years | 118 (22.7%) | 63 (9.2%) |
| 65 to 74 Years | 50 (41.3%) | 80 (55.9%) |
| 75 Years and over | 65 (54.6%) | 52 (41.6%) |
Disability Class by Sex by Age in Monte Grande
Disability Class: Hearing Difficulty
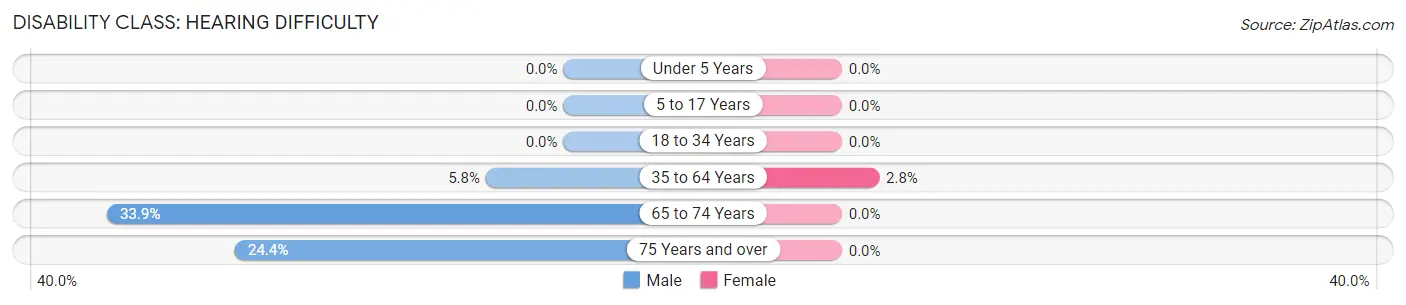
| Age Bracket | Male | Female |
| Under 5 Years | 0 (0.0%) | 0 (0.0%) |
| 5 to 17 Years | 0 (0.0%) | 0 (0.0%) |
| 18 to 34 Years | 0 (0.0%) | 0 (0.0%) |
| 35 to 64 Years | 30 (5.8%) | 19 (2.8%) |
| 65 to 74 Years | 41 (33.9%) | 0 (0.0%) |
| 75 Years and over | 29 (24.4%) | 0 (0.0%) |
Disability Class: Vision Difficulty
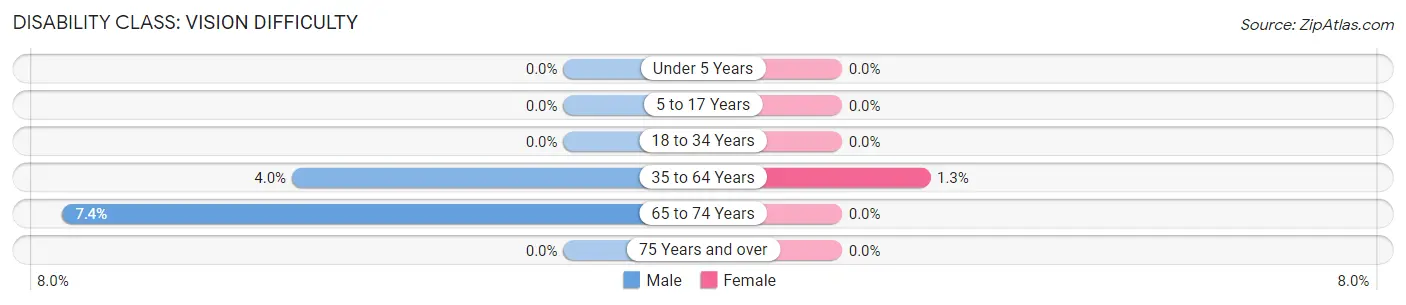
| Age Bracket | Male | Female |
| Under 5 Years | 0 (0.0%) | 0 (0.0%) |
| 5 to 17 Years | 0 (0.0%) | 0 (0.0%) |
| 18 to 34 Years | 0 (0.0%) | 0 (0.0%) |
| 35 to 64 Years | 21 (4.0%) | 9 (1.3%) |
| 65 to 74 Years | 9 (7.4%) | 0 (0.0%) |
| 75 Years and over | 0 (0.0%) | 0 (0.0%) |
Disability Class: Cognitive Difficulty
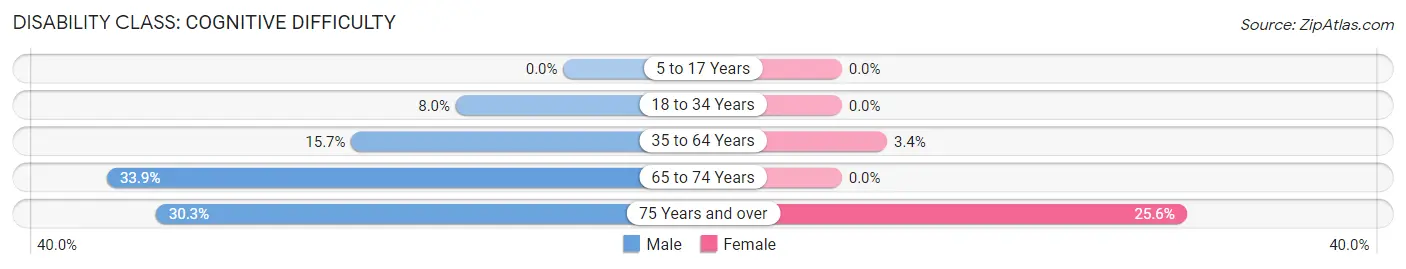
| Age Bracket | Male | Female |
| 5 to 17 Years | 0 (0.0%) | 0 (0.0%) |
| 18 to 34 Years | 34 (8.0%) | 0 (0.0%) |
| 35 to 64 Years | 82 (15.7%) | 23 (3.4%) |
| 65 to 74 Years | 41 (33.9%) | 0 (0.0%) |
| 75 Years and over | 36 (30.2%) | 32 (25.6%) |
Disability Class: Ambulatory Difficulty
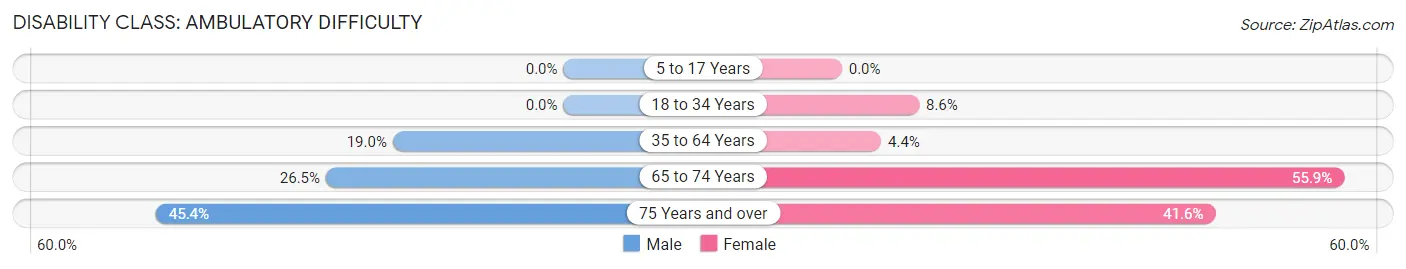
| Age Bracket | Male | Female |
| 5 to 17 Years | 0 (0.0%) | 0 (0.0%) |
| 18 to 34 Years | 0 (0.0%) | 19 (8.6%) |
| 35 to 64 Years | 99 (19.0%) | 30 (4.4%) |
| 65 to 74 Years | 32 (26.5%) | 80 (55.9%) |
| 75 Years and over | 54 (45.4%) | 52 (41.6%) |
Disability Class: Self-Care Difficulty
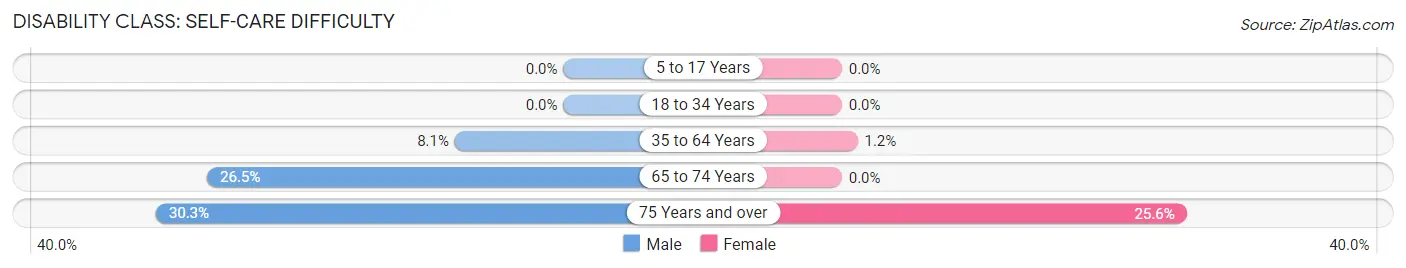
| Age Bracket | Male | Female |
| 5 to 17 Years | 0 (0.0%) | 0 (0.0%) |
| 18 to 34 Years | 0 (0.0%) | 0 (0.0%) |
| 35 to 64 Years | 42 (8.1%) | 8 (1.2%) |
| 65 to 74 Years | 32 (26.5%) | 0 (0.0%) |
| 75 Years and over | 36 (30.2%) | 32 (25.6%) |
Technology Access in Monte Grande
Computing Device Access in Monte Grande
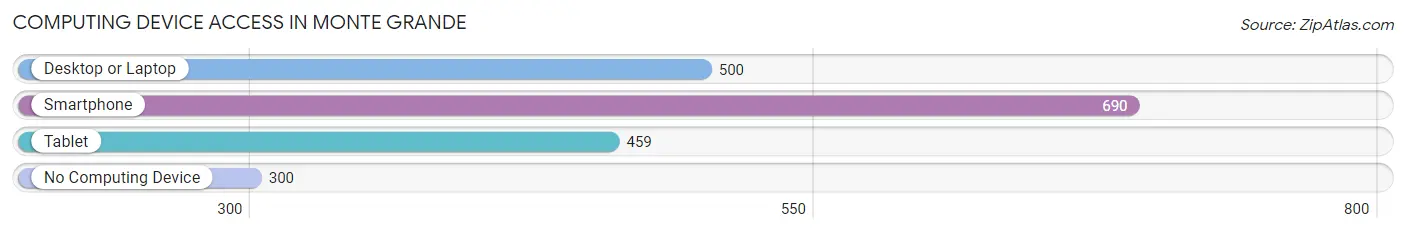
| Device Type | # Households | % Households |
| Desktop or Laptop | 500 | 48.1% |
| Smartphone | 690 | 66.4% |
| Tablet | 459 | 44.2% |
| No Computing Device | 300 | 28.9% |
| Total | 1,039 | 100.0% |
Internet Access in Monte Grande
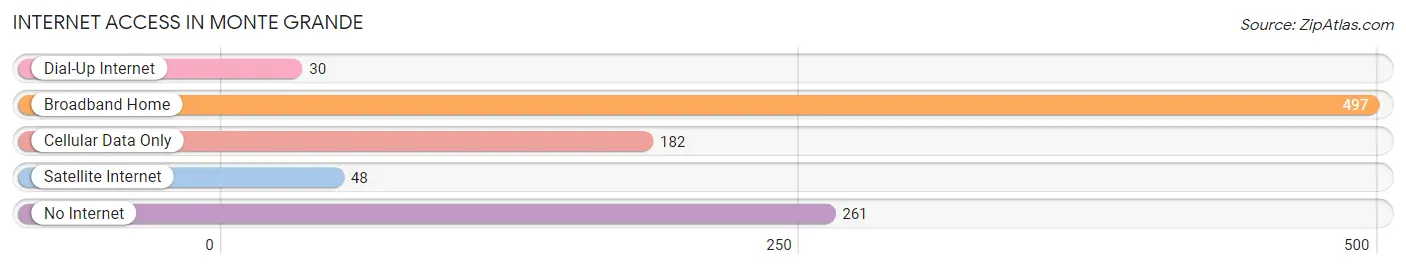
| Internet Type | # Households | % Households |
| Dial-Up Internet | 30 | 2.9% |
| Broadband Home | 497 | 47.8% |
| Cellular Data Only | 182 | 17.5% |
| Satellite Internet | 48 | 4.6% |
| No Internet | 261 | 25.1% |
| Total | 1,039 | 100.0% |
Monte Grande Summary
Monte Grande is a small municipality located in the central region of Puerto Rico. It is part of the San Juan-Caguas-Guaynabo Metropolitan Statistical Area. The municipality is bordered by the municipalities of Cidra, Cayey, and San Lorenzo. As of the 2010 census, the population of Monte Grande was 8,845.
Geography
Monte Grande is located in the central region of Puerto Rico, in the Cordillera Central mountain range. It is bordered by the municipalities of Cidra, Cayey, and San Lorenzo. The municipality covers an area of 11.9 square miles (30.8 km2). The terrain is mostly mountainous, with some flat areas in the lower elevations. The highest point in the municipality is Cerro de Monte Grande, which has an elevation of 1,890 feet (576 m).
Climate
Monte Grande has a tropical climate, with temperatures ranging from an average low of 70°F (21°C) in the winter to an average high of 90°F (32°C) in the summer. The average annual precipitation is around 60 inches (1,524 mm).
Demographics
As of the 2010 census, the population of Monte Grande was 8,845. The population is mostly of mixed European and African descent. The median age is 37.5 years, and the median household income is $17,845.
Economy
The economy of Monte Grande is largely based on agriculture. The main crops grown in the municipality are coffee, plantains, and bananas. Other industries include manufacturing, construction, and tourism.
History
Monte Grande was founded in 1815 by Don Juan de la Cruz. The municipality was originally part of the municipality of Cidra, but was separated in 1825. The name of the municipality comes from the Cerro de Monte Grande, the highest point in the municipality.
Monte Grande has a long history of political activism. In the late 19th century, the municipality was a center of the independence movement in Puerto Rico. In the early 20th century, the municipality was a center of the labor movement, and was the site of several strikes and protests.
Monte Grande was also the site of a major battle during the Spanish-American War. On July 25, 1898, the Spanish forces in the area were defeated by the American forces. This victory was a major turning point in the war, and led to the eventual surrender of the Spanish forces in Puerto Rico.
Conclusion
Monte Grande is a small municipality located in the central region of Puerto Rico. It is bordered by the municipalities of Cidra, Cayey, and San Lorenzo. As of the 2010 census, the population of Monte Grande was 8,845. The economy of Monte Grande is largely based on agriculture, and other industries include manufacturing, construction, and tourism. Monte Grande has a long history of political activism, and was the site of a major battle during the Spanish-American War.
Common Questions
What is Per Capita Income in Monte Grande?
Per Capita income in Monte Grande is $13,672.
What is the Median Family Income in Monte Grande?
Median Family Income in Monte Grande is $36,250.
What is the Median Household income in Monte Grande?
Median Household Income in Monte Grande is $25,747.
What is Income or Wage Gap in Monte Grande?
Income or Wage Gap in Monte Grande is 21.2%.
Women in Monte Grande earn 78.8 cents for every dollar earned by a man.
What is Family Income Deficit in Monte Grande?
Family Income Deficit in Monte Grande is $8,769.
Families that are below poverty line in Monte Grande earn $8,769 less on average than the poverty threshold level.
What is Inequality or Gini Index in Monte Grande?
Inequality or Gini Index in Monte Grande is 0.41.
What is the Total Population of Monte Grande?
Total Population of Monte Grande is 2,902.
What is the Total Male Population of Monte Grande?
Total Male Population of Monte Grande is 1,520.
What is the Total Female Population of Monte Grande?
Total Female Population of Monte Grande is 1,382.
What is the Ratio of Males per 100 Females in Monte Grande?
There are 109.99 Males per 100 Females in Monte Grande.
What is the Ratio of Females per 100 Males in Monte Grande?
There are 90.92 Females per 100 Males in Monte Grande.
What is the Median Population Age in Monte Grande?
Median Population Age in Monte Grande is 42.0 Years.
What is the Average Family Size in Monte Grande
Average Family Size in Monte Grande is 3.8 People.
What is the Average Household Size in Monte Grande
Average Household Size in Monte Grande is 2.8 People.
How Large is the Labor Force in Monte Grande?
There are 1,354 People in the Labor Forcein in Monte Grande.
What is the Percentage of People in the Labor Force in Monte Grande?
56.2% of People are in the Labor Force in Monte Grande.
What is the Unemployment Rate in Monte Grande?
Unemployment Rate in Monte Grande is 10.3%.