Hacienda San Jose, PR Map & Demographics
Hacienda San Jose Overview
$51,308
PER CAPITA INCOME
$133,839
AVG FAMILY INCOME
$134,821
AVG HOUSEHOLD INCOME
45.7%
WAGE / INCOME GAP [ % ]
54.3¢/ $1
WAGE / INCOME GAP [ $ ]
0.47
INEQUALITY / GINI INDEX
3,384
TOTAL POPULATION
1,754
MALE POPULATION
1,630
FEMALE POPULATION
107.61
MALES / 100 FEMALES
92.93
FEMALES / 100 MALES
40.1
MEDIAN AGE
3.5
AVG FAMILY SIZE
3.3
AVG HOUSEHOLD SIZE
1,845
LABOR FORCE [ PEOPLE ]
67.6%
PERCENT IN LABOR FORCE
4.3%
UNEMPLOYMENT RATE
Income in Hacienda San Jose
Income Overview in Hacienda San Jose
Per Capita Income in Hacienda San Jose is $51,308, while median incomes of families and households are $133,839 and $134,821 respectively.
| Characteristic | Number | Measure |
| Per Capita Income | 3,384 | $51,308 |
| Median Family Income | 903 | $133,839 |
| Mean Family Income | 903 | $176,283 |
| Median Household Income | 1,030 | $134,821 |
| Mean Household Income | 1,030 | $171,882 |
| Income Deficit | 903 | $0 |
| Wage / Income Gap (%) | 3,384 | 45.66% |
| Wage / Income Gap ($) | 3,384 | 54.34¢ per $1 |
| Gini / Inequality Index | 3,384 | 0.47 |
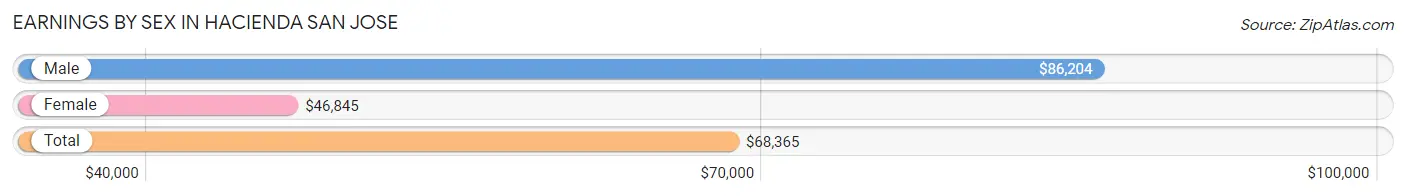
Earnings by Sex in Hacienda San Jose
Average Earnings in Hacienda San Jose are $68,365, $86,204 for men and $46,845 for women, a difference of 45.7%.
| Sex | Number | Average Earnings |
| Male | 1,064 (58.6%) | $86,204 |
| Female | 752 (41.4%) | $46,845 |
| Total | 1,816 (100.0%) | $68,365 |
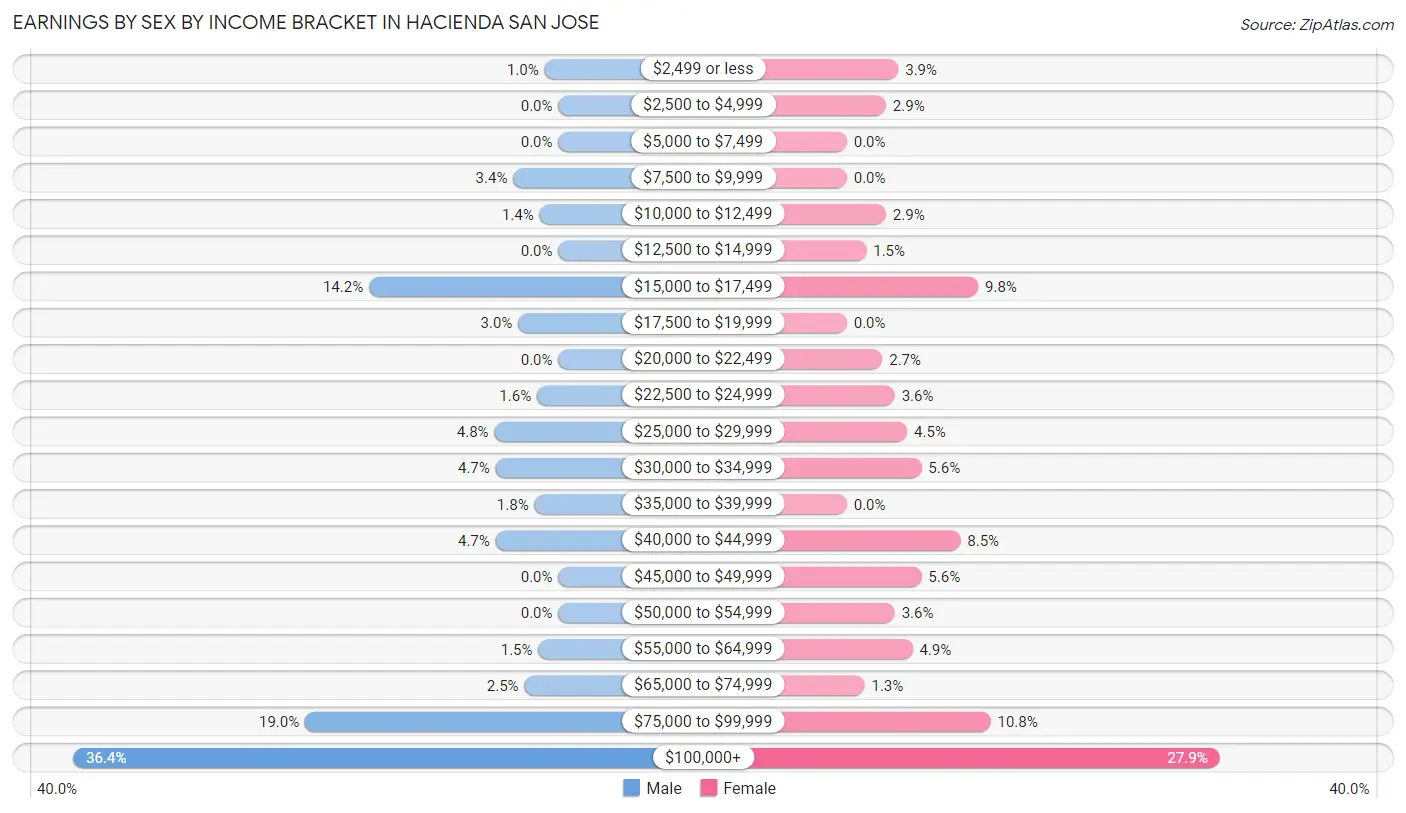
Earnings by Sex by Income Bracket in Hacienda San Jose
The most common earnings brackets in Hacienda San Jose are $100,000+ for men (387 | 36.4%) and $100,000+ for women (210 | 27.9%).
| Income | Male | Female |
| $2,499 or less | 11 (1.0%) | 29 (3.9%) |
| $2,500 to $4,999 | 0 (0.0%) | 22 (2.9%) |
| $5,000 to $7,499 | 0 (0.0%) | 0 (0.0%) |
| $7,500 to $9,999 | 36 (3.4%) | 0 (0.0%) |
| $10,000 to $12,499 | 15 (1.4%) | 22 (2.9%) |
| $12,500 to $14,999 | 0 (0.0%) | 11 (1.5%) |
| $15,000 to $17,499 | 151 (14.2%) | 74 (9.8%) |
| $17,500 to $19,999 | 32 (3.0%) | 0 (0.0%) |
| $20,000 to $22,499 | 0 (0.0%) | 20 (2.7%) |
| $22,500 to $24,999 | 17 (1.6%) | 27 (3.6%) |
| $25,000 to $29,999 | 51 (4.8%) | 34 (4.5%) |
| $30,000 to $34,999 | 50 (4.7%) | 42 (5.6%) |
| $35,000 to $39,999 | 19 (1.8%) | 0 (0.0%) |
| $40,000 to $44,999 | 50 (4.7%) | 64 (8.5%) |
| $45,000 to $49,999 | 0 (0.0%) | 42 (5.6%) |
| $50,000 to $54,999 | 0 (0.0%) | 27 (3.6%) |
| $55,000 to $64,999 | 16 (1.5%) | 37 (4.9%) |
| $65,000 to $74,999 | 27 (2.5%) | 10 (1.3%) |
| $75,000 to $99,999 | 202 (19.0%) | 81 (10.8%) |
| $100,000+ | 387 (36.4%) | 210 (27.9%) |
| Total | 1,064 (100.0%) | 752 (100.0%) |
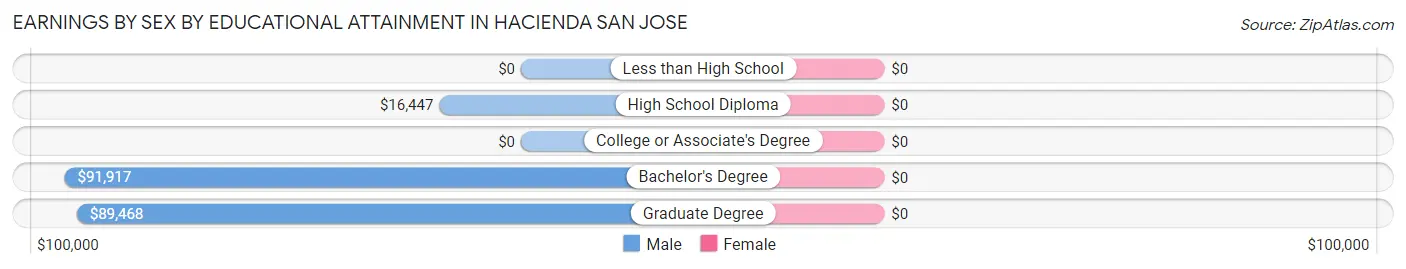
Earnings by Sex by Educational Attainment in Hacienda San Jose
| Educational Attainment | Male Income | Female Income |
| Less than High School | - | - |
| High School Diploma | $16,447 | $0 |
| College or Associate's Degree | - | - |
| Bachelor's Degree | $91,917 | $0 |
| Graduate Degree | $89,468 | $0 |
| Total | $86,559 | $48,750 |
Family Income in Hacienda San Jose
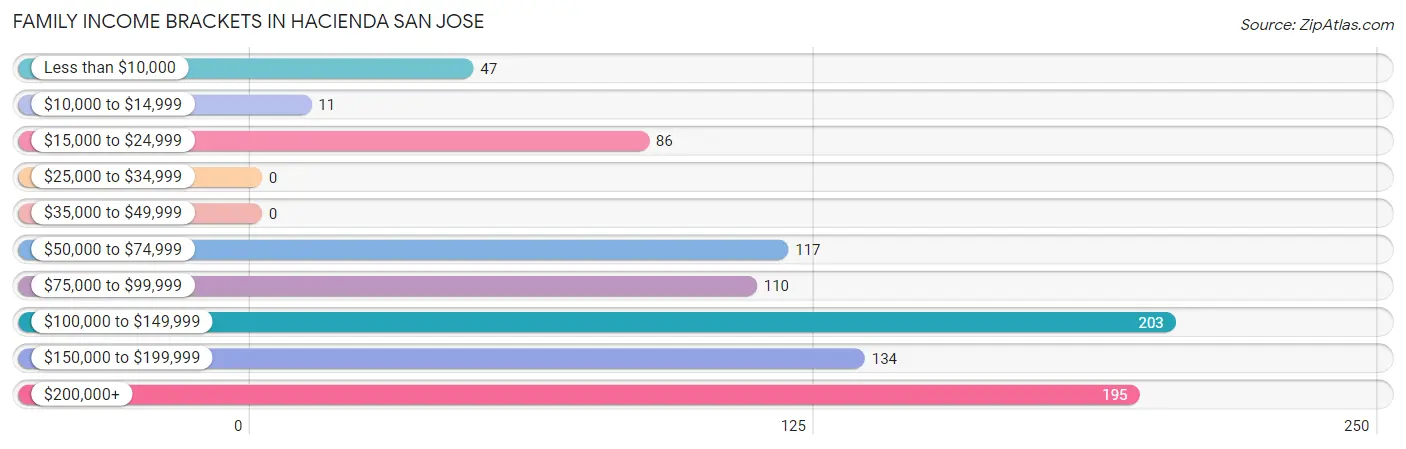
Family Income Brackets in Hacienda San Jose
According to the Hacienda San Jose family income data, there are 203 families falling into the $100,000 to $149,999 income range, which is the most common income bracket and makes up 22.5% of all families.
| Income Bracket | # Families | % Families |
| Less than $10,000 | 47 | 5.2% |
| $10,000 to $14,999 | 11 | 1.2% |
| $15,000 to $24,999 | 86 | 9.5% |
| $25,000 to $34,999 | 0 | 0.0% |
| $35,000 to $49,999 | 0 | 0.0% |
| $50,000 to $74,999 | 117 | 13.0% |
| $75,000 to $99,999 | 110 | 12.2% |
| $100,000 to $149,999 | 203 | 22.5% |
| $150,000 to $199,999 | 134 | 14.8% |
| $200,000+ | 195 | 21.6% |
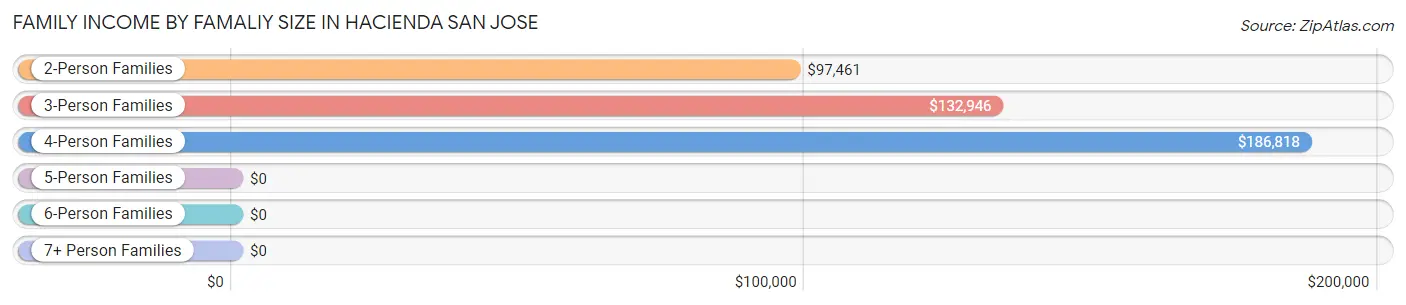
Family Income by Famaliy Size in Hacienda San Jose
4-person families (234 | 25.9%) account for the highest median family income in Hacienda San Jose with $186,818 per family, while 2-person families (331 | 36.7%) have the highest median income of $48,730 per family member.
| Income Bracket | # Families | Median Income |
| 2-Person Families | 331 (36.7%) | $97,461 |
| 3-Person Families | 219 (24.2%) | $132,946 |
| 4-Person Families | 234 (25.9%) | $186,818 |
| 5-Person Families | 73 (8.1%) | $0 |
| 6-Person Families | 20 (2.2%) | $0 |
| 7+ Person Families | 26 (2.9%) | $0 |
| Total | 903 (100.0%) | $133,839 |
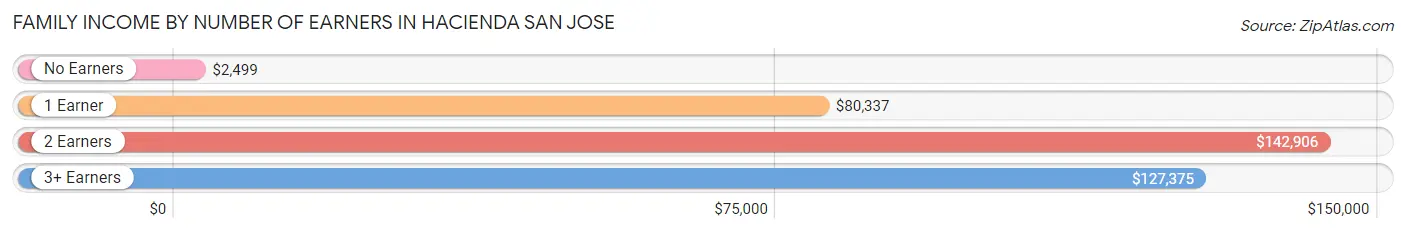
Family Income by Number of Earners in Hacienda San Jose
The median family income in Hacienda San Jose is $133,839, with families comprising 2 earners (537) having the highest median family income of $142,906, while families with no earners (47) have the lowest median family income of $2,499, accounting for 59.5% and 5.2% of families, respectively.
| Number of Earners | # Families | Median Income |
| No Earners | 47 (5.2%) | $2,499 |
| 1 Earner | 243 (26.9%) | $80,337 |
| 2 Earners | 537 (59.5%) | $142,906 |
| 3+ Earners | 76 (8.4%) | $127,375 |
| Total | 903 (100.0%) | $133,839 |
Household Income in Hacienda San Jose
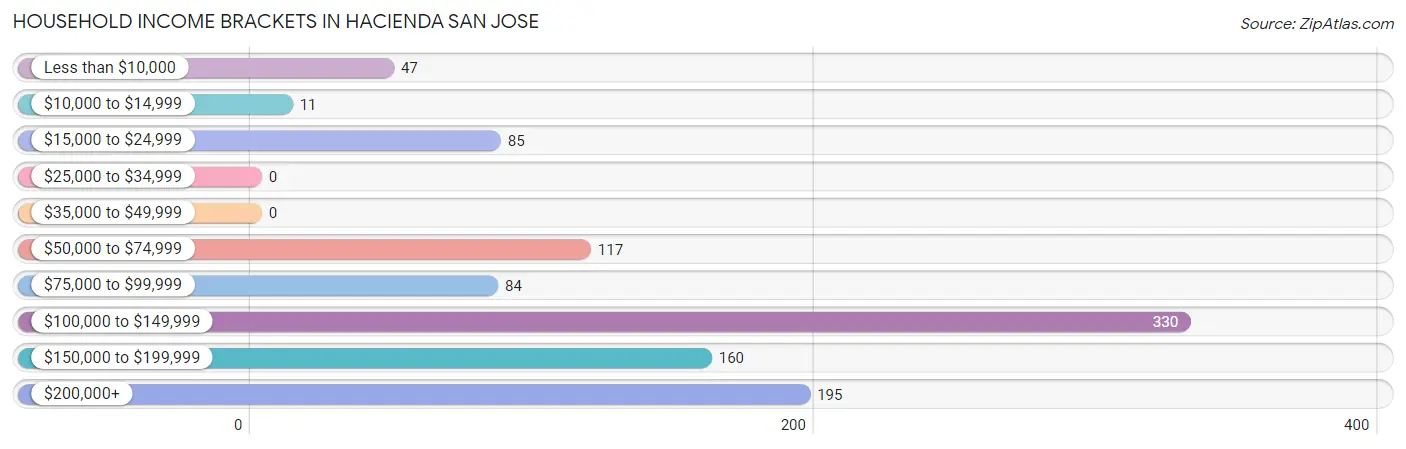
Household Income Brackets in Hacienda San Jose
With 330 households falling in the category, the $100,000 to $149,999 income range is the most frequent in Hacienda San Jose, accounting for 32.0% of all households.
| Income Bracket | # Households | % Households |
| Less than $10,000 | 47 | 4.6% |
| $10,000 to $14,999 | 11 | 1.1% |
| $15,000 to $24,999 | 85 | 8.3% |
| $25,000 to $34,999 | 0 | 0.0% |
| $35,000 to $49,999 | 0 | 0.0% |
| $50,000 to $74,999 | 117 | 11.4% |
| $75,000 to $99,999 | 84 | 8.2% |
| $100,000 to $149,999 | 330 | 32.0% |
| $150,000 to $199,999 | 160 | 15.5% |
| $200,000+ | 195 | 18.9% |
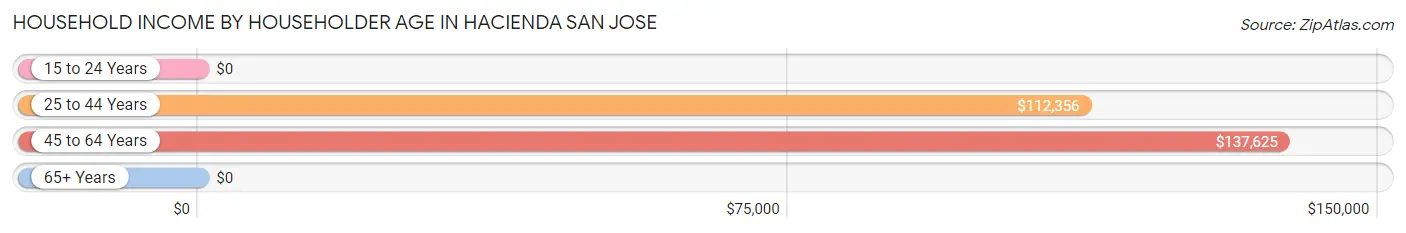
Household Income by Householder Age in Hacienda San Jose
The median household income in Hacienda San Jose is $134,821, with the highest median household income of $137,625 found in the 45 to 64 years age bracket for the primary householder. A total of 567 households (55.0%) fall into this category.
| Income Bracket | # Households | Median Income |
| 15 to 24 Years | 0 (0.0%) | $0 |
| 25 to 44 Years | 329 (31.9%) | $112,356 |
| 45 to 64 Years | 567 (55.0%) | $137,625 |
| 65+ Years | 134 (13.0%) | $0 |
| Total | 1,030 (100.0%) | $134,821 |
Poverty in Hacienda San Jose
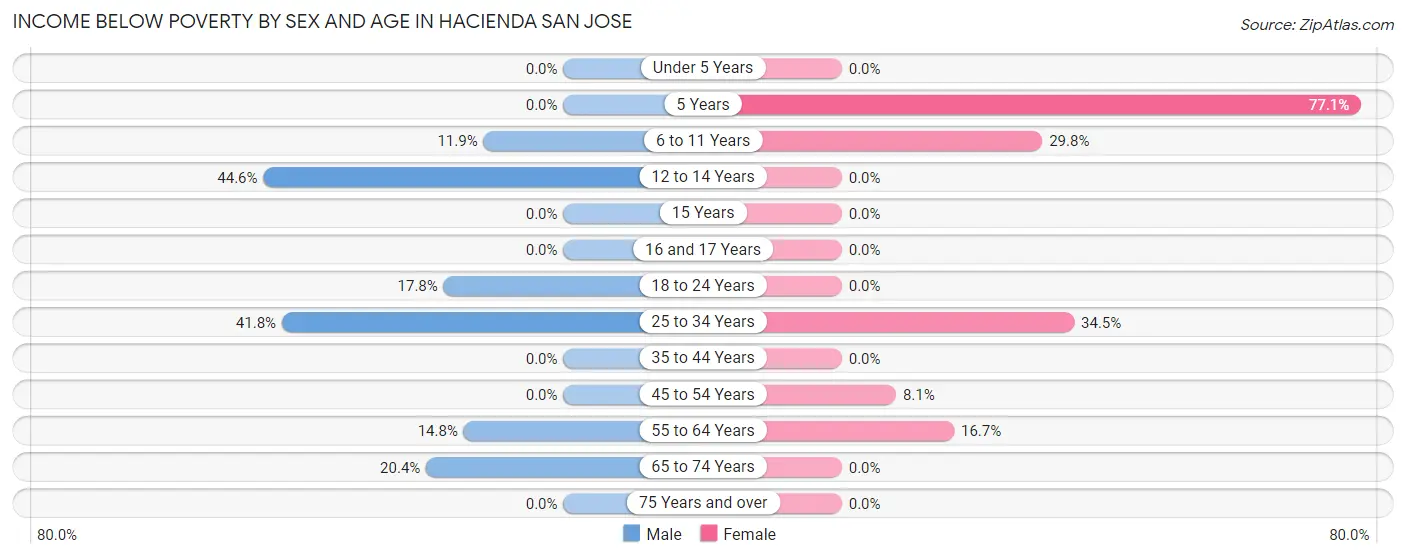
Income Below Poverty by Sex and Age in Hacienda San Jose
With 11.8% poverty level for males and 12.6% for females among the residents of Hacienda San Jose, 12 to 14 year old males and 5 year old females are the most vulnerable to poverty, with 45 males (44.6%) and 64 females (77.1%) in their respective age groups living below the poverty level.
| Age Bracket | Male | Female |
| Under 5 Years | 0 (0.0%) | 0 (0.0%) |
| 5 Years | 0 (0.0%) | 64 (77.1%) |
| 6 to 11 Years | 30 (11.9%) | 25 (29.8%) |
| 12 to 14 Years | 45 (44.6%) | 0 (0.0%) |
| 15 Years | 0 (0.0%) | 0 (0.0%) |
| 16 and 17 Years | 0 (0.0%) | 0 (0.0%) |
| 18 to 24 Years | 16 (17.8%) | 0 (0.0%) |
| 25 to 34 Years | 84 (41.8%) | 59 (34.5%) |
| 35 to 44 Years | 0 (0.0%) | 0 (0.0%) |
| 45 to 54 Years | 0 (0.0%) | 36 (8.1%) |
| 55 to 64 Years | 21 (14.8%) | 21 (16.7%) |
| 65 to 74 Years | 11 (20.4%) | 0 (0.0%) |
| 75 Years and over | 0 (0.0%) | 0 (0.0%) |
| Total | 207 (11.8%) | 205 (12.6%) |
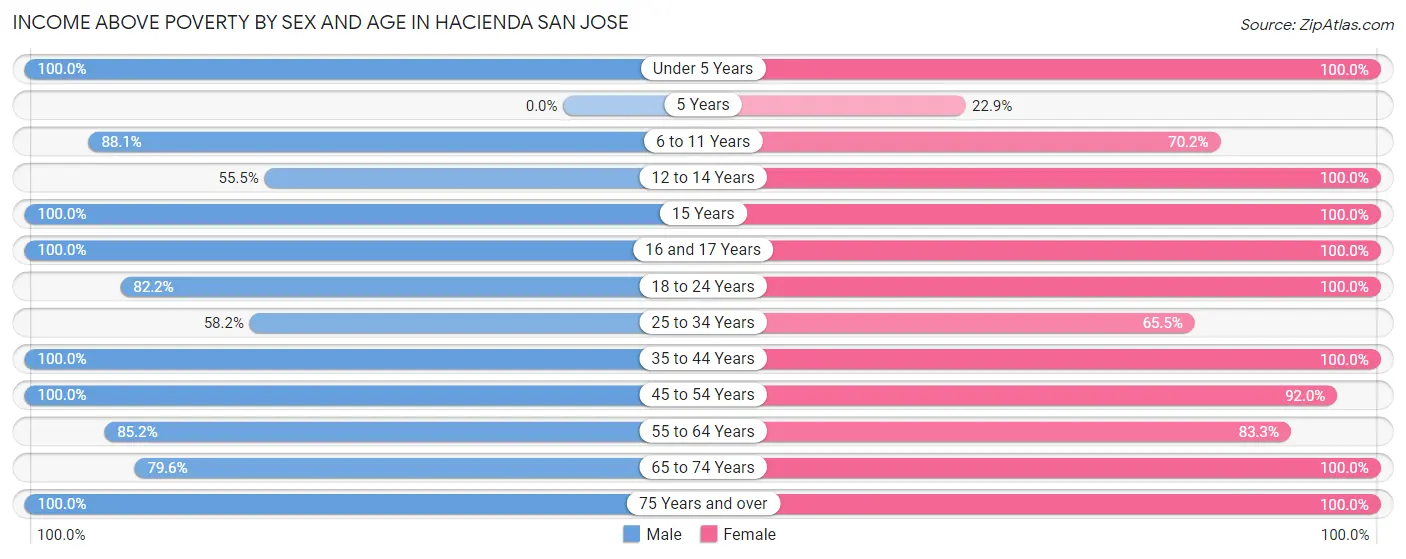
Income Above Poverty by Sex and Age in Hacienda San Jose
According to the poverty statistics in Hacienda San Jose, males aged under 5 years and females aged under 5 years are the age groups that are most secure financially, with 100.0% of males and 100.0% of females in these age groups living above the poverty line.
| Age Bracket | Male | Female |
| Under 5 Years | 20 (100.0%) | 69 (100.0%) |
| 5 Years | 0 (0.0%) | 19 (22.9%) |
| 6 to 11 Years | 223 (88.1%) | 59 (70.2%) |
| 12 to 14 Years | 56 (55.4%) | 13 (100.0%) |
| 15 Years | 18 (100.0%) | 13 (100.0%) |
| 16 and 17 Years | 157 (100.0%) | 163 (100.0%) |
| 18 to 24 Years | 74 (82.2%) | 154 (100.0%) |
| 25 to 34 Years | 117 (58.2%) | 112 (65.5%) |
| 35 to 44 Years | 328 (100.0%) | 115 (100.0%) |
| 45 to 54 Years | 312 (100.0%) | 411 (91.9%) |
| 55 to 64 Years | 121 (85.2%) | 105 (83.3%) |
| 65 to 74 Years | 43 (79.6%) | 45 (100.0%) |
| 75 Years and over | 78 (100.0%) | 147 (100.0%) |
| Total | 1,547 (88.2%) | 1,425 (87.4%) |
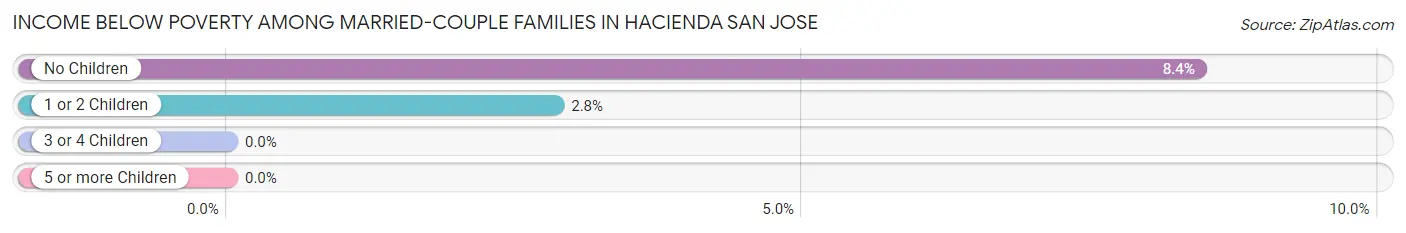
Income Below Poverty Among Married-Couple Families in Hacienda San Jose
The poverty statistics for married-couple families in Hacienda San Jose show that 4.9% or 33 of the total 680 families live below the poverty line. Families with no children have the highest poverty rate of 8.4%, comprising of 22 families. On the other hand, families with 3 or 4 children have the lowest poverty rate of 0.0%, which includes 0 families.
| Children | Above Poverty | Below Poverty |
| No Children | 239 (91.6%) | 22 (8.4%) |
| 1 or 2 Children | 376 (97.2%) | 11 (2.8%) |
| 3 or 4 Children | 32 (100.0%) | 0 (0.0%) |
| 5 or more Children | 0 (0.0%) | 0 (0.0%) |
| Total | 647 (95.2%) | 33 (4.9%) |
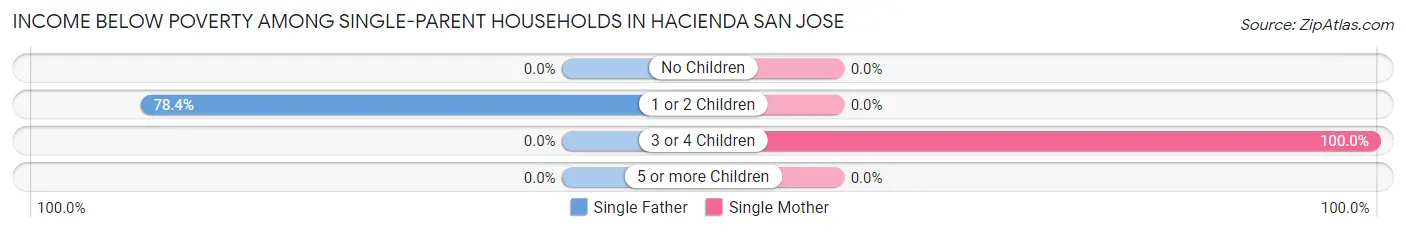
Income Below Poverty Among Single-Parent Households in Hacienda San Jose
According to the poverty data in Hacienda San Jose, 51.5% or 69 single-father households and 28.1% or 25 single-mother households are living below the poverty line. Among single-father households, those with 1 or 2 children have the highest poverty rate, with 69 households (78.4%) experiencing poverty. Likewise, among single-mother households, those with 3 or 4 children have the highest poverty rate, with 25 households (100.0%) falling below the poverty line.
| Children | Single Father | Single Mother |
| No Children | 0 (0.0%) | 0 (0.0%) |
| 1 or 2 Children | 69 (78.4%) | 0 (0.0%) |
| 3 or 4 Children | 0 (0.0%) | 25 (100.0%) |
| 5 or more Children | 0 (0.0%) | 0 (0.0%) |
| Total | 69 (51.5%) | 25 (28.1%) |
Income Below Poverty Among Married-Couple vs Single-Parent Households in Hacienda San Jose
The poverty data for Hacienda San Jose shows that 33 of the married-couple family households (4.9%) and 94 of the single-parent households (42.1%) are living below the poverty level. Within the married-couple family households, those with no children have the highest poverty rate, with 22 households (8.4%) falling below the poverty line. Among the single-parent households, those with 3 or 4 children have the highest poverty rate, with 25 household (100.0%) living below poverty.
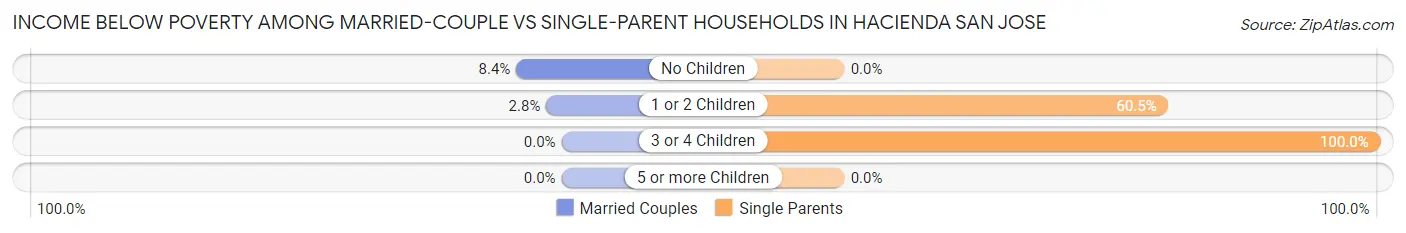
| Children | Married-Couple Families | Single-Parent Households |
| No Children | 22 (8.4%) | 0 (0.0%) |
| 1 or 2 Children | 11 (2.8%) | 69 (60.5%) |
| 3 or 4 Children | 0 (0.0%) | 25 (100.0%) |
| 5 or more Children | 0 (0.0%) | 0 (0.0%) |
| Total | 33 (4.9%) | 94 (42.1%) |
Race in Hacienda San Jose
The most populous races in Hacienda San Jose are Hispanic or Latino (3,384 | 100.0%), White / Caucasian (1,390 | 41.1%), and Two or more Races (944 | 27.9%).
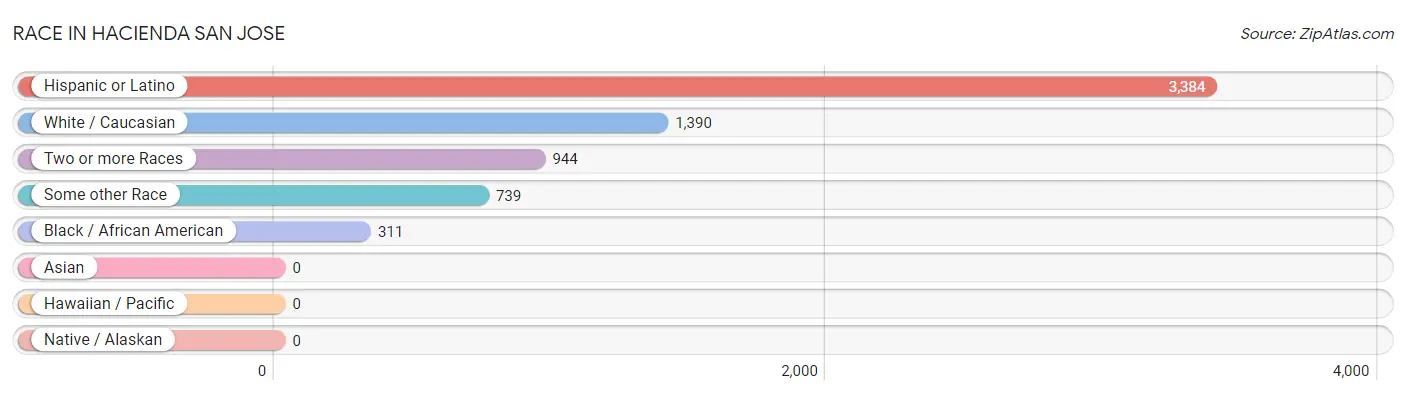
| Race | # Population | % Population |
| Asian | 0 | 0.0% |
| Black / African American | 311 | 9.2% |
| Hawaiian / Pacific | 0 | 0.0% |
| Hispanic or Latino | 3,384 | 100.0% |
| Native / Alaskan | 0 | 0.0% |
| White / Caucasian | 1,390 | 41.1% |
| Two or more Races | 944 | 27.9% |
| Some other Race | 739 | 21.8% |
| Total | 3,384 | 100.0% |
Ancestry in Hacienda San Jose
The most populous ancestries reported in Hacienda San Jose are Puerto Rican (3,287 | 97.1%), Spaniard (69 | 2.0%), American (53 | 1.6%), Central American Indian (40 | 1.2%), and Mexican (18 | 0.5%), together accounting for 102.5% of all Hacienda San Jose residents.
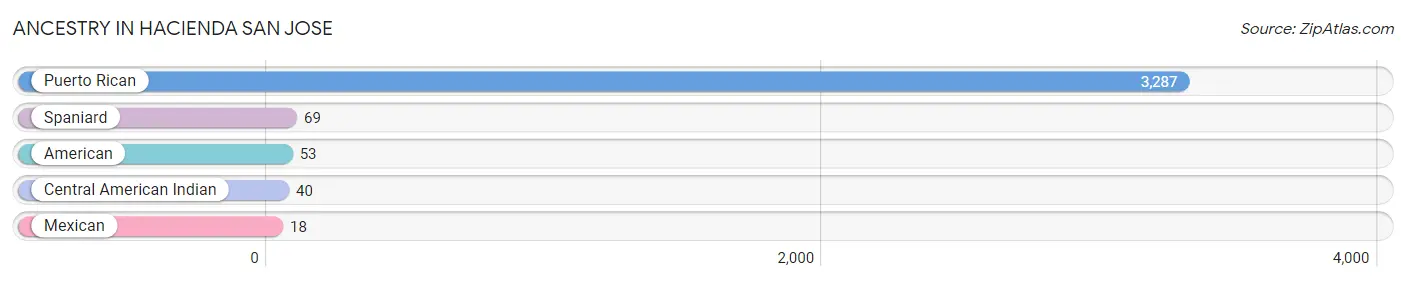
| Ancestry | # Population | % Population |
| American | 53 | 1.6% |
| Central American Indian | 40 | 1.2% |
| Mexican | 18 | 0.5% |
| Puerto Rican | 3,287 | 97.1% |
| Spaniard | 69 | 2.0% | View All 5 Rows |
Immigrants in Hacienda San Jose

| Immigration Origin | # Population | % Population | View All 0 Rows |
Sex and Age in Hacienda San Jose
Sex and Age in Hacienda San Jose
The most populous age groups in Hacienda San Jose are 40 to 44 Years (302 | 17.2%) for men and 45 to 49 Years (354 | 21.7%) for women.
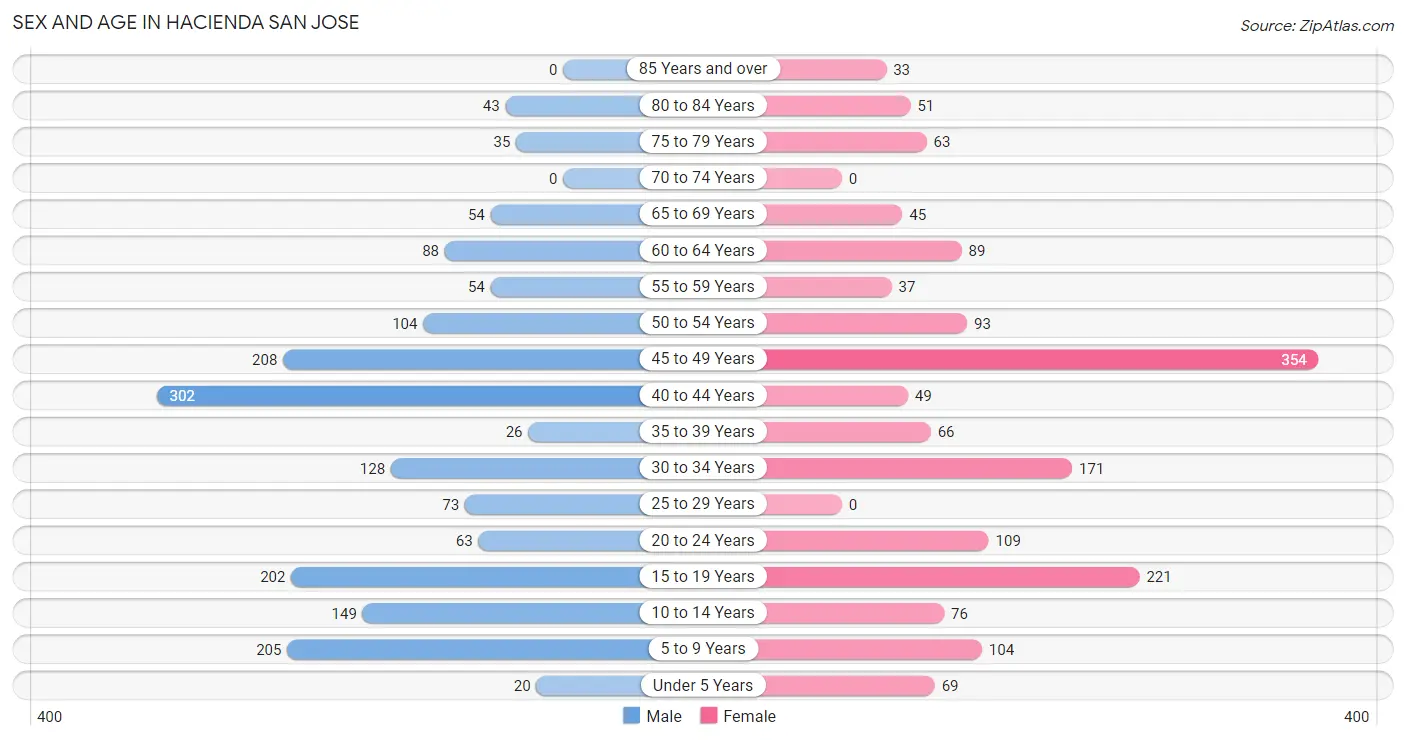
| Age Bracket | Male | Female |
| Under 5 Years | 20 (1.1%) | 69 (4.2%) |
| 5 to 9 Years | 205 (11.7%) | 104 (6.4%) |
| 10 to 14 Years | 149 (8.5%) | 76 (4.7%) |
| 15 to 19 Years | 202 (11.5%) | 221 (13.6%) |
| 20 to 24 Years | 63 (3.6%) | 109 (6.7%) |
| 25 to 29 Years | 73 (4.2%) | 0 (0.0%) |
| 30 to 34 Years | 128 (7.3%) | 171 (10.5%) |
| 35 to 39 Years | 26 (1.5%) | 66 (4.1%) |
| 40 to 44 Years | 302 (17.2%) | 49 (3.0%) |
| 45 to 49 Years | 208 (11.9%) | 354 (21.7%) |
| 50 to 54 Years | 104 (5.9%) | 93 (5.7%) |
| 55 to 59 Years | 54 (3.1%) | 37 (2.3%) |
| 60 to 64 Years | 88 (5.0%) | 89 (5.5%) |
| 65 to 69 Years | 54 (3.1%) | 45 (2.8%) |
| 70 to 74 Years | 0 (0.0%) | 0 (0.0%) |
| 75 to 79 Years | 35 (2.0%) | 63 (3.9%) |
| 80 to 84 Years | 43 (2.5%) | 51 (3.1%) |
| 85 Years and over | 0 (0.0%) | 33 (2.0%) |
| Total | 1,754 (100.0%) | 1,630 (100.0%) |
Families and Households in Hacienda San Jose
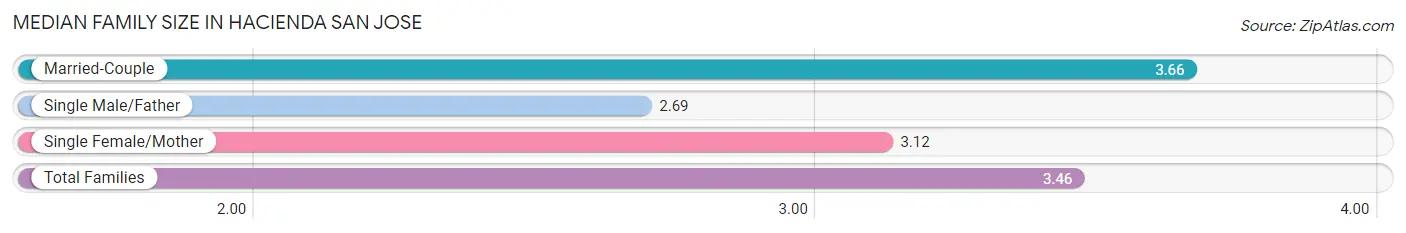
Median Family Size in Hacienda San Jose
The median family size in Hacienda San Jose is 3.46 persons per family, with married-couple families (680 | 75.3%) accounting for the largest median family size of 3.66 persons per family. On the other hand, single male/father families (134 | 14.8%) represent the smallest median family size with 2.69 persons per family.
| Family Type | # Families | Family Size |
| Married-Couple | 680 (75.3%) | 3.66 |
| Single Male/Father | 134 (14.8%) | 2.69 |
| Single Female/Mother | 89 (9.9%) | 3.12 |
| Total Families | 903 (100.0%) | 3.46 |
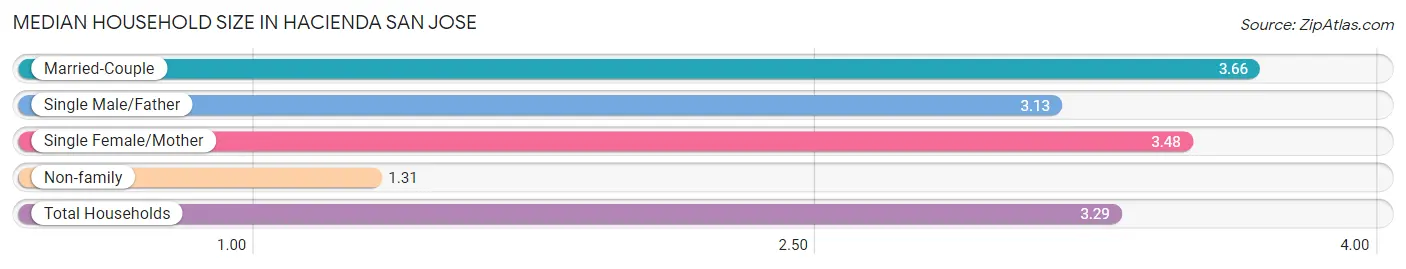
Median Household Size in Hacienda San Jose
The median household size in Hacienda San Jose is 3.29 persons per household, with married-couple households (680 | 66.0%) accounting for the largest median household size of 3.66 persons per household. non-family households (127 | 12.3%) represent the smallest median household size with 1.31 persons per household.
| Household Type | # Households | Household Size |
| Married-Couple | 680 (66.0%) | 3.66 |
| Single Male/Father | 134 (13.0%) | 3.13 |
| Single Female/Mother | 89 (8.6%) | 3.48 |
| Non-family | 127 (12.3%) | 1.31 |
| Total Households | 1,030 (100.0%) | 3.29 |
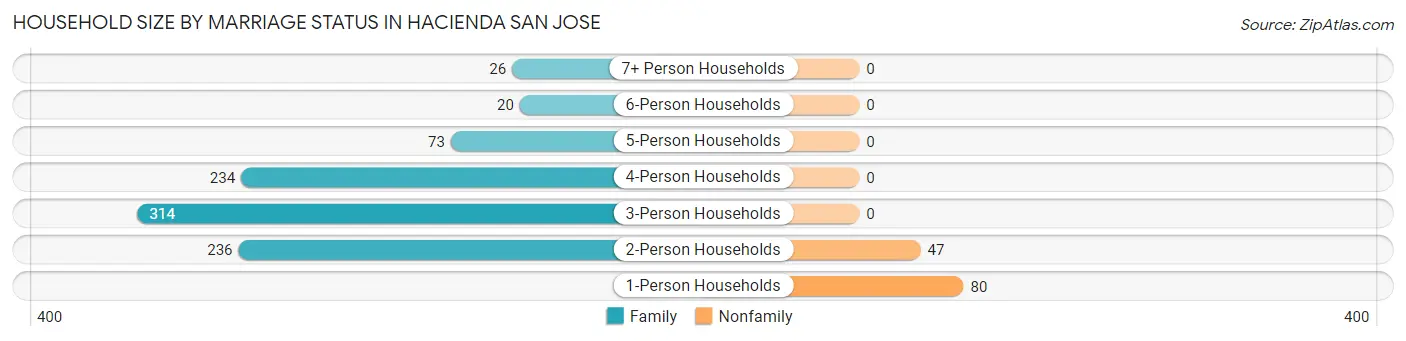
Household Size by Marriage Status in Hacienda San Jose
Out of a total of 1,030 households in Hacienda San Jose, 903 (87.7%) are family households, while 127 (12.3%) are nonfamily households. The most numerous type of family households are 3-person households, comprising 314, and the most common type of nonfamily households are 1-person households, comprising 80.
| Household Size | Family Households | Nonfamily Households |
| 1-Person Households | - | 80 (7.8%) |
| 2-Person Households | 236 (22.9%) | 47 (4.6%) |
| 3-Person Households | 314 (30.5%) | 0 (0.0%) |
| 4-Person Households | 234 (22.7%) | 0 (0.0%) |
| 5-Person Households | 73 (7.1%) | 0 (0.0%) |
| 6-Person Households | 20 (1.9%) | 0 (0.0%) |
| 7+ Person Households | 26 (2.5%) | 0 (0.0%) |
| Total | 903 (87.7%) | 127 (12.3%) |
Female Fertility in Hacienda San Jose
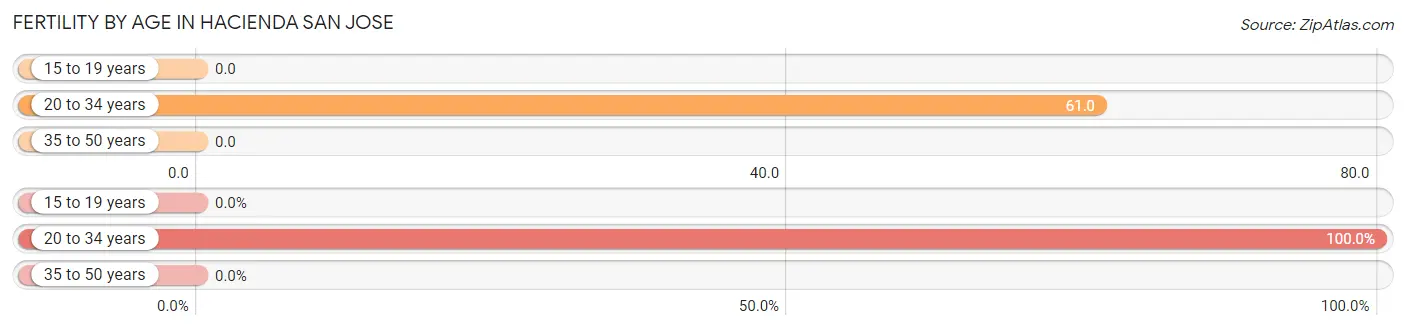
Fertility by Age in Hacienda San Jose
Average fertility rate in Hacienda San Jose is 17.0 births per 1,000 women. Women in the age bracket of 20 to 34 years have the highest fertility rate with 61.0 births per 1,000 women. Women in the age bracket of 20 to 34 years acount for 100.0% of all women with births.
| Age Bracket | Women with Births | Births / 1,000 Women |
| 15 to 19 years | 0 (0.0%) | 0.0 |
| 20 to 34 years | 17 (100.0%) | 61.0 |
| 35 to 50 years | 0 (0.0%) | 0.0 |
| Total | 17 (100.0%) | 17.0 |
Fertility by Age by Marriage Status in Hacienda San Jose
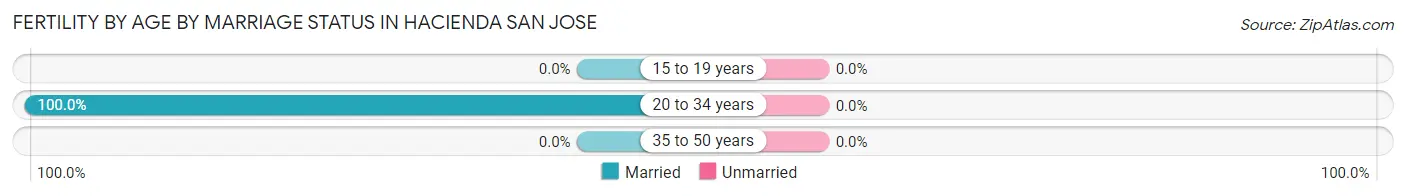
| Age Bracket | Married | Unmarried |
| 15 to 19 years | 0 (0.0%) | 0 (0.0%) |
| 20 to 34 years | 17 (100.0%) | 0 (0.0%) |
| 35 to 50 years | 0 (0.0%) | 0 (0.0%) |
| Total | 17 (100.0%) | 0 (0.0%) |
Fertility by Education in Hacienda San Jose
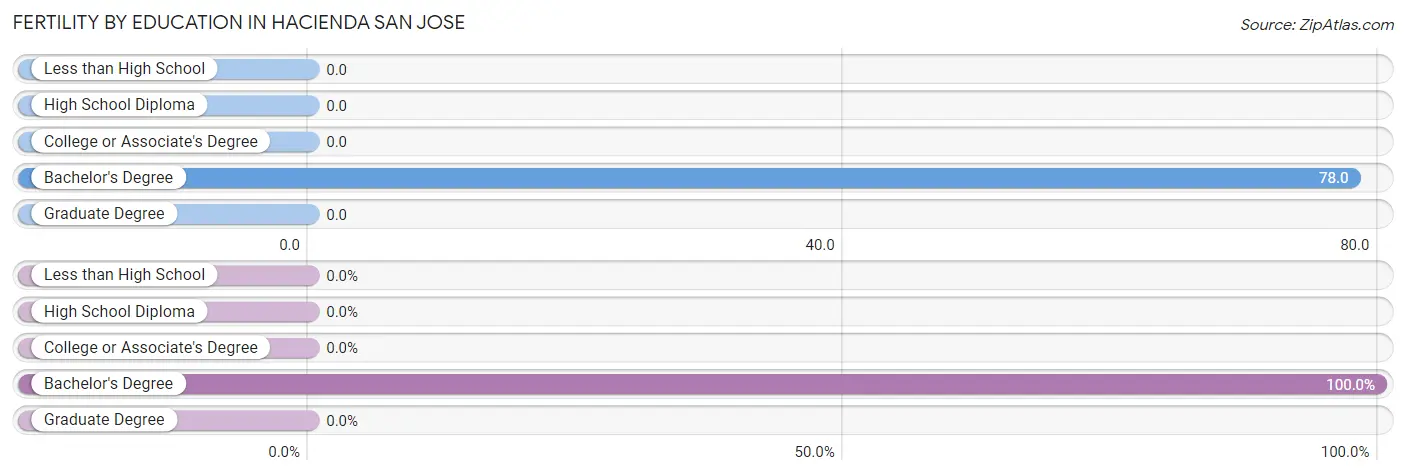
| Educational Attainment | Women with Births | Births / 1,000 Women |
| Less than High School | 0 (0.0%) | 0.0 |
| High School Diploma | 0 (0.0%) | 0.0 |
| College or Associate's Degree | 0 (0.0%) | 0.0 |
| Bachelor's Degree | 17 (100.0%) | 78.0 |
| Graduate Degree | 0 (0.0%) | 0.0 |
| Total | 17 (100.0%) | 17.0 |
Fertility by Education by Marriage Status in Hacienda San Jose
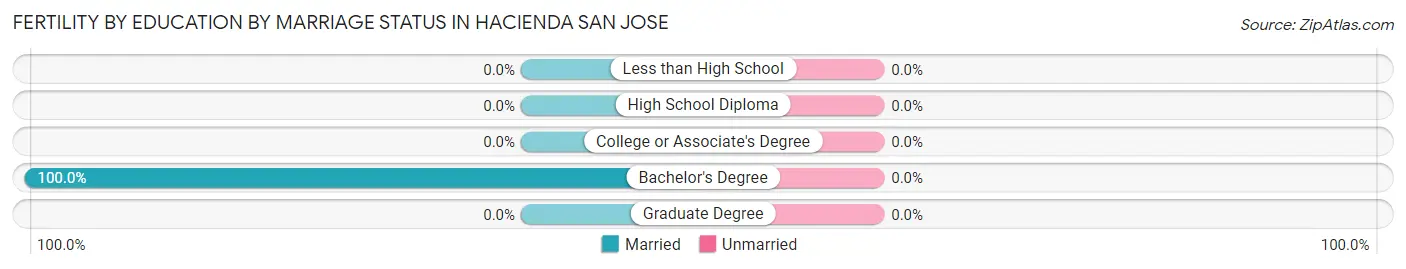
| Educational Attainment | Married | Unmarried |
| Less than High School | 0 (0.0%) | 0 (0.0%) |
| High School Diploma | 0 (0.0%) | 0 (0.0%) |
| College or Associate's Degree | 0 (0.0%) | 0 (0.0%) |
| Bachelor's Degree | 17 (100.0%) | 0 (0.0%) |
| Graduate Degree | 0 (0.0%) | 0 (0.0%) |
| Total | 17 (100.0%) | 0 (0.0%) |
Employment Characteristics in Hacienda San Jose
Employment by Class of Employer in Hacienda San Jose
Among the 1,765 employed individuals in Hacienda San Jose, private company employees (837 | 47.4%), self-employed (incorporated) (233 | 13.2%), and not-for-profit organizations (219 | 12.4%) make up the most common classes of employment.
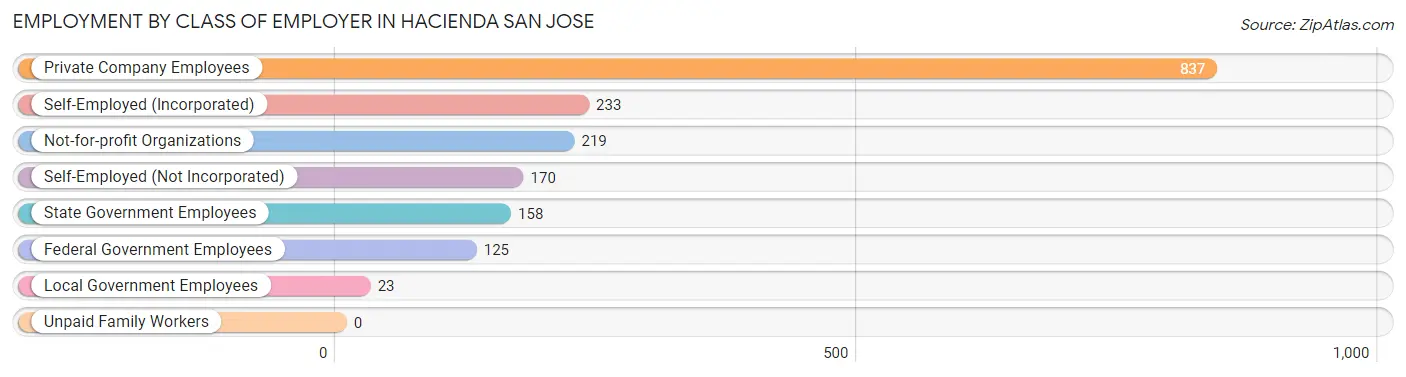
| Employer Class | # Employees | % Employees |
| Private Company Employees | 837 | 47.4% |
| Self-Employed (Incorporated) | 233 | 13.2% |
| Self-Employed (Not Incorporated) | 170 | 9.6% |
| Not-for-profit Organizations | 219 | 12.4% |
| Local Government Employees | 23 | 1.3% |
| State Government Employees | 158 | 8.9% |
| Federal Government Employees | 125 | 7.1% |
| Unpaid Family Workers | 0 | 0.0% |
| Total | 1,765 | 100.0% |
Employment Status by Age in Hacienda San Jose
According to the labor force statistics for Hacienda San Jose, out of the total population over 16 years of age (2,730), 67.6% or 1,845 individuals are in the labor force, with 4.3% or 79 of them unemployed. The age group with the highest labor force participation rate is 25 to 29 years, with 100.0% or 73 individuals in the labor force. Within the labor force, the 20 to 24 years age range has the highest percentage of unemployed individuals, with 58.9% or 33 of them being unemployed.
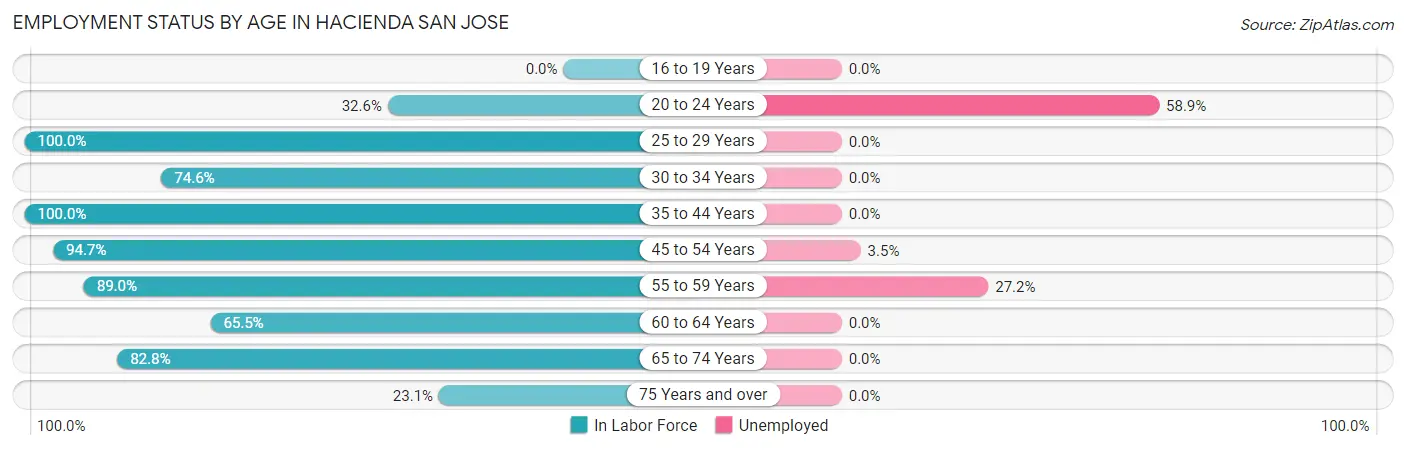
| Age Bracket | In Labor Force | Unemployed |
| 16 to 19 Years | 0 (0.0%) | 0 (0.0%) |
| 20 to 24 Years | 56 (32.6%) | 33 (58.9%) |
| 25 to 29 Years | 73 (100.0%) | 0 (0.0%) |
| 30 to 34 Years | 223 (74.6%) | 0 (0.0%) |
| 35 to 44 Years | 443 (100.0%) | 0 (0.0%) |
| 45 to 54 Years | 719 (94.7%) | 25 (3.5%) |
| 55 to 59 Years | 81 (89.0%) | 22 (27.2%) |
| 60 to 64 Years | 116 (65.5%) | 0 (0.0%) |
| 65 to 74 Years | 82 (82.8%) | 0 (0.0%) |
| 75 Years and over | 52 (23.1%) | 0 (0.0%) |
| Total | 1,845 (67.6%) | 79 (4.3%) |
Employment Status by Educational Attainment in Hacienda San Jose
According to labor force statistics for Hacienda San Jose, 89.8% of individuals (1,654) out of the total population between 25 and 64 years of age (1,842) are in the labor force, with 2.8% or 46 of them being unemployed. The group with the highest labor force participation rate are those with the educational attainment of college / associate degree, with 95.7% or 220 individuals in the labor force. Within the labor force, individuals with less than high school education have the highest percentage of unemployment, with 100.0% or 11 of them being unemployed.
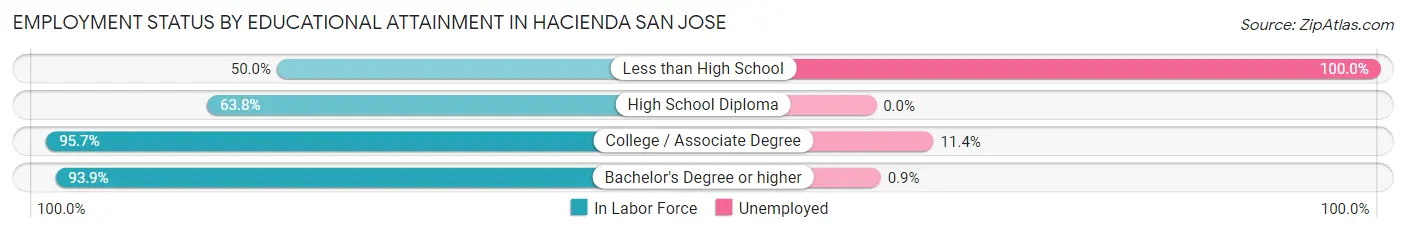
| Educational Attainment | In Labor Force | Unemployed |
| Less than High School | 11 (50.0%) | 22 (100.0%) |
| High School Diploma | 146 (63.8%) | 0 (0.0%) |
| College / Associate Degree | 220 (95.7%) | 26 (11.4%) |
| Bachelor's Degree or higher | 1,278 (93.9%) | 12 (0.9%) |
| Total | 1,654 (89.8%) | 52 (2.8%) |
Employment Occupations by Sex in Hacienda San Jose
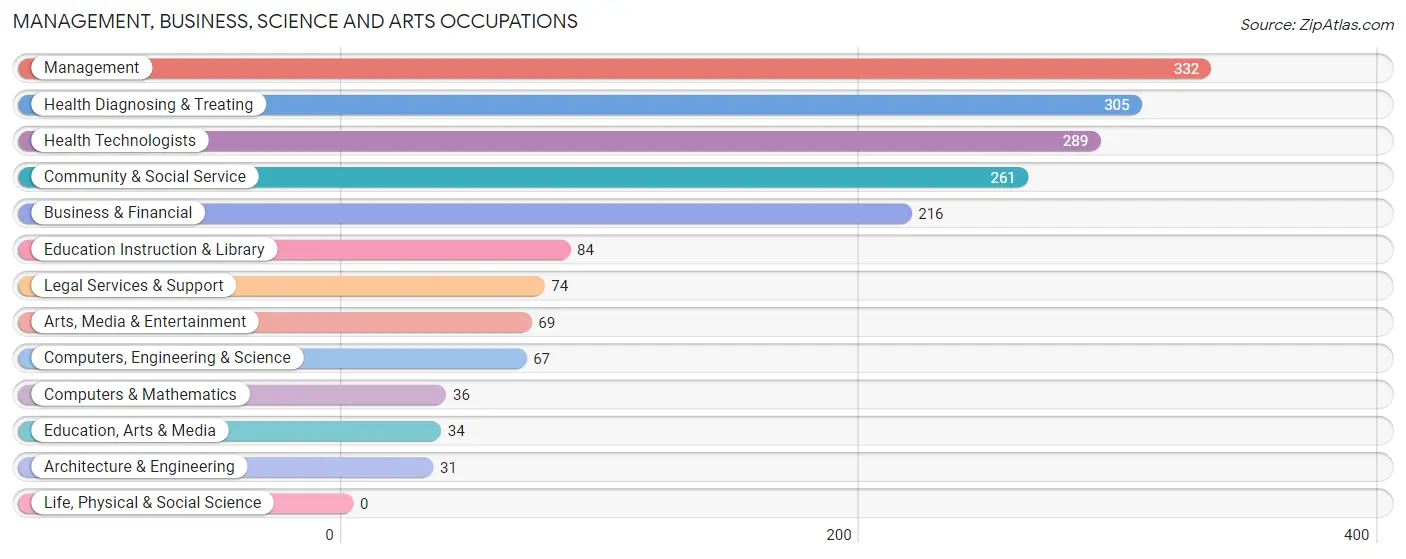
Management, Business, Science and Arts Occupations
The most common Management, Business, Science and Arts occupations in Hacienda San Jose are Management (332 | 18.8%), Health Diagnosing & Treating (305 | 17.3%), Health Technologists (289 | 16.4%), Community & Social Service (261 | 14.8%), and Business & Financial (216 | 12.2%).
Management, Business, Science and Arts Occupations by Sex
Within the Management, Business, Science and Arts occupations in Hacienda San Jose, the most male-oriented occupations are Computers, Engineering & Science (100.0%), Computers & Mathematics (100.0%), and Architecture & Engineering (100.0%), while the most female-oriented occupations are Business & Financial (72.7%), Education Instruction & Library (64.3%), and Health Technologists (63.7%).
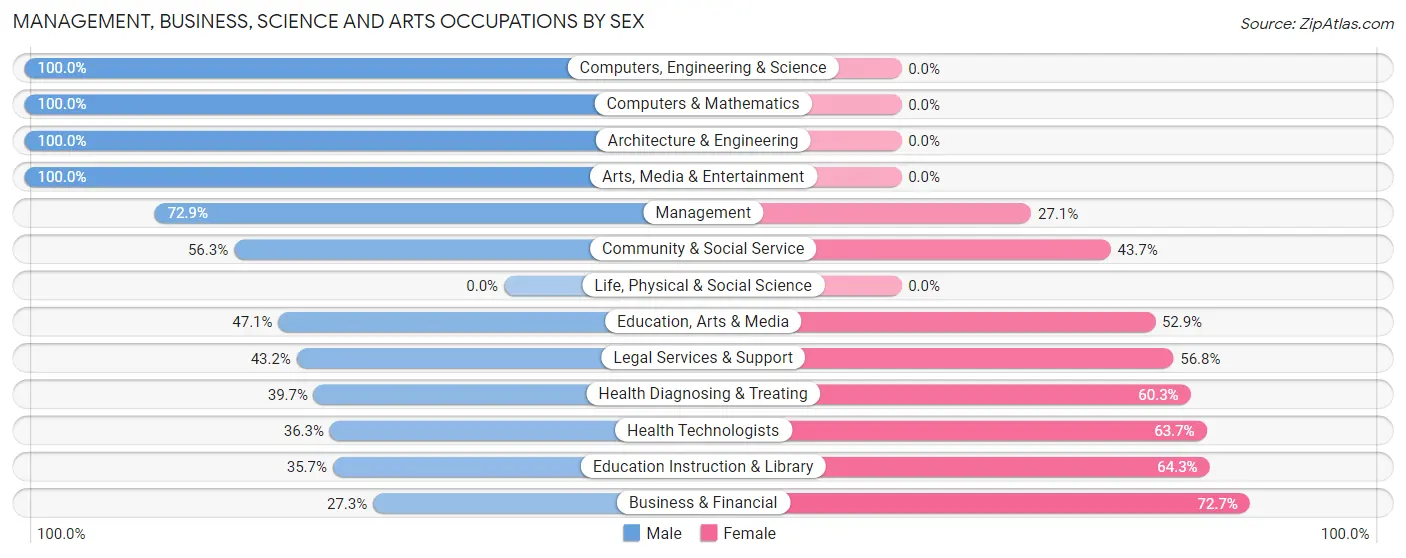
| Occupation | Male | Female |
| Management | 242 (72.9%) | 90 (27.1%) |
| Business & Financial | 59 (27.3%) | 157 (72.7%) |
| Computers, Engineering & Science | 67 (100.0%) | 0 (0.0%) |
| Computers & Mathematics | 36 (100.0%) | 0 (0.0%) |
| Architecture & Engineering | 31 (100.0%) | 0 (0.0%) |
| Life, Physical & Social Science | 0 (0.0%) | 0 (0.0%) |
| Community & Social Service | 147 (56.3%) | 114 (43.7%) |
| Education, Arts & Media | 16 (47.1%) | 18 (52.9%) |
| Legal Services & Support | 32 (43.2%) | 42 (56.8%) |
| Education Instruction & Library | 30 (35.7%) | 54 (64.3%) |
| Arts, Media & Entertainment | 69 (100.0%) | 0 (0.0%) |
| Health Diagnosing & Treating | 121 (39.7%) | 184 (60.3%) |
| Health Technologists | 105 (36.3%) | 184 (63.7%) |
| Total (Category) | 636 (53.8%) | 545 (46.2%) |
| Total (Overall) | 1,064 (60.3%) | 701 (39.7%) |
Services Occupations
The most common Services occupations in Hacienda San Jose are Cleaning & Maintenance (75 | 4.3%), Personal Care & Service (50 | 2.8%), and Healthcare Support (43 | 2.4%).
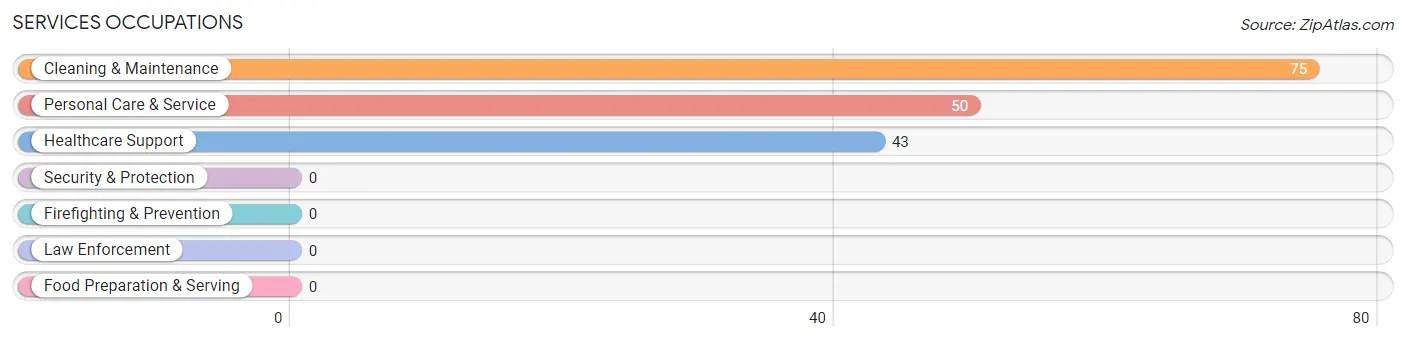
Services Occupations by Sex
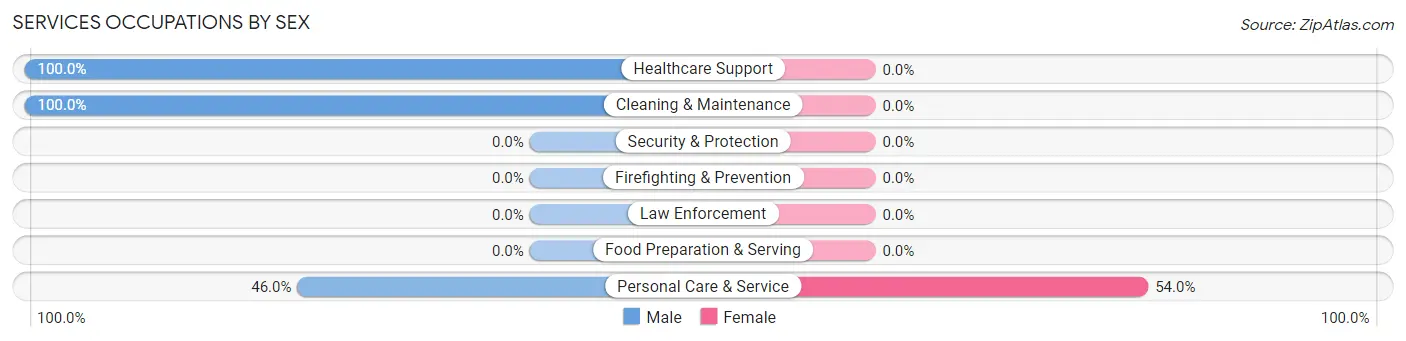
| Occupation | Male | Female |
| Healthcare Support | 43 (100.0%) | 0 (0.0%) |
| Security & Protection | 0 (0.0%) | 0 (0.0%) |
| Firefighting & Prevention | 0 (0.0%) | 0 (0.0%) |
| Law Enforcement | 0 (0.0%) | 0 (0.0%) |
| Food Preparation & Serving | 0 (0.0%) | 0 (0.0%) |
| Cleaning & Maintenance | 75 (100.0%) | 0 (0.0%) |
| Personal Care & Service | 23 (46.0%) | 27 (54.0%) |
| Total (Category) | 141 (83.9%) | 27 (16.1%) |
| Total (Overall) | 1,064 (60.3%) | 701 (39.7%) |
Sales and Office Occupations
The most common Sales and Office occupations in Hacienda San Jose are Office & Administration (201 | 11.4%), and Sales & Related (144 | 8.2%).
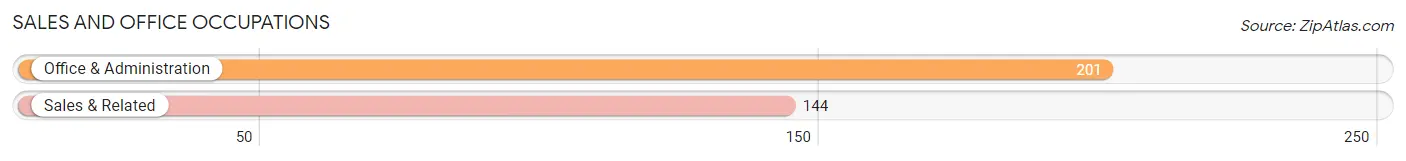
Sales and Office Occupations by Sex
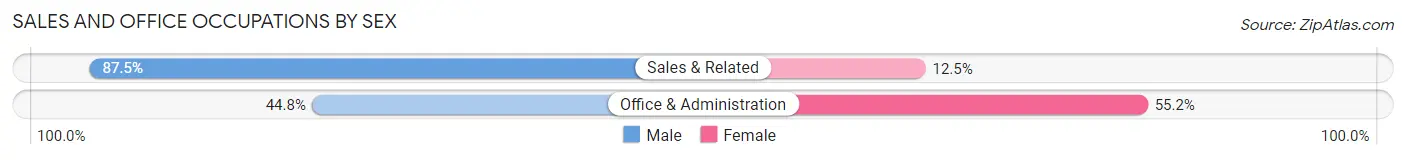
| Occupation | Male | Female |
| Sales & Related | 126 (87.5%) | 18 (12.5%) |
| Office & Administration | 90 (44.8%) | 111 (55.2%) |
| Total (Category) | 216 (62.6%) | 129 (37.4%) |
| Total (Overall) | 1,064 (60.3%) | 701 (39.7%) |
Natural Resources, Construction and Maintenance Occupations
The most common Natural Resources, Construction and Maintenance occupations in Hacienda San Jose are , and Installation, Maintenance & Repair (24 | 1.4%).
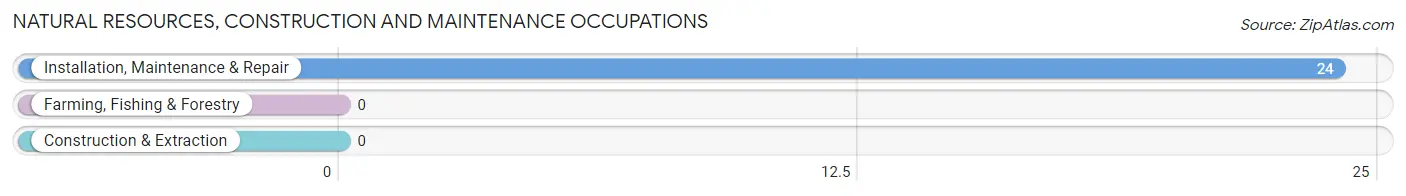
Natural Resources, Construction and Maintenance Occupations by Sex
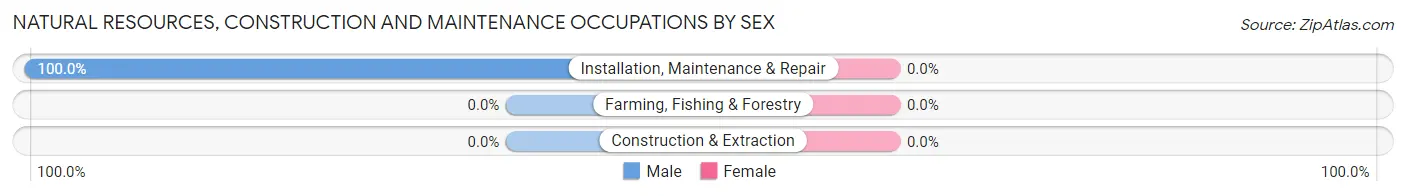
| Occupation | Male | Female |
| Farming, Fishing & Forestry | 0 (0.0%) | 0 (0.0%) |
| Construction & Extraction | 0 (0.0%) | 0 (0.0%) |
| Installation, Maintenance & Repair | 24 (100.0%) | 0 (0.0%) |
| Total (Category) | 24 (100.0%) | 0 (0.0%) |
| Total (Overall) | 1,064 (60.3%) | 701 (39.7%) |
Production, Transportation and Moving Occupations
The most common Production, Transportation and Moving occupations in Hacienda San Jose are , and Production (47 | 2.7%).
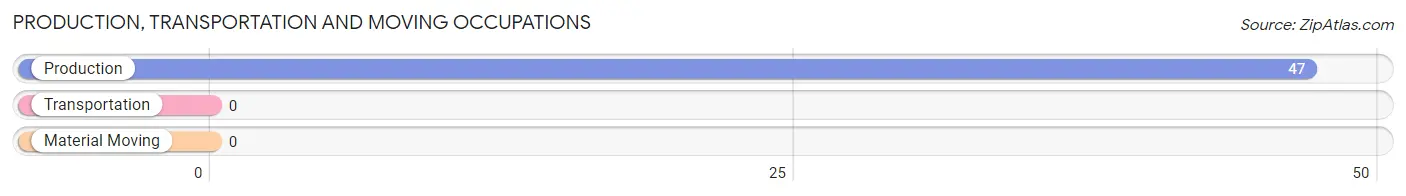
Production, Transportation and Moving Occupations by Sex
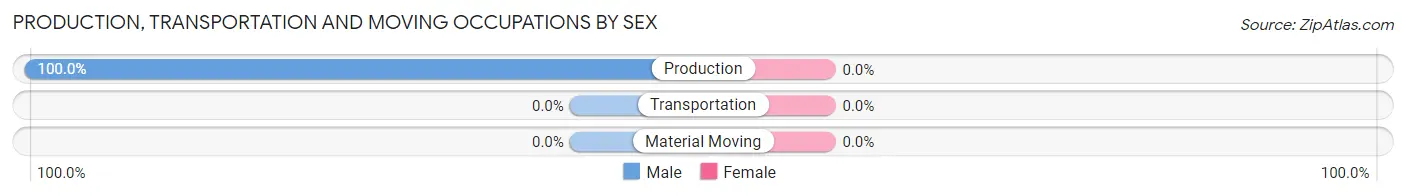
| Occupation | Male | Female |
| Production | 47 (100.0%) | 0 (0.0%) |
| Transportation | 0 (0.0%) | 0 (0.0%) |
| Material Moving | 0 (0.0%) | 0 (0.0%) |
| Total (Category) | 47 (100.0%) | 0 (0.0%) |
| Total (Overall) | 1,064 (60.3%) | 701 (39.7%) |
Employment Industries by Sex in Hacienda San Jose
Employment Industries in Hacienda San Jose
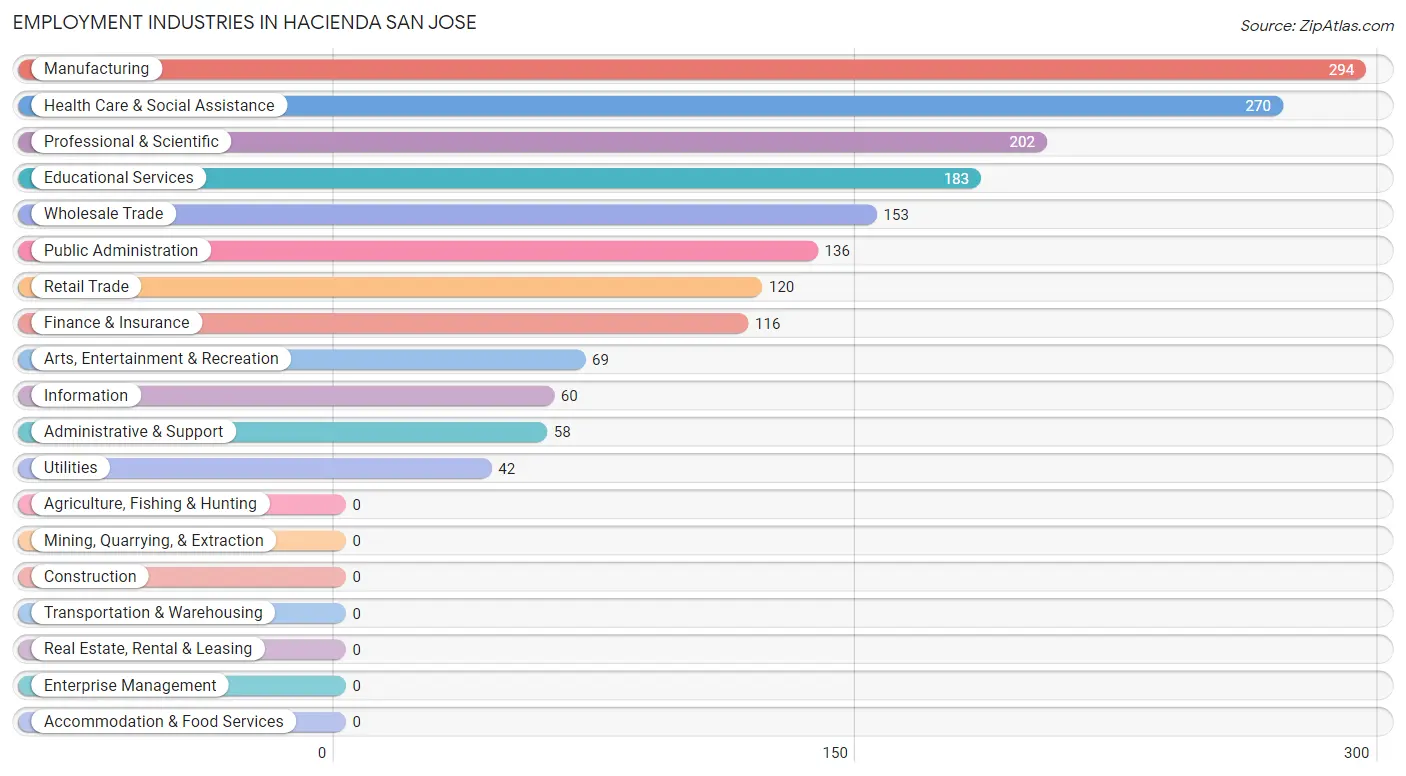
The major employment industries in Hacienda San Jose include Manufacturing (294 | 16.7%), Health Care & Social Assistance (270 | 15.3%), Professional & Scientific (202 | 11.4%), Educational Services (183 | 10.4%), and Wholesale Trade (153 | 8.7%).
Employment Industries by Sex in Hacienda San Jose
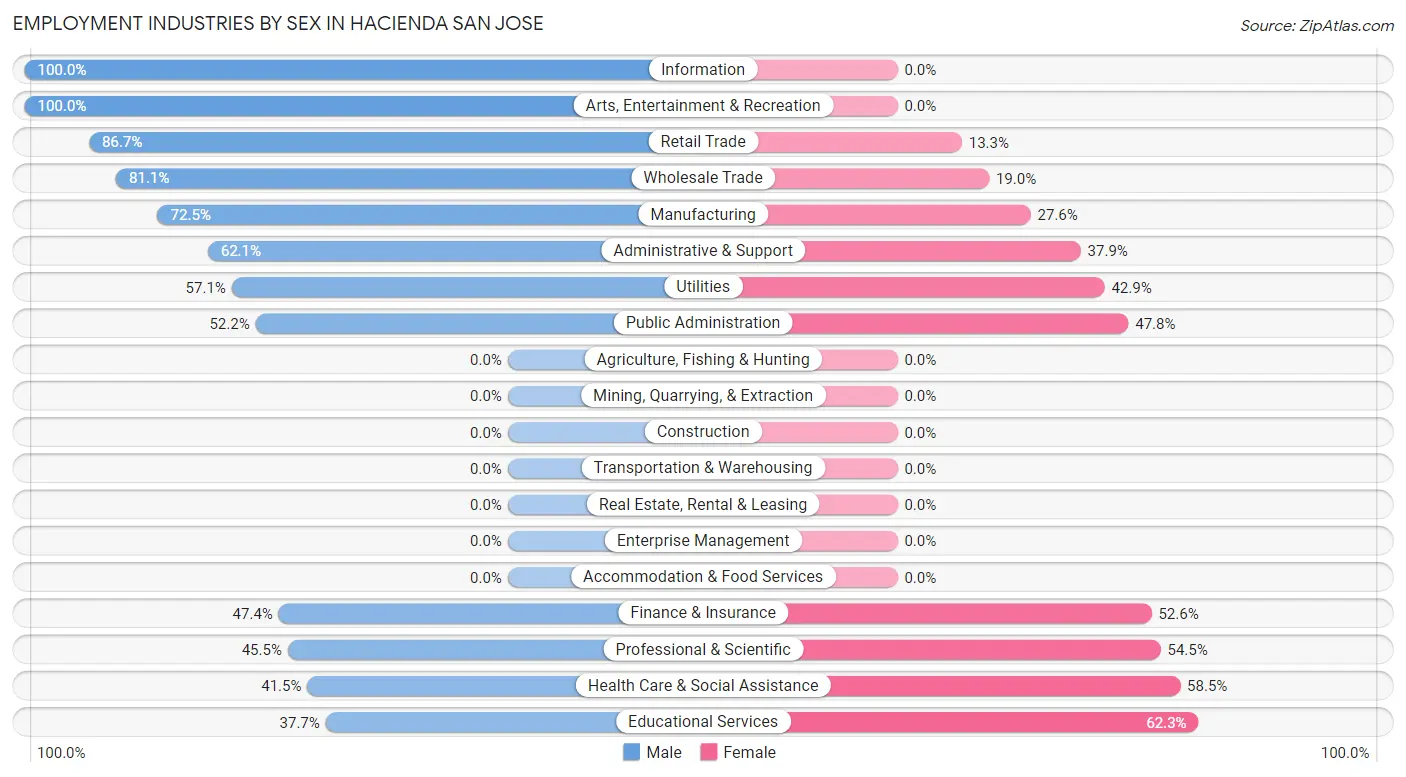
The Hacienda San Jose industries that see more men than women are Information (100.0%), Arts, Entertainment & Recreation (100.0%), and Retail Trade (86.7%), whereas the industries that tend to have a higher number of women are Educational Services (62.3%), Health Care & Social Assistance (58.5%), and Professional & Scientific (54.5%).
| Industry | Male | Female |
| Agriculture, Fishing & Hunting | 0 (0.0%) | 0 (0.0%) |
| Mining, Quarrying, & Extraction | 0 (0.0%) | 0 (0.0%) |
| Construction | 0 (0.0%) | 0 (0.0%) |
| Manufacturing | 213 (72.5%) | 81 (27.6%) |
| Wholesale Trade | 124 (81.0%) | 29 (19.0%) |
| Retail Trade | 104 (86.7%) | 16 (13.3%) |
| Transportation & Warehousing | 0 (0.0%) | 0 (0.0%) |
| Utilities | 24 (57.1%) | 18 (42.9%) |
| Information | 60 (100.0%) | 0 (0.0%) |
| Finance & Insurance | 55 (47.4%) | 61 (52.6%) |
| Real Estate, Rental & Leasing | 0 (0.0%) | 0 (0.0%) |
| Professional & Scientific | 92 (45.5%) | 110 (54.5%) |
| Enterprise Management | 0 (0.0%) | 0 (0.0%) |
| Administrative & Support | 36 (62.1%) | 22 (37.9%) |
| Educational Services | 69 (37.7%) | 114 (62.3%) |
| Health Care & Social Assistance | 112 (41.5%) | 158 (58.5%) |
| Arts, Entertainment & Recreation | 69 (100.0%) | 0 (0.0%) |
| Accommodation & Food Services | 0 (0.0%) | 0 (0.0%) |
| Public Administration | 71 (52.2%) | 65 (47.8%) |
| Total | 1,064 (60.3%) | 701 (39.7%) |
Education in Hacienda San Jose
School Enrollment in Hacienda San Jose
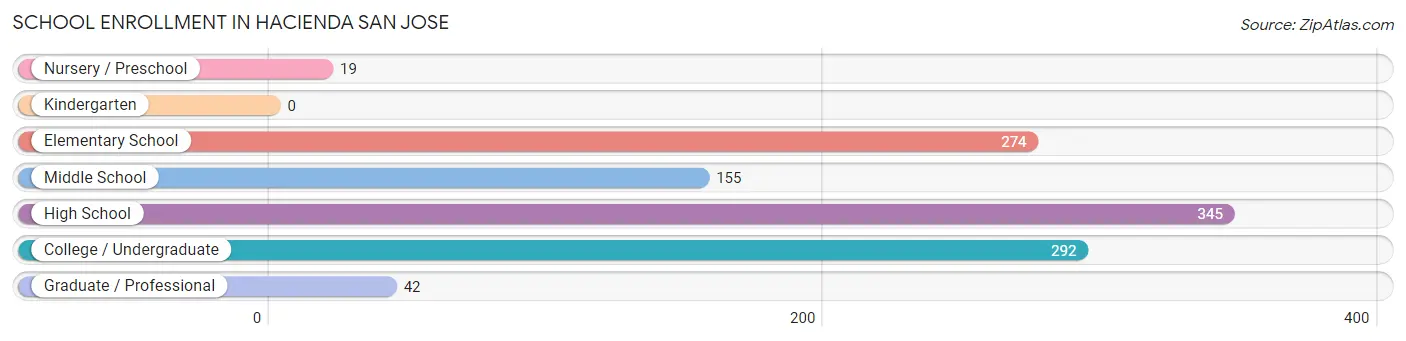
The most common levels of schooling among the 1,127 students in Hacienda San Jose are high school (345 | 30.6%), college / undergraduate (292 | 25.9%), and elementary school (274 | 24.3%).
| School Level | # Students | % Students |
| Nursery / Preschool | 19 | 1.7% |
| Kindergarten | 0 | 0.0% |
| Elementary School | 274 | 24.3% |
| Middle School | 155 | 13.8% |
| High School | 345 | 30.6% |
| College / Undergraduate | 292 | 25.9% |
| Graduate / Professional | 42 | 3.7% |
| Total | 1,127 | 100.0% |
School Enrollment by Age by Funding Source in Hacienda San Jose
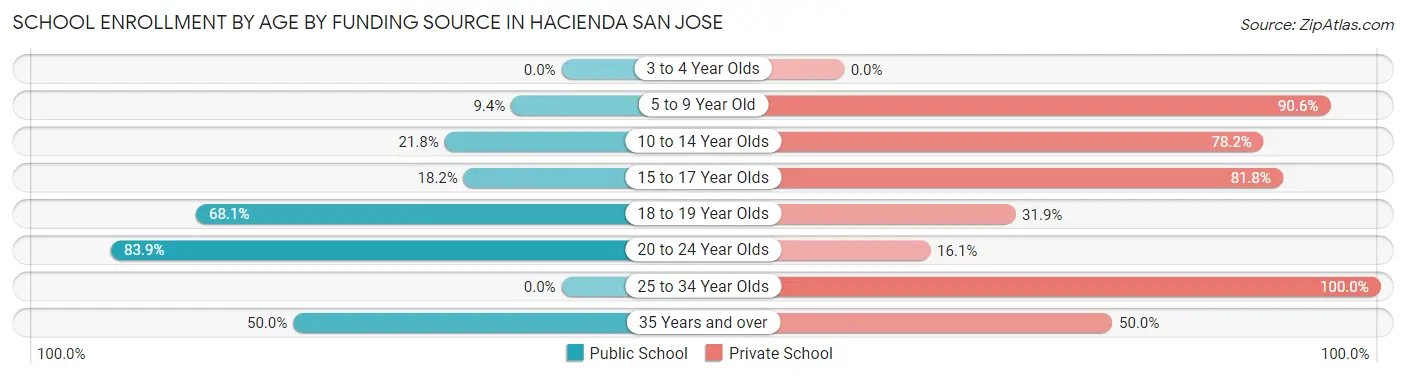
Out of a total of 1,127 students who are enrolled in schools in Hacienda San Jose, 796 (70.6%) attend a private institution, while the remaining 331 (29.4%) are enrolled in public schools. The age group of 25 to 34 year olds has the highest likelihood of being enrolled in private schools, with 43 (100.0% in the age bracket) enrolled. Conversely, the age group of 20 to 24 year olds has the lowest likelihood of being enrolled in a private school, with 125 (83.9% in the age bracket) attending a public institution.
| Age Bracket | Public School | Private School |
| 3 to 4 Year Olds | 0 (0.0%) | 0 (0.0%) |
| 5 to 9 Year Old | 23 (9.4%) | 222 (90.6%) |
| 10 to 14 Year Olds | 49 (21.8%) | 176 (78.2%) |
| 15 to 17 Year Olds | 64 (18.2%) | 287 (81.8%) |
| 18 to 19 Year Olds | 49 (68.1%) | 23 (31.9%) |
| 20 to 24 Year Olds | 125 (83.9%) | 24 (16.1%) |
| 25 to 34 Year Olds | 0 (0.0%) | 43 (100.0%) |
| 35 Years and over | 21 (50.0%) | 21 (50.0%) |
| Total | 331 (29.4%) | 796 (70.6%) |
Educational Attainment by Field of Study in Hacienda San Jose
Business (568 | 36.5%), bio, nature & agricultural (264 | 16.9%), science & technology (227 | 14.6%), engineering (156 | 10.0%), and computers & mathematics (116 | 7.4%) are the most common fields of study among 1,558 individuals in Hacienda San Jose who have obtained a bachelor's degree or higher.
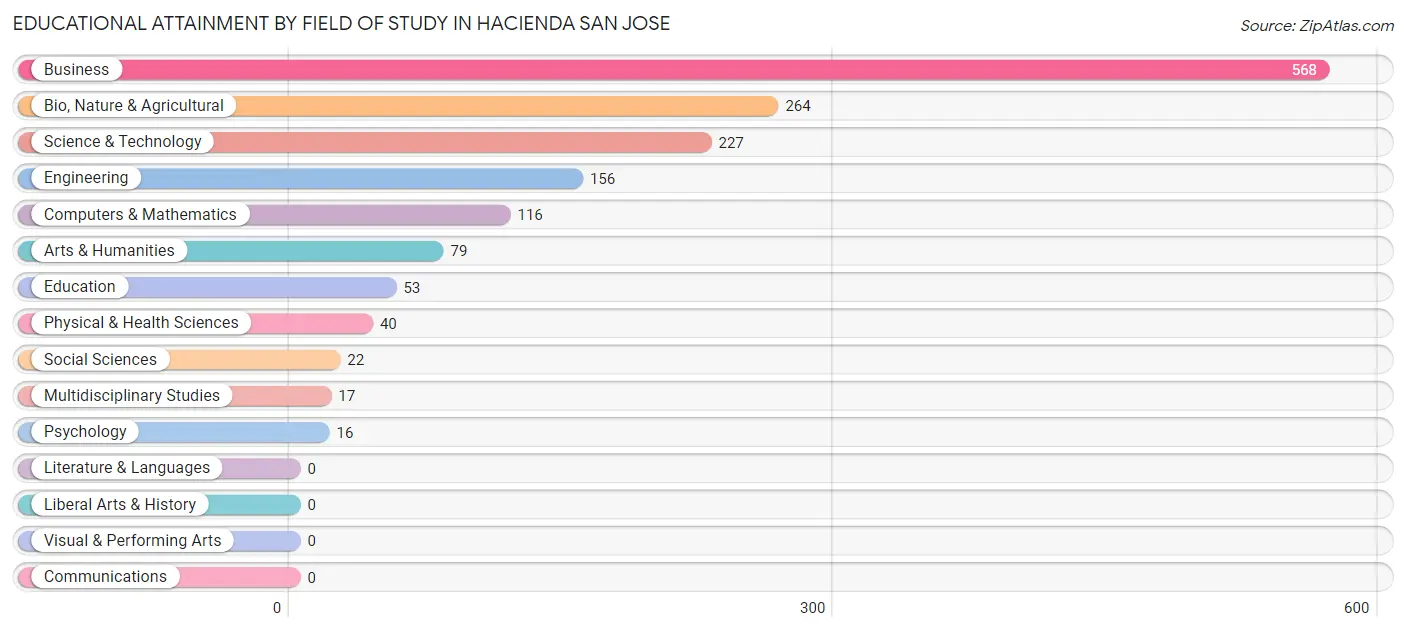
| Field of Study | # Graduates | % Graduates |
| Computers & Mathematics | 116 | 7.4% |
| Bio, Nature & Agricultural | 264 | 16.9% |
| Physical & Health Sciences | 40 | 2.6% |
| Psychology | 16 | 1.0% |
| Social Sciences | 22 | 1.4% |
| Engineering | 156 | 10.0% |
| Multidisciplinary Studies | 17 | 1.1% |
| Science & Technology | 227 | 14.6% |
| Business | 568 | 36.5% |
| Education | 53 | 3.4% |
| Literature & Languages | 0 | 0.0% |
| Liberal Arts & History | 0 | 0.0% |
| Visual & Performing Arts | 0 | 0.0% |
| Communications | 0 | 0.0% |
| Arts & Humanities | 79 | 5.1% |
| Total | 1,558 | 100.0% |
Transportation & Commute in Hacienda San Jose
Vehicle Availability by Sex in Hacienda San Jose
The most prevalent vehicle ownership categories in Hacienda San Jose are males with 2 vehicles (412, accounting for 38.7%) and females with 2 vehicles (258, making up 58.8%).
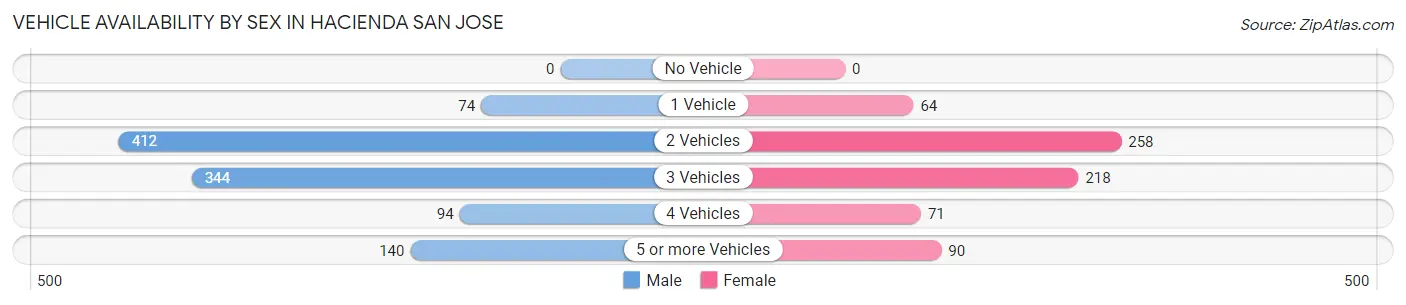
| Vehicles Available | Male | Female |
| No Vehicle | 0 (0.0%) | 0 (0.0%) |
| 1 Vehicle | 74 (7.0%) | 64 (9.1%) |
| 2 Vehicles | 412 (38.7%) | 258 (36.8%) |
| 3 Vehicles | 344 (32.3%) | 218 (31.1%) |
| 4 Vehicles | 94 (8.8%) | 71 (10.1%) |
| 5 or more Vehicles | 140 (13.2%) | 90 (12.8%) |
| Total | 1,064 (100.0%) | 701 (100.0%) |
Commute Time in Hacienda San Jose
The most frequently occuring commute durations in Hacienda San Jose are 45 to 59 minutes (433 commuters, 28.0%), 20 to 24 minutes (205 commuters, 13.2%), and 40 to 44 minutes (193 commuters, 12.5%).
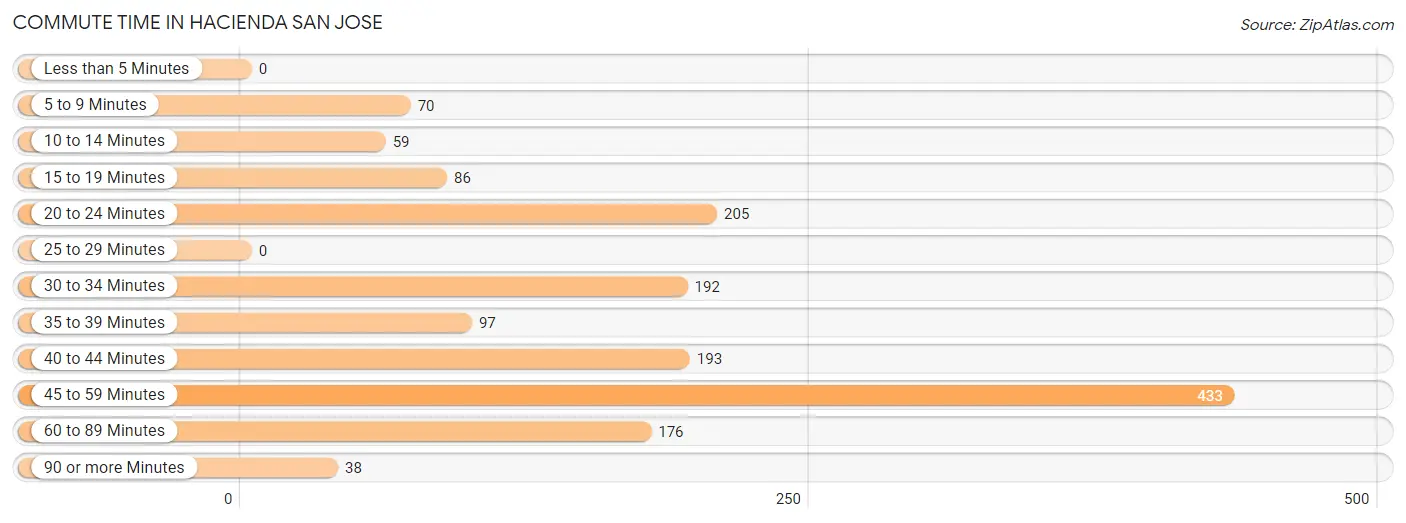
| Commute Time | # Commuters | % Commuters |
| Less than 5 Minutes | 0 | 0.0% |
| 5 to 9 Minutes | 70 | 4.5% |
| 10 to 14 Minutes | 59 | 3.8% |
| 15 to 19 Minutes | 86 | 5.6% |
| 20 to 24 Minutes | 205 | 13.2% |
| 25 to 29 Minutes | 0 | 0.0% |
| 30 to 34 Minutes | 192 | 12.4% |
| 35 to 39 Minutes | 97 | 6.3% |
| 40 to 44 Minutes | 193 | 12.5% |
| 45 to 59 Minutes | 433 | 28.0% |
| 60 to 89 Minutes | 176 | 11.4% |
| 90 or more Minutes | 38 | 2.5% |
Commute Time by Sex in Hacienda San Jose
The most common commute times in Hacienda San Jose are 45 to 59 minutes (336 commuters, 34.6%) for males and 40 to 44 minutes (102 commuters, 17.6%) for females.
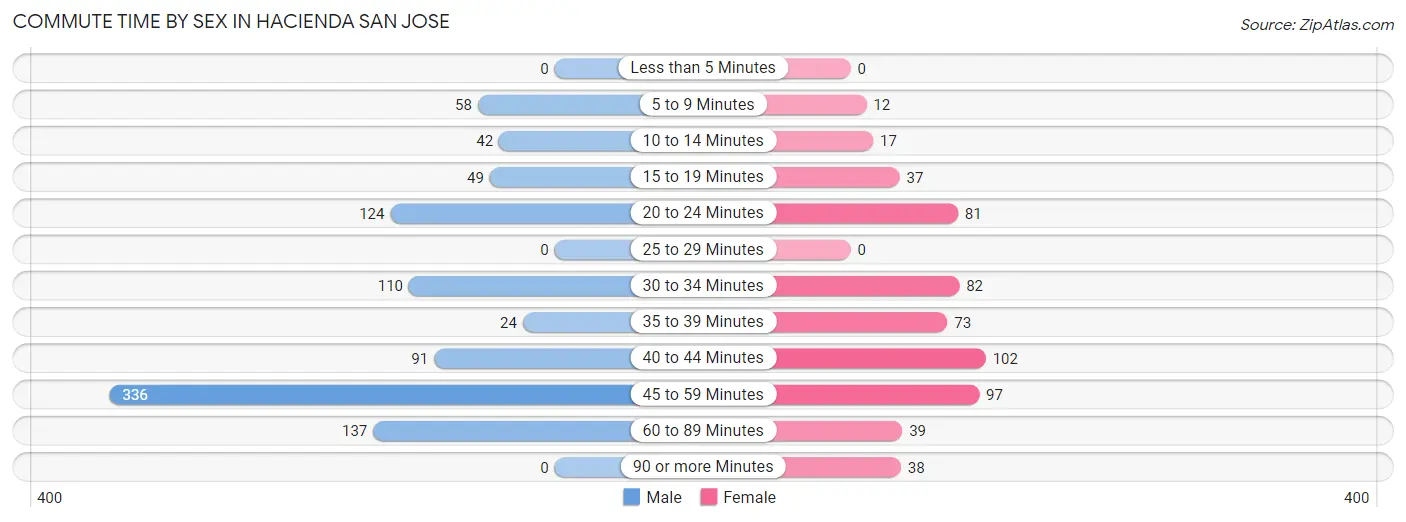
| Commute Time | Male | Female |
| Less than 5 Minutes | 0 (0.0%) | 0 (0.0%) |
| 5 to 9 Minutes | 58 (6.0%) | 12 (2.1%) |
| 10 to 14 Minutes | 42 (4.3%) | 17 (2.9%) |
| 15 to 19 Minutes | 49 (5.1%) | 37 (6.4%) |
| 20 to 24 Minutes | 124 (12.8%) | 81 (14.0%) |
| 25 to 29 Minutes | 0 (0.0%) | 0 (0.0%) |
| 30 to 34 Minutes | 110 (11.3%) | 82 (14.2%) |
| 35 to 39 Minutes | 24 (2.5%) | 73 (12.6%) |
| 40 to 44 Minutes | 91 (9.4%) | 102 (17.6%) |
| 45 to 59 Minutes | 336 (34.6%) | 97 (16.8%) |
| 60 to 89 Minutes | 137 (14.1%) | 39 (6.8%) |
| 90 or more Minutes | 0 (0.0%) | 38 (6.6%) |
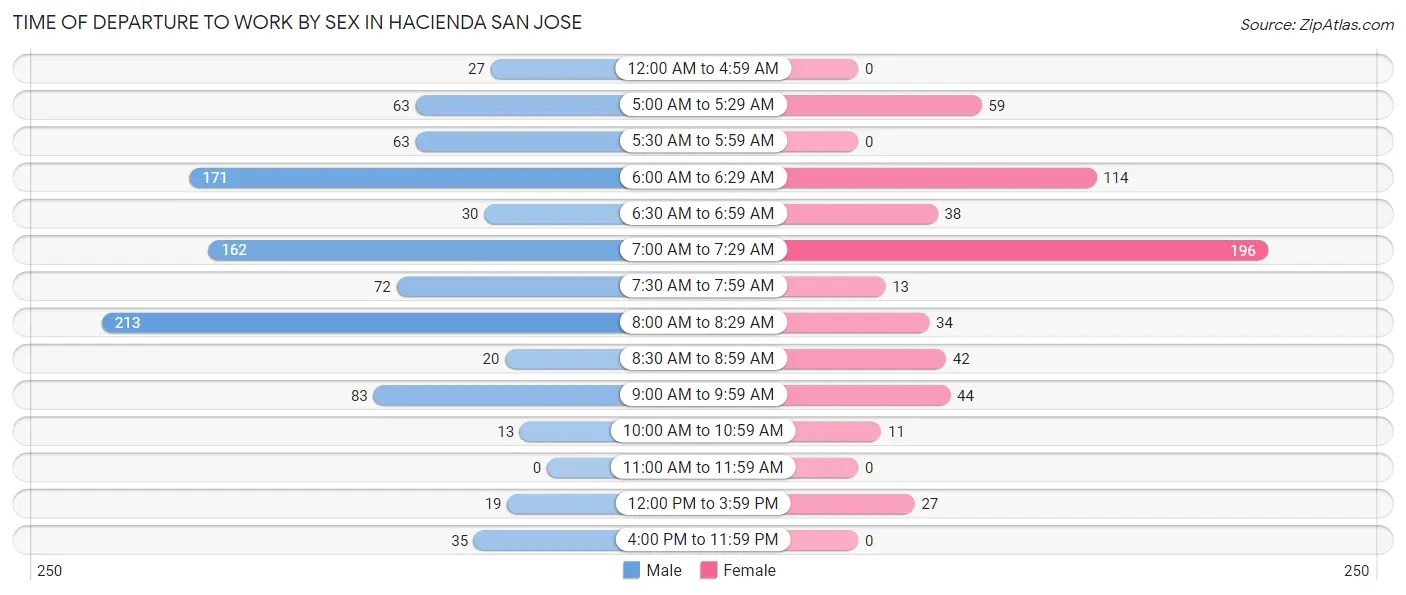
Time of Departure to Work by Sex in Hacienda San Jose
The most frequent times of departure to work in Hacienda San Jose are 8:00 AM to 8:29 AM (213, 21.9%) for males and 7:00 AM to 7:29 AM (196, 33.9%) for females.
| Time of Departure | Male | Female |
| 12:00 AM to 4:59 AM | 27 (2.8%) | 0 (0.0%) |
| 5:00 AM to 5:29 AM | 63 (6.5%) | 59 (10.2%) |
| 5:30 AM to 5:59 AM | 63 (6.5%) | 0 (0.0%) |
| 6:00 AM to 6:29 AM | 171 (17.6%) | 114 (19.7%) |
| 6:30 AM to 6:59 AM | 30 (3.1%) | 38 (6.6%) |
| 7:00 AM to 7:29 AM | 162 (16.7%) | 196 (33.9%) |
| 7:30 AM to 7:59 AM | 72 (7.4%) | 13 (2.2%) |
| 8:00 AM to 8:29 AM | 213 (21.9%) | 34 (5.9%) |
| 8:30 AM to 8:59 AM | 20 (2.1%) | 42 (7.3%) |
| 9:00 AM to 9:59 AM | 83 (8.6%) | 44 (7.6%) |
| 10:00 AM to 10:59 AM | 13 (1.3%) | 11 (1.9%) |
| 11:00 AM to 11:59 AM | 0 (0.0%) | 0 (0.0%) |
| 12:00 PM to 3:59 PM | 19 (2.0%) | 27 (4.7%) |
| 4:00 PM to 11:59 PM | 35 (3.6%) | 0 (0.0%) |
| Total | 971 (100.0%) | 578 (100.0%) |
Housing Occupancy in Hacienda San Jose
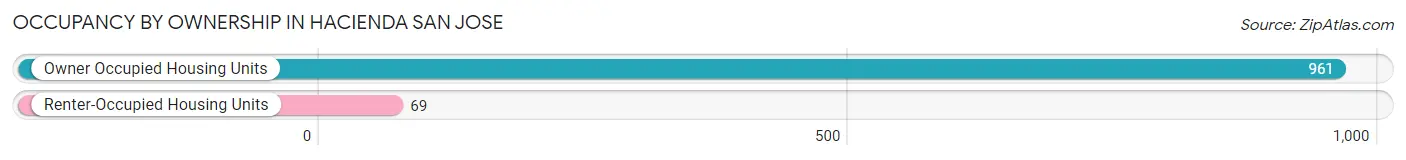
Occupancy by Ownership in Hacienda San Jose
Of the total 1,030 dwellings in Hacienda San Jose, owner-occupied units account for 961 (93.3%), while renter-occupied units make up 69 (6.7%).
| Occupancy | # Housing Units | % Housing Units |
| Owner Occupied Housing Units | 961 | 93.3% |
| Renter-Occupied Housing Units | 69 | 6.7% |
| Total Occupied Housing Units | 1,030 | 100.0% |
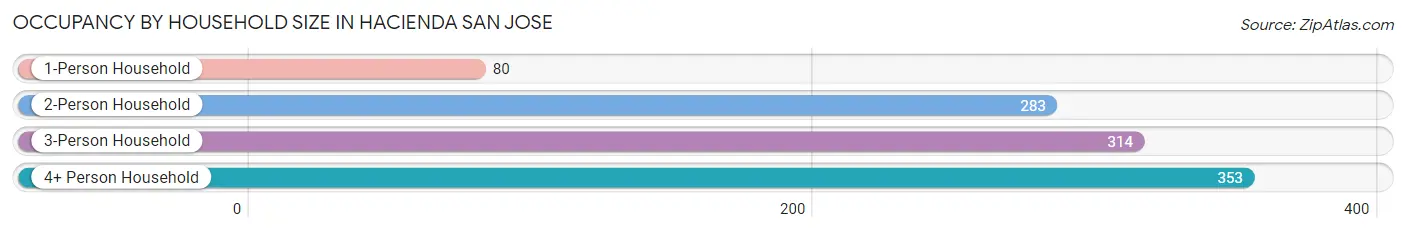
Occupancy by Household Size in Hacienda San Jose
| Household Size | # Housing Units | % Housing Units |
| 1-Person Household | 80 | 7.8% |
| 2-Person Household | 283 | 27.5% |
| 3-Person Household | 314 | 30.5% |
| 4+ Person Household | 353 | 34.3% |
| Total Housing Units | 1,030 | 100.0% |
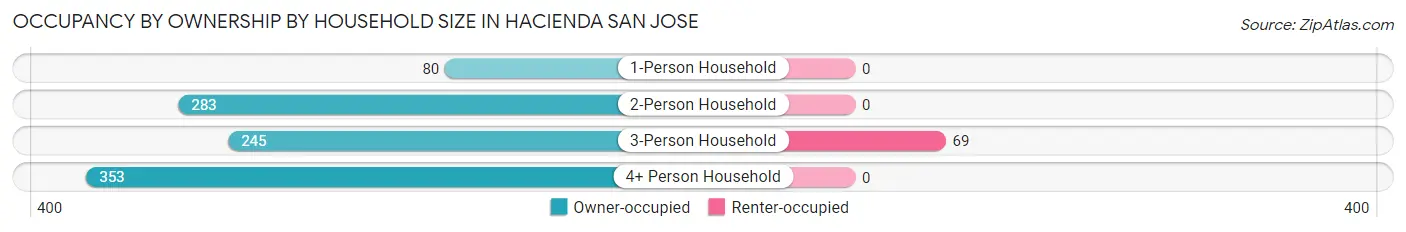
Occupancy by Ownership by Household Size in Hacienda San Jose
| Household Size | Owner-occupied | Renter-occupied |
| 1-Person Household | 80 (100.0%) | 0 (0.0%) |
| 2-Person Household | 283 (100.0%) | 0 (0.0%) |
| 3-Person Household | 245 (78.0%) | 69 (22.0%) |
| 4+ Person Household | 353 (100.0%) | 0 (0.0%) |
| Total Housing Units | 961 (93.3%) | 69 (6.7%) |
Occupancy by Educational Attainment in Hacienda San Jose
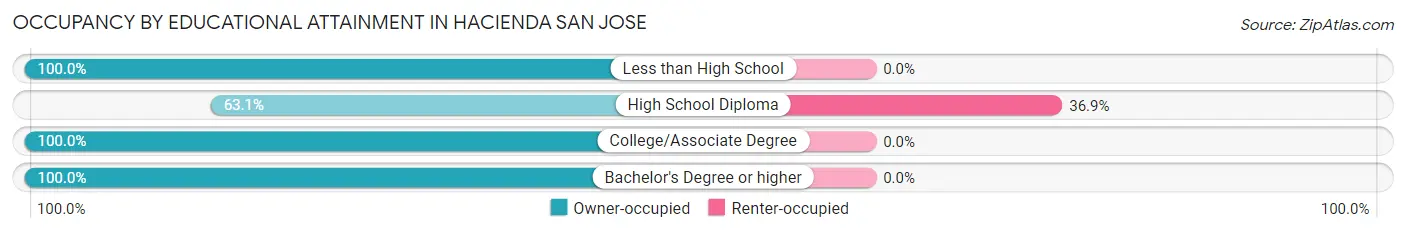
| Household Size | Owner-occupied | Renter-occupied |
| Less than High School | 11 (100.0%) | 0 (0.0%) |
| High School Diploma | 118 (63.1%) | 69 (36.9%) |
| College/Associate Degree | 75 (100.0%) | 0 (0.0%) |
| Bachelor's Degree or higher | 757 (100.0%) | 0 (0.0%) |
Occupancy by Age of Householder in Hacienda San Jose
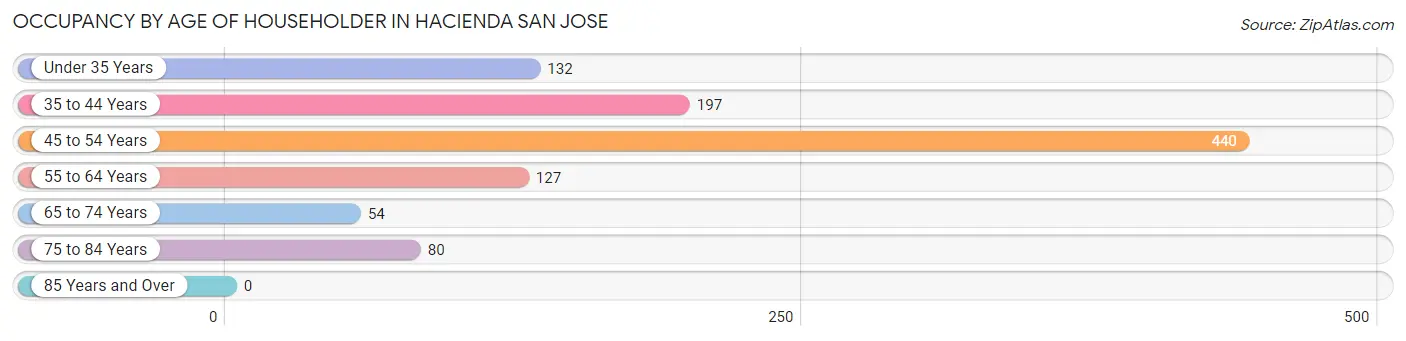
| Age Bracket | # Households | % Households |
| Under 35 Years | 132 | 12.8% |
| 35 to 44 Years | 197 | 19.1% |
| 45 to 54 Years | 440 | 42.7% |
| 55 to 64 Years | 127 | 12.3% |
| 65 to 74 Years | 54 | 5.2% |
| 75 to 84 Years | 80 | 7.8% |
| 85 Years and Over | 0 | 0.0% |
| Total | 1,030 | 100.0% |
Housing Finances in Hacienda San Jose
Median Income by Occupancy in Hacienda San Jose
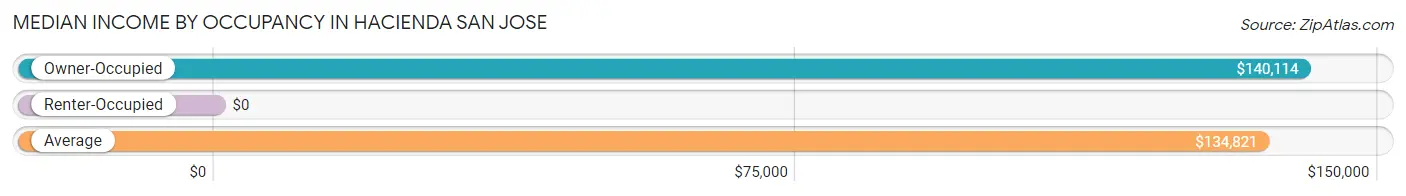
| Occupancy Type | # Households | Median Income |
| Owner-Occupied | 961 (93.3%) | $140,114 |
| Renter-Occupied | 69 (6.7%) | $0 |
| Average | 1,030 (100.0%) | $134,821 |
Occupancy by Householder Income Bracket in Hacienda San Jose
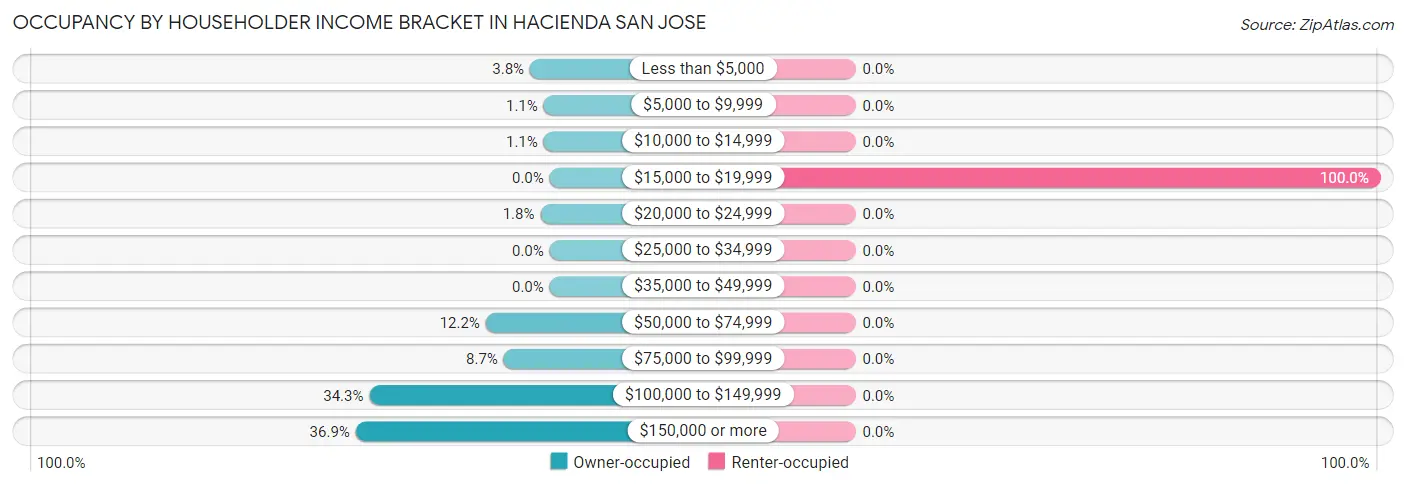
| Income Bracket | Owner-occupied | Renter-occupied |
| Less than $5,000 | 36 (3.7%) | 0 (0.0%) |
| $5,000 to $9,999 | 11 (1.1%) | 0 (0.0%) |
| $10,000 to $14,999 | 11 (1.1%) | 0 (0.0%) |
| $15,000 to $19,999 | 0 (0.0%) | 69 (100.0%) |
| $20,000 to $24,999 | 17 (1.8%) | 0 (0.0%) |
| $25,000 to $34,999 | 0 (0.0%) | 0 (0.0%) |
| $35,000 to $49,999 | 0 (0.0%) | 0 (0.0%) |
| $50,000 to $74,999 | 117 (12.2%) | 0 (0.0%) |
| $75,000 to $99,999 | 84 (8.7%) | 0 (0.0%) |
| $100,000 to $149,999 | 330 (34.3%) | 0 (0.0%) |
| $150,000 or more | 355 (36.9%) | 0 (0.0%) |
| Total | 961 (100.0%) | 69 (100.0%) |
Monthly Housing Cost Tiers in Hacienda San Jose
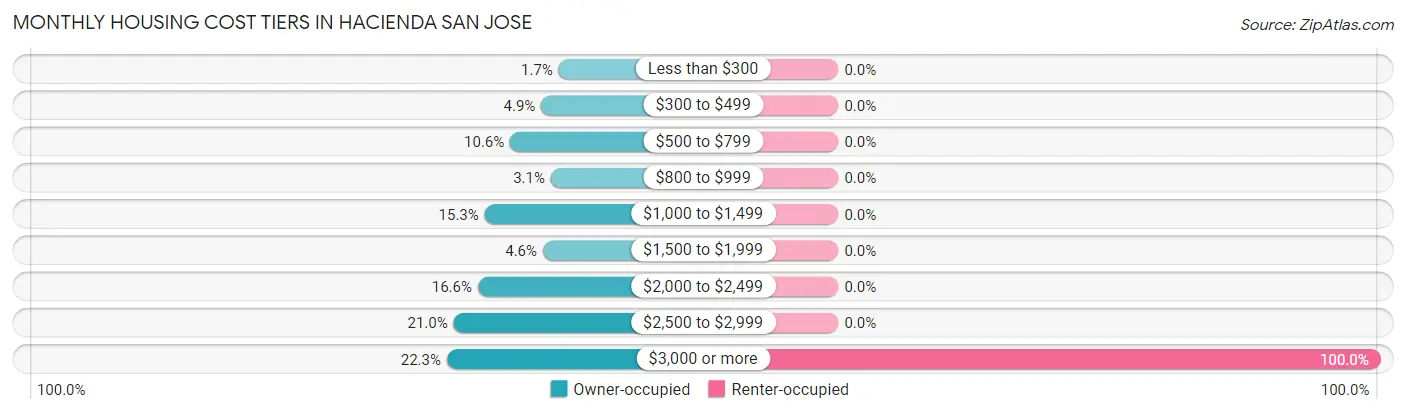
| Monthly Cost | Owner-occupied | Renter-occupied |
| Less than $300 | 16 (1.7%) | 0 (0.0%) |
| $300 to $499 | 47 (4.9%) | 0 (0.0%) |
| $500 to $799 | 102 (10.6%) | 0 (0.0%) |
| $800 to $999 | 30 (3.1%) | 0 (0.0%) |
| $1,000 to $1,499 | 147 (15.3%) | 0 (0.0%) |
| $1,500 to $1,999 | 44 (4.6%) | 0 (0.0%) |
| $2,000 to $2,499 | 159 (16.6%) | 0 (0.0%) |
| $2,500 to $2,999 | 202 (21.0%) | 0 (0.0%) |
| $3,000 or more | 214 (22.3%) | 69 (100.0%) |
| Total | 961 (100.0%) | 69 (100.0%) |
Physical Housing Characteristics in Hacienda San Jose
Housing Structures in Hacienda San Jose
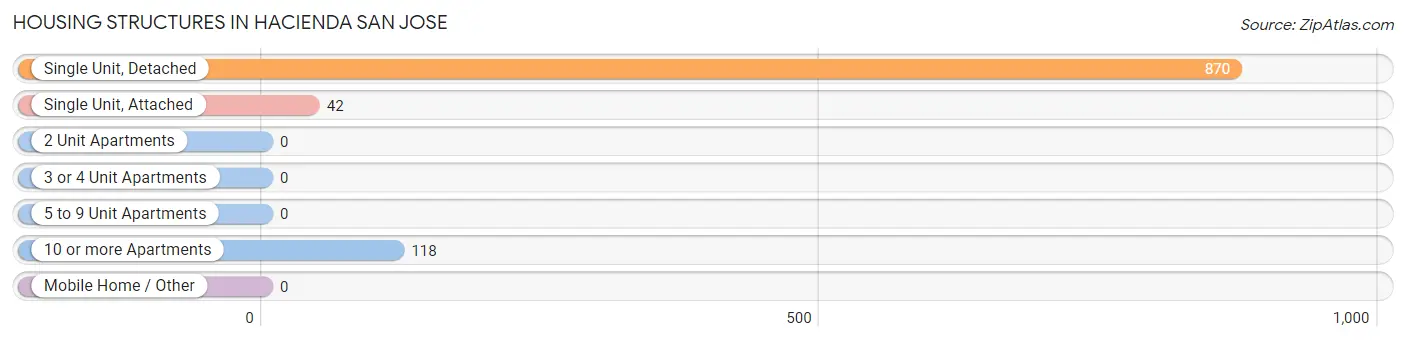
| Structure Type | # Housing Units | % Housing Units |
| Single Unit, Detached | 870 | 84.5% |
| Single Unit, Attached | 42 | 4.1% |
| 2 Unit Apartments | 0 | 0.0% |
| 3 or 4 Unit Apartments | 0 | 0.0% |
| 5 to 9 Unit Apartments | 0 | 0.0% |
| 10 or more Apartments | 118 | 11.5% |
| Mobile Home / Other | 0 | 0.0% |
| Total | 1,030 | 100.0% |
Housing Structures by Occupancy in Hacienda San Jose
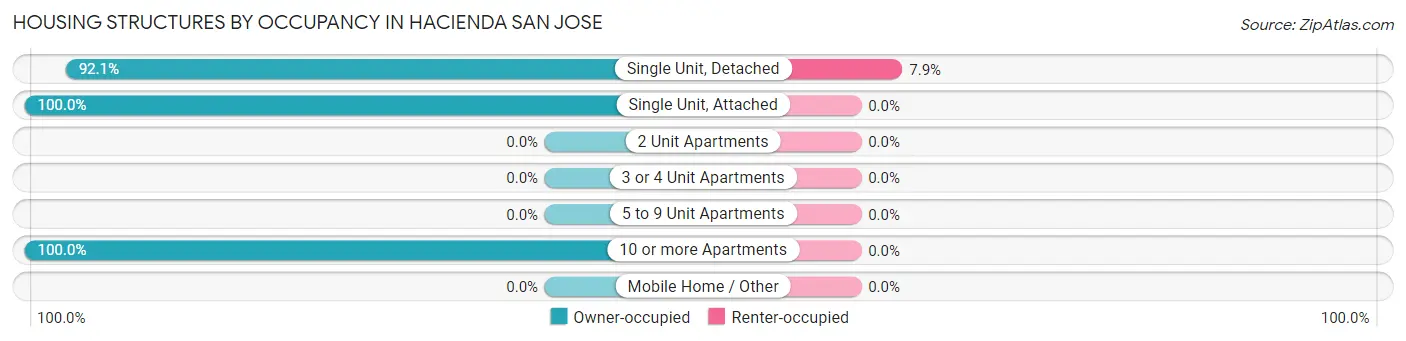
| Structure Type | Owner-occupied | Renter-occupied |
| Single Unit, Detached | 801 (92.1%) | 69 (7.9%) |
| Single Unit, Attached | 42 (100.0%) | 0 (0.0%) |
| 2 Unit Apartments | 0 (0.0%) | 0 (0.0%) |
| 3 or 4 Unit Apartments | 0 (0.0%) | 0 (0.0%) |
| 5 to 9 Unit Apartments | 0 (0.0%) | 0 (0.0%) |
| 10 or more Apartments | 118 (100.0%) | 0 (0.0%) |
| Mobile Home / Other | 0 (0.0%) | 0 (0.0%) |
| Total | 961 (93.3%) | 69 (6.7%) |
Housing Structures by Number of Rooms in Hacienda San Jose
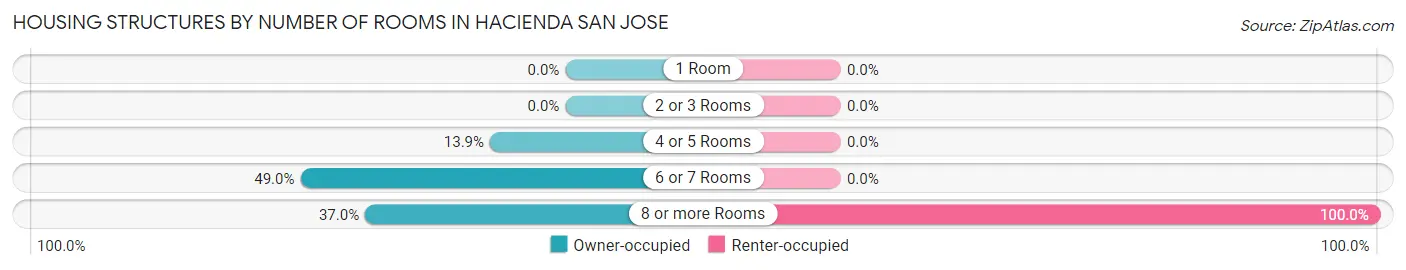
| Number of Rooms | Owner-occupied | Renter-occupied |
| 1 Room | 0 (0.0%) | 0 (0.0%) |
| 2 or 3 Rooms | 0 (0.0%) | 0 (0.0%) |
| 4 or 5 Rooms | 134 (13.9%) | 0 (0.0%) |
| 6 or 7 Rooms | 471 (49.0%) | 0 (0.0%) |
| 8 or more Rooms | 356 (37.0%) | 69 (100.0%) |
| Total | 961 (100.0%) | 69 (100.0%) |
Housing Structure by Heating Type in Hacienda San Jose
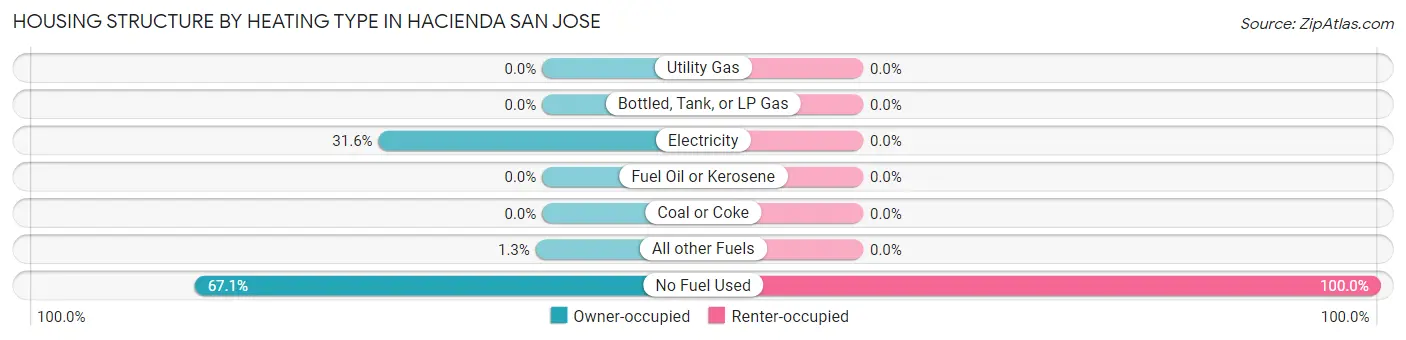
| Heating Type | Owner-occupied | Renter-occupied |
| Utility Gas | 0 (0.0%) | 0 (0.0%) |
| Bottled, Tank, or LP Gas | 0 (0.0%) | 0 (0.0%) |
| Electricity | 304 (31.6%) | 0 (0.0%) |
| Fuel Oil or Kerosene | 0 (0.0%) | 0 (0.0%) |
| Coal or Coke | 0 (0.0%) | 0 (0.0%) |
| All other Fuels | 12 (1.3%) | 0 (0.0%) |
| No Fuel Used | 645 (67.1%) | 69 (100.0%) |
| Total | 961 (100.0%) | 69 (100.0%) |
Household Vehicle Usage in Hacienda San Jose
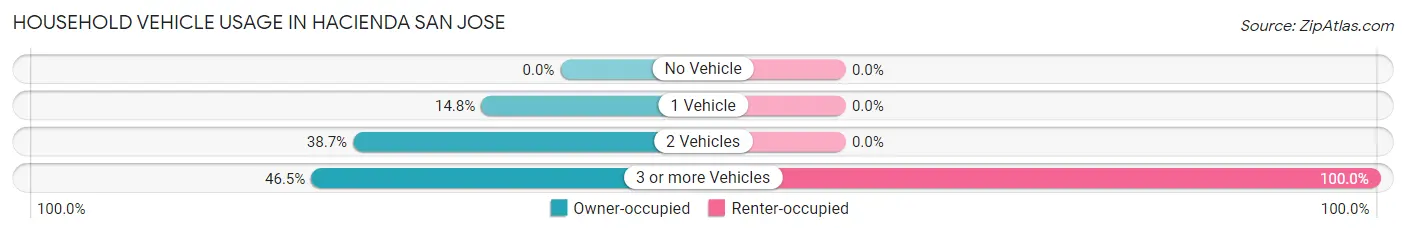
| Vehicles per Household | Owner-occupied | Renter-occupied |
| No Vehicle | 0 (0.0%) | 0 (0.0%) |
| 1 Vehicle | 142 (14.8%) | 0 (0.0%) |
| 2 Vehicles | 372 (38.7%) | 0 (0.0%) |
| 3 or more Vehicles | 447 (46.5%) | 69 (100.0%) |
| Total | 961 (100.0%) | 69 (100.0%) |
Real Estate & Mortgages in Hacienda San Jose
Real Estate and Mortgage Overview in Hacienda San Jose
| Characteristic | Without Mortgage | With Mortgage |
| Housing Units | 184 | 777 |
| Median Property Value | $278,400 | $345,500 |
| Median Household Income | $151,296 | $249 |
| Monthly Housing Costs | $569 | $214 |
| Real Estate Taxes | $1,219 | $129 |
Property Value by Mortgage Status in Hacienda San Jose
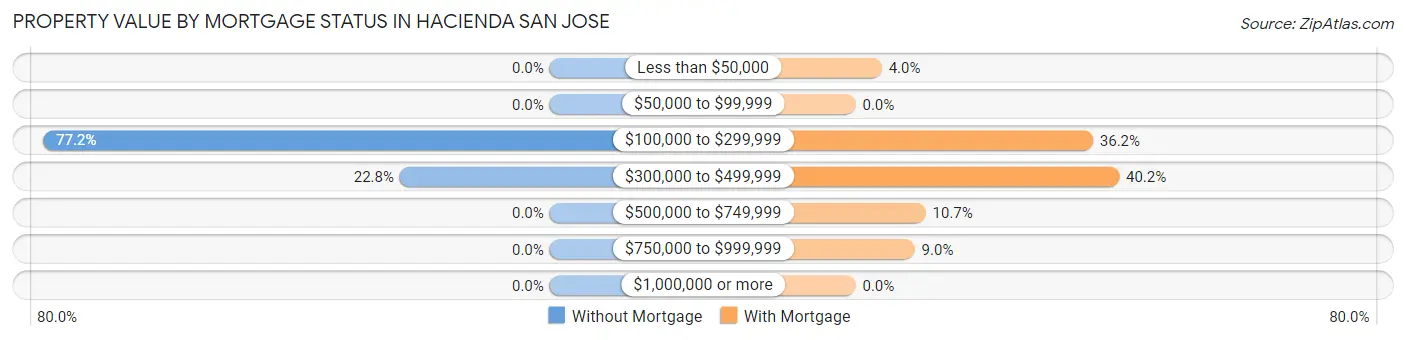
| Property Value | Without Mortgage | With Mortgage |
| Less than $50,000 | 0 (0.0%) | 31 (4.0%) |
| $50,000 to $99,999 | 0 (0.0%) | 0 (0.0%) |
| $100,000 to $299,999 | 142 (77.2%) | 281 (36.2%) |
| $300,000 to $499,999 | 42 (22.8%) | 312 (40.2%) |
| $500,000 to $749,999 | 0 (0.0%) | 83 (10.7%) |
| $750,000 to $999,999 | 0 (0.0%) | 70 (9.0%) |
| $1,000,000 or more | 0 (0.0%) | 0 (0.0%) |
| Total | 184 (100.0%) | 777 (100.0%) |
Household Income by Mortgage Status in Hacienda San Jose
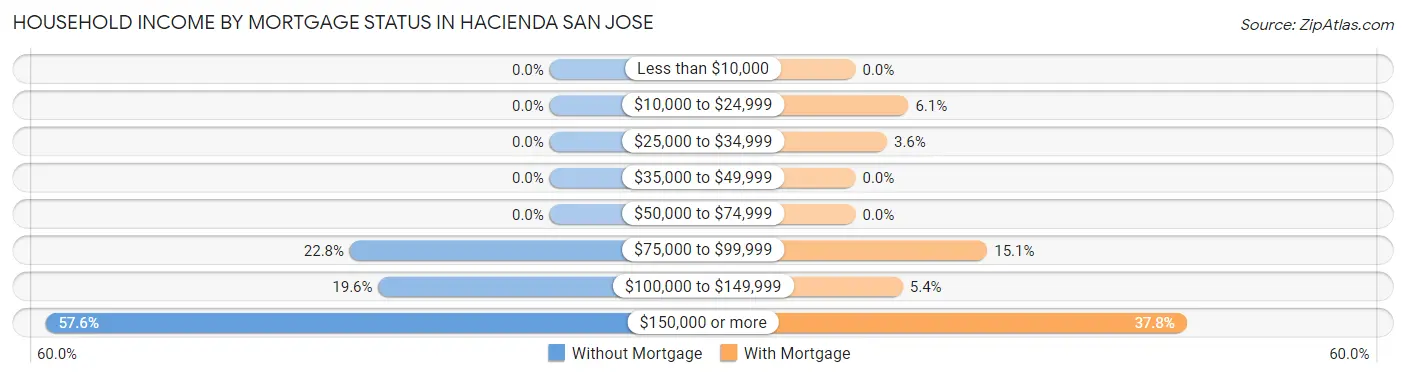
| Household Income | Without Mortgage | With Mortgage |
| Less than $10,000 | 0 (0.0%) | 0 (0.0%) |
| $10,000 to $24,999 | 0 (0.0%) | 47 (6.0%) |
| $25,000 to $34,999 | 0 (0.0%) | 28 (3.6%) |
| $35,000 to $49,999 | 0 (0.0%) | 0 (0.0%) |
| $50,000 to $74,999 | 0 (0.0%) | 0 (0.0%) |
| $75,000 to $99,999 | 42 (22.8%) | 117 (15.1%) |
| $100,000 to $149,999 | 36 (19.6%) | 42 (5.4%) |
| $150,000 or more | 106 (57.6%) | 294 (37.8%) |
| Total | 184 (100.0%) | 777 (100.0%) |
Property Value to Household Income Ratio in Hacienda San Jose
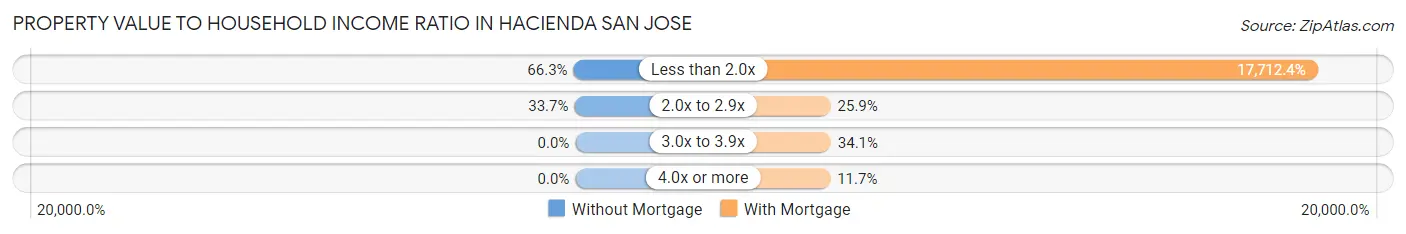
| Value-to-Income Ratio | Without Mortgage | With Mortgage |
| Less than 2.0x | 122 (66.3%) | 137,625 (17,712.4%) |
| 2.0x to 2.9x | 62 (33.7%) | 201 (25.9%) |
| 3.0x to 3.9x | 0 (0.0%) | 265 (34.1%) |
| 4.0x or more | 0 (0.0%) | 91 (11.7%) |
| Total | 184 (100.0%) | 777 (100.0%) |
Real Estate Taxes by Mortgage Status in Hacienda San Jose
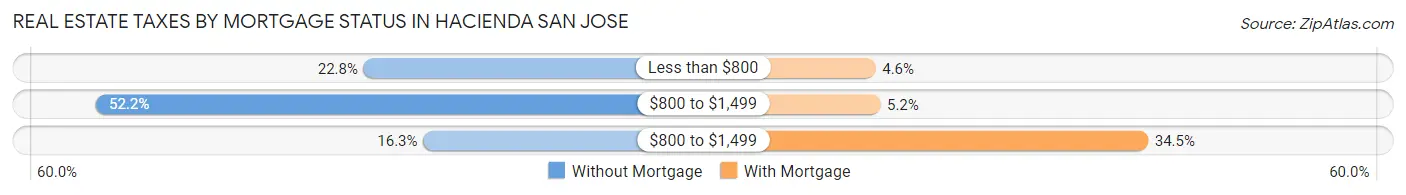
| Property Taxes | Without Mortgage | With Mortgage |
| Less than $800 | 42 (22.8%) | 36 (4.6%) |
| $800 to $1,499 | 96 (52.2%) | 40 (5.1%) |
| $800 to $1,499 | 30 (16.3%) | 268 (34.5%) |
| Total | 184 (100.0%) | 777 (100.0%) |
Health & Disability in Hacienda San Jose
Health Insurance Coverage by Age in Hacienda San Jose
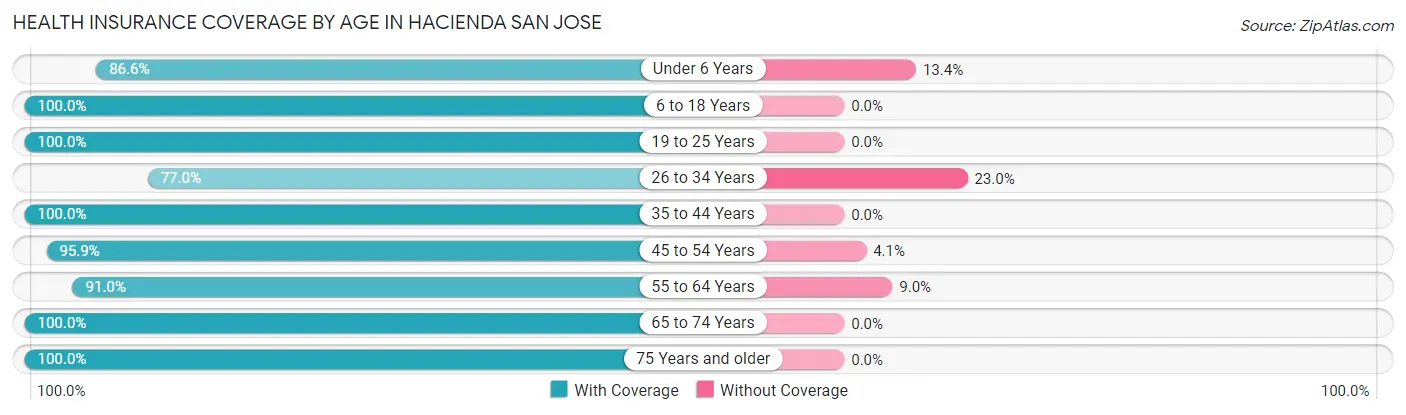
| Age Bracket | With Coverage | Without Coverage |
| Under 6 Years | 149 (86.6%) | 23 (13.4%) |
| 6 to 18 Years | 825 (100.0%) | 0 (0.0%) |
| 19 to 25 Years | 236 (100.0%) | 0 (0.0%) |
| 26 to 34 Years | 275 (77.0%) | 82 (23.0%) |
| 35 to 44 Years | 443 (100.0%) | 0 (0.0%) |
| 45 to 54 Years | 728 (95.9%) | 31 (4.1%) |
| 55 to 64 Years | 244 (91.0%) | 24 (9.0%) |
| 65 to 74 Years | 99 (100.0%) | 0 (0.0%) |
| 75 Years and older | 225 (100.0%) | 0 (0.0%) |
| Total | 3,224 (95.3%) | 160 (4.7%) |
Health Insurance Coverage by Citizenship Status in Hacienda San Jose
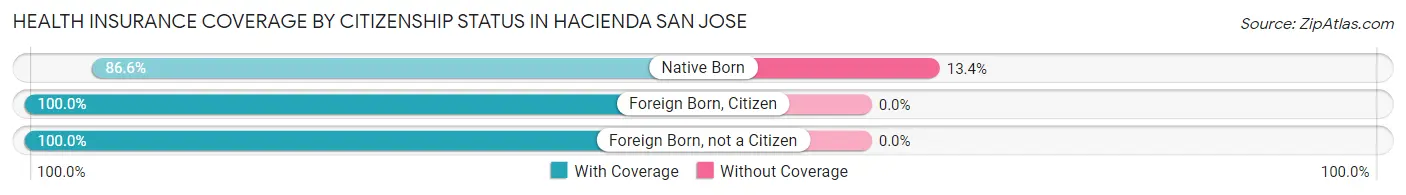
| Citizenship Status | With Coverage | Without Coverage |
| Native Born | 149 (86.6%) | 23 (13.4%) |
| Foreign Born, Citizen | 825 (100.0%) | 0 (0.0%) |
| Foreign Born, not a Citizen | 236 (100.0%) | 0 (0.0%) |
Health Insurance Coverage by Household Income in Hacienda San Jose
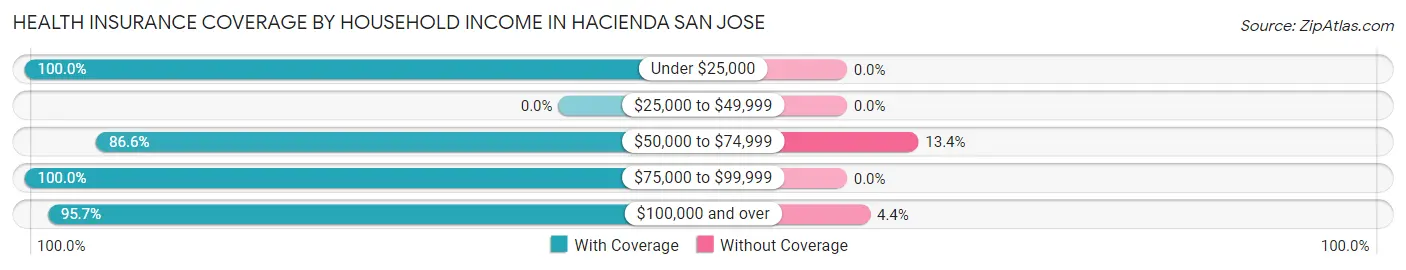
| Household Income | With Coverage | Without Coverage |
| Under $25,000 | 446 (100.0%) | 0 (0.0%) |
| $25,000 to $49,999 | 0 (0.0%) | 0 (0.0%) |
| $50,000 to $74,999 | 426 (86.6%) | 66 (13.4%) |
| $75,000 to $99,999 | 286 (100.0%) | 0 (0.0%) |
| $100,000 and over | 2,066 (95.7%) | 94 (4.3%) |
Public vs Private Health Insurance Coverage by Age in Hacienda San Jose
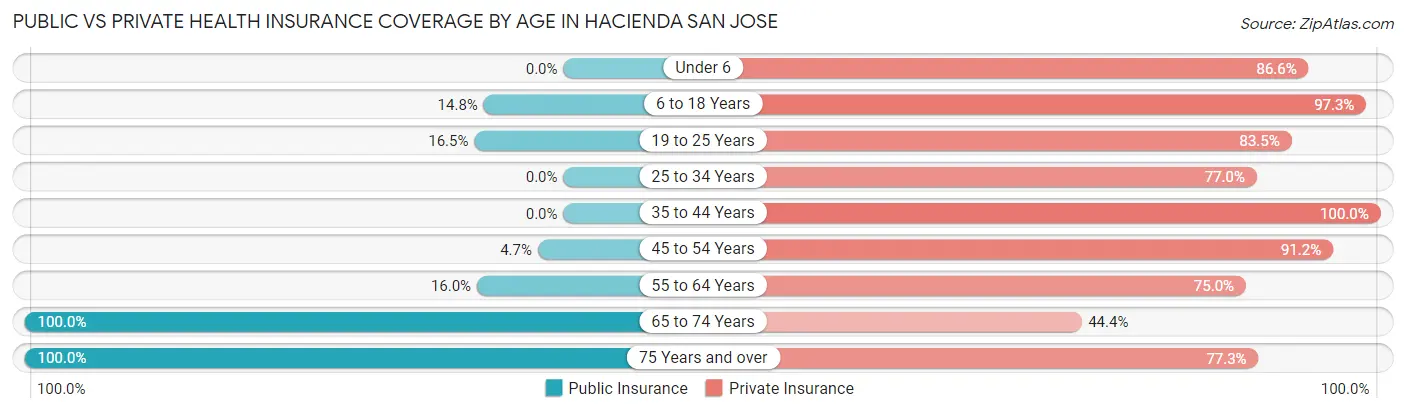
| Age Bracket | Public Insurance | Private Insurance |
| Under 6 | 0 (0.0%) | 149 (86.6%) |
| 6 to 18 Years | 122 (14.8%) | 803 (97.3%) |
| 19 to 25 Years | 39 (16.5%) | 197 (83.5%) |
| 25 to 34 Years | 0 (0.0%) | 275 (77.0%) |
| 35 to 44 Years | 0 (0.0%) | 443 (100.0%) |
| 45 to 54 Years | 36 (4.7%) | 692 (91.2%) |
| 55 to 64 Years | 43 (16.0%) | 201 (75.0%) |
| 65 to 74 Years | 99 (100.0%) | 44 (44.4%) |
| 75 Years and over | 225 (100.0%) | 174 (77.3%) |
| Total | 564 (16.7%) | 2,978 (88.0%) |
Disability Status by Sex by Age in Hacienda San Jose
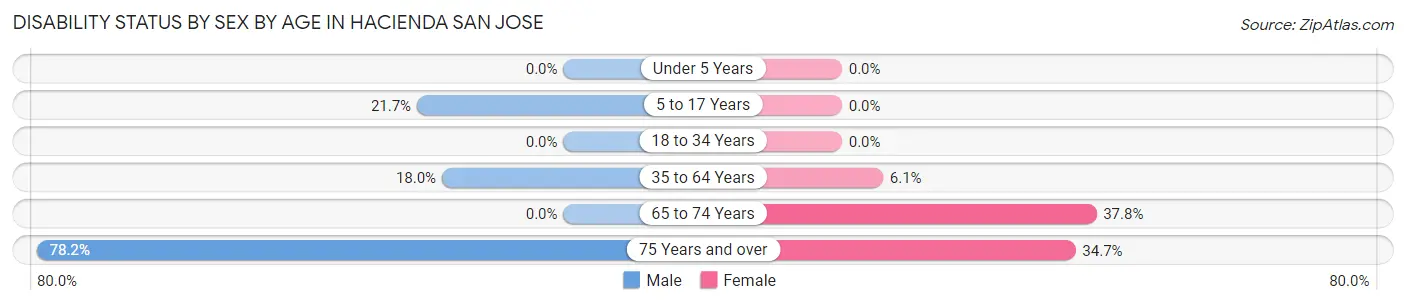
| Age Bracket | Male | Female |
| Under 5 Years | 0 (0.0%) | 0 (0.0%) |
| 5 to 17 Years | 115 (21.7%) | 0 (0.0%) |
| 18 to 34 Years | 0 (0.0%) | 0 (0.0%) |
| 35 to 64 Years | 141 (18.0%) | 42 (6.1%) |
| 65 to 74 Years | 0 (0.0%) | 17 (37.8%) |
| 75 Years and over | 61 (78.2%) | 51 (34.7%) |
Disability Class by Sex by Age in Hacienda San Jose
Disability Class: Hearing Difficulty
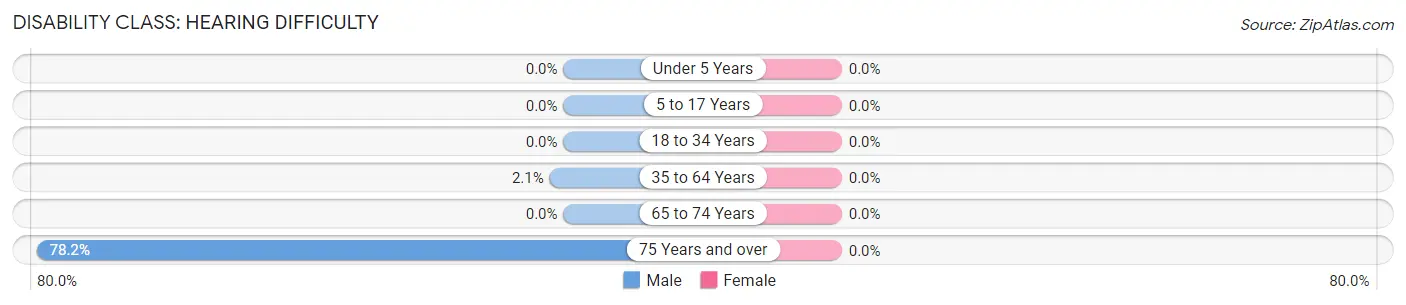
| Age Bracket | Male | Female |
| Under 5 Years | 0 (0.0%) | 0 (0.0%) |
| 5 to 17 Years | 0 (0.0%) | 0 (0.0%) |
| 18 to 34 Years | 0 (0.0%) | 0 (0.0%) |
| 35 to 64 Years | 16 (2.1%) | 0 (0.0%) |
| 65 to 74 Years | 0 (0.0%) | 0 (0.0%) |
| 75 Years and over | 61 (78.2%) | 0 (0.0%) |
Disability Class: Vision Difficulty
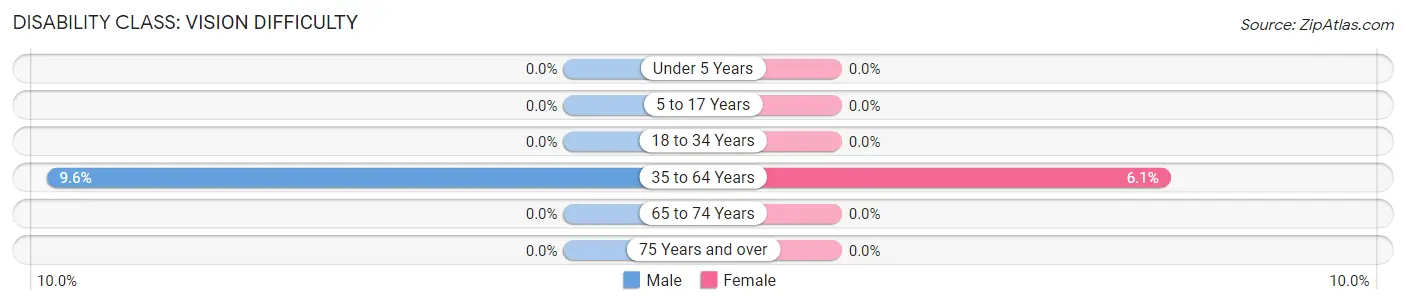
| Age Bracket | Male | Female |
| Under 5 Years | 0 (0.0%) | 0 (0.0%) |
| 5 to 17 Years | 0 (0.0%) | 0 (0.0%) |
| 18 to 34 Years | 0 (0.0%) | 0 (0.0%) |
| 35 to 64 Years | 75 (9.6%) | 42 (6.1%) |
| 65 to 74 Years | 0 (0.0%) | 0 (0.0%) |
| 75 Years and over | 0 (0.0%) | 0 (0.0%) |
Disability Class: Cognitive Difficulty
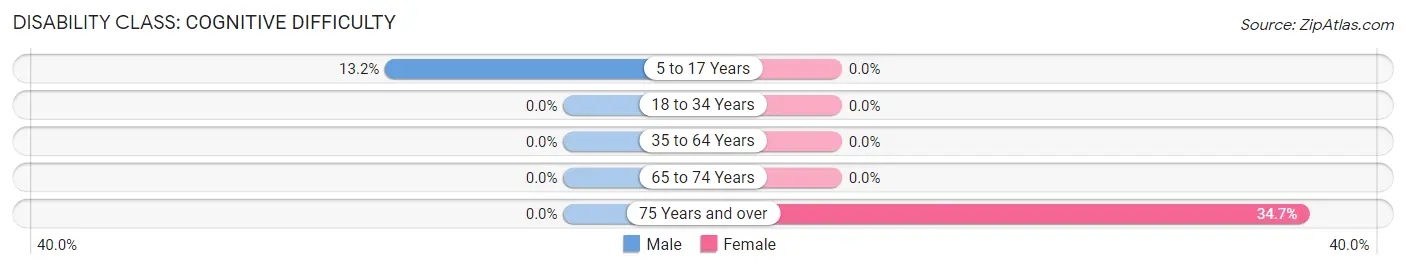
| Age Bracket | Male | Female |
| 5 to 17 Years | 70 (13.2%) | 0 (0.0%) |
| 18 to 34 Years | 0 (0.0%) | 0 (0.0%) |
| 35 to 64 Years | 0 (0.0%) | 0 (0.0%) |
| 65 to 74 Years | 0 (0.0%) | 0 (0.0%) |
| 75 Years and over | 0 (0.0%) | 51 (34.7%) |
Disability Class: Ambulatory Difficulty
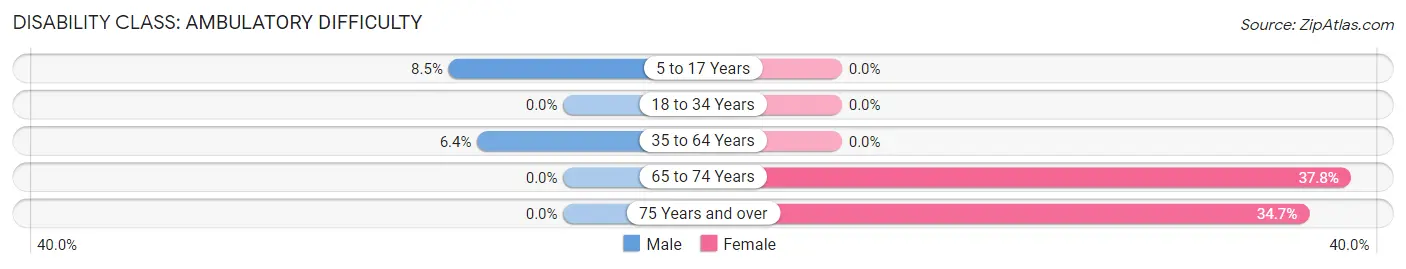
| Age Bracket | Male | Female |
| 5 to 17 Years | 45 (8.5%) | 0 (0.0%) |
| 18 to 34 Years | 0 (0.0%) | 0 (0.0%) |
| 35 to 64 Years | 50 (6.4%) | 0 (0.0%) |
| 65 to 74 Years | 0 (0.0%) | 17 (37.8%) |
| 75 Years and over | 0 (0.0%) | 51 (34.7%) |
Disability Class: Self-Care Difficulty
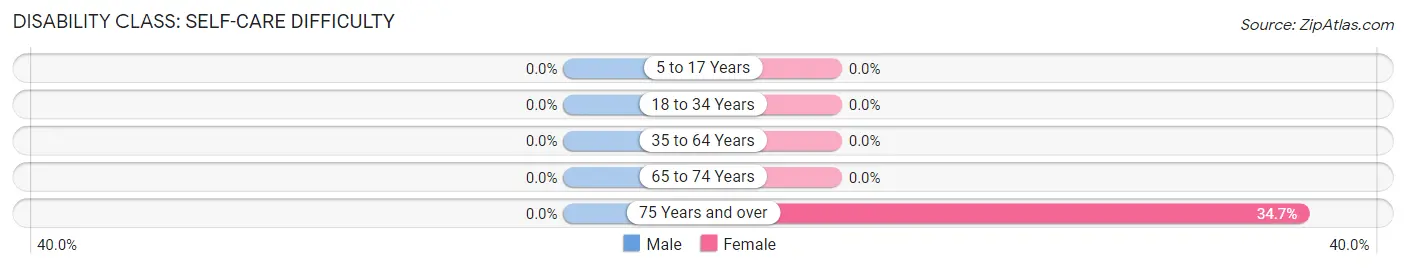
| Age Bracket | Male | Female |
| 5 to 17 Years | 0 (0.0%) | 0 (0.0%) |
| 18 to 34 Years | 0 (0.0%) | 0 (0.0%) |
| 35 to 64 Years | 0 (0.0%) | 0 (0.0%) |
| 65 to 74 Years | 0 (0.0%) | 0 (0.0%) |
| 75 Years and over | 0 (0.0%) | 51 (34.7%) |
Technology Access in Hacienda San Jose
Computing Device Access in Hacienda San Jose
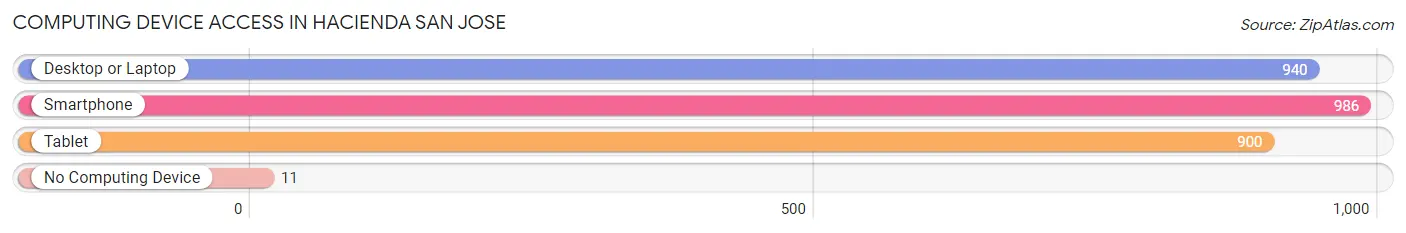
| Device Type | # Households | % Households |
| Desktop or Laptop | 940 | 91.3% |
| Smartphone | 986 | 95.7% |
| Tablet | 900 | 87.4% |
| No Computing Device | 11 | 1.1% |
| Total | 1,030 | 100.0% |
Internet Access in Hacienda San Jose
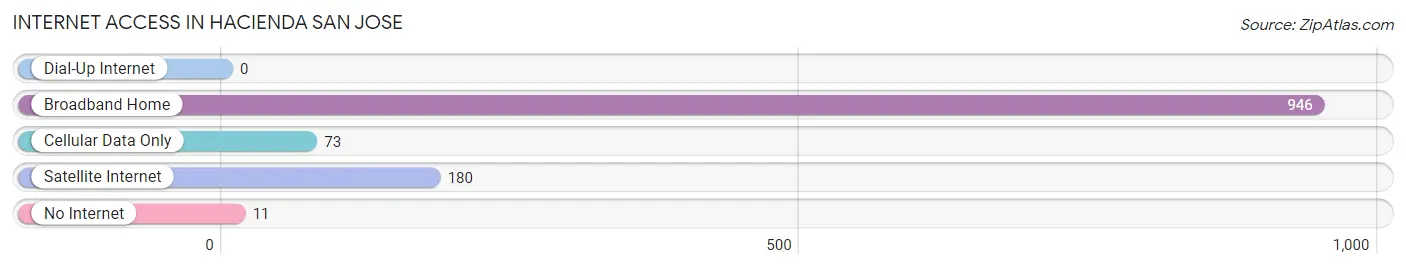
| Internet Type | # Households | % Households |
| Dial-Up Internet | 0 | 0.0% |
| Broadband Home | 946 | 91.8% |
| Cellular Data Only | 73 | 7.1% |
| Satellite Internet | 180 | 17.5% |
| No Internet | 11 | 1.1% |
| Total | 1,030 | 100.0% |
Hacienda San Jose Summary
Hacienda San Jose is a small rural community located in the municipality of San Lorenzo, Puerto Rico. It is situated in the northern part of the island, approximately 20 miles from the capital city of San Juan. The population of Hacienda San Jose was estimated to be around 1,000 people in 2000.
History
Hacienda San Jose was founded in the late 19th century by a group of Spanish settlers. The settlers were attracted to the area due to its fertile soil and abundant water supply. The hacienda was originally used as a sugar plantation, but it eventually transitioned to a cattle ranch. The hacienda was owned by the same family for several generations until it was sold to the government in the early 20th century.
Geography
Hacienda San Jose is located in the northern part of Puerto Rico, in the municipality of San Lorenzo. It is situated in the foothills of the Cordillera Central mountain range, at an elevation of approximately 1,000 feet above sea level. The area is characterized by rolling hills and lush vegetation. The climate is tropical, with temperatures ranging from the mid-70s to the mid-80s Fahrenheit.
Economy
The economy of Hacienda San Jose is largely based on agriculture. The main crops grown in the area are coffee, bananas, and plantains. Livestock production is also an important part of the local economy, with cattle, pigs, and chickens being raised in the area. In addition, there are several small businesses in the community, including restaurants, grocery stores, and hardware stores.
Demographics
As of 2000, the population of Hacienda San Jose was estimated to be around 1,000 people. The majority of the population is of Hispanic descent, with a small percentage of African-American and other ethnicities. The median age of the population is approximately 30 years old. The majority of the population is Roman Catholic, with a small percentage of other religious affiliations. The primary language spoken in the community is Spanish, although English is also spoken by some of the residents.
Conclusion
Hacienda San Jose is a small rural community located in the municipality of San Lorenzo, Puerto Rico. It has a long history of agricultural production, and its economy is largely based on agriculture and livestock production. The population of Hacienda San Jose is mostly of Hispanic descent, with a median age of approximately 30 years old. The primary language spoken in the community is Spanish, although English is also spoken by some of the residents.
Common Questions
What is Per Capita Income in Hacienda San Jose?
Per Capita income in Hacienda San Jose is $51,308.
What is the Median Family Income in Hacienda San Jose?
Median Family Income in Hacienda San Jose is $133,839.
What is the Median Household income in Hacienda San Jose?
Median Household Income in Hacienda San Jose is $134,821.
What is Income or Wage Gap in Hacienda San Jose?
Income or Wage Gap in Hacienda San Jose is 45.7%.
Women in Hacienda San Jose earn 54.3 cents for every dollar earned by a man.
What is Inequality or Gini Index in Hacienda San Jose?
Inequality or Gini Index in Hacienda San Jose is 0.47.
What is the Total Population of Hacienda San Jose?
Total Population of Hacienda San Jose is 3,384.
What is the Total Male Population of Hacienda San Jose?
Total Male Population of Hacienda San Jose is 1,754.
What is the Total Female Population of Hacienda San Jose?
Total Female Population of Hacienda San Jose is 1,630.
What is the Ratio of Males per 100 Females in Hacienda San Jose?
There are 107.61 Males per 100 Females in Hacienda San Jose.
What is the Ratio of Females per 100 Males in Hacienda San Jose?
There are 92.93 Females per 100 Males in Hacienda San Jose.
What is the Median Population Age in Hacienda San Jose?
Median Population Age in Hacienda San Jose is 40.1 Years.
What is the Average Family Size in Hacienda San Jose
Average Family Size in Hacienda San Jose is 3.5 People.
What is the Average Household Size in Hacienda San Jose
Average Household Size in Hacienda San Jose is 3.3 People.
How Large is the Labor Force in Hacienda San Jose?
There are 1,845 People in the Labor Forcein in Hacienda San Jose.
What is the Percentage of People in the Labor Force in Hacienda San Jose?
67.6% of People are in the Labor Force in Hacienda San Jose.
What is the Unemployment Rate in Hacienda San Jose?
Unemployment Rate in Hacienda San Jose is 4.3%.