Pueblito del Rio, PR Map & Demographics
Pueblito del Rio Overview
$12,987
PER CAPITA INCOME
0.42
INEQUALITY / GINI INDEX
1,064
TOTAL POPULATION
610
MALE POPULATION
454
FEMALE POPULATION
134.36
MALES / 100 FEMALES
74.43
FEMALES / 100 MALES
41.9
MEDIAN AGE
3.2
AVG FAMILY SIZE
2.6
AVG HOUSEHOLD SIZE
277
LABOR FORCE [ PEOPLE ]
35.1%
PERCENT IN LABOR FORCE
Income in Pueblito del Rio
Income Overview in Pueblito del Rio
| Characteristic | Number | Measure |
| Per Capita Income | 1,064 | $12,987 |
| Median Family Income | 297 | $0 |
| Mean Family Income | 297 | $43,084 |
| Median Household Income | 410 | $0 |
| Mean Household Income | 410 | $34,368 |
| Income Deficit | 297 | $0 |
| Wage / Income Gap (%) | 1,064 | 0.00% |
| Wage / Income Gap ($) | 1,064 | 100.00¢ per $1 |
| Gini / Inequality Index | 1,064 | 0.42 |
Earnings by Sex in Pueblito del Rio
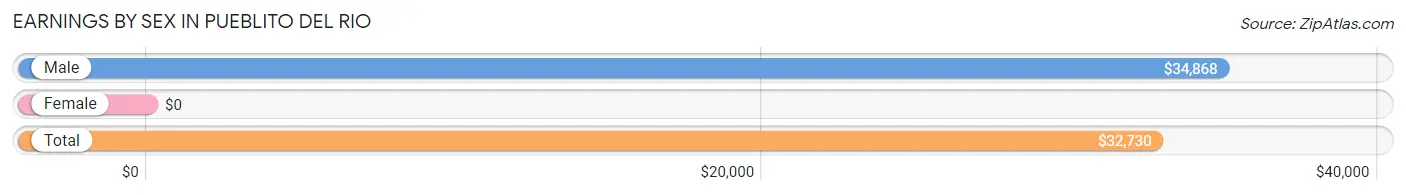
| Sex | Number | Average Earnings |
| Male | 134 (48.4%) | $34,868 |
| Female | 143 (51.6%) | $0 |
| Total | 277 (100.0%) | $32,730 |
Earnings by Sex by Income Bracket in Pueblito del Rio
The most common earnings brackets in Pueblito del Rio are $30,000 to $34,999 for men (38 | 28.4%) and $15,000 to $17,499 for women (51 | 35.7%).
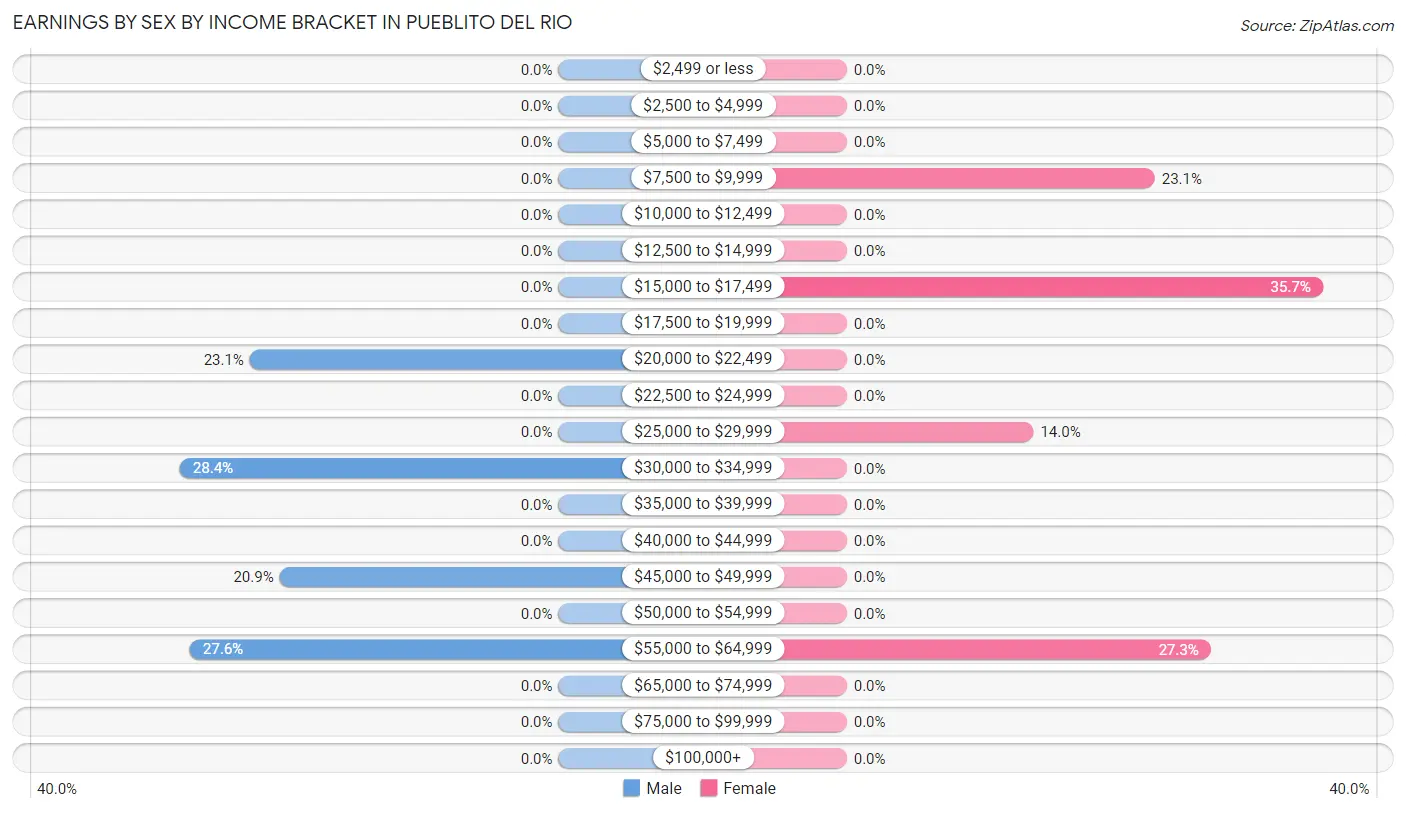
| Income | Male | Female |
| $2,499 or less | 0 (0.0%) | 0 (0.0%) |
| $2,500 to $4,999 | 0 (0.0%) | 0 (0.0%) |
| $5,000 to $7,499 | 0 (0.0%) | 0 (0.0%) |
| $7,500 to $9,999 | 0 (0.0%) | 33 (23.1%) |
| $10,000 to $12,499 | 0 (0.0%) | 0 (0.0%) |
| $12,500 to $14,999 | 0 (0.0%) | 0 (0.0%) |
| $15,000 to $17,499 | 0 (0.0%) | 51 (35.7%) |
| $17,500 to $19,999 | 0 (0.0%) | 0 (0.0%) |
| $20,000 to $22,499 | 31 (23.1%) | 0 (0.0%) |
| $22,500 to $24,999 | 0 (0.0%) | 0 (0.0%) |
| $25,000 to $29,999 | 0 (0.0%) | 20 (14.0%) |
| $30,000 to $34,999 | 38 (28.4%) | 0 (0.0%) |
| $35,000 to $39,999 | 0 (0.0%) | 0 (0.0%) |
| $40,000 to $44,999 | 0 (0.0%) | 0 (0.0%) |
| $45,000 to $49,999 | 28 (20.9%) | 0 (0.0%) |
| $50,000 to $54,999 | 0 (0.0%) | 0 (0.0%) |
| $55,000 to $64,999 | 37 (27.6%) | 39 (27.3%) |
| $65,000 to $74,999 | 0 (0.0%) | 0 (0.0%) |
| $75,000 to $99,999 | 0 (0.0%) | 0 (0.0%) |
| $100,000+ | 0 (0.0%) | 0 (0.0%) |
| Total | 134 (100.0%) | 143 (100.0%) |
Earnings by Sex by Educational Attainment in Pueblito del Rio
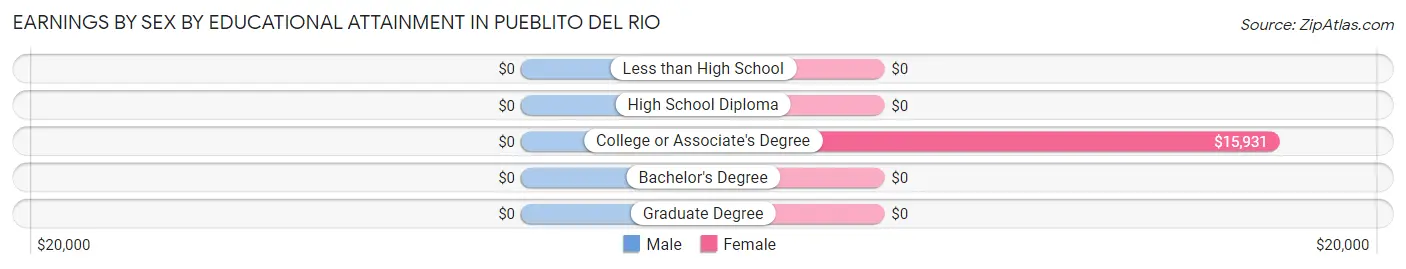
| Educational Attainment | Male Income | Female Income |
| Less than High School | - | - |
| High School Diploma | - | - |
| College or Associate's Degree | - | - |
| Bachelor's Degree | - | - |
| Graduate Degree | - | - |
| Total | $34,868 | $0 |
Family Income in Pueblito del Rio
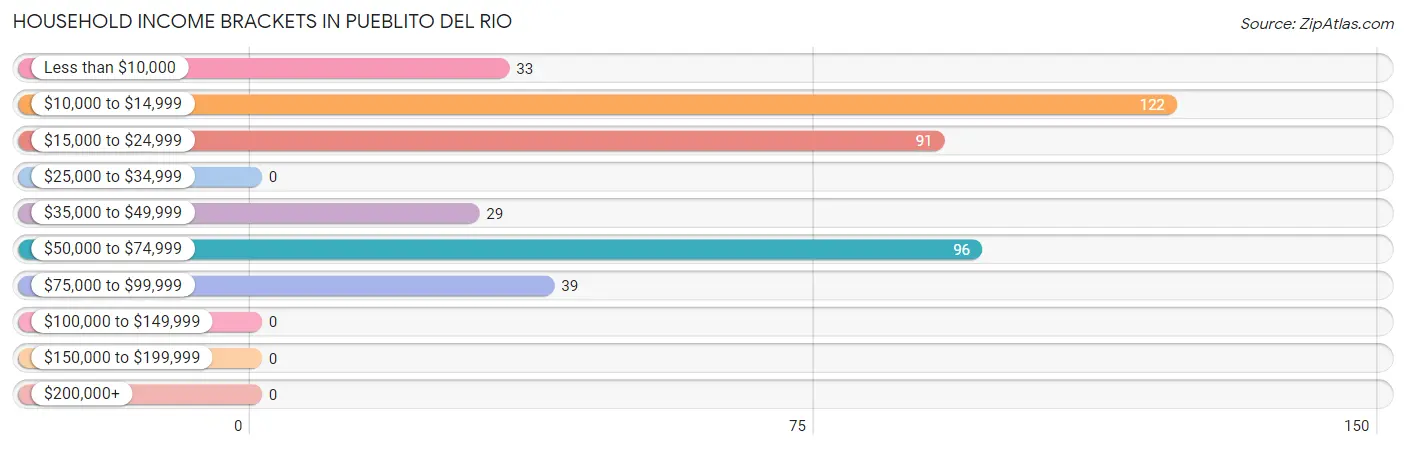
Family Income Brackets in Pueblito del Rio
According to the Pueblito del Rio family income data, there are 96 families falling into the $50,000 to $74,999 income range, which is the most common income bracket and makes up 32.3% of all families.
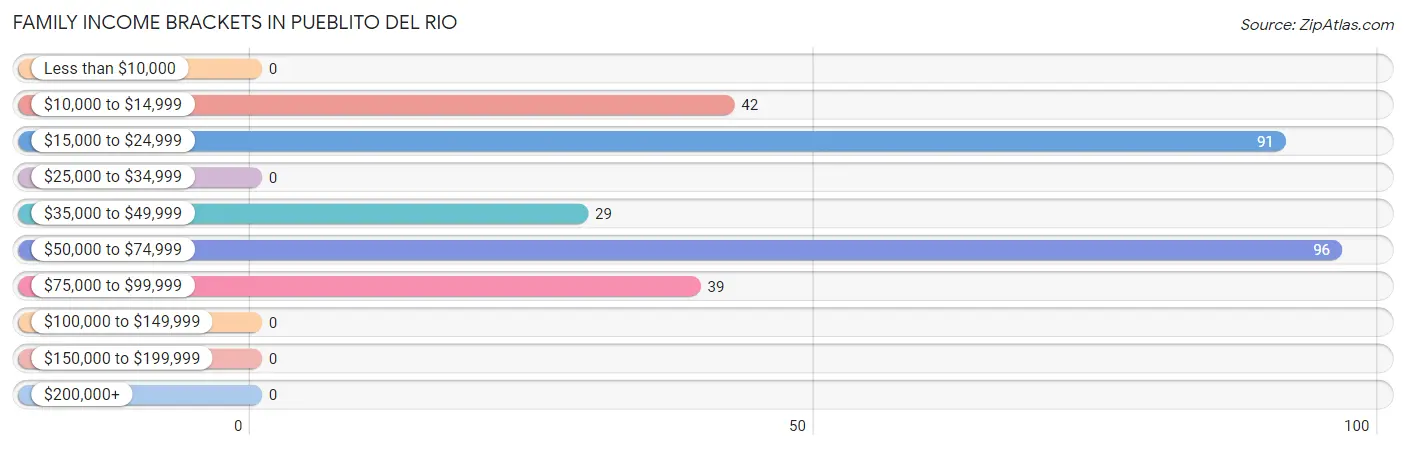
| Income Bracket | # Families | % Families |
| Less than $10,000 | 0 | 0.0% |
| $10,000 to $14,999 | 42 | 14.1% |
| $15,000 to $24,999 | 91 | 30.6% |
| $25,000 to $34,999 | 0 | 0.0% |
| $35,000 to $49,999 | 29 | 9.8% |
| $50,000 to $74,999 | 96 | 32.3% |
| $75,000 to $99,999 | 39 | 13.1% |
| $100,000 to $149,999 | 0 | 0.0% |
| $150,000 to $199,999 | 0 | 0.0% |
| $200,000+ | 0 | 0.0% |
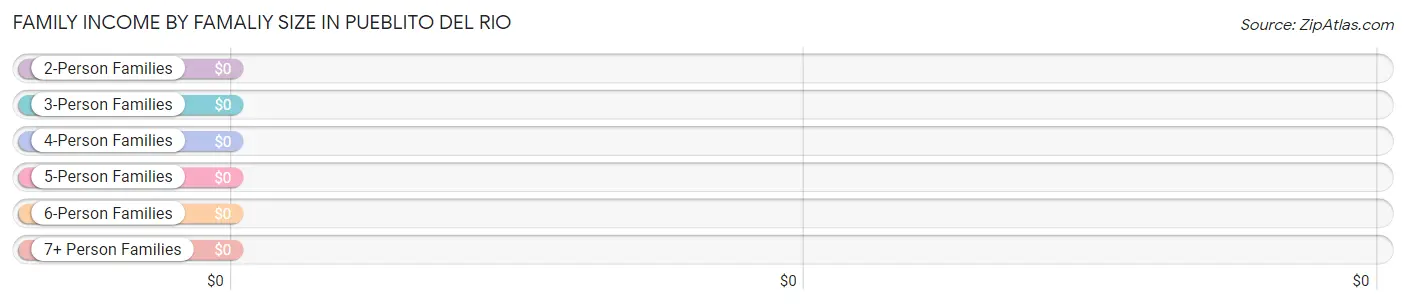
Family Income by Famaliy Size in Pueblito del Rio
| Income Bracket | # Families | Median Income |
| 2-Person Families | 189 (63.6%) | $0 |
| 3-Person Families | 0 (0.0%) | $0 |
| 4-Person Families | 71 (23.9%) | $0 |
| 5-Person Families | 37 (12.5%) | $0 |
| 6-Person Families | 0 (0.0%) | $0 |
| 7+ Person Families | 0 (0.0%) | $0 |
| Total | 297 (100.0%) | $0 |
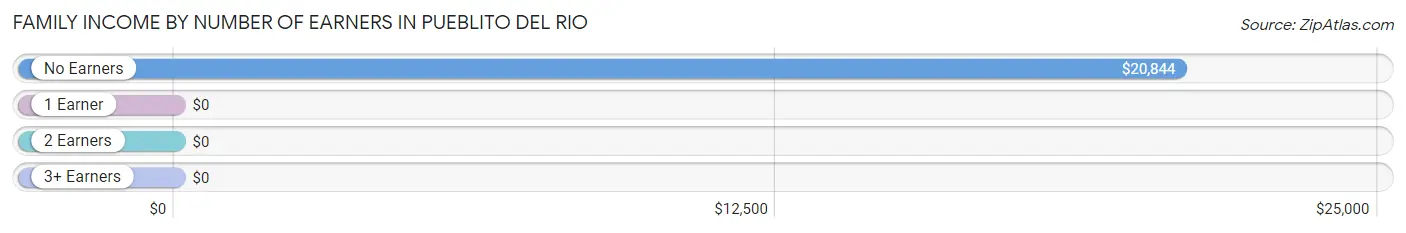
Family Income by Number of Earners in Pueblito del Rio
| Number of Earners | # Families | Median Income |
| No Earners | 111 (37.4%) | $20,844 |
| 1 Earner | 119 (40.1%) | $0 |
| 2 Earners | 67 (22.6%) | $0 |
| 3+ Earners | 0 (0.0%) | $0 |
| Total | 297 (100.0%) | $0 |
Household Income in Pueblito del Rio
Household Income Brackets in Pueblito del Rio
With 122 households falling in the category, the $10,000 to $14,999 income range is the most frequent in Pueblito del Rio, accounting for 29.8% of all households.
| Income Bracket | # Households | % Households |
| Less than $10,000 | 33 | 8.0% |
| $10,000 to $14,999 | 122 | 29.8% |
| $15,000 to $24,999 | 91 | 22.2% |
| $25,000 to $34,999 | 0 | 0.0% |
| $35,000 to $49,999 | 29 | 7.1% |
| $50,000 to $74,999 | 96 | 23.4% |
| $75,000 to $99,999 | 39 | 9.5% |
| $100,000 to $149,999 | 0 | 0.0% |
| $150,000 to $199,999 | 0 | 0.0% |
| $200,000+ | 0 | 0.0% |
Household Income by Householder Age in Pueblito del Rio
The median household income in Pueblito del Rio is $0, with the highest median household income of $40,647 found in the 45 to 64 years age bracket for the primary householder. A total of 161 households (39.3%) fall into this category.
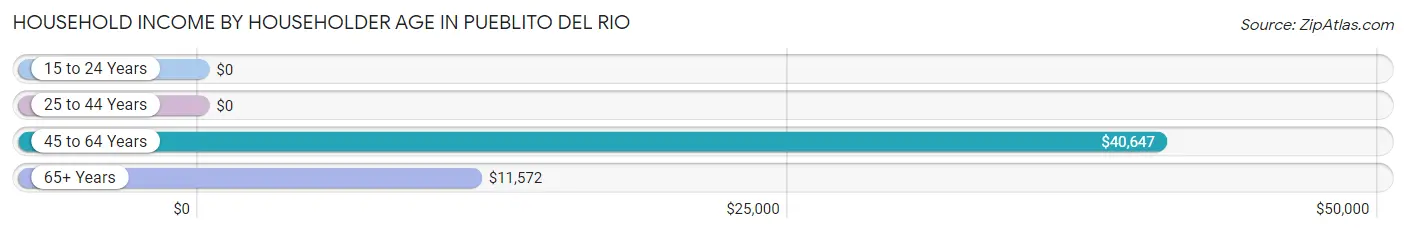
| Income Bracket | # Households | Median Income |
| 15 to 24 Years | 0 (0.0%) | $0 |
| 25 to 44 Years | 127 (31.0%) | $0 |
| 45 to 64 Years | 161 (39.3%) | $40,647 |
| 65+ Years | 122 (29.8%) | $11,572 |
| Total | 410 (100.0%) | $0 |
Poverty in Pueblito del Rio
Income Below Poverty by Sex and Age in Pueblito del Rio
With 40.2% poverty level for males and 52.6% for females among the residents of Pueblito del Rio, under 5 year old males and 25 to 34 year old females are the most vulnerable to poverty, with 61 males (100.0%) and 51 females (100.0%) in their respective age groups living below the poverty level.
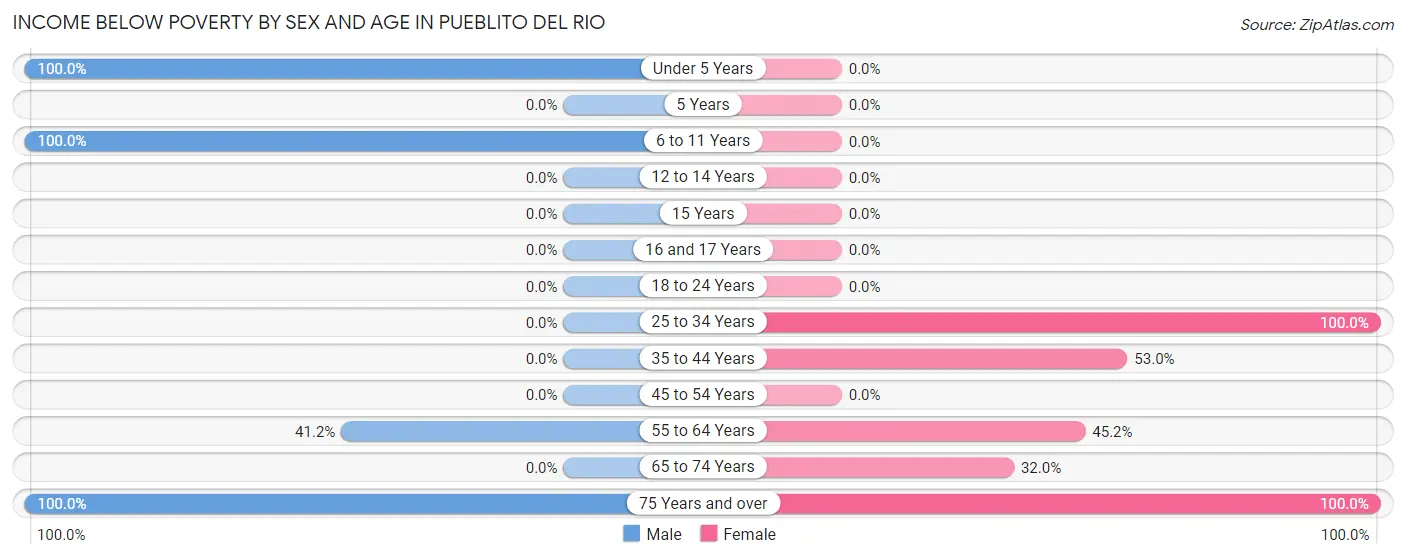
| Age Bracket | Male | Female |
| Under 5 Years | 61 (100.0%) | 0 (0.0%) |
| 5 Years | 0 (0.0%) | 0 (0.0%) |
| 6 to 11 Years | 102 (100.0%) | 0 (0.0%) |
| 12 to 14 Years | 0 (0.0%) | 0 (0.0%) |
| 15 Years | 0 (0.0%) | 0 (0.0%) |
| 16 and 17 Years | 0 (0.0%) | 0 (0.0%) |
| 18 to 24 Years | 0 (0.0%) | 0 (0.0%) |
| 25 to 34 Years | 0 (0.0%) | 51 (100.0%) |
| 35 to 44 Years | 0 (0.0%) | 44 (53.0%) |
| 45 to 54 Years | 0 (0.0%) | 0 (0.0%) |
| 55 to 64 Years | 40 (41.2%) | 33 (45.2%) |
| 65 to 74 Years | 0 (0.0%) | 31 (32.0%) |
| 75 Years and over | 42 (100.0%) | 80 (100.0%) |
| Total | 245 (40.2%) | 239 (52.6%) |
Income Above Poverty by Sex and Age in Pueblito del Rio
According to the poverty statistics in Pueblito del Rio, males aged 15 years and females aged 45 to 54 years are the age groups that are most secure financially, with 100.0% of males and 100.0% of females in these age groups living above the poverty line.
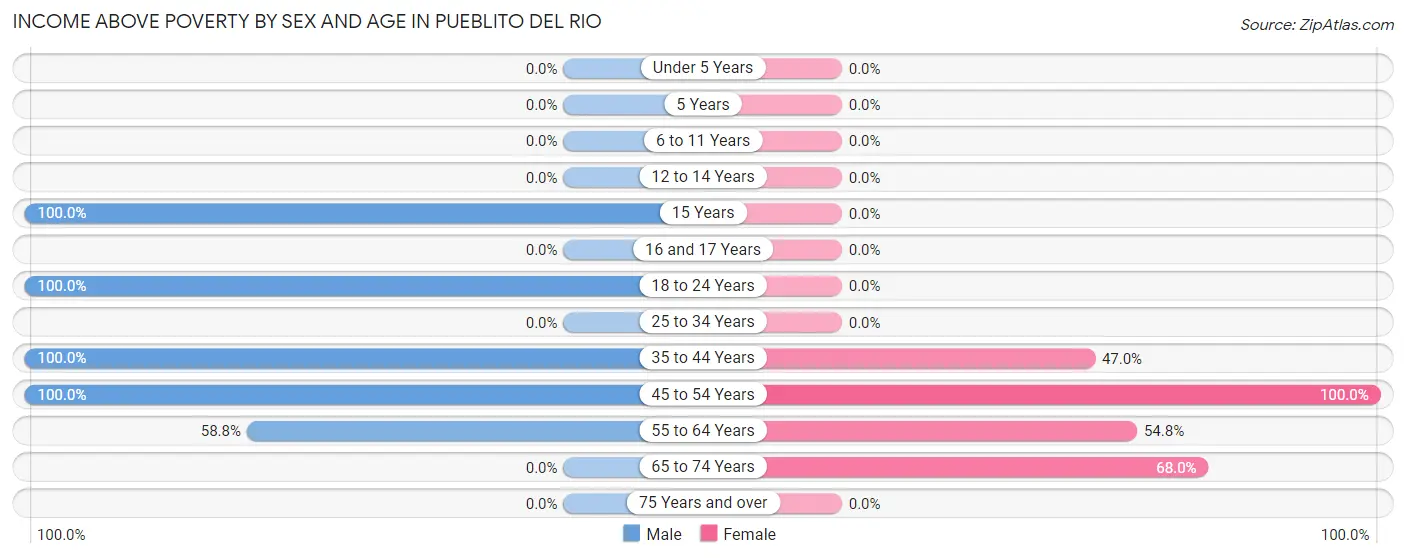
| Age Bracket | Male | Female |
| Under 5 Years | 0 (0.0%) | 0 (0.0%) |
| 5 Years | 0 (0.0%) | 0 (0.0%) |
| 6 to 11 Years | 0 (0.0%) | 0 (0.0%) |
| 12 to 14 Years | 0 (0.0%) | 0 (0.0%) |
| 15 Years | 111 (100.0%) | 0 (0.0%) |
| 16 and 17 Years | 0 (0.0%) | 0 (0.0%) |
| 18 to 24 Years | 91 (100.0%) | 0 (0.0%) |
| 25 to 34 Years | 0 (0.0%) | 0 (0.0%) |
| 35 to 44 Years | 75 (100.0%) | 39 (47.0%) |
| 45 to 54 Years | 31 (100.0%) | 70 (100.0%) |
| 55 to 64 Years | 57 (58.8%) | 40 (54.8%) |
| 65 to 74 Years | 0 (0.0%) | 66 (68.0%) |
| 75 Years and over | 0 (0.0%) | 0 (0.0%) |
| Total | 365 (59.8%) | 215 (47.4%) |
Income Below Poverty Among Married-Couple Families in Pueblito del Rio
The poverty statistics for married-couple families in Pueblito del Rio show that 33.3% or 82 of the total 246 families live below the poverty line. Families with 1 or 2 children have the highest poverty rate of 37.0%, comprising of 40 families. On the other hand, families with no children have the lowest poverty rate of 30.4%, which includes 42 families.
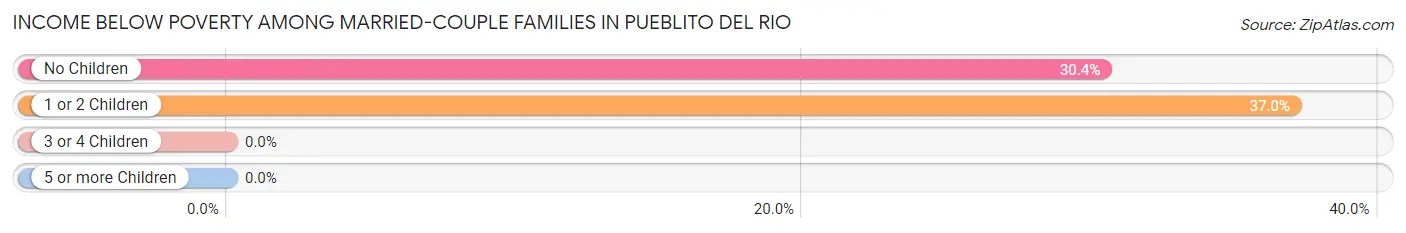
| Children | Above Poverty | Below Poverty |
| No Children | 96 (69.6%) | 42 (30.4%) |
| 1 or 2 Children | 68 (63.0%) | 40 (37.0%) |
| 3 or 4 Children | 0 (0.0%) | 0 (0.0%) |
| 5 or more Children | 0 (0.0%) | 0 (0.0%) |
| Total | 164 (66.7%) | 82 (33.3%) |
Income Below Poverty Among Single-Parent Households in Pueblito del Rio
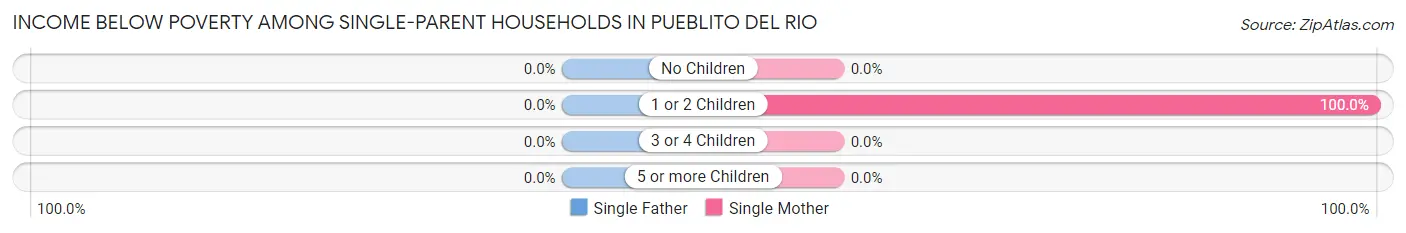
| Children | Single Father | Single Mother |
| No Children | 0 (0.0%) | 0 (0.0%) |
| 1 or 2 Children | 0 (0.0%) | 51 (100.0%) |
| 3 or 4 Children | 0 (0.0%) | 0 (0.0%) |
| 5 or more Children | 0 (0.0%) | 0 (0.0%) |
| Total | 0 (0.0%) | 51 (100.0%) |
Income Below Poverty Among Married-Couple vs Single-Parent Households in Pueblito del Rio
The poverty data for Pueblito del Rio shows that 82 of the married-couple family households (33.3%) and 51 of the single-parent households (100.0%) are living below the poverty level. Within the married-couple family households, those with 1 or 2 children have the highest poverty rate, with 40 households (37.0%) falling below the poverty line. Among the single-parent households, those with 1 or 2 children have the highest poverty rate, with 51 household (100.0%) living below poverty.
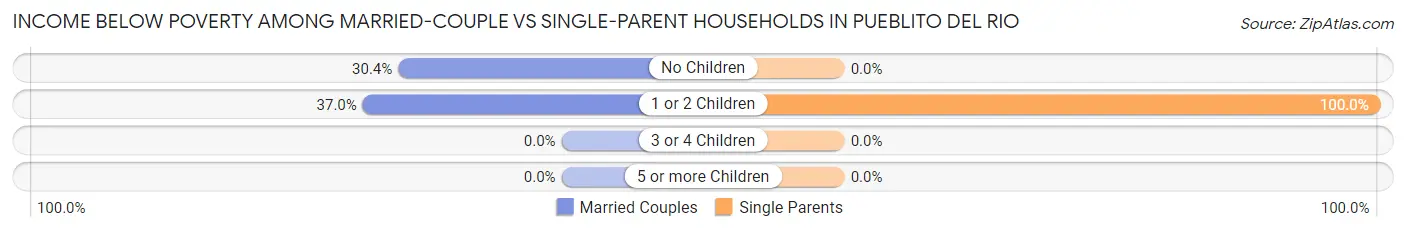
| Children | Married-Couple Families | Single-Parent Households |
| No Children | 42 (30.4%) | 0 (0.0%) |
| 1 or 2 Children | 40 (37.0%) | 51 (100.0%) |
| 3 or 4 Children | 0 (0.0%) | 0 (0.0%) |
| 5 or more Children | 0 (0.0%) | 0 (0.0%) |
| Total | 82 (33.3%) | 51 (100.0%) |
Race in Pueblito del Rio
The most populous races in Pueblito del Rio are Hispanic or Latino (1,064 | 100.0%), Some other Race (678 | 63.7%), and Black / African American (354 | 33.3%).
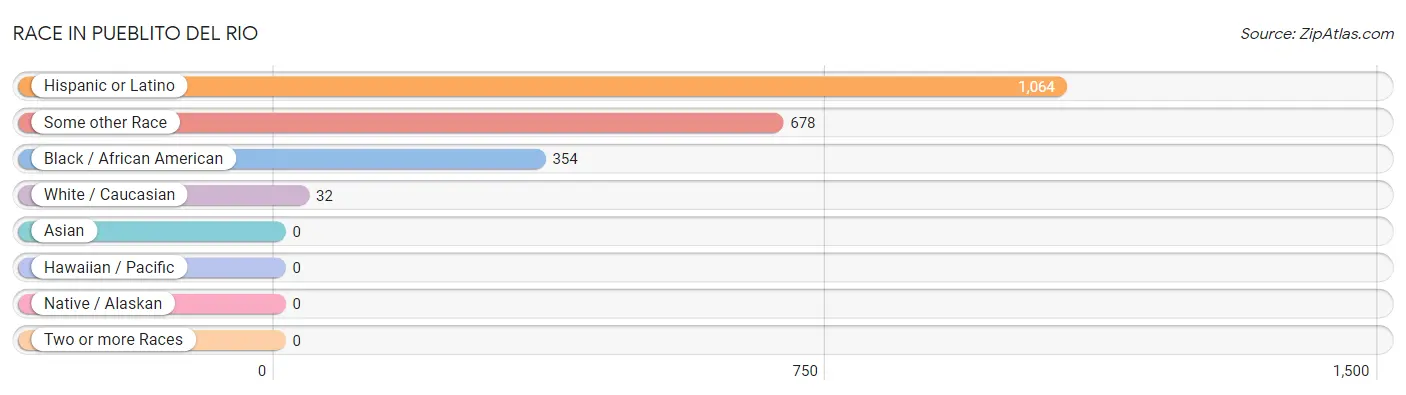
| Race | # Population | % Population |
| Asian | 0 | 0.0% |
| Black / African American | 354 | 33.3% |
| Hawaiian / Pacific | 0 | 0.0% |
| Hispanic or Latino | 1,064 | 100.0% |
| Native / Alaskan | 0 | 0.0% |
| White / Caucasian | 32 | 3.0% |
| Two or more Races | 0 | 0.0% |
| Some other Race | 678 | 63.7% |
| Total | 1,064 | 100.0% |
Ancestry in Pueblito del Rio
The most populous ancestries reported in Pueblito del Rio are Puerto Rican (1,041 | 97.8%), and Mexican (23 | 2.2%), together accounting for 100.0% of all Pueblito del Rio residents.
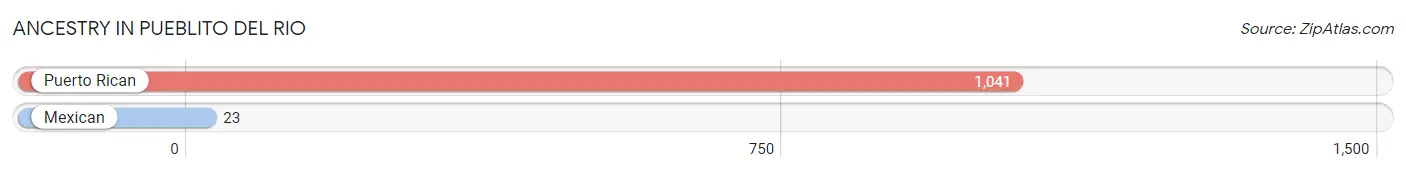
| Ancestry | # Population | % Population |
| Mexican | 23 | 2.2% |
| Puerto Rican | 1,041 | 97.8% | View All 2 Rows |
Immigrants in Pueblito del Rio

| Immigration Origin | # Population | % Population | View All 0 Rows |
Sex and Age in Pueblito del Rio
Sex and Age in Pueblito del Rio
The most populous age groups in Pueblito del Rio are 15 to 19 Years (111 | 18.2%) for men and 35 to 39 Years (83 | 18.3%) for women.
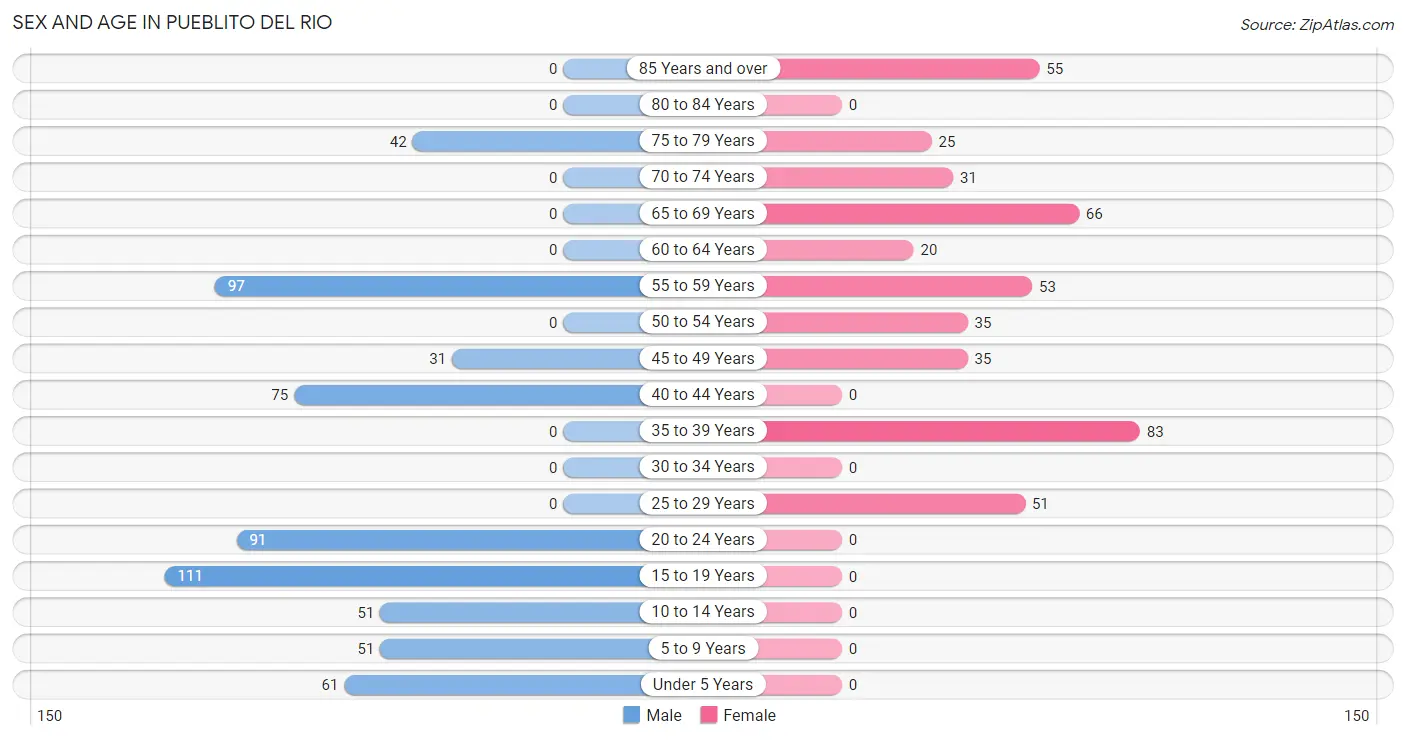
| Age Bracket | Male | Female |
| Under 5 Years | 61 (10.0%) | 0 (0.0%) |
| 5 to 9 Years | 51 (8.4%) | 0 (0.0%) |
| 10 to 14 Years | 51 (8.4%) | 0 (0.0%) |
| 15 to 19 Years | 111 (18.2%) | 0 (0.0%) |
| 20 to 24 Years | 91 (14.9%) | 0 (0.0%) |
| 25 to 29 Years | 0 (0.0%) | 51 (11.2%) |
| 30 to 34 Years | 0 (0.0%) | 0 (0.0%) |
| 35 to 39 Years | 0 (0.0%) | 83 (18.3%) |
| 40 to 44 Years | 75 (12.3%) | 0 (0.0%) |
| 45 to 49 Years | 31 (5.1%) | 35 (7.7%) |
| 50 to 54 Years | 0 (0.0%) | 35 (7.7%) |
| 55 to 59 Years | 97 (15.9%) | 53 (11.7%) |
| 60 to 64 Years | 0 (0.0%) | 20 (4.4%) |
| 65 to 69 Years | 0 (0.0%) | 66 (14.5%) |
| 70 to 74 Years | 0 (0.0%) | 31 (6.8%) |
| 75 to 79 Years | 42 (6.9%) | 25 (5.5%) |
| 80 to 84 Years | 0 (0.0%) | 0 (0.0%) |
| 85 Years and over | 0 (0.0%) | 55 (12.1%) |
| Total | 610 (100.0%) | 454 (100.0%) |
Families and Households in Pueblito del Rio
Median Family Size in Pueblito del Rio
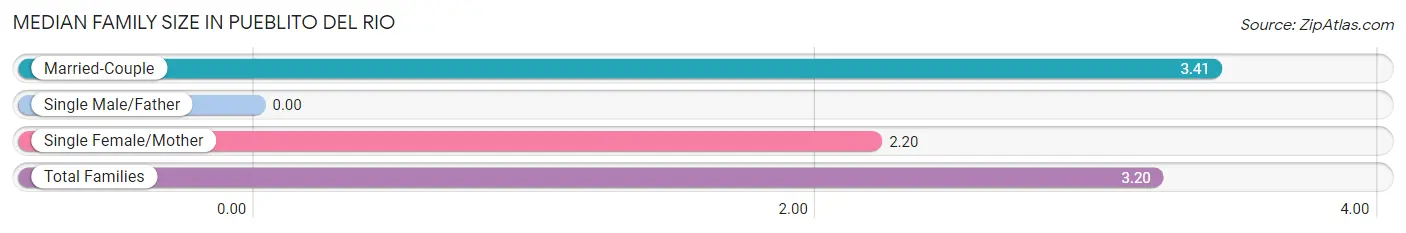
| Family Type | # Families | Family Size |
| Married-Couple | 246 (82.8%) | 3.41 |
| Single Male/Father | 0 (0.0%) | - |
| Single Female/Mother | 51 (17.2%) | 2.20 |
| Total Families | 297 (100.0%) | 3.20 |
Median Household Size in Pueblito del Rio
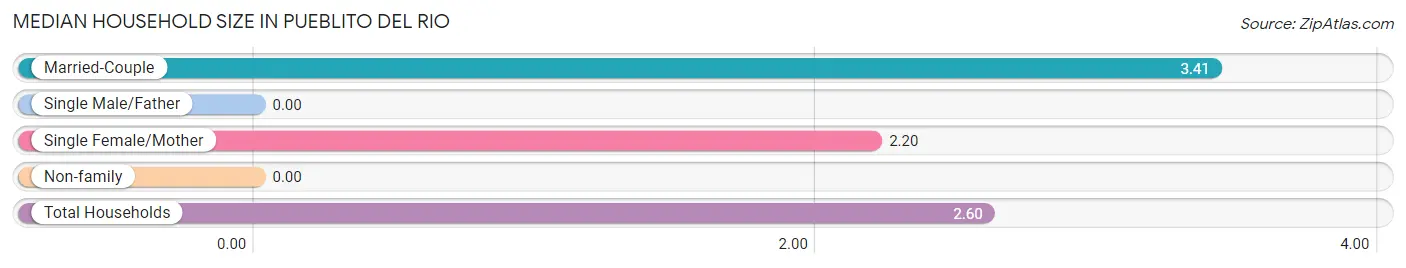
| Household Type | # Households | Household Size |
| Married-Couple | 246 (60.0%) | 3.41 |
| Single Male/Father | 0 (0.0%) | - |
| Single Female/Mother | 51 (12.4%) | 2.20 |
| Non-family | 113 (27.6%) | - |
| Total Households | 410 (100.0%) | 2.60 |
Household Size by Marriage Status in Pueblito del Rio
Out of a total of 410 households in Pueblito del Rio, 297 (72.4%) are family households, while 113 (27.6%) are nonfamily households. The most numerous type of family households are 2-person households, comprising 189, and the most common type of nonfamily households are 1-person households, comprising 113.
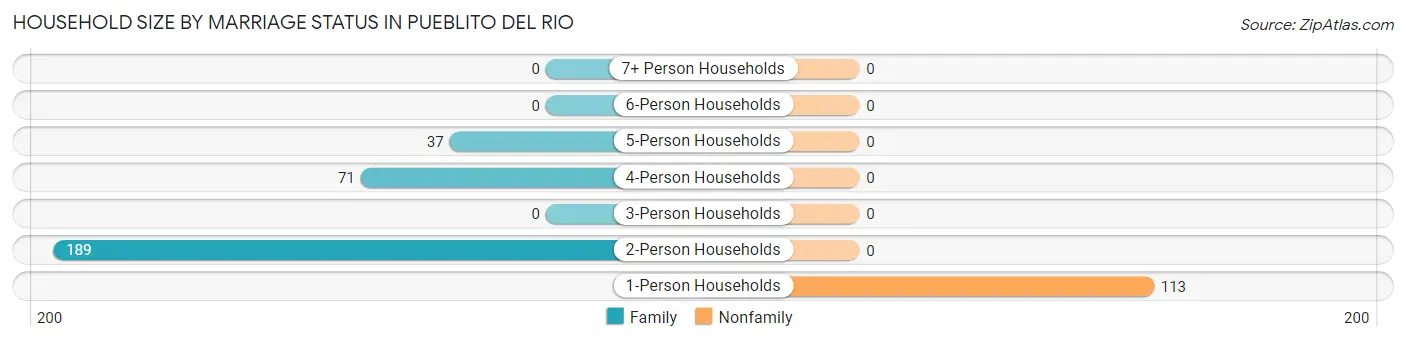
| Household Size | Family Households | Nonfamily Households |
| 1-Person Households | - | 113 (27.6%) |
| 2-Person Households | 189 (46.1%) | 0 (0.0%) |
| 3-Person Households | 0 (0.0%) | 0 (0.0%) |
| 4-Person Households | 71 (17.3%) | 0 (0.0%) |
| 5-Person Households | 37 (9.0%) | 0 (0.0%) |
| 6-Person Households | 0 (0.0%) | 0 (0.0%) |
| 7+ Person Households | 0 (0.0%) | 0 (0.0%) |
| Total | 297 (72.4%) | 113 (27.6%) |
Female Fertility in Pueblito del Rio
Fertility by Age in Pueblito del Rio
| Age Bracket | Women with Births | Births / 1,000 Women |
| 15 to 19 years | 0 (0.0%) | 0.0 |
| 20 to 34 years | 0 (0.0%) | 0.0 |
| 35 to 50 years | 0 (0.0%) | 0.0 |
| Total | 0 (0.0%) | 0.0 |
Fertility by Age by Marriage Status in Pueblito del Rio
| Age Bracket | Married | Unmarried |
| 15 to 19 years | 0 (0.0%) | 0 (0.0%) |
| 20 to 34 years | 0 (0.0%) | 0 (0.0%) |
| 35 to 50 years | 0 (0.0%) | 0 (0.0%) |
| Total | 0 (0.0%) | 0 (0.0%) |
Fertility by Education in Pueblito del Rio
| Educational Attainment | Women with Births | Births / 1,000 Women |
| Less than High School | 0 (0.0%) | 0.0 |
| High School Diploma | 0 (0.0%) | 0.0 |
| College or Associate's Degree | 0 (0.0%) | 0.0 |
| Bachelor's Degree | 0 (0.0%) | 0.0 |
| Graduate Degree | 0 (0.0%) | 0.0 |
| Total | 0 (0.0%) | 0.0 |
Fertility by Education by Marriage Status in Pueblito del Rio
| Educational Attainment | Married | Unmarried |
| Less than High School | 0 (0.0%) | 0 (0.0%) |
| High School Diploma | 0 (0.0%) | 0 (0.0%) |
| College or Associate's Degree | 0 (0.0%) | 0 (0.0%) |
| Bachelor's Degree | 0 (0.0%) | 0 (0.0%) |
| Graduate Degree | 0 (0.0%) | 0 (0.0%) |
| Total | 0 (0.0%) | 0 (0.0%) |
Employment Characteristics in Pueblito del Rio
Employment by Class of Employer in Pueblito del Rio
Among the 277 employed individuals in Pueblito del Rio, private company employees (196 | 70.8%), state government employees (48 | 17.3%), and local government employees (33 | 11.9%) make up the most common classes of employment.
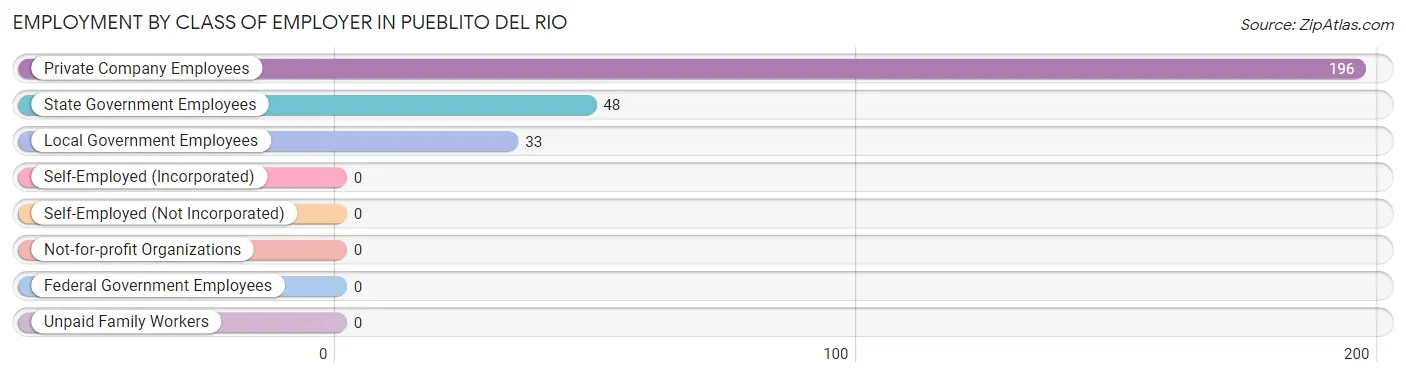
| Employer Class | # Employees | % Employees |
| Private Company Employees | 196 | 70.8% |
| Self-Employed (Incorporated) | 0 | 0.0% |
| Self-Employed (Not Incorporated) | 0 | 0.0% |
| Not-for-profit Organizations | 0 | 0.0% |
| Local Government Employees | 33 | 11.9% |
| State Government Employees | 48 | 17.3% |
| Federal Government Employees | 0 | 0.0% |
| Unpaid Family Workers | 0 | 0.0% |
| Total | 277 | 100.0% |
Employment Status by Age in Pueblito del Rio
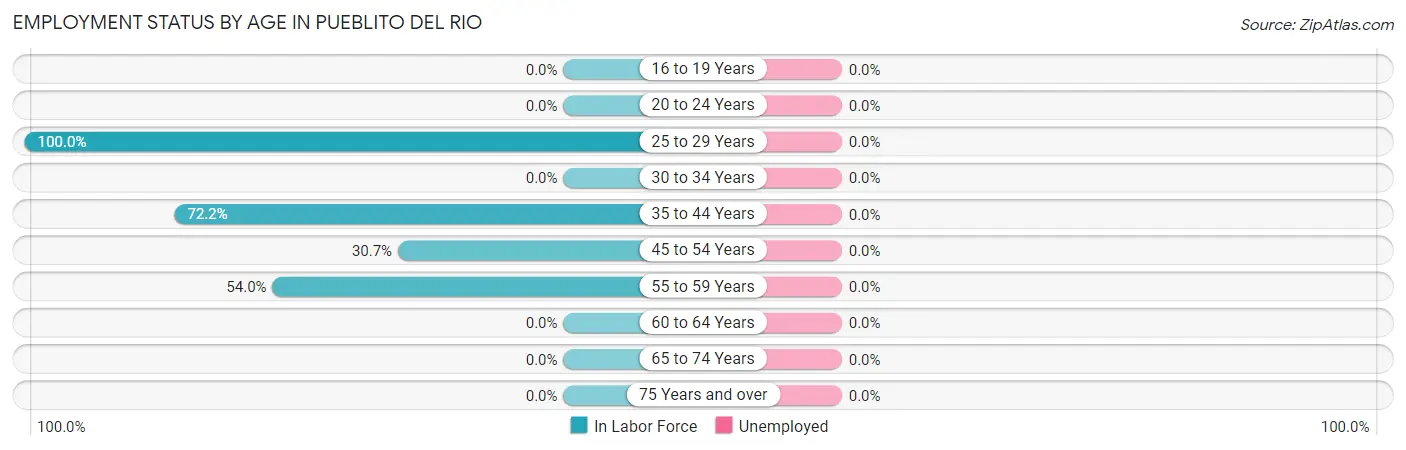
| Age Bracket | In Labor Force | Unemployed |
| 16 to 19 Years | 0 (0.0%) | 0 (0.0%) |
| 20 to 24 Years | 0 (0.0%) | 0 (0.0%) |
| 25 to 29 Years | 51 (100.0%) | 0 (0.0%) |
| 30 to 34 Years | 0 (0.0%) | 0 (0.0%) |
| 35 to 44 Years | 114 (72.2%) | 0 (0.0%) |
| 45 to 54 Years | 31 (30.7%) | 0 (0.0%) |
| 55 to 59 Years | 81 (54.0%) | 0 (0.0%) |
| 60 to 64 Years | 0 (0.0%) | 0 (0.0%) |
| 65 to 74 Years | 0 (0.0%) | 0 (0.0%) |
| 75 Years and over | 0 (0.0%) | 0 (0.0%) |
| Total | 277 (35.1%) | 0 (0.0%) |
Employment Status by Educational Attainment in Pueblito del Rio
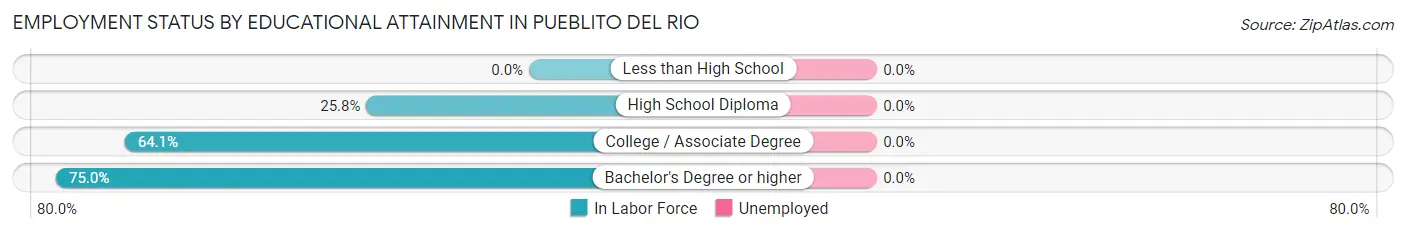
| Educational Attainment | In Labor Force | Unemployed |
| Less than High School | 0 (0.0%) | 0 (0.0%) |
| High School Diploma | 31 (25.8%) | 0 (0.0%) |
| College / Associate Degree | 141 (64.1%) | 0 (0.0%) |
| Bachelor's Degree or higher | 105 (75.0%) | 0 (0.0%) |
| Total | 277 (57.7%) | 0 (0.0%) |
Employment Occupations by Sex in Pueblito del Rio
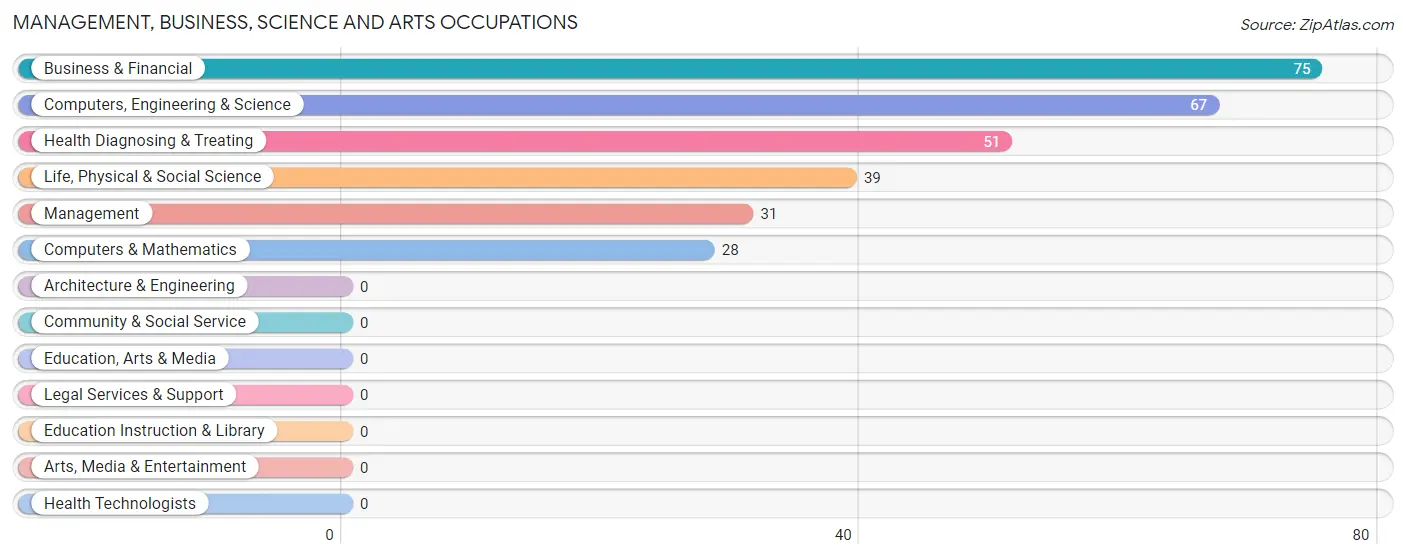
Management, Business, Science and Arts Occupations
The most common Management, Business, Science and Arts occupations in Pueblito del Rio are Business & Financial (75 | 27.1%), Computers, Engineering & Science (67 | 24.2%), Health Diagnosing & Treating (51 | 18.4%), Life, Physical & Social Science (39 | 14.1%), and Management (31 | 11.2%).
Management, Business, Science and Arts Occupations by Sex
Within the Management, Business, Science and Arts occupations in Pueblito del Rio, the most male-oriented occupations are Management (100.0%), Business & Financial (100.0%), and Computers & Mathematics (100.0%), while the most female-oriented occupations are Life, Physical & Social Science (100.0%), Health Diagnosing & Treating (100.0%), and Computers, Engineering & Science (58.2%).
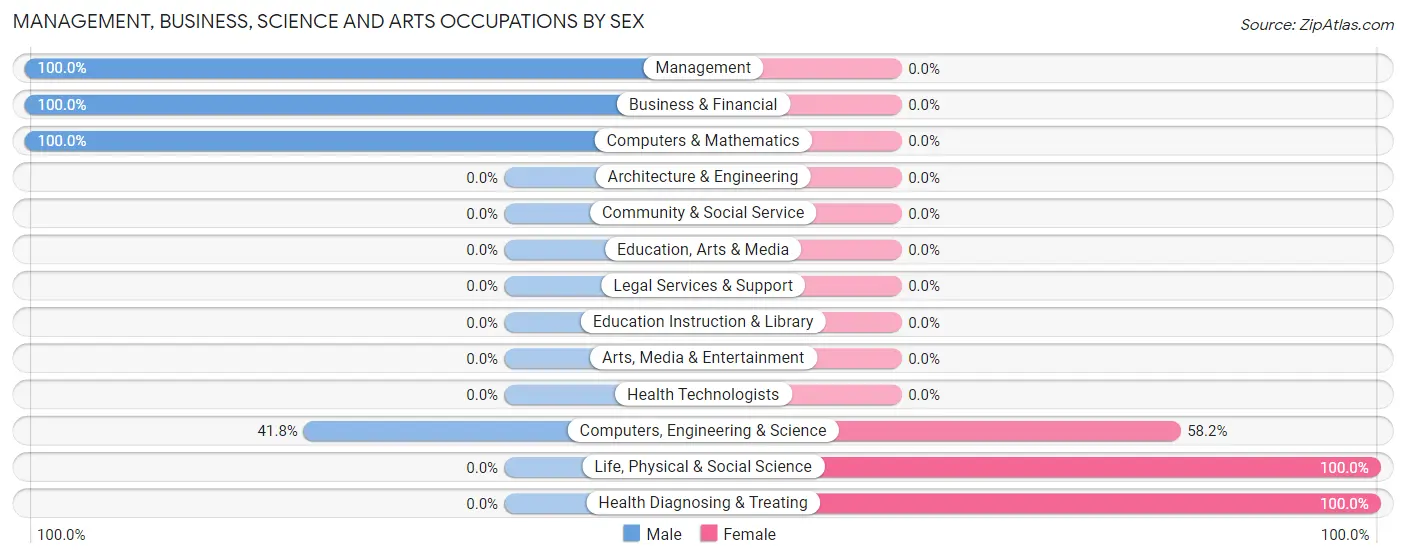
| Occupation | Male | Female |
| Management | 31 (100.0%) | 0 (0.0%) |
| Business & Financial | 75 (100.0%) | 0 (0.0%) |
| Computers, Engineering & Science | 28 (41.8%) | 39 (58.2%) |
| Computers & Mathematics | 28 (100.0%) | 0 (0.0%) |
| Architecture & Engineering | 0 (0.0%) | 0 (0.0%) |
| Life, Physical & Social Science | 0 (0.0%) | 39 (100.0%) |
| Community & Social Service | 0 (0.0%) | 0 (0.0%) |
| Education, Arts & Media | 0 (0.0%) | 0 (0.0%) |
| Legal Services & Support | 0 (0.0%) | 0 (0.0%) |
| Education Instruction & Library | 0 (0.0%) | 0 (0.0%) |
| Arts, Media & Entertainment | 0 (0.0%) | 0 (0.0%) |
| Health Diagnosing & Treating | 0 (0.0%) | 51 (100.0%) |
| Health Technologists | 0 (0.0%) | 0 (0.0%) |
| Total (Category) | 134 (59.8%) | 90 (40.2%) |
| Total (Overall) | 134 (48.4%) | 143 (51.6%) |
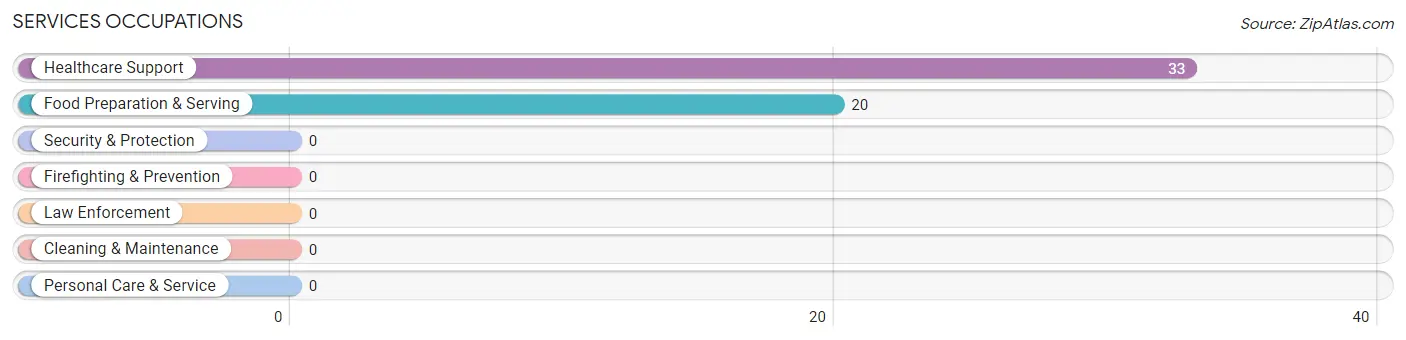
Services Occupations
The most common Services occupations in Pueblito del Rio are Healthcare Support (33 | 11.9%), and Food Preparation & Serving (20 | 7.2%).
Services Occupations by Sex
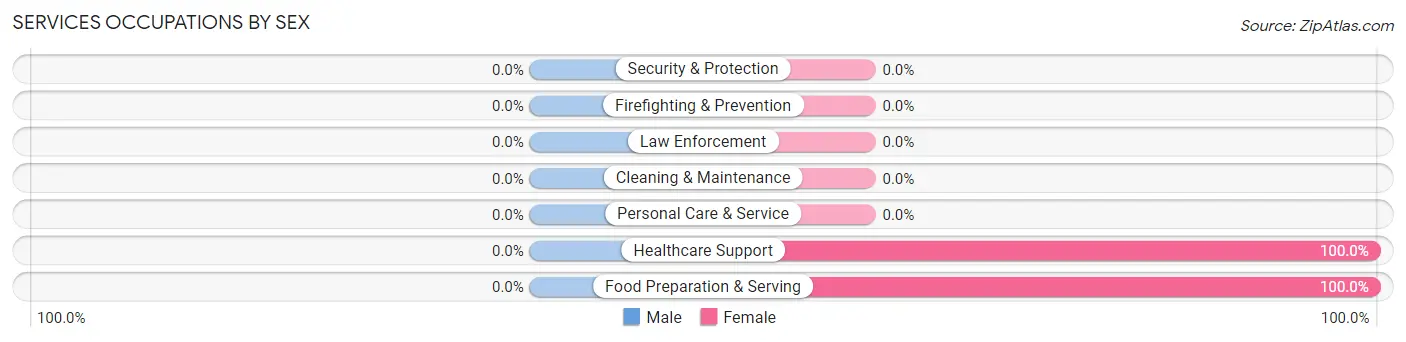
| Occupation | Male | Female |
| Healthcare Support | 0 (0.0%) | 33 (100.0%) |
| Security & Protection | 0 (0.0%) | 0 (0.0%) |
| Firefighting & Prevention | 0 (0.0%) | 0 (0.0%) |
| Law Enforcement | 0 (0.0%) | 0 (0.0%) |
| Food Preparation & Serving | 0 (0.0%) | 20 (100.0%) |
| Cleaning & Maintenance | 0 (0.0%) | 0 (0.0%) |
| Personal Care & Service | 0 (0.0%) | 0 (0.0%) |
| Total (Category) | 0 (0.0%) | 53 (100.0%) |
| Total (Overall) | 134 (48.4%) | 143 (51.6%) |
Sales and Office Occupations

Sales and Office Occupations by Sex

| Occupation | Male | Female |
| Sales & Related | 0 (0.0%) | 0 (0.0%) |
| Office & Administration | 0 (0.0%) | 0 (0.0%) |
| Total (Category) | 0 (0.0%) | 0 (0.0%) |
| Total (Overall) | 134 (48.4%) | 143 (51.6%) |
Natural Resources, Construction and Maintenance Occupations

Natural Resources, Construction and Maintenance Occupations by Sex
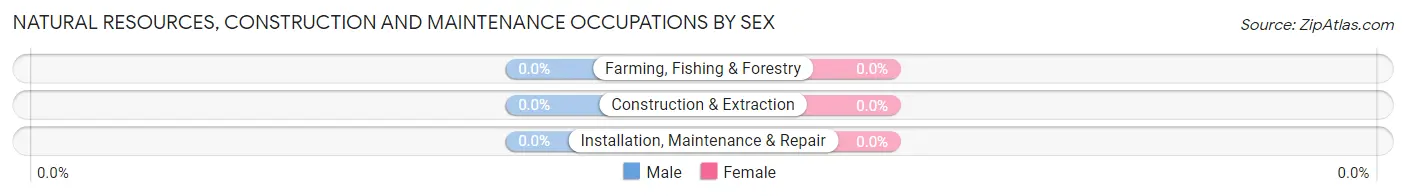
| Occupation | Male | Female |
| Farming, Fishing & Forestry | 0 (0.0%) | 0 (0.0%) |
| Construction & Extraction | 0 (0.0%) | 0 (0.0%) |
| Installation, Maintenance & Repair | 0 (0.0%) | 0 (0.0%) |
| Total (Category) | 0 (0.0%) | 0 (0.0%) |
| Total (Overall) | 134 (48.4%) | 143 (51.6%) |
Production, Transportation and Moving Occupations
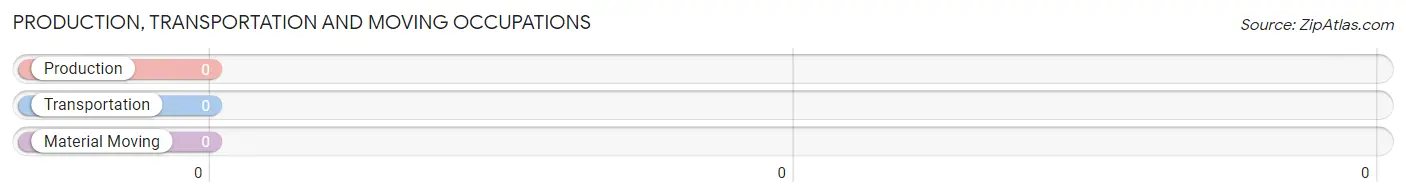
Production, Transportation and Moving Occupations by Sex

| Occupation | Male | Female |
| Production | 0 (0.0%) | 0 (0.0%) |
| Transportation | 0 (0.0%) | 0 (0.0%) |
| Material Moving | 0 (0.0%) | 0 (0.0%) |
| Total (Category) | 0 (0.0%) | 0 (0.0%) |
| Total (Overall) | 134 (48.4%) | 143 (51.6%) |
Employment Industries by Sex in Pueblito del Rio
Employment Industries in Pueblito del Rio
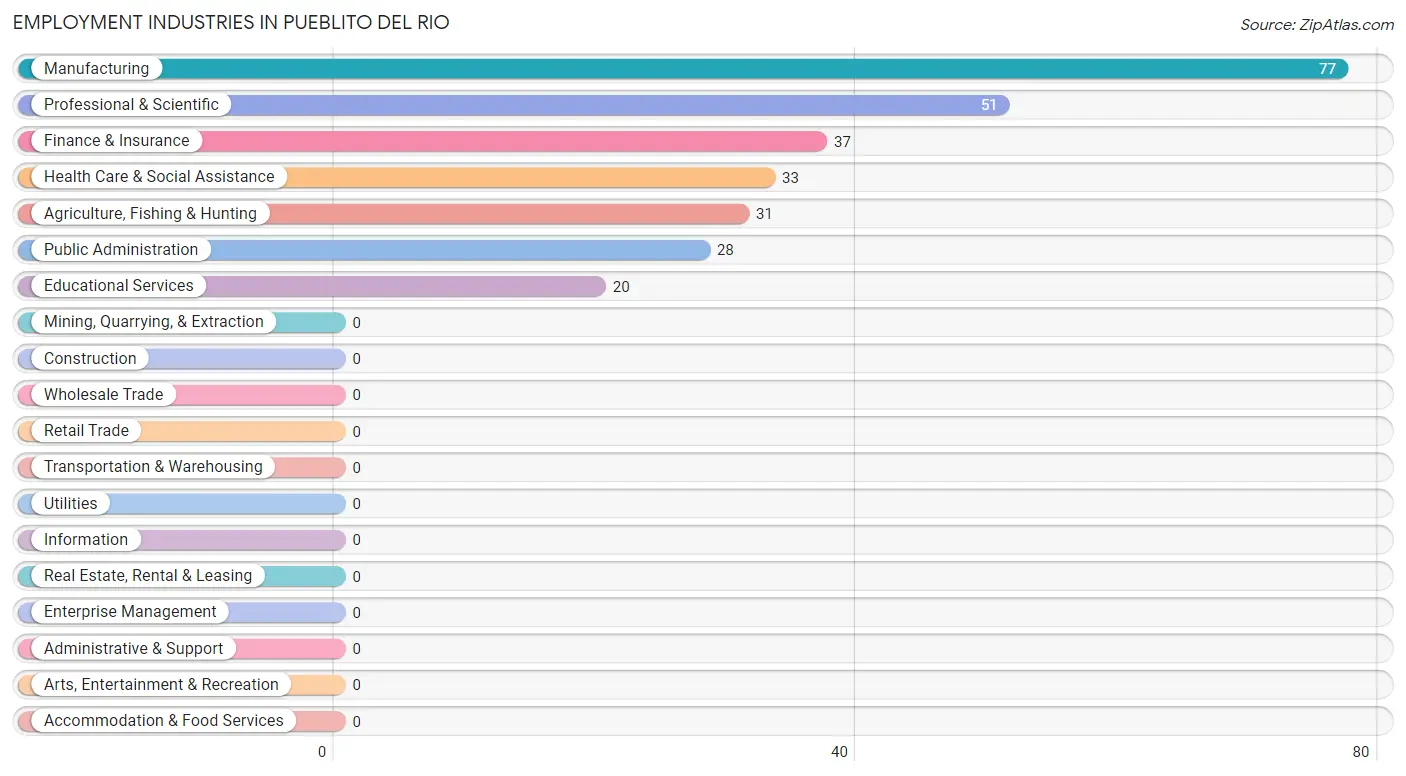
The major employment industries in Pueblito del Rio include Manufacturing (77 | 27.8%), Professional & Scientific (51 | 18.4%), Finance & Insurance (37 | 13.4%), Health Care & Social Assistance (33 | 11.9%), and Agriculture, Fishing & Hunting (31 | 11.2%).
Employment Industries by Sex in Pueblito del Rio
The Pueblito del Rio industries that see more men than women are Agriculture, Fishing & Hunting (100.0%), Finance & Insurance (100.0%), and Public Administration (100.0%), whereas the industries that tend to have a higher number of women are Professional & Scientific (100.0%), Educational Services (100.0%), and Health Care & Social Assistance (100.0%).
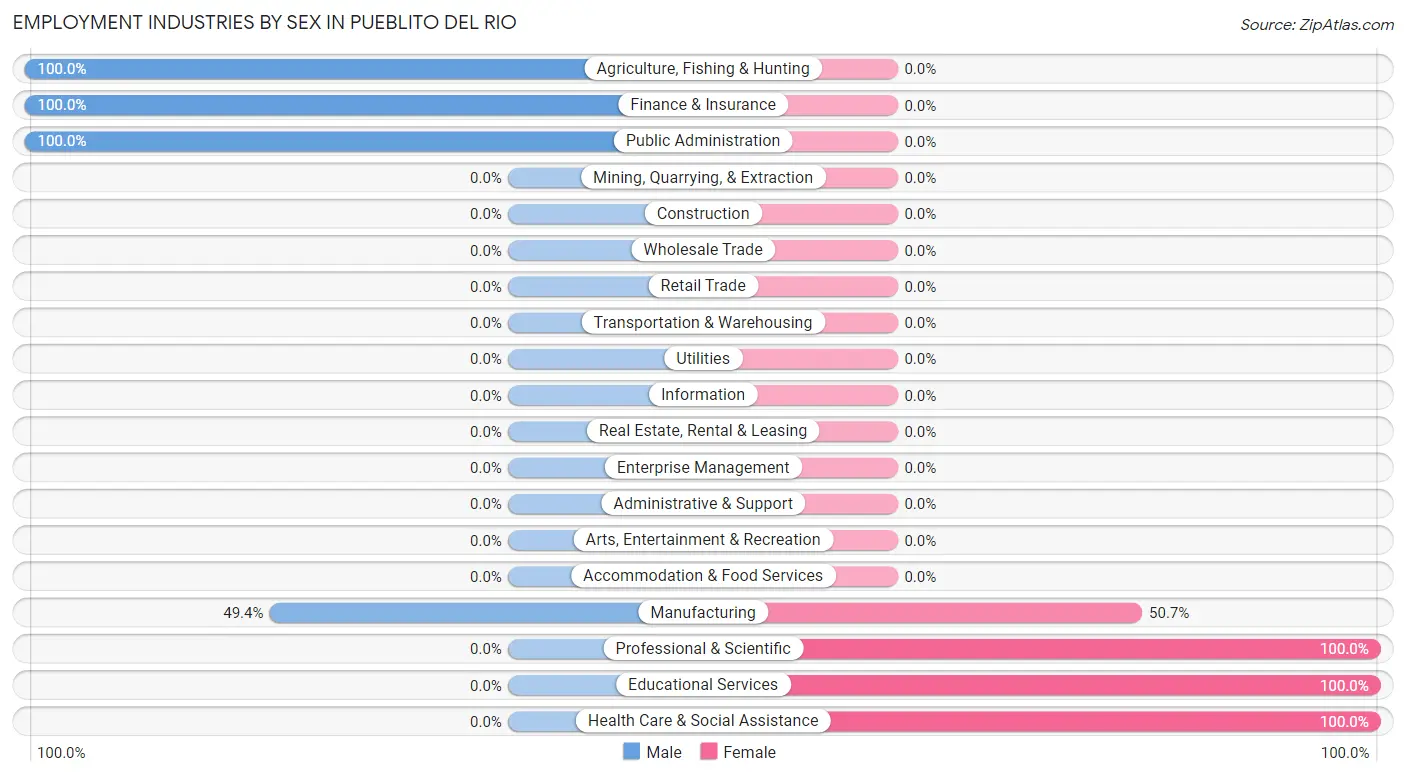
| Industry | Male | Female |
| Agriculture, Fishing & Hunting | 31 (100.0%) | 0 (0.0%) |
| Mining, Quarrying, & Extraction | 0 (0.0%) | 0 (0.0%) |
| Construction | 0 (0.0%) | 0 (0.0%) |
| Manufacturing | 38 (49.3%) | 39 (50.6%) |
| Wholesale Trade | 0 (0.0%) | 0 (0.0%) |
| Retail Trade | 0 (0.0%) | 0 (0.0%) |
| Transportation & Warehousing | 0 (0.0%) | 0 (0.0%) |
| Utilities | 0 (0.0%) | 0 (0.0%) |
| Information | 0 (0.0%) | 0 (0.0%) |
| Finance & Insurance | 37 (100.0%) | 0 (0.0%) |
| Real Estate, Rental & Leasing | 0 (0.0%) | 0 (0.0%) |
| Professional & Scientific | 0 (0.0%) | 51 (100.0%) |
| Enterprise Management | 0 (0.0%) | 0 (0.0%) |
| Administrative & Support | 0 (0.0%) | 0 (0.0%) |
| Educational Services | 0 (0.0%) | 20 (100.0%) |
| Health Care & Social Assistance | 0 (0.0%) | 33 (100.0%) |
| Arts, Entertainment & Recreation | 0 (0.0%) | 0 (0.0%) |
| Accommodation & Food Services | 0 (0.0%) | 0 (0.0%) |
| Public Administration | 28 (100.0%) | 0 (0.0%) |
| Total | 134 (48.4%) | 143 (51.6%) |
Education in Pueblito del Rio
School Enrollment in Pueblito del Rio
The most common levels of schooling among the 416 students in Pueblito del Rio are college / undergraduate (142 | 34.1%), middle school (101 | 24.3%), and nursery / preschool (61 | 14.7%).
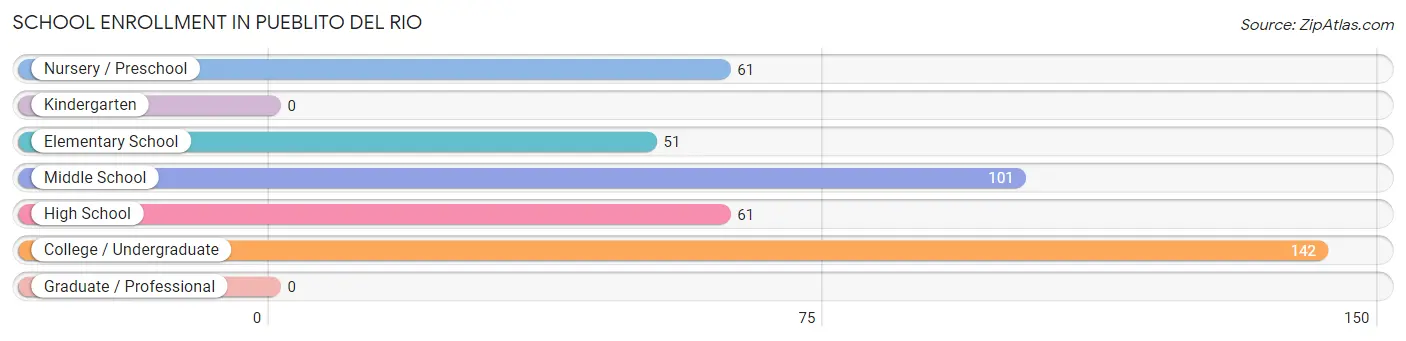
| School Level | # Students | % Students |
| Nursery / Preschool | 61 | 14.7% |
| Kindergarten | 0 | 0.0% |
| Elementary School | 51 | 12.3% |
| Middle School | 101 | 24.3% |
| High School | 61 | 14.7% |
| College / Undergraduate | 142 | 34.1% |
| Graduate / Professional | 0 | 0.0% |
| Total | 416 | 100.0% |
School Enrollment by Age by Funding Source in Pueblito del Rio
Out of a total of 416 students who are enrolled in schools in Pueblito del Rio, 151 (36.3%) attend a private institution, while the remaining 265 (63.7%) are enrolled in public schools. The age group of 25 to 34 year olds has the highest likelihood of being enrolled in private schools, with 51 (100.0% in the age bracket) enrolled. Conversely, the age group of 3 to 4 year olds has the lowest likelihood of being enrolled in a private school, with 61 (100.0% in the age bracket) attending a public institution.
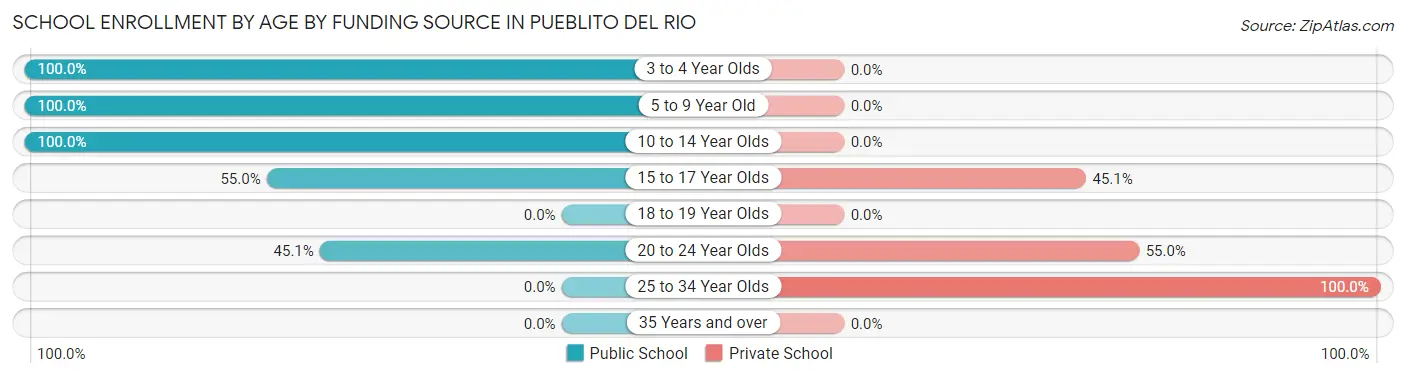
| Age Bracket | Public School | Private School |
| 3 to 4 Year Olds | 61 (100.0%) | 0 (0.0%) |
| 5 to 9 Year Old | 51 (100.0%) | 0 (0.0%) |
| 10 to 14 Year Olds | 51 (100.0%) | 0 (0.0%) |
| 15 to 17 Year Olds | 61 (54.9%) | 50 (45.1%) |
| 18 to 19 Year Olds | 0 (0.0%) | 0 (0.0%) |
| 20 to 24 Year Olds | 41 (45.1%) | 50 (54.9%) |
| 25 to 34 Year Olds | 0 (0.0%) | 51 (100.0%) |
| 35 Years and over | 0 (0.0%) | 0 (0.0%) |
| Total | 265 (63.7%) | 151 (36.3%) |
Educational Attainment by Field of Study in Pueblito del Rio
Business (101 | 72.1%), and physical & health sciences (39 | 27.9%) are the most common fields of study among 140 individuals in Pueblito del Rio who have obtained a bachelor's degree or higher.
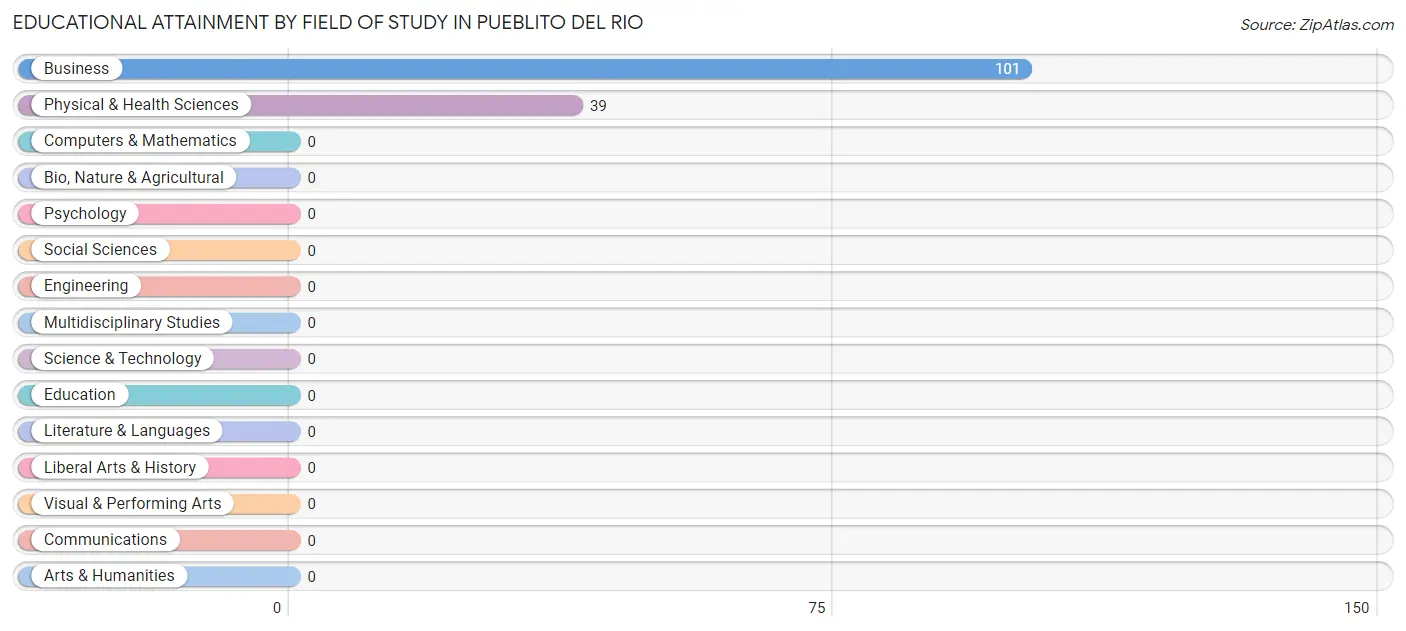
| Field of Study | # Graduates | % Graduates |
| Computers & Mathematics | 0 | 0.0% |
| Bio, Nature & Agricultural | 0 | 0.0% |
| Physical & Health Sciences | 39 | 27.9% |
| Psychology | 0 | 0.0% |
| Social Sciences | 0 | 0.0% |
| Engineering | 0 | 0.0% |
| Multidisciplinary Studies | 0 | 0.0% |
| Science & Technology | 0 | 0.0% |
| Business | 101 | 72.1% |
| Education | 0 | 0.0% |
| Literature & Languages | 0 | 0.0% |
| Liberal Arts & History | 0 | 0.0% |
| Visual & Performing Arts | 0 | 0.0% |
| Communications | 0 | 0.0% |
| Arts & Humanities | 0 | 0.0% |
| Total | 140 | 100.0% |
Transportation & Commute in Pueblito del Rio
Vehicle Availability by Sex in Pueblito del Rio
The most prevalent vehicle ownership categories in Pueblito del Rio are males with 2 vehicles (68, accounting for 50.7%) and females with 2 vehicles (0, making up 47.5%).
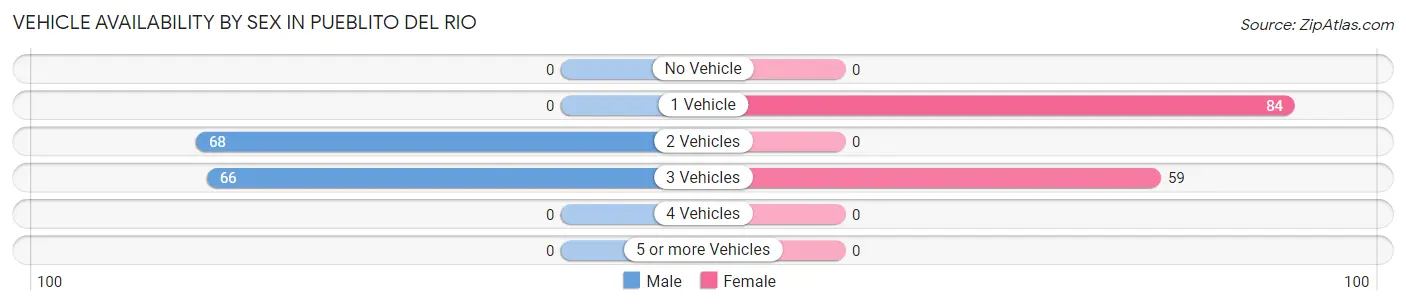
| Vehicles Available | Male | Female |
| No Vehicle | 0 (0.0%) | 0 (0.0%) |
| 1 Vehicle | 0 (0.0%) | 84 (58.7%) |
| 2 Vehicles | 68 (50.7%) | 0 (0.0%) |
| 3 Vehicles | 66 (49.2%) | 59 (41.3%) |
| 4 Vehicles | 0 (0.0%) | 0 (0.0%) |
| 5 or more Vehicles | 0 (0.0%) | 0 (0.0%) |
| Total | 134 (100.0%) | 143 (100.0%) |
Commute Time in Pueblito del Rio
The most frequently occuring commute durations in Pueblito del Rio are 15 to 19 minutes (209 commuters, 75.4%), less than 5 minutes (37 commuters, 13.4%), and 5 to 9 minutes (31 commuters, 11.2%).
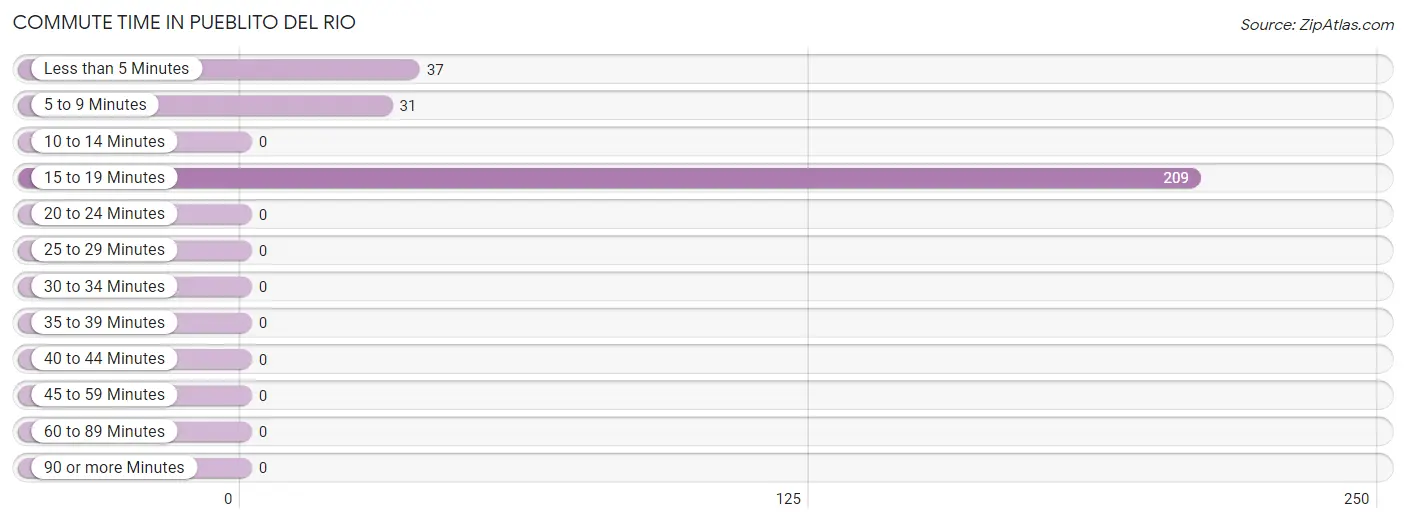
| Commute Time | # Commuters | % Commuters |
| Less than 5 Minutes | 37 | 13.4% |
| 5 to 9 Minutes | 31 | 11.2% |
| 10 to 14 Minutes | 0 | 0.0% |
| 15 to 19 Minutes | 209 | 75.4% |
| 20 to 24 Minutes | 0 | 0.0% |
| 25 to 29 Minutes | 0 | 0.0% |
| 30 to 34 Minutes | 0 | 0.0% |
| 35 to 39 Minutes | 0 | 0.0% |
| 40 to 44 Minutes | 0 | 0.0% |
| 45 to 59 Minutes | 0 | 0.0% |
| 60 to 89 Minutes | 0 | 0.0% |
| 90 or more Minutes | 0 | 0.0% |
Commute Time by Sex in Pueblito del Rio
The most common commute times in Pueblito del Rio are 15 to 19 minutes (66 commuters, 49.2%) for males and 15 to 19 minutes (143 commuters, 100.0%) for females.
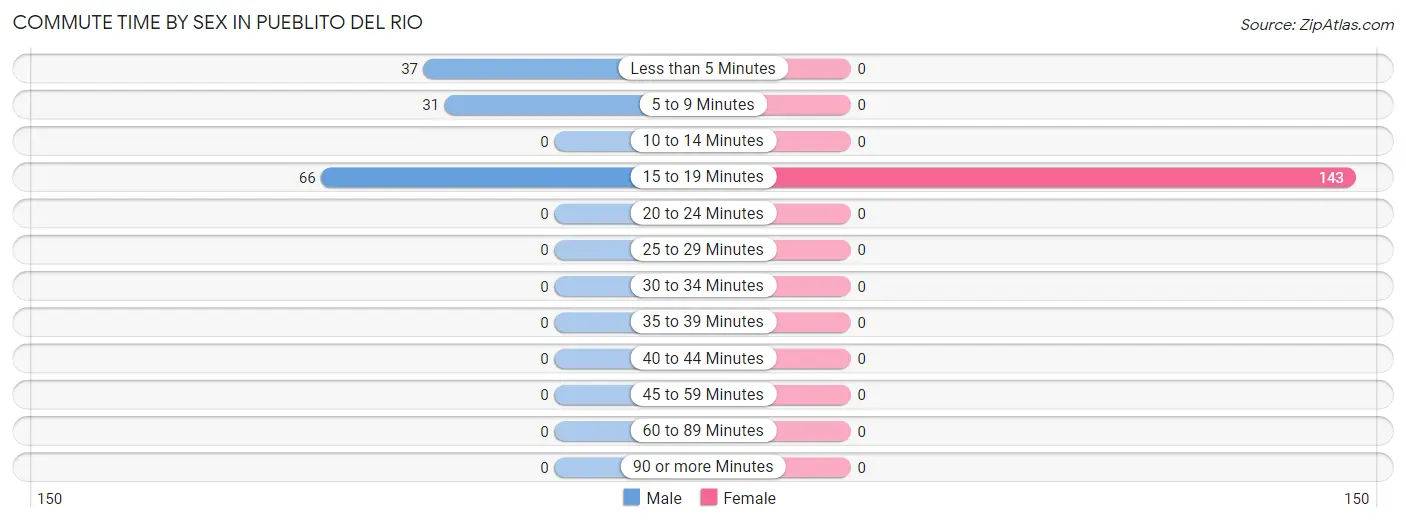
| Commute Time | Male | Female |
| Less than 5 Minutes | 37 (27.6%) | 0 (0.0%) |
| 5 to 9 Minutes | 31 (23.1%) | 0 (0.0%) |
| 10 to 14 Minutes | 0 (0.0%) | 0 (0.0%) |
| 15 to 19 Minutes | 66 (49.2%) | 143 (100.0%) |
| 20 to 24 Minutes | 0 (0.0%) | 0 (0.0%) |
| 25 to 29 Minutes | 0 (0.0%) | 0 (0.0%) |
| 30 to 34 Minutes | 0 (0.0%) | 0 (0.0%) |
| 35 to 39 Minutes | 0 (0.0%) | 0 (0.0%) |
| 40 to 44 Minutes | 0 (0.0%) | 0 (0.0%) |
| 45 to 59 Minutes | 0 (0.0%) | 0 (0.0%) |
| 60 to 89 Minutes | 0 (0.0%) | 0 (0.0%) |
| 90 or more Minutes | 0 (0.0%) | 0 (0.0%) |
Time of Departure to Work by Sex in Pueblito del Rio
The most frequent times of departure to work in Pueblito del Rio are 7:30 AM to 7:59 AM (75, 56.0%) for males and 7:00 AM to 7:29 AM (51, 35.7%) for females.
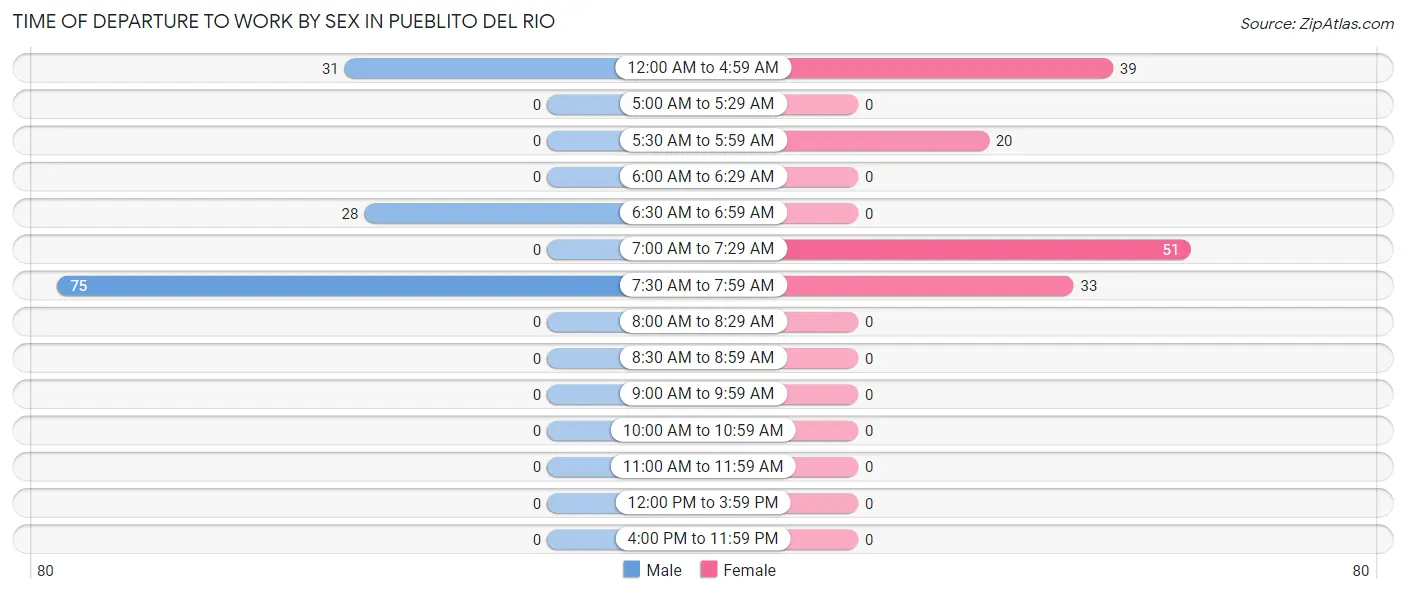
| Time of Departure | Male | Female |
| 12:00 AM to 4:59 AM | 31 (23.1%) | 39 (27.3%) |
| 5:00 AM to 5:29 AM | 0 (0.0%) | 0 (0.0%) |
| 5:30 AM to 5:59 AM | 0 (0.0%) | 20 (14.0%) |
| 6:00 AM to 6:29 AM | 0 (0.0%) | 0 (0.0%) |
| 6:30 AM to 6:59 AM | 28 (20.9%) | 0 (0.0%) |
| 7:00 AM to 7:29 AM | 0 (0.0%) | 51 (35.7%) |
| 7:30 AM to 7:59 AM | 75 (56.0%) | 33 (23.1%) |
| 8:00 AM to 8:29 AM | 0 (0.0%) | 0 (0.0%) |
| 8:30 AM to 8:59 AM | 0 (0.0%) | 0 (0.0%) |
| 9:00 AM to 9:59 AM | 0 (0.0%) | 0 (0.0%) |
| 10:00 AM to 10:59 AM | 0 (0.0%) | 0 (0.0%) |
| 11:00 AM to 11:59 AM | 0 (0.0%) | 0 (0.0%) |
| 12:00 PM to 3:59 PM | 0 (0.0%) | 0 (0.0%) |
| 4:00 PM to 11:59 PM | 0 (0.0%) | 0 (0.0%) |
| Total | 134 (100.0%) | 143 (100.0%) |
Housing Occupancy in Pueblito del Rio
Occupancy by Ownership in Pueblito del Rio
Of the total 410 dwellings in Pueblito del Rio, owner-occupied units account for 296 (72.2%), while renter-occupied units make up 114 (27.8%).
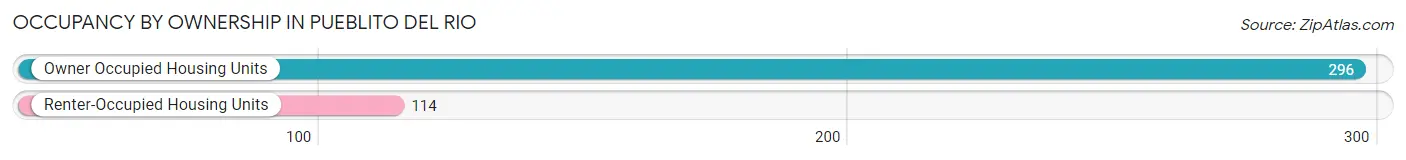
| Occupancy | # Housing Units | % Housing Units |
| Owner Occupied Housing Units | 296 | 72.2% |
| Renter-Occupied Housing Units | 114 | 27.8% |
| Total Occupied Housing Units | 410 | 100.0% |
Occupancy by Household Size in Pueblito del Rio
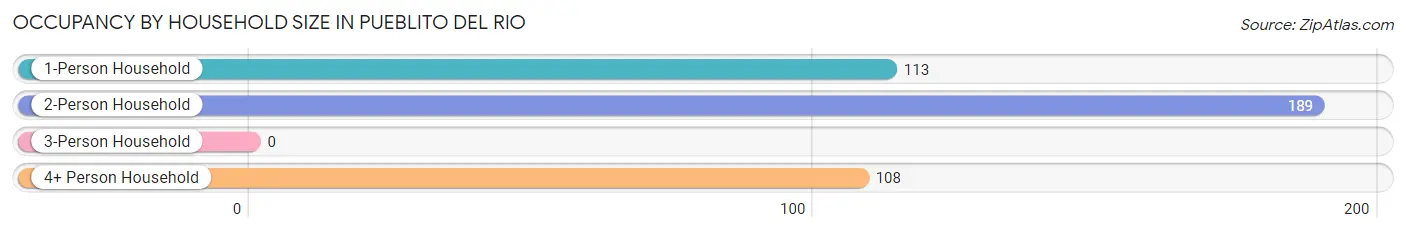
| Household Size | # Housing Units | % Housing Units |
| 1-Person Household | 113 | 27.6% |
| 2-Person Household | 189 | 46.1% |
| 3-Person Household | 0 | 0.0% |
| 4+ Person Household | 108 | 26.3% |
| Total Housing Units | 410 | 100.0% |
Occupancy by Ownership by Household Size in Pueblito del Rio
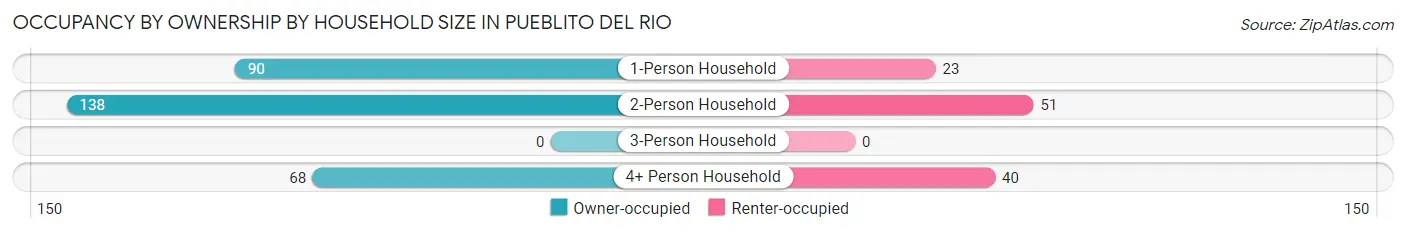
| Household Size | Owner-occupied | Renter-occupied |
| 1-Person Household | 90 (79.6%) | 23 (20.3%) |
| 2-Person Household | 138 (73.0%) | 51 (27.0%) |
| 3-Person Household | 0 (0.0%) | 0 (0.0%) |
| 4+ Person Household | 68 (63.0%) | 40 (37.0%) |
| Total Housing Units | 296 (72.2%) | 114 (27.8%) |
Occupancy by Educational Attainment in Pueblito del Rio
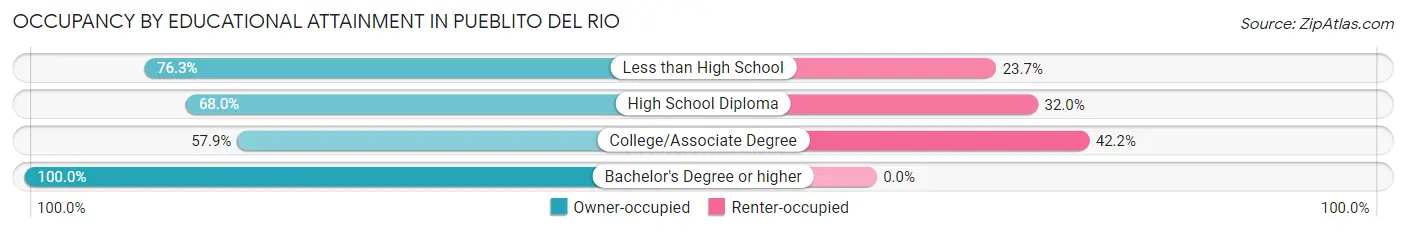
| Household Size | Owner-occupied | Renter-occupied |
| Less than High School | 74 (76.3%) | 23 (23.7%) |
| High School Diploma | 85 (68.0%) | 40 (32.0%) |
| College/Associate Degree | 70 (57.9%) | 51 (42.1%) |
| Bachelor's Degree or higher | 67 (100.0%) | 0 (0.0%) |
Occupancy by Age of Householder in Pueblito del Rio
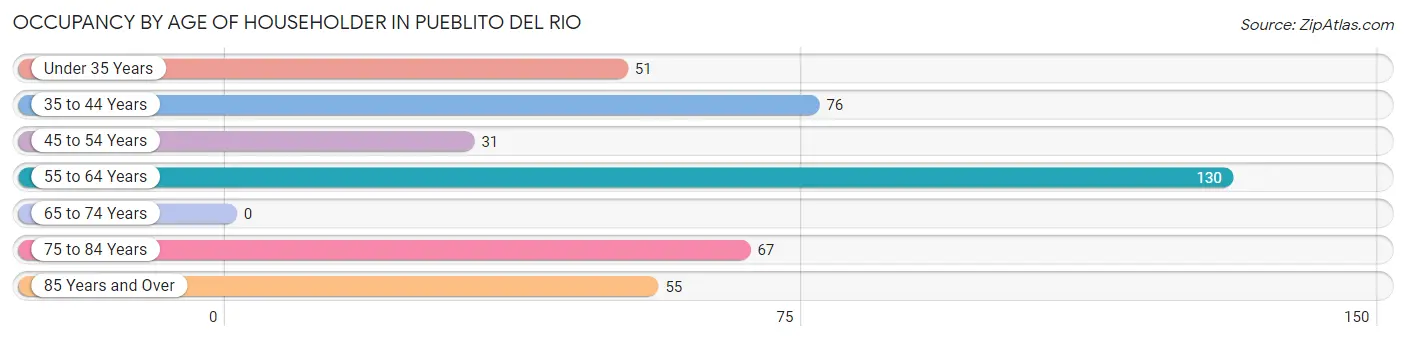
| Age Bracket | # Households | % Households |
| Under 35 Years | 51 | 12.4% |
| 35 to 44 Years | 76 | 18.5% |
| 45 to 54 Years | 31 | 7.6% |
| 55 to 64 Years | 130 | 31.7% |
| 65 to 74 Years | 0 | 0.0% |
| 75 to 84 Years | 67 | 16.3% |
| 85 Years and Over | 55 | 13.4% |
| Total | 410 | 100.0% |
Housing Finances in Pueblito del Rio
Median Income by Occupancy in Pueblito del Rio
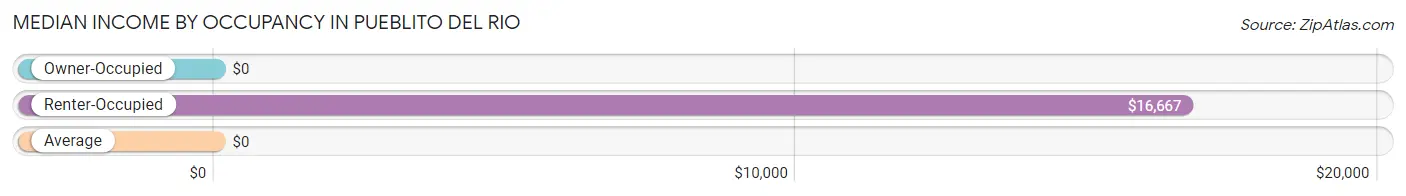
| Occupancy Type | # Households | Median Income |
| Owner-Occupied | 296 (72.2%) | $0 |
| Renter-Occupied | 114 (27.8%) | $16,667 |
| Average | 410 (100.0%) | $0 |
Occupancy by Householder Income Bracket in Pueblito del Rio
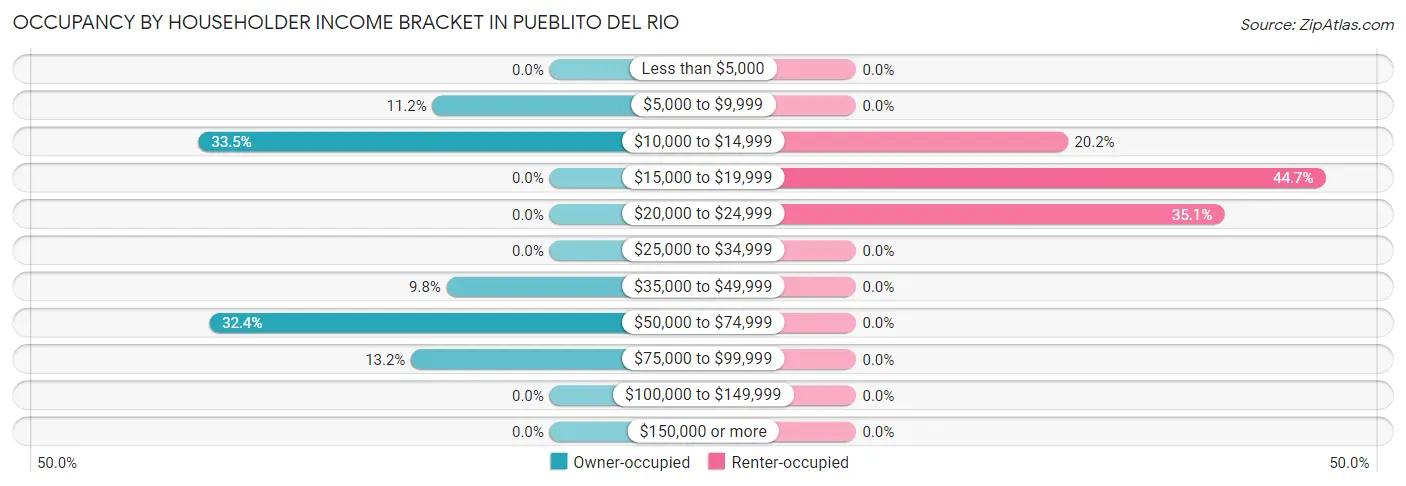
| Income Bracket | Owner-occupied | Renter-occupied |
| Less than $5,000 | 0 (0.0%) | 0 (0.0%) |
| $5,000 to $9,999 | 33 (11.2%) | 0 (0.0%) |
| $10,000 to $14,999 | 99 (33.5%) | 23 (20.2%) |
| $15,000 to $19,999 | 0 (0.0%) | 51 (44.7%) |
| $20,000 to $24,999 | 0 (0.0%) | 40 (35.1%) |
| $25,000 to $34,999 | 0 (0.0%) | 0 (0.0%) |
| $35,000 to $49,999 | 29 (9.8%) | 0 (0.0%) |
| $50,000 to $74,999 | 96 (32.4%) | 0 (0.0%) |
| $75,000 to $99,999 | 39 (13.2%) | 0 (0.0%) |
| $100,000 to $149,999 | 0 (0.0%) | 0 (0.0%) |
| $150,000 or more | 0 (0.0%) | 0 (0.0%) |
| Total | 296 (100.0%) | 114 (100.0%) |
Monthly Housing Cost Tiers in Pueblito del Rio
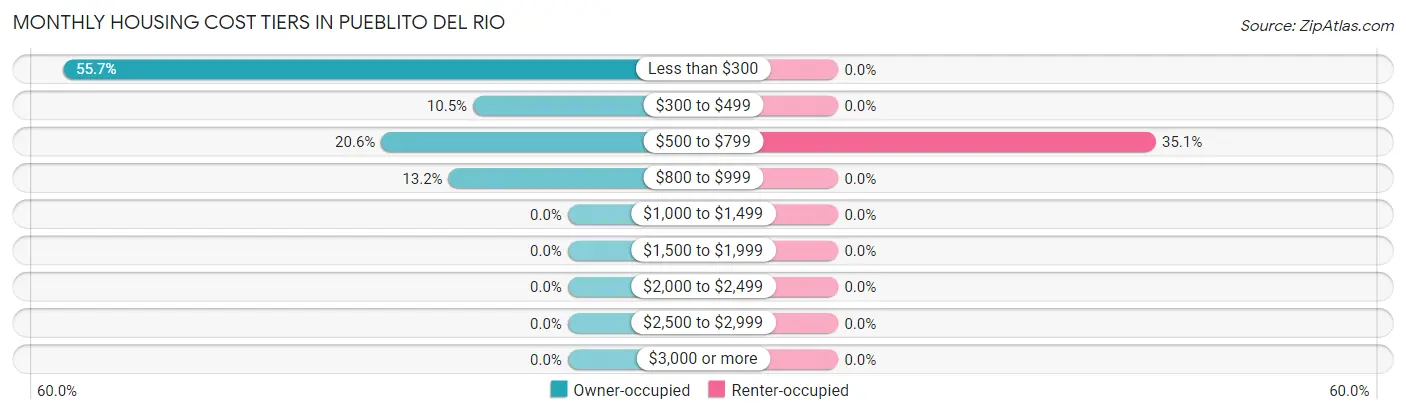
| Monthly Cost | Owner-occupied | Renter-occupied |
| Less than $300 | 165 (55.7%) | 0 (0.0%) |
| $300 to $499 | 31 (10.5%) | 0 (0.0%) |
| $500 to $799 | 61 (20.6%) | 40 (35.1%) |
| $800 to $999 | 39 (13.2%) | 0 (0.0%) |
| $1,000 to $1,499 | 0 (0.0%) | 0 (0.0%) |
| $1,500 to $1,999 | 0 (0.0%) | 0 (0.0%) |
| $2,000 to $2,499 | 0 (0.0%) | 0 (0.0%) |
| $2,500 to $2,999 | 0 (0.0%) | 0 (0.0%) |
| $3,000 or more | 0 (0.0%) | 0 (0.0%) |
| Total | 296 (100.0%) | 114 (100.0%) |
Physical Housing Characteristics in Pueblito del Rio
Housing Structures in Pueblito del Rio
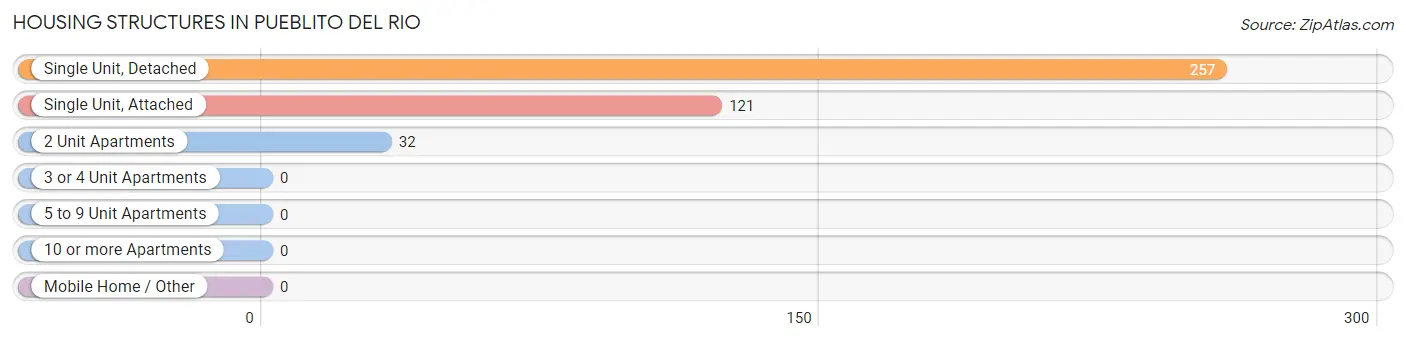
| Structure Type | # Housing Units | % Housing Units |
| Single Unit, Detached | 257 | 62.7% |
| Single Unit, Attached | 121 | 29.5% |
| 2 Unit Apartments | 32 | 7.8% |
| 3 or 4 Unit Apartments | 0 | 0.0% |
| 5 to 9 Unit Apartments | 0 | 0.0% |
| 10 or more Apartments | 0 | 0.0% |
| Mobile Home / Other | 0 | 0.0% |
| Total | 410 | 100.0% |
Housing Structures by Occupancy in Pueblito del Rio
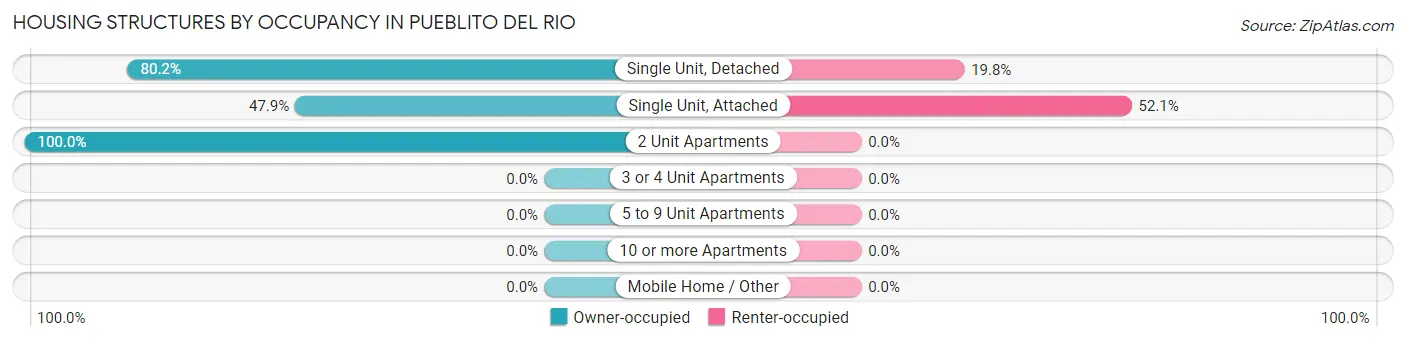
| Structure Type | Owner-occupied | Renter-occupied |
| Single Unit, Detached | 206 (80.2%) | 51 (19.8%) |
| Single Unit, Attached | 58 (47.9%) | 63 (52.1%) |
| 2 Unit Apartments | 32 (100.0%) | 0 (0.0%) |
| 3 or 4 Unit Apartments | 0 (0.0%) | 0 (0.0%) |
| 5 to 9 Unit Apartments | 0 (0.0%) | 0 (0.0%) |
| 10 or more Apartments | 0 (0.0%) | 0 (0.0%) |
| Mobile Home / Other | 0 (0.0%) | 0 (0.0%) |
| Total | 296 (72.2%) | 114 (27.8%) |
Housing Structures by Number of Rooms in Pueblito del Rio
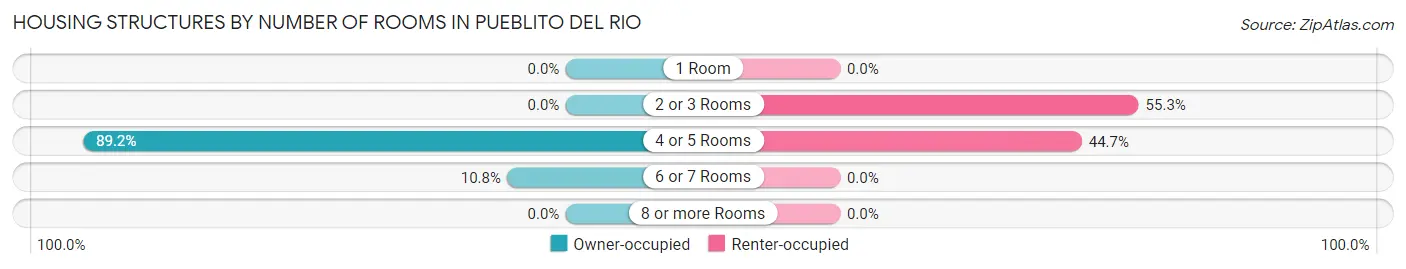
| Number of Rooms | Owner-occupied | Renter-occupied |
| 1 Room | 0 (0.0%) | 0 (0.0%) |
| 2 or 3 Rooms | 0 (0.0%) | 63 (55.3%) |
| 4 or 5 Rooms | 264 (89.2%) | 51 (44.7%) |
| 6 or 7 Rooms | 32 (10.8%) | 0 (0.0%) |
| 8 or more Rooms | 0 (0.0%) | 0 (0.0%) |
| Total | 296 (100.0%) | 114 (100.0%) |
Housing Structure by Heating Type in Pueblito del Rio
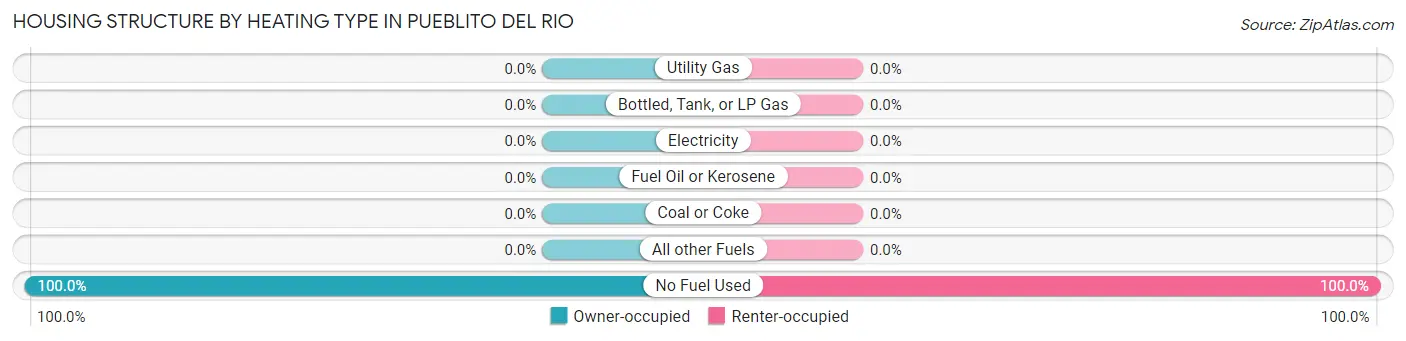
| Heating Type | Owner-occupied | Renter-occupied |
| Utility Gas | 0 (0.0%) | 0 (0.0%) |
| Bottled, Tank, or LP Gas | 0 (0.0%) | 0 (0.0%) |
| Electricity | 0 (0.0%) | 0 (0.0%) |
| Fuel Oil or Kerosene | 0 (0.0%) | 0 (0.0%) |
| Coal or Coke | 0 (0.0%) | 0 (0.0%) |
| All other Fuels | 0 (0.0%) | 0 (0.0%) |
| No Fuel Used | 296 (100.0%) | 114 (100.0%) |
| Total | 296 (100.0%) | 114 (100.0%) |
Household Vehicle Usage in Pueblito del Rio
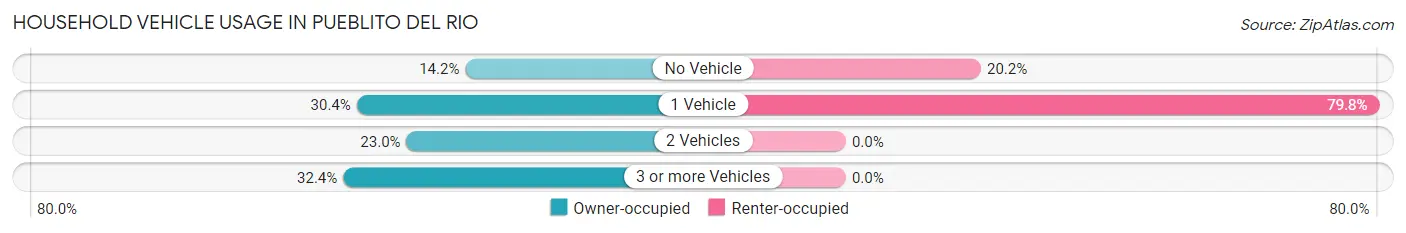
| Vehicles per Household | Owner-occupied | Renter-occupied |
| No Vehicle | 42 (14.2%) | 23 (20.2%) |
| 1 Vehicle | 90 (30.4%) | 91 (79.8%) |
| 2 Vehicles | 68 (23.0%) | 0 (0.0%) |
| 3 or more Vehicles | 96 (32.4%) | 0 (0.0%) |
| Total | 296 (100.0%) | 114 (100.0%) |
Real Estate & Mortgages in Pueblito del Rio
Real Estate and Mortgage Overview in Pueblito del Rio
| Characteristic | Without Mortgage | With Mortgage |
| Housing Units | 196 | 100 |
| Median Property Value | $107,100 | $120,500 |
| Median Household Income | - | - |
| Monthly Housing Costs | - | - |
| Real Estate Taxes | - | - |
Property Value by Mortgage Status in Pueblito del Rio
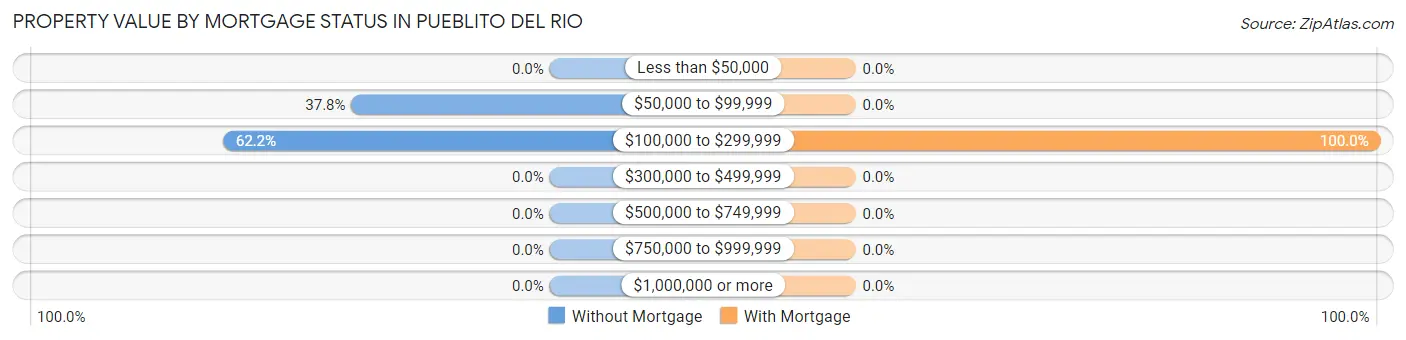
| Property Value | Without Mortgage | With Mortgage |
| Less than $50,000 | 0 (0.0%) | 0 (0.0%) |
| $50,000 to $99,999 | 74 (37.8%) | 0 (0.0%) |
| $100,000 to $299,999 | 122 (62.2%) | 100 (100.0%) |
| $300,000 to $499,999 | 0 (0.0%) | 0 (0.0%) |
| $500,000 to $749,999 | 0 (0.0%) | 0 (0.0%) |
| $750,000 to $999,999 | 0 (0.0%) | 0 (0.0%) |
| $1,000,000 or more | 0 (0.0%) | 0 (0.0%) |
| Total | 196 (100.0%) | 100 (100.0%) |
Household Income by Mortgage Status in Pueblito del Rio
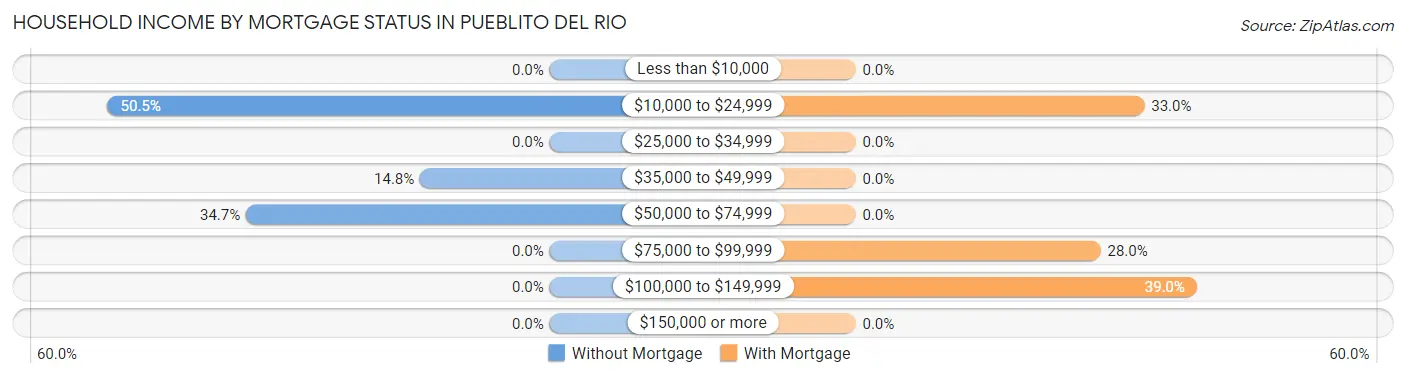
| Household Income | Without Mortgage | With Mortgage |
| Less than $10,000 | 0 (0.0%) | 0 (0.0%) |
| $10,000 to $24,999 | 99 (50.5%) | 33 (33.0%) |
| $25,000 to $34,999 | 0 (0.0%) | 0 (0.0%) |
| $35,000 to $49,999 | 29 (14.8%) | 0 (0.0%) |
| $50,000 to $74,999 | 68 (34.7%) | 0 (0.0%) |
| $75,000 to $99,999 | 0 (0.0%) | 28 (28.0%) |
| $100,000 to $149,999 | 0 (0.0%) | 39 (39.0%) |
| $150,000 or more | 0 (0.0%) | 0 (0.0%) |
| Total | 196 (100.0%) | 100 (100.0%) |
Property Value to Household Income Ratio in Pueblito del Rio
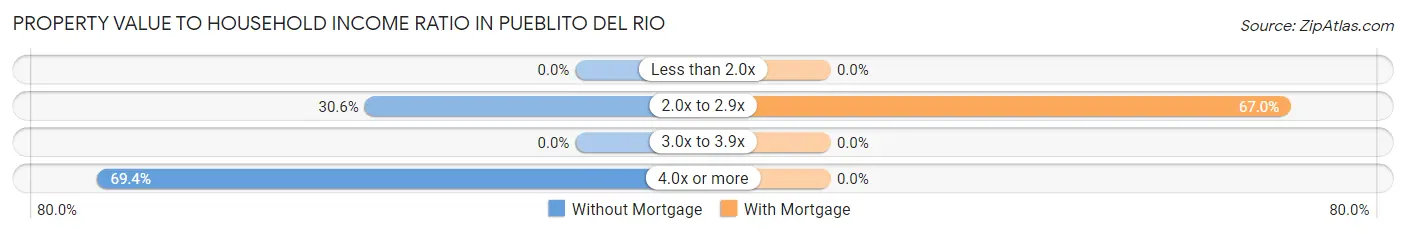
| Value-to-Income Ratio | Without Mortgage | With Mortgage |
| Less than 2.0x | 0 (0.0%) | 0 (0.0%) |
| 2.0x to 2.9x | 60 (30.6%) | 67 (67.0%) |
| 3.0x to 3.9x | 0 (0.0%) | 0 (0.0%) |
| 4.0x or more | 136 (69.4%) | 0 (0.0%) |
| Total | 196 (100.0%) | 100 (100.0%) |
Real Estate Taxes by Mortgage Status in Pueblito del Rio
| Property Taxes | Without Mortgage | With Mortgage |
| Less than $800 | 0 (0.0%) | 0 (0.0%) |
| $800 to $1,499 | 0 (0.0%) | 0 (0.0%) |
| $800 to $1,499 | 0 (0.0%) | 0 (0.0%) |
| Total | 196 (100.0%) | 100 (100.0%) |
Health & Disability in Pueblito del Rio
Health Insurance Coverage by Age in Pueblito del Rio
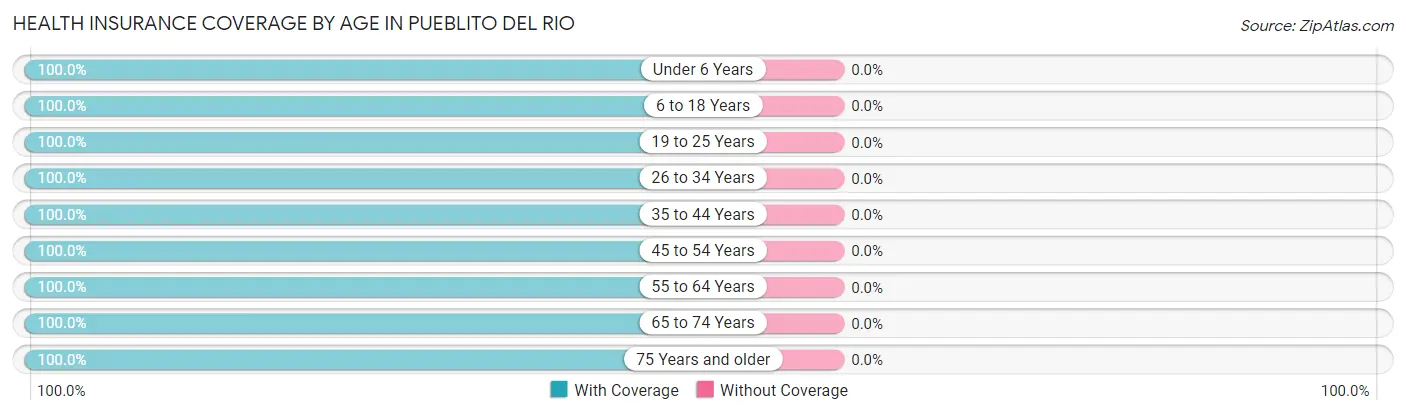
| Age Bracket | With Coverage | Without Coverage |
| Under 6 Years | 61 (100.0%) | 0 (0.0%) |
| 6 to 18 Years | 213 (100.0%) | 0 (0.0%) |
| 19 to 25 Years | 91 (100.0%) | 0 (0.0%) |
| 26 to 34 Years | 51 (100.0%) | 0 (0.0%) |
| 35 to 44 Years | 158 (100.0%) | 0 (0.0%) |
| 45 to 54 Years | 101 (100.0%) | 0 (0.0%) |
| 55 to 64 Years | 170 (100.0%) | 0 (0.0%) |
| 65 to 74 Years | 97 (100.0%) | 0 (0.0%) |
| 75 Years and older | 122 (100.0%) | 0 (0.0%) |
| Total | 1,064 (100.0%) | 0 (0.0%) |
Health Insurance Coverage by Citizenship Status in Pueblito del Rio

| Citizenship Status | With Coverage | Without Coverage |
| Native Born | 61 (100.0%) | 0 (0.0%) |
| Foreign Born, Citizen | 213 (100.0%) | 0 (0.0%) |
| Foreign Born, not a Citizen | 91 (100.0%) | 0 (0.0%) |
Health Insurance Coverage by Household Income in Pueblito del Rio
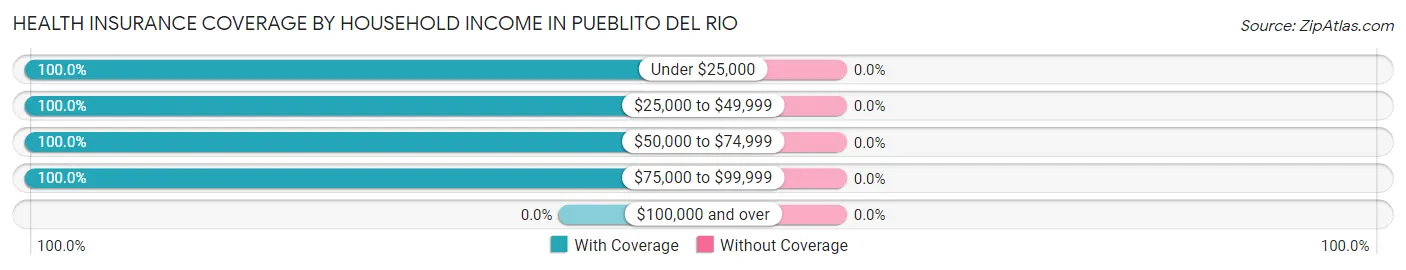
| Household Income | With Coverage | Without Coverage |
| Under $25,000 | 484 (100.0%) | 0 (0.0%) |
| $25,000 to $49,999 | 49 (100.0%) | 0 (0.0%) |
| $50,000 to $74,999 | 454 (100.0%) | 0 (0.0%) |
| $75,000 to $99,999 | 77 (100.0%) | 0 (0.0%) |
| $100,000 and over | 0 (0.0%) | 0 (0.0%) |
Public vs Private Health Insurance Coverage by Age in Pueblito del Rio
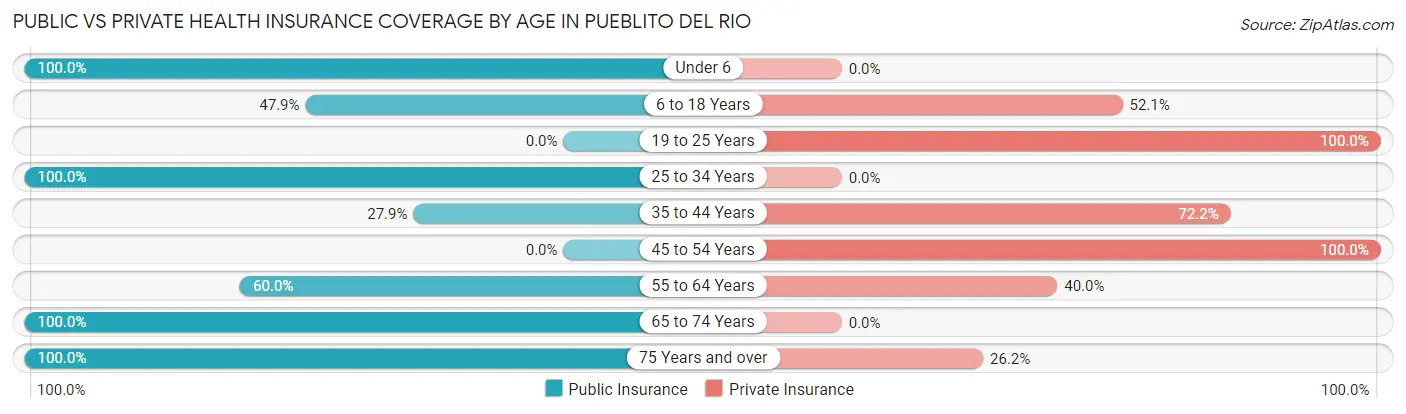
| Age Bracket | Public Insurance | Private Insurance |
| Under 6 | 61 (100.0%) | 0 (0.0%) |
| 6 to 18 Years | 102 (47.9%) | 111 (52.1%) |
| 19 to 25 Years | 0 (0.0%) | 91 (100.0%) |
| 25 to 34 Years | 51 (100.0%) | 0 (0.0%) |
| 35 to 44 Years | 44 (27.9%) | 114 (72.2%) |
| 45 to 54 Years | 0 (0.0%) | 101 (100.0%) |
| 55 to 64 Years | 102 (60.0%) | 68 (40.0%) |
| 65 to 74 Years | 97 (100.0%) | 0 (0.0%) |
| 75 Years and over | 122 (100.0%) | 32 (26.2%) |
| Total | 579 (54.4%) | 517 (48.6%) |
Disability Status by Sex by Age in Pueblito del Rio
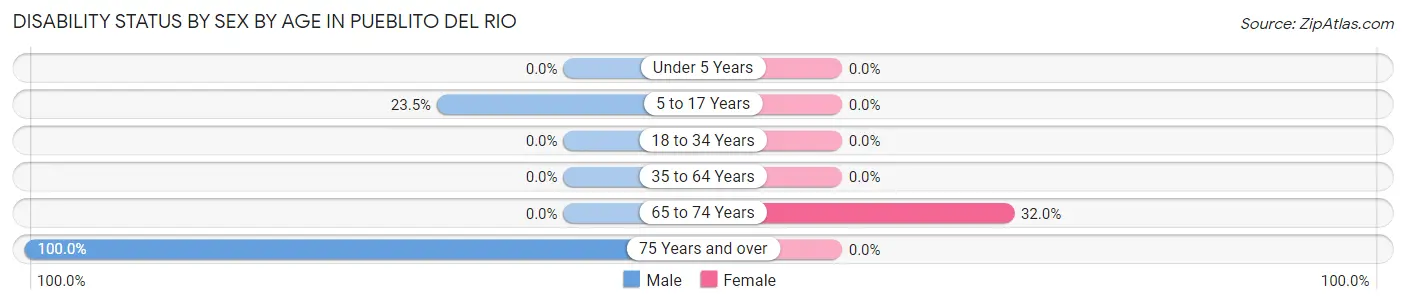
| Age Bracket | Male | Female |
| Under 5 Years | 0 (0.0%) | 0 (0.0%) |
| 5 to 17 Years | 50 (23.5%) | 0 (0.0%) |
| 18 to 34 Years | 0 (0.0%) | 0 (0.0%) |
| 35 to 64 Years | 0 (0.0%) | 0 (0.0%) |
| 65 to 74 Years | 0 (0.0%) | 31 (32.0%) |
| 75 Years and over | 42 (100.0%) | 0 (0.0%) |
Disability Class by Sex by Age in Pueblito del Rio
Disability Class: Hearing Difficulty
| Age Bracket | Male | Female |
| Under 5 Years | 0 (0.0%) | 0 (0.0%) |
| 5 to 17 Years | 0 (0.0%) | 0 (0.0%) |
| 18 to 34 Years | 0 (0.0%) | 0 (0.0%) |
| 35 to 64 Years | 0 (0.0%) | 0 (0.0%) |
| 65 to 74 Years | 0 (0.0%) | 0 (0.0%) |
| 75 Years and over | 0 (0.0%) | 0 (0.0%) |
Disability Class: Vision Difficulty
| Age Bracket | Male | Female |
| Under 5 Years | 0 (0.0%) | 0 (0.0%) |
| 5 to 17 Years | 0 (0.0%) | 0 (0.0%) |
| 18 to 34 Years | 0 (0.0%) | 0 (0.0%) |
| 35 to 64 Years | 0 (0.0%) | 0 (0.0%) |
| 65 to 74 Years | 0 (0.0%) | 0 (0.0%) |
| 75 Years and over | 0 (0.0%) | 0 (0.0%) |
Disability Class: Cognitive Difficulty
| Age Bracket | Male | Female |
| 5 to 17 Years | 0 (0.0%) | 0 (0.0%) |
| 18 to 34 Years | 0 (0.0%) | 0 (0.0%) |
| 35 to 64 Years | 0 (0.0%) | 0 (0.0%) |
| 65 to 74 Years | 0 (0.0%) | 0 (0.0%) |
| 75 Years and over | 0 (0.0%) | 0 (0.0%) |
Disability Class: Ambulatory Difficulty
| Age Bracket | Male | Female |
| 5 to 17 Years | 0 (0.0%) | 0 (0.0%) |
| 18 to 34 Years | 0 (0.0%) | 0 (0.0%) |
| 35 to 64 Years | 0 (0.0%) | 0 (0.0%) |
| 65 to 74 Years | 0 (0.0%) | 0 (0.0%) |
| 75 Years and over | 0 (0.0%) | 0 (0.0%) |
Disability Class: Self-Care Difficulty

| Age Bracket | Male | Female |
| 5 to 17 Years | 50 (23.5%) | 0 (0.0%) |
| 18 to 34 Years | 0 (0.0%) | 0 (0.0%) |
| 35 to 64 Years | 0 (0.0%) | 0 (0.0%) |
| 65 to 74 Years | 0 (0.0%) | 0 (0.0%) |
| 75 Years and over | 42 (100.0%) | 0 (0.0%) |
Technology Access in Pueblito del Rio
Computing Device Access in Pueblito del Rio
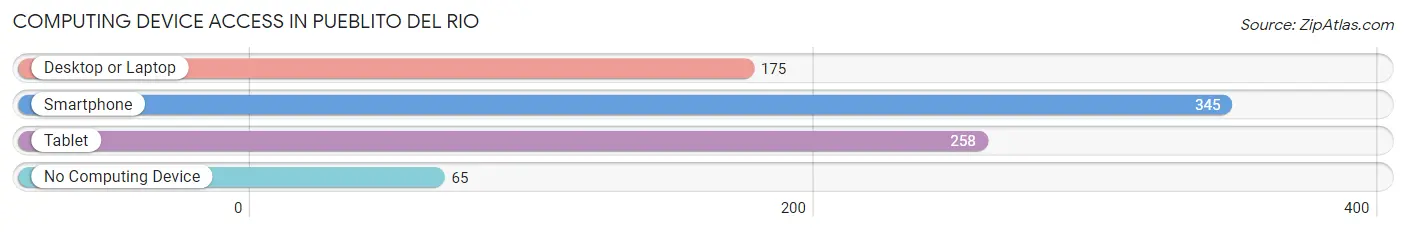
| Device Type | # Households | % Households |
| Desktop or Laptop | 175 | 42.7% |
| Smartphone | 345 | 84.2% |
| Tablet | 258 | 62.9% |
| No Computing Device | 65 | 15.9% |
| Total | 410 | 100.0% |
Internet Access in Pueblito del Rio
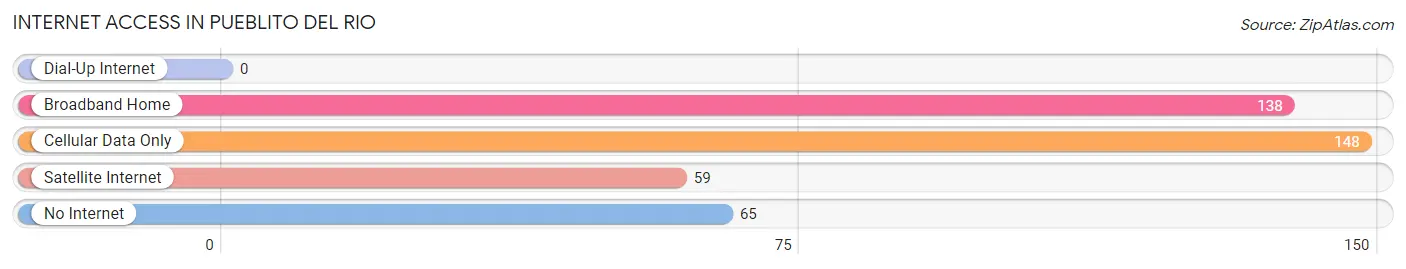
| Internet Type | # Households | % Households |
| Dial-Up Internet | 0 | 0.0% |
| Broadband Home | 138 | 33.7% |
| Cellular Data Only | 148 | 36.1% |
| Satellite Internet | 59 | 14.4% |
| No Internet | 65 | 15.9% |
| Total | 410 | 100.0% |
Pueblito del Rio Summary
Pueblito del Río is a small town located in the municipality of San Juan, Puerto Rico. It is situated on the banks of the Río Grande de Loíza, which is the largest river in Puerto Rico. The town is home to approximately 1,500 people and is known for its rich history, diverse geography, and vibrant economy.
History
Pueblito del Río has a long and rich history that dates back to the 16th century. The town was founded in 1520 by Spanish settlers who were looking for a place to settle and cultivate the land. The town was originally called “Pueblo de los Indios”, which translates to “Village of the Indians”. The town was later renamed “Pueblito del Río”, which translates to “Little Village of the River”.
The town was an important trading post for the Spanish during the colonial period. It was also a major port for the transportation of goods and people between Puerto Rico and the mainland. During the 19th century, the town was a major center for the production of sugar cane and tobacco.
In the early 20th century, the town experienced a period of economic decline due to the decline of the sugar industry. However, the town was able to recover and become a major center for the production of coffee and other agricultural products.
Geography
Pueblito del Río is located in the municipality of San Juan, Puerto Rico. It is situated on the banks of the Río Grande de Loíza, which is the largest river in Puerto Rico. The town is surrounded by lush tropical forests and is home to a variety of wildlife.
The town is located at an elevation of approximately 200 feet above sea level. The climate is tropical and humid, with temperatures ranging from the mid-70s to the mid-80s Fahrenheit.
Economy
Pueblito del Río has a vibrant economy that is largely based on agriculture and tourism. The town is home to several small businesses, including restaurants, cafes, and souvenir shops. The town is also home to a number of small farms that produce coffee, bananas, and other agricultural products.
The town is also a popular tourist destination due to its proximity to San Juan and its beautiful beaches. Tourists come to the town to enjoy the beaches, explore the forests, and experience the local culture.
Demographics
As of the 2010 census, the population of Pueblito del Río was 1,500. The population is primarily of Puerto Rican descent, with a small percentage of other ethnicities. The town is predominantly Roman Catholic, with a small percentage of other religious affiliations.
The median household income in Pueblito del Río is approximately $20,000 per year. The town has a high rate of poverty, with approximately 40% of the population living below the poverty line.
Conclusion
Pueblito del Río is a small town located in the municipality of San Juan, Puerto Rico. It is situated on the banks of the Río Grande de Loíza and is home to approximately 1,500 people. The town has a long and rich history, diverse geography, and vibrant economy. The town is primarily of Puerto Rican descent and is predominantly Roman Catholic. The town has a high rate of poverty, with approximately 40% of the population living below the poverty line. Despite this, the town is a popular tourist destination due to its proximity to San Juan and its beautiful beaches.
Common Questions
What is Per Capita Income in Pueblito del Rio?
Per Capita income in Pueblito del Rio is $12,987.
What is Inequality or Gini Index in Pueblito del Rio?
Inequality or Gini Index in Pueblito del Rio is 0.42.
What is the Total Population of Pueblito del Rio?
Total Population of Pueblito del Rio is 1,064.
What is the Total Male Population of Pueblito del Rio?
Total Male Population of Pueblito del Rio is 610.
What is the Total Female Population of Pueblito del Rio?
Total Female Population of Pueblito del Rio is 454.
What is the Ratio of Males per 100 Females in Pueblito del Rio?
There are 134.36 Males per 100 Females in Pueblito del Rio.
What is the Ratio of Females per 100 Males in Pueblito del Rio?
There are 74.43 Females per 100 Males in Pueblito del Rio.
What is the Median Population Age in Pueblito del Rio?
Median Population Age in Pueblito del Rio is 41.9 Years.
What is the Average Family Size in Pueblito del Rio
Average Family Size in Pueblito del Rio is 3.2 People.
What is the Average Household Size in Pueblito del Rio
Average Household Size in Pueblito del Rio is 2.6 People.
How Large is the Labor Force in Pueblito del Rio?
There are 277 People in the Labor Forcein in Pueblito del Rio.
What is the Percentage of People in the Labor Force in Pueblito del Rio?
35.1% of People are in the Labor Force in Pueblito del Rio.