Quebrada del Agua, PR Map & Demographics
Quebrada del Agua Map
Quebrada del Agua Overview
$10,236
PER CAPITA INCOME
$20,208
AVG FAMILY INCOME
23.6%
WAGE / INCOME GAP [ % ]
76.4¢/ $1
WAGE / INCOME GAP [ $ ]
0.43
INEQUALITY / GINI INDEX
1,167
TOTAL POPULATION
700
MALE POPULATION
467
FEMALE POPULATION
149.89
MALES / 100 FEMALES
66.71
FEMALES / 100 MALES
29.3
MEDIAN AGE
3.6
AVG FAMILY SIZE
3.4
AVG HOUSEHOLD SIZE
457
LABOR FORCE [ PEOPLE ]
57.3%
PERCENT IN LABOR FORCE
5.5%
UNEMPLOYMENT RATE
Income in Quebrada del Agua
Income Overview in Quebrada del Agua
| Characteristic | Number | Measure |
| Per Capita Income | 1,167 | $10,236 |
| Median Family Income | 275 | $20,208 |
| Mean Family Income | 275 | $30,158 |
| Median Household Income | 331 | $0 |
| Mean Household Income | 331 | $30,727 |
| Income Deficit | 275 | $0 |
| Wage / Income Gap (%) | 1,167 | 23.58% |
| Wage / Income Gap ($) | 1,167 | 76.42¢ per $1 |
| Gini / Inequality Index | 1,167 | 0.43 |
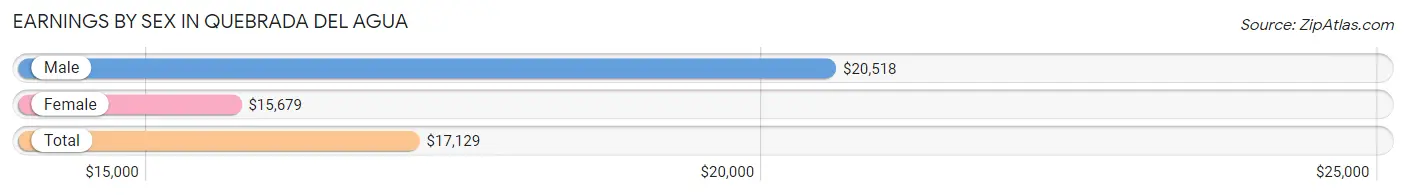
Earnings by Sex in Quebrada del Agua
Average Earnings in Quebrada del Agua are $17,129, $20,518 for men and $15,679 for women, a difference of 23.6%.
| Sex | Number | Average Earnings |
| Male | 327 (68.1%) | $20,518 |
| Female | 153 (31.9%) | $15,679 |
| Total | 480 (100.0%) | $17,129 |
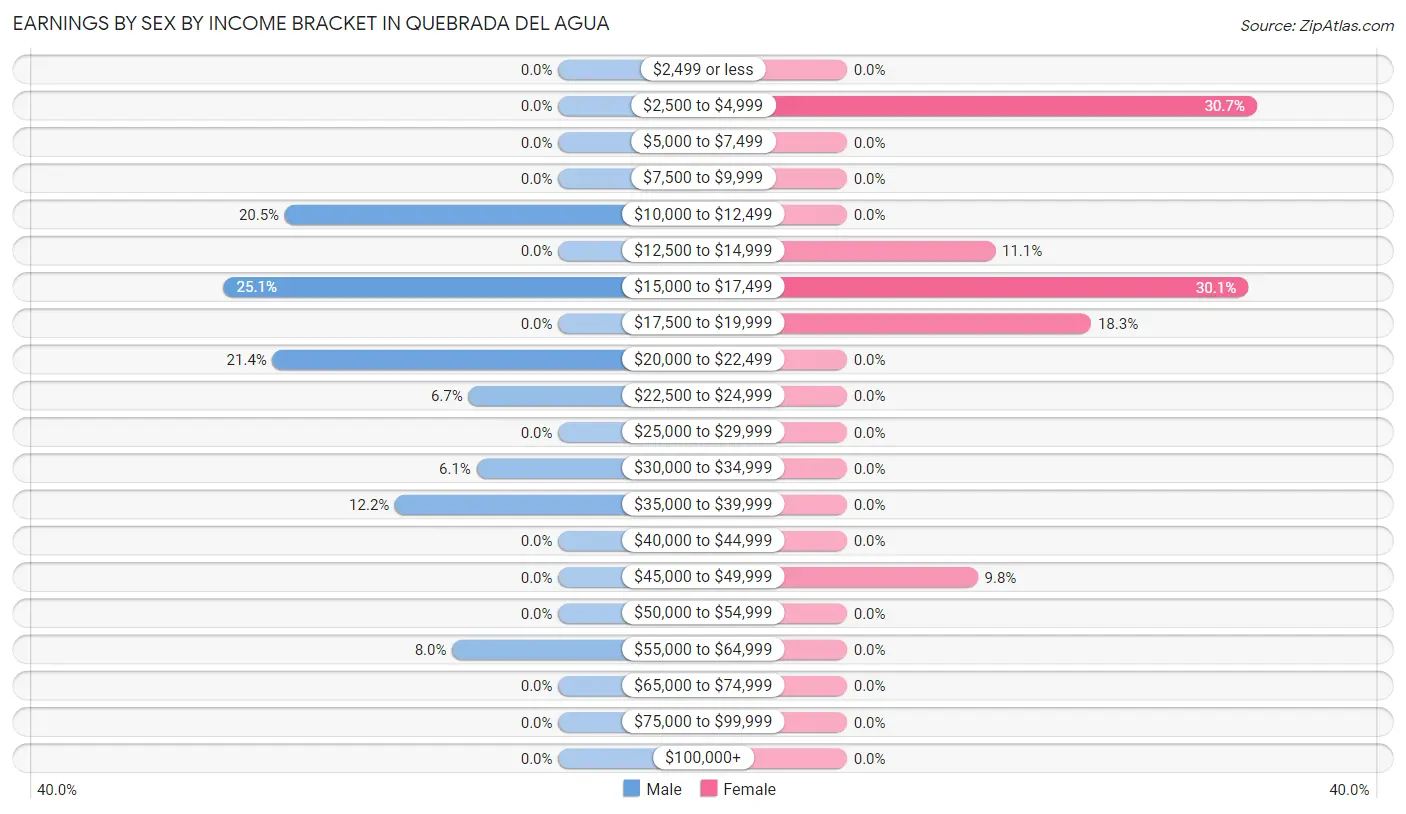
Earnings by Sex by Income Bracket in Quebrada del Agua
The most common earnings brackets in Quebrada del Agua are $15,000 to $17,499 for men (82 | 25.1%) and $2,500 to $4,999 for women (47 | 30.7%).
| Income | Male | Female |
| $2,499 or less | 0 (0.0%) | 0 (0.0%) |
| $2,500 to $4,999 | 0 (0.0%) | 47 (30.7%) |
| $5,000 to $7,499 | 0 (0.0%) | 0 (0.0%) |
| $7,500 to $9,999 | 0 (0.0%) | 0 (0.0%) |
| $10,000 to $12,499 | 67 (20.5%) | 0 (0.0%) |
| $12,500 to $14,999 | 0 (0.0%) | 17 (11.1%) |
| $15,000 to $17,499 | 82 (25.1%) | 46 (30.1%) |
| $17,500 to $19,999 | 0 (0.0%) | 28 (18.3%) |
| $20,000 to $22,499 | 70 (21.4%) | 0 (0.0%) |
| $22,500 to $24,999 | 22 (6.7%) | 0 (0.0%) |
| $25,000 to $29,999 | 0 (0.0%) | 0 (0.0%) |
| $30,000 to $34,999 | 20 (6.1%) | 0 (0.0%) |
| $35,000 to $39,999 | 40 (12.2%) | 0 (0.0%) |
| $40,000 to $44,999 | 0 (0.0%) | 0 (0.0%) |
| $45,000 to $49,999 | 0 (0.0%) | 15 (9.8%) |
| $50,000 to $54,999 | 0 (0.0%) | 0 (0.0%) |
| $55,000 to $64,999 | 26 (8.0%) | 0 (0.0%) |
| $65,000 to $74,999 | 0 (0.0%) | 0 (0.0%) |
| $75,000 to $99,999 | 0 (0.0%) | 0 (0.0%) |
| $100,000+ | 0 (0.0%) | 0 (0.0%) |
| Total | 327 (100.0%) | 153 (100.0%) |
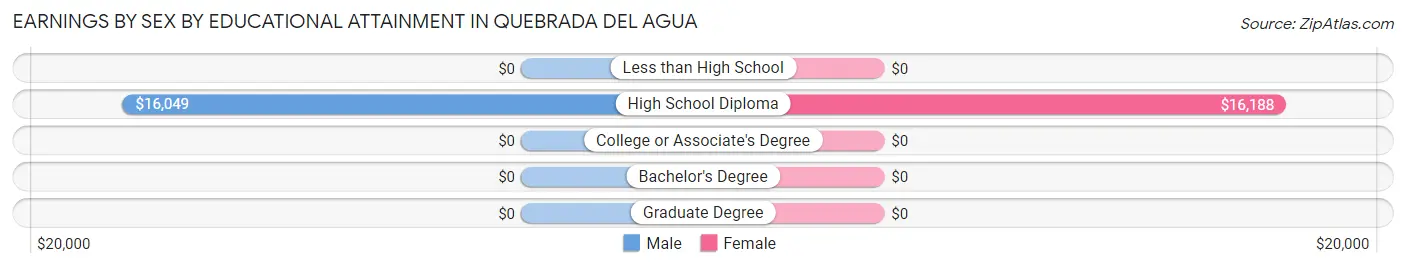
Earnings by Sex by Educational Attainment in Quebrada del Agua
Average earnings in Quebrada del Agua are $20,781 for men and $15,679 for women, a difference of 24.5%. Men with an educational attainment of high school diploma enjoy the highest average annual earnings of $16,049, while those with high school diploma education earn the least with $16,049. Women with an educational attainment of high school diploma earn the most with the average annual earnings of $16,188, while those with high school diploma education have the smallest earnings of $16,188.
| Educational Attainment | Male Income | Female Income |
| Less than High School | - | - |
| High School Diploma | $16,049 | $16,188 |
| College or Associate's Degree | - | - |
| Bachelor's Degree | - | - |
| Graduate Degree | - | - |
| Total | $20,781 | $15,679 |
Family Income in Quebrada del Agua
Family Income Brackets in Quebrada del Agua
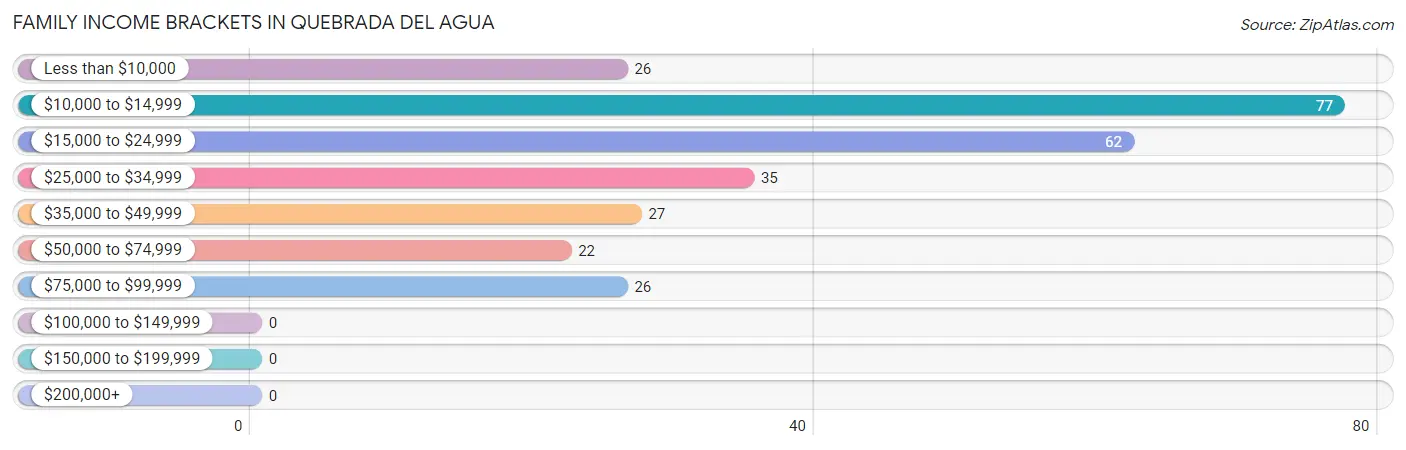
According to the Quebrada del Agua family income data, there are 77 families falling into the $10,000 to $14,999 income range, which is the most common income bracket and makes up 28.0% of all families.
| Income Bracket | # Families | % Families |
| Less than $10,000 | 26 | 9.5% |
| $10,000 to $14,999 | 77 | 28.0% |
| $15,000 to $24,999 | 62 | 22.5% |
| $25,000 to $34,999 | 35 | 12.7% |
| $35,000 to $49,999 | 27 | 9.8% |
| $50,000 to $74,999 | 22 | 8.0% |
| $75,000 to $99,999 | 26 | 9.5% |
| $100,000 to $149,999 | 0 | 0.0% |
| $150,000 to $199,999 | 0 | 0.0% |
| $200,000+ | 0 | 0.0% |
Family Income by Famaliy Size in Quebrada del Agua
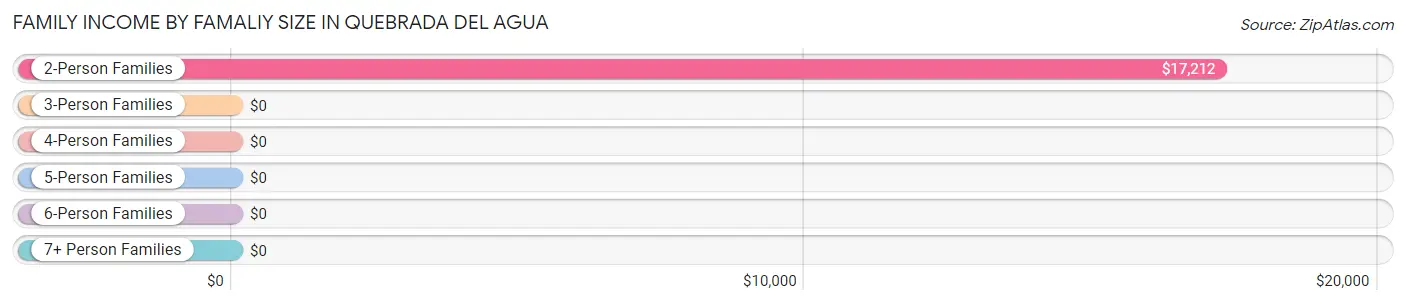
2-person families (71 | 25.8%) account for the highest median family income in Quebrada del Agua with $17,212 per family, while 2-person families (71 | 25.8%) have the highest median income of $8,606 per family member.
| Income Bracket | # Families | Median Income |
| 2-Person Families | 71 (25.8%) | $17,212 |
| 3-Person Families | 81 (29.4%) | $0 |
| 4-Person Families | 84 (30.5%) | $0 |
| 5-Person Families | 39 (14.2%) | $0 |
| 6-Person Families | 0 (0.0%) | $0 |
| 7+ Person Families | 0 (0.0%) | $0 |
| Total | 275 (100.0%) | $20,208 |
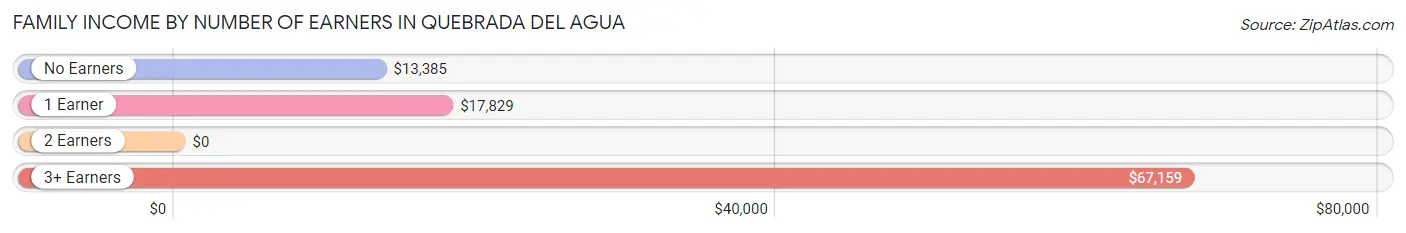
Family Income by Number of Earners in Quebrada del Agua
| Number of Earners | # Families | Median Income |
| No Earners | 87 (31.6%) | $13,385 |
| 1 Earner | 93 (33.8%) | $17,829 |
| 2 Earners | 37 (13.5%) | $0 |
| 3+ Earners | 58 (21.1%) | $67,159 |
| Total | 275 (100.0%) | $20,208 |
Household Income in Quebrada del Agua
Household Income Brackets in Quebrada del Agua
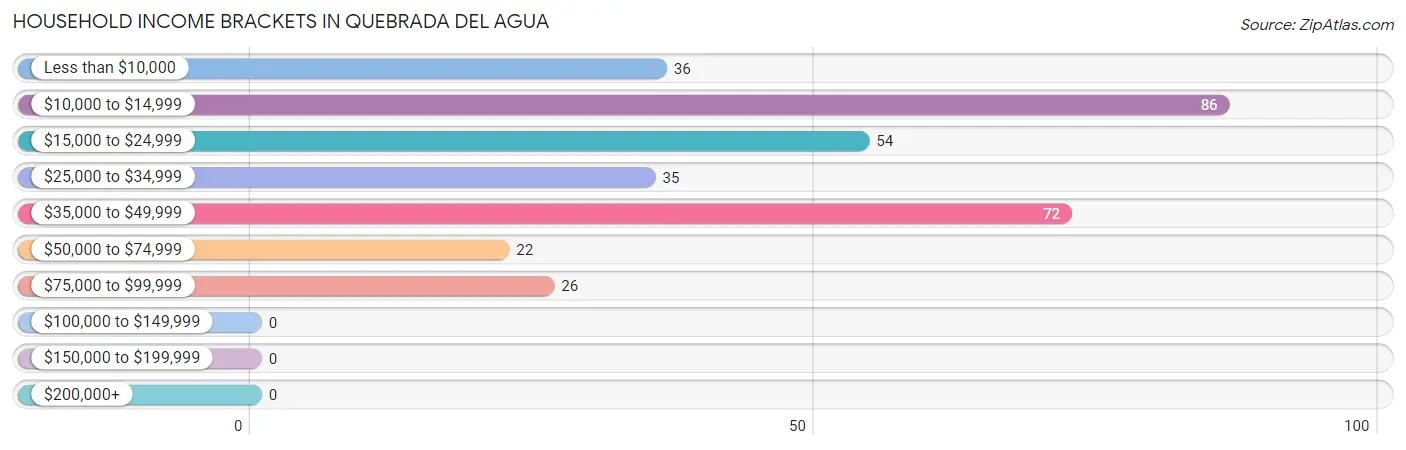
With 86 households falling in the category, the $10,000 to $14,999 income range is the most frequent in Quebrada del Agua, accounting for 26.0% of all households.
| Income Bracket | # Households | % Households |
| Less than $10,000 | 36 | 10.9% |
| $10,000 to $14,999 | 86 | 26.0% |
| $15,000 to $24,999 | 54 | 16.3% |
| $25,000 to $34,999 | 35 | 10.6% |
| $35,000 to $49,999 | 72 | 21.8% |
| $50,000 to $74,999 | 22 | 6.6% |
| $75,000 to $99,999 | 26 | 7.9% |
| $100,000 to $149,999 | 0 | 0.0% |
| $150,000 to $199,999 | 0 | 0.0% |
| $200,000+ | 0 | 0.0% |
Household Income by Householder Age in Quebrada del Agua
The median household income in Quebrada del Agua is $0, with the highest median household income of $19,868 found in the 45 to 64 years age bracket for the primary householder. A total of 140 households (42.3%) fall into this category. Meanwhile, the 15 to 24 years age bracket for the primary householder has the lowest median household income of $0, with 56 households (16.9%) in this group.
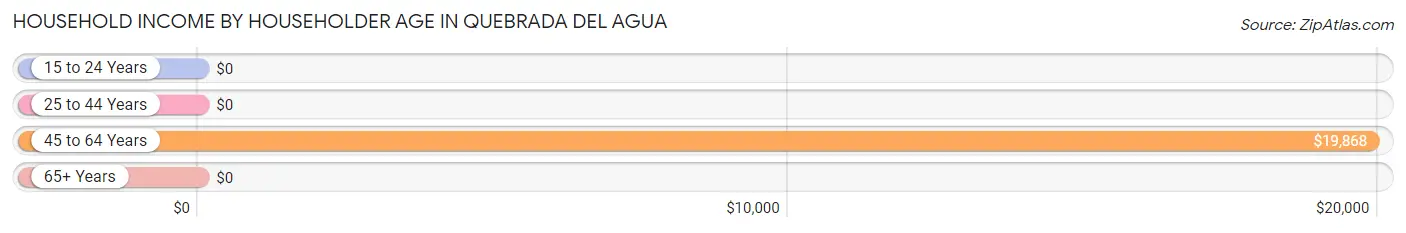
| Income Bracket | # Households | Median Income |
| 15 to 24 Years | 56 (16.9%) | $0 |
| 25 to 44 Years | 107 (32.3%) | $0 |
| 45 to 64 Years | 140 (42.3%) | $19,868 |
| 65+ Years | 28 (8.5%) | $0 |
| Total | 331 (100.0%) | $0 |
Poverty in Quebrada del Agua
Income Below Poverty by Sex and Age in Quebrada del Agua
With 49.3% poverty level for males and 42.9% for females among the residents of Quebrada del Agua, 6 to 11 year old males and 55 to 64 year old females are the most vulnerable to poverty, with 63 males (100.0%) and 34 females (100.0%) in their respective age groups living below the poverty level.
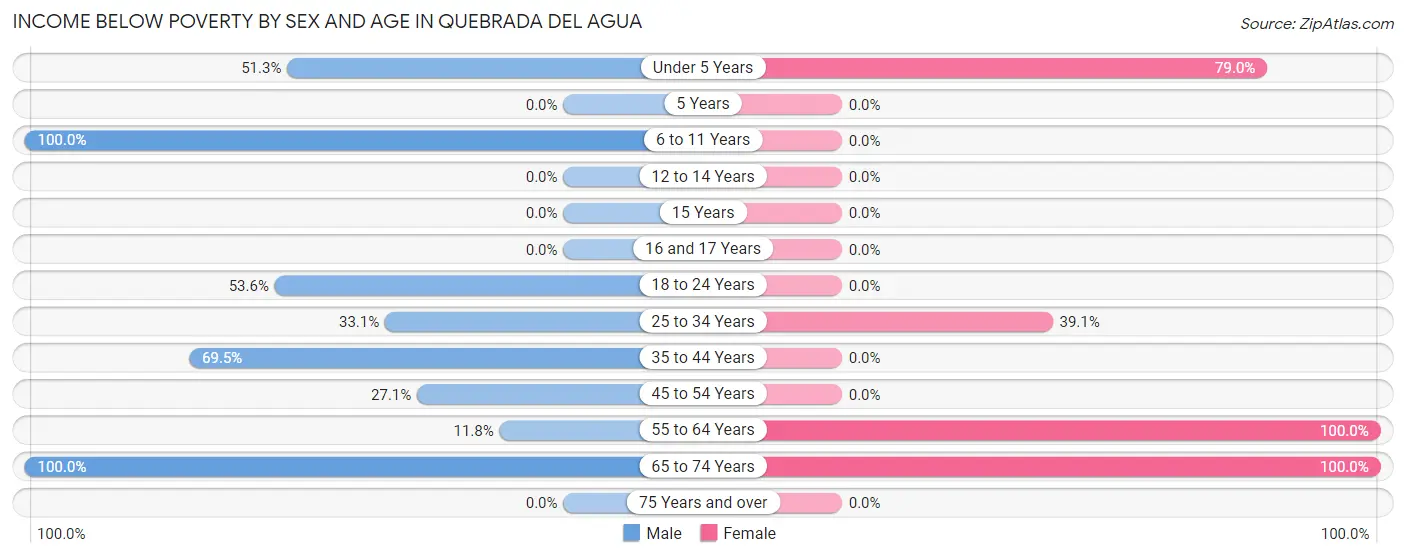
| Age Bracket | Male | Female |
| Under 5 Years | 82 (51.2%) | 75 (78.9%) |
| 5 Years | 0 (0.0%) | 0 (0.0%) |
| 6 to 11 Years | 63 (100.0%) | 0 (0.0%) |
| 12 to 14 Years | 0 (0.0%) | 0 (0.0%) |
| 15 Years | 0 (0.0%) | 0 (0.0%) |
| 16 and 17 Years | 0 (0.0%) | 0 (0.0%) |
| 18 to 24 Years | 30 (53.6%) | 0 (0.0%) |
| 25 to 34 Years | 48 (33.1%) | 70 (39.1%) |
| 35 to 44 Years | 41 (69.5%) | 0 (0.0%) |
| 45 to 54 Years | 19 (27.1%) | 0 (0.0%) |
| 55 to 64 Years | 9 (11.8%) | 34 (100.0%) |
| 65 to 74 Years | 36 (100.0%) | 13 (100.0%) |
| 75 Years and over | 0 (0.0%) | 0 (0.0%) |
| Total | 328 (49.3%) | 192 (42.9%) |
Income Above Poverty by Sex and Age in Quebrada del Agua
According to the poverty statistics in Quebrada del Agua, males aged 55 to 64 years and females aged 6 to 11 years are the age groups that are most secure financially, with 88.2% of males and 100.0% of females in these age groups living above the poverty line.
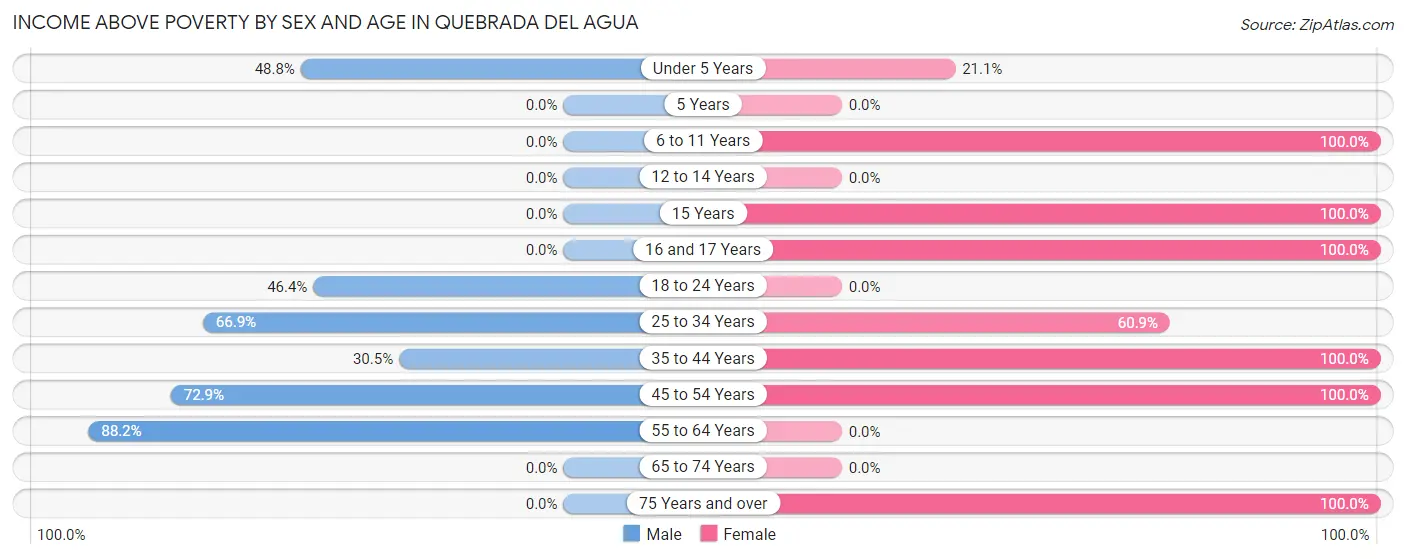
| Age Bracket | Male | Female |
| Under 5 Years | 78 (48.7%) | 20 (21.0%) |
| 5 Years | 0 (0.0%) | 0 (0.0%) |
| 6 to 11 Years | 0 (0.0%) | 12 (100.0%) |
| 12 to 14 Years | 0 (0.0%) | 0 (0.0%) |
| 15 Years | 0 (0.0%) | 18 (100.0%) |
| 16 and 17 Years | 0 (0.0%) | 19 (100.0%) |
| 18 to 24 Years | 26 (46.4%) | 0 (0.0%) |
| 25 to 34 Years | 97 (66.9%) | 109 (60.9%) |
| 35 to 44 Years | 18 (30.5%) | 29 (100.0%) |
| 45 to 54 Years | 51 (72.9%) | 34 (100.0%) |
| 55 to 64 Years | 67 (88.2%) | 0 (0.0%) |
| 65 to 74 Years | 0 (0.0%) | 0 (0.0%) |
| 75 Years and over | 0 (0.0%) | 15 (100.0%) |
| Total | 337 (50.7%) | 256 (57.1%) |
Income Below Poverty Among Married-Couple Families in Quebrada del Agua
The poverty statistics for married-couple families in Quebrada del Agua show that 65.7% or 90 of the total 137 families live below the poverty line. Families with no children have the highest poverty rate of 100.0%, comprising of 46 families. On the other hand, families with 3 or 4 children have the lowest poverty rate of 0.0%, which includes 0 families.
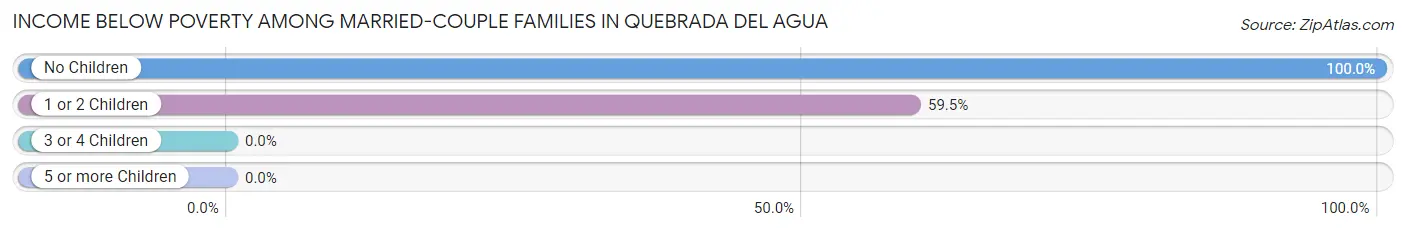
| Children | Above Poverty | Below Poverty |
| No Children | 0 (0.0%) | 46 (100.0%) |
| 1 or 2 Children | 30 (40.5%) | 44 (59.5%) |
| 3 or 4 Children | 17 (100.0%) | 0 (0.0%) |
| 5 or more Children | 0 (0.0%) | 0 (0.0%) |
| Total | 47 (34.3%) | 90 (65.7%) |
Income Below Poverty Among Single-Parent Households in Quebrada del Agua
According to the poverty data in Quebrada del Agua, 38.5% or 30 single-father households and 43.3% or 26 single-mother households are living below the poverty line. Among single-father households, those with 3 or 4 children have the highest poverty rate, with 30 households (100.0%) experiencing poverty. Likewise, among single-mother households, those with 1 or 2 children have the highest poverty rate, with 26 households (100.0%) falling below the poverty line.
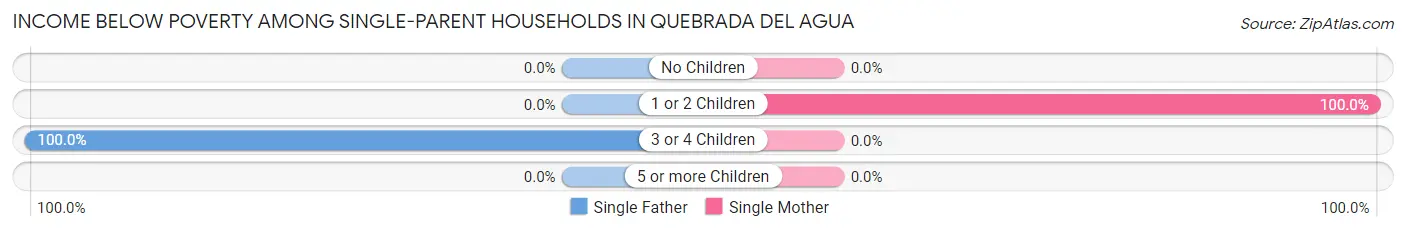
| Children | Single Father | Single Mother |
| No Children | 0 (0.0%) | 0 (0.0%) |
| 1 or 2 Children | 0 (0.0%) | 26 (100.0%) |
| 3 or 4 Children | 30 (100.0%) | 0 (0.0%) |
| 5 or more Children | 0 (0.0%) | 0 (0.0%) |
| Total | 30 (38.5%) | 26 (43.3%) |
Income Below Poverty Among Married-Couple vs Single-Parent Households in Quebrada del Agua
The poverty data for Quebrada del Agua shows that 90 of the married-couple family households (65.7%) and 56 of the single-parent households (40.6%) are living below the poverty level. Within the married-couple family households, those with no children have the highest poverty rate, with 46 households (100.0%) falling below the poverty line. Among the single-parent households, those with 3 or 4 children have the highest poverty rate, with 30 household (100.0%) living below poverty.
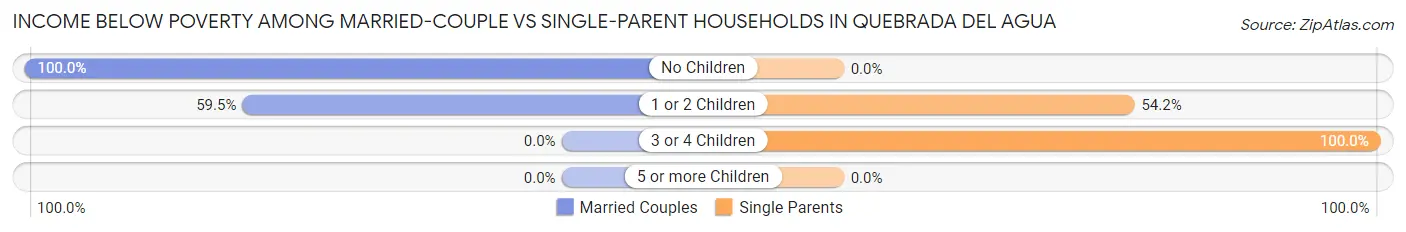
| Children | Married-Couple Families | Single-Parent Households |
| No Children | 46 (100.0%) | 0 (0.0%) |
| 1 or 2 Children | 44 (59.5%) | 26 (54.2%) |
| 3 or 4 Children | 0 (0.0%) | 30 (100.0%) |
| 5 or more Children | 0 (0.0%) | 0 (0.0%) |
| Total | 90 (65.7%) | 56 (40.6%) |
Race in Quebrada del Agua
The most populous races in Quebrada del Agua are Hispanic or Latino (1,167 | 100.0%), White / Caucasian (800 | 68.5%), and Two or more Races (192 | 16.5%).
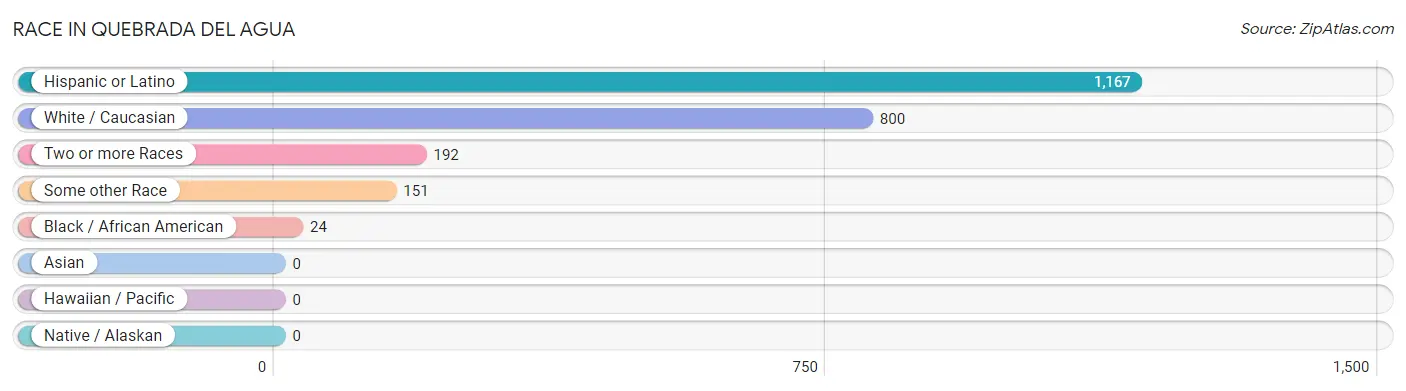
| Race | # Population | % Population |
| Asian | 0 | 0.0% |
| Black / African American | 24 | 2.1% |
| Hawaiian / Pacific | 0 | 0.0% |
| Hispanic or Latino | 1,167 | 100.0% |
| Native / Alaskan | 0 | 0.0% |
| White / Caucasian | 800 | 68.5% |
| Two or more Races | 192 | 16.5% |
| Some other Race | 151 | 12.9% |
| Total | 1,167 | 100.0% |
Ancestry in Quebrada del Agua
The most populous ancestries reported in Quebrada del Agua are , and Puerto Rican (1,167 | 100.0%), together accounting for 100.0% of all Quebrada del Agua residents.

| Ancestry | # Population | % Population |
| Puerto Rican | 1,167 | 100.0% | View All 1 Rows |
Immigrants in Quebrada del Agua

| Immigration Origin | # Population | % Population | View All 0 Rows |
Sex and Age in Quebrada del Agua
Sex and Age in Quebrada del Agua
The most populous age groups in Quebrada del Agua are Under 5 Years (160 | 22.9%) for men and 25 to 29 Years (133 | 28.5%) for women.
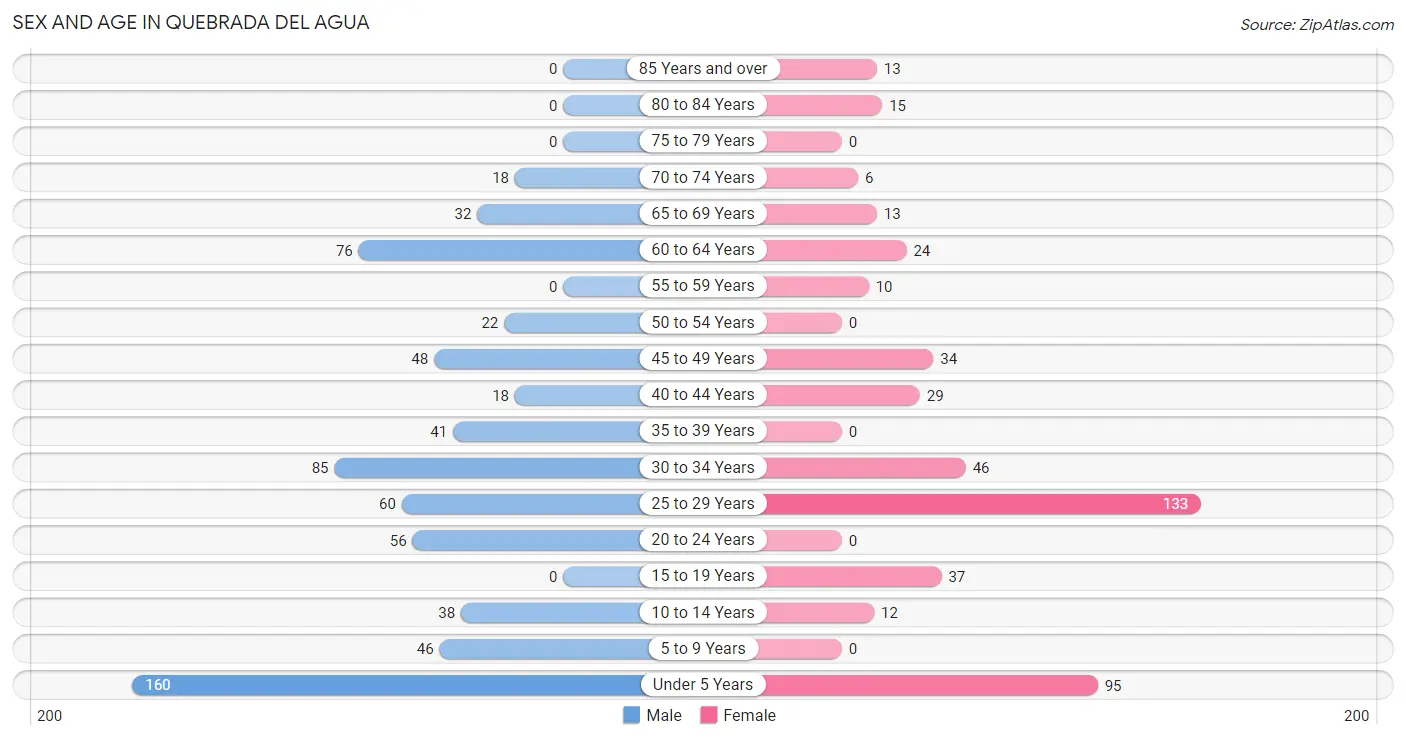
| Age Bracket | Male | Female |
| Under 5 Years | 160 (22.9%) | 95 (20.3%) |
| 5 to 9 Years | 46 (6.6%) | 0 (0.0%) |
| 10 to 14 Years | 38 (5.4%) | 12 (2.6%) |
| 15 to 19 Years | 0 (0.0%) | 37 (7.9%) |
| 20 to 24 Years | 56 (8.0%) | 0 (0.0%) |
| 25 to 29 Years | 60 (8.6%) | 133 (28.5%) |
| 30 to 34 Years | 85 (12.1%) | 46 (9.9%) |
| 35 to 39 Years | 41 (5.9%) | 0 (0.0%) |
| 40 to 44 Years | 18 (2.6%) | 29 (6.2%) |
| 45 to 49 Years | 48 (6.9%) | 34 (7.3%) |
| 50 to 54 Years | 22 (3.1%) | 0 (0.0%) |
| 55 to 59 Years | 0 (0.0%) | 10 (2.1%) |
| 60 to 64 Years | 76 (10.9%) | 24 (5.1%) |
| 65 to 69 Years | 32 (4.6%) | 13 (2.8%) |
| 70 to 74 Years | 18 (2.6%) | 6 (1.3%) |
| 75 to 79 Years | 0 (0.0%) | 0 (0.0%) |
| 80 to 84 Years | 0 (0.0%) | 15 (3.2%) |
| 85 Years and over | 0 (0.0%) | 13 (2.8%) |
| Total | 700 (100.0%) | 467 (100.0%) |
Families and Households in Quebrada del Agua
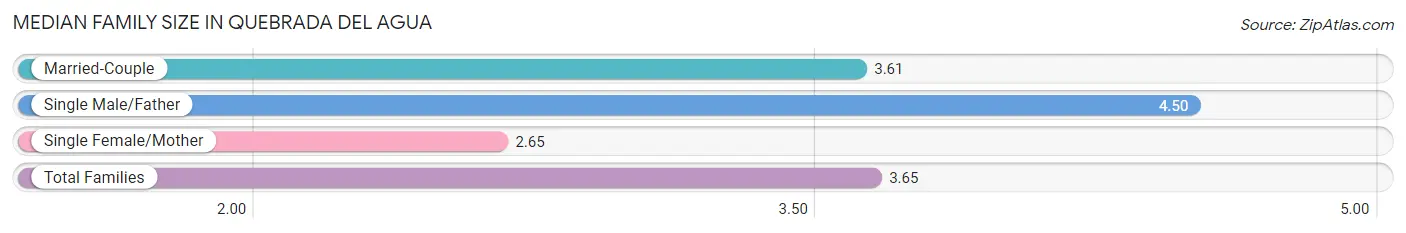
Median Family Size in Quebrada del Agua
The median family size in Quebrada del Agua is 3.65 persons per family, with single male/father families (78 | 28.4%) accounting for the largest median family size of 4.5 persons per family. On the other hand, single female/mother families (60 | 21.8%) represent the smallest median family size with 2.65 persons per family.
| Family Type | # Families | Family Size |
| Married-Couple | 137 (49.8%) | 3.61 |
| Single Male/Father | 78 (28.4%) | 4.50 |
| Single Female/Mother | 60 (21.8%) | 2.65 |
| Total Families | 275 (100.0%) | 3.65 |
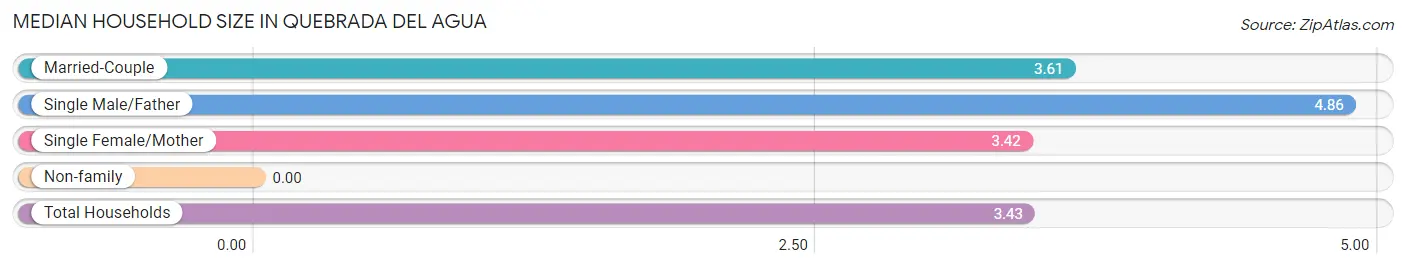
Median Household Size in Quebrada del Agua
| Household Type | # Households | Household Size |
| Married-Couple | 137 (41.4%) | 3.61 |
| Single Male/Father | 78 (23.6%) | 4.86 |
| Single Female/Mother | 60 (18.1%) | 3.42 |
| Non-family | 56 (16.9%) | - |
| Total Households | 331 (100.0%) | 3.43 |
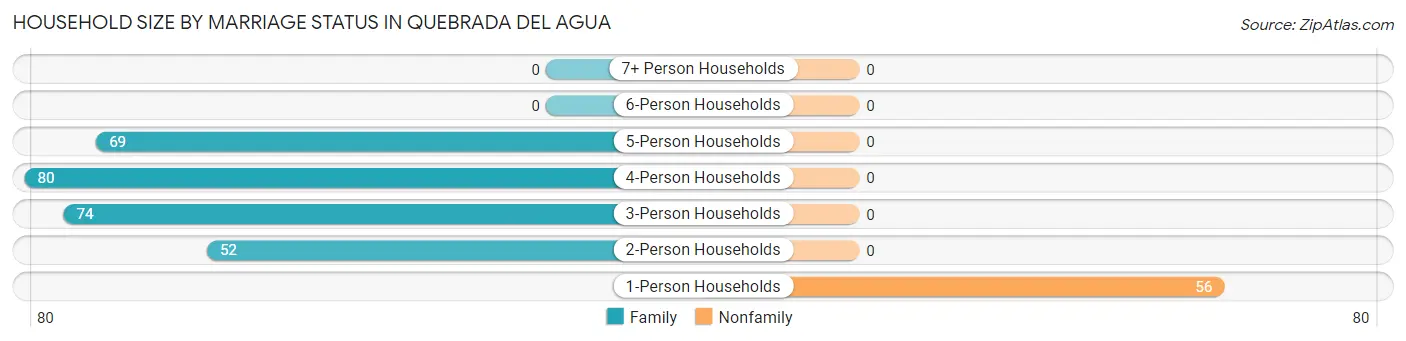
Household Size by Marriage Status in Quebrada del Agua
Out of a total of 331 households in Quebrada del Agua, 275 (83.1%) are family households, while 56 (16.9%) are nonfamily households. The most numerous type of family households are 4-person households, comprising 80, and the most common type of nonfamily households are 1-person households, comprising 56.
| Household Size | Family Households | Nonfamily Households |
| 1-Person Households | - | 56 (16.9%) |
| 2-Person Households | 52 (15.7%) | 0 (0.0%) |
| 3-Person Households | 74 (22.4%) | 0 (0.0%) |
| 4-Person Households | 80 (24.2%) | 0 (0.0%) |
| 5-Person Households | 69 (20.8%) | 0 (0.0%) |
| 6-Person Households | 0 (0.0%) | 0 (0.0%) |
| 7+ Person Households | 0 (0.0%) | 0 (0.0%) |
| Total | 275 (83.1%) | 56 (16.9%) |
Female Fertility in Quebrada del Agua
Fertility by Age in Quebrada del Agua
| Age Bracket | Women with Births | Births / 1,000 Women |
| 15 to 19 years | 0 (0.0%) | 0.0 |
| 20 to 34 years | 0 (0.0%) | 0.0 |
| 35 to 50 years | 0 (0.0%) | 0.0 |
| Total | 0 (0.0%) | 0.0 |
Fertility by Age by Marriage Status in Quebrada del Agua
| Age Bracket | Married | Unmarried |
| 15 to 19 years | 0 (0.0%) | 0 (0.0%) |
| 20 to 34 years | 0 (0.0%) | 0 (0.0%) |
| 35 to 50 years | 0 (0.0%) | 0 (0.0%) |
| Total | 0 (0.0%) | 0 (0.0%) |
Fertility by Education in Quebrada del Agua
| Educational Attainment | Women with Births | Births / 1,000 Women |
| Less than High School | 0 (0.0%) | 0.0 |
| High School Diploma | 0 (0.0%) | 0.0 |
| College or Associate's Degree | 0 (0.0%) | 0.0 |
| Bachelor's Degree | 0 (0.0%) | 0.0 |
| Graduate Degree | 0 (0.0%) | 0.0 |
| Total | 0 (0.0%) | 0.0 |
Fertility by Education by Marriage Status in Quebrada del Agua
| Educational Attainment | Married | Unmarried |
| Less than High School | 0 (0.0%) | 0 (0.0%) |
| High School Diploma | 0 (0.0%) | 0 (0.0%) |
| College or Associate's Degree | 0 (0.0%) | 0 (0.0%) |
| Bachelor's Degree | 0 (0.0%) | 0 (0.0%) |
| Graduate Degree | 0 (0.0%) | 0 (0.0%) |
| Total | 0 (0.0%) | 0 (0.0%) |
Employment Characteristics in Quebrada del Agua
Employment by Class of Employer in Quebrada del Agua
Among the 432 employed individuals in Quebrada del Agua, private company employees (269 | 62.3%), self-employed (not incorporated) (85 | 19.7%), and state government employees (69 | 16.0%) make up the most common classes of employment.
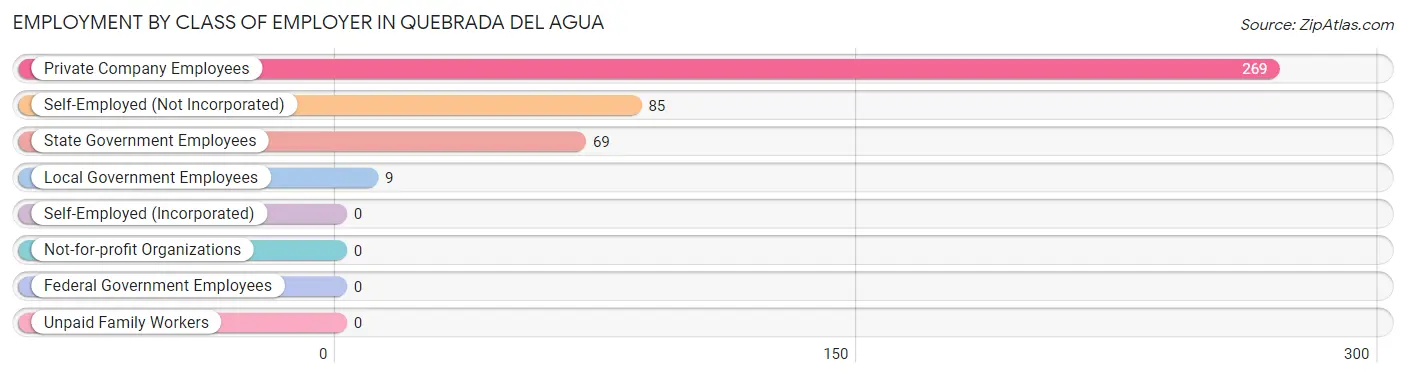
| Employer Class | # Employees | % Employees |
| Private Company Employees | 269 | 62.3% |
| Self-Employed (Incorporated) | 0 | 0.0% |
| Self-Employed (Not Incorporated) | 85 | 19.7% |
| Not-for-profit Organizations | 0 | 0.0% |
| Local Government Employees | 9 | 2.1% |
| State Government Employees | 69 | 16.0% |
| Federal Government Employees | 0 | 0.0% |
| Unpaid Family Workers | 0 | 0.0% |
| Total | 432 | 100.0% |
Employment Status by Age in Quebrada del Agua
According to the labor force statistics for Quebrada del Agua, out of the total population over 16 years of age (798), 57.3% or 457 individuals are in the labor force, with 5.5% or 25 of them unemployed. The age group with the highest labor force participation rate is 20 to 24 years, with 100.0% or 56 individuals in the labor force. Within the labor force, the 35 to 44 years age range has the highest percentage of unemployed individuals, with 34.7% or 25 of them being unemployed.
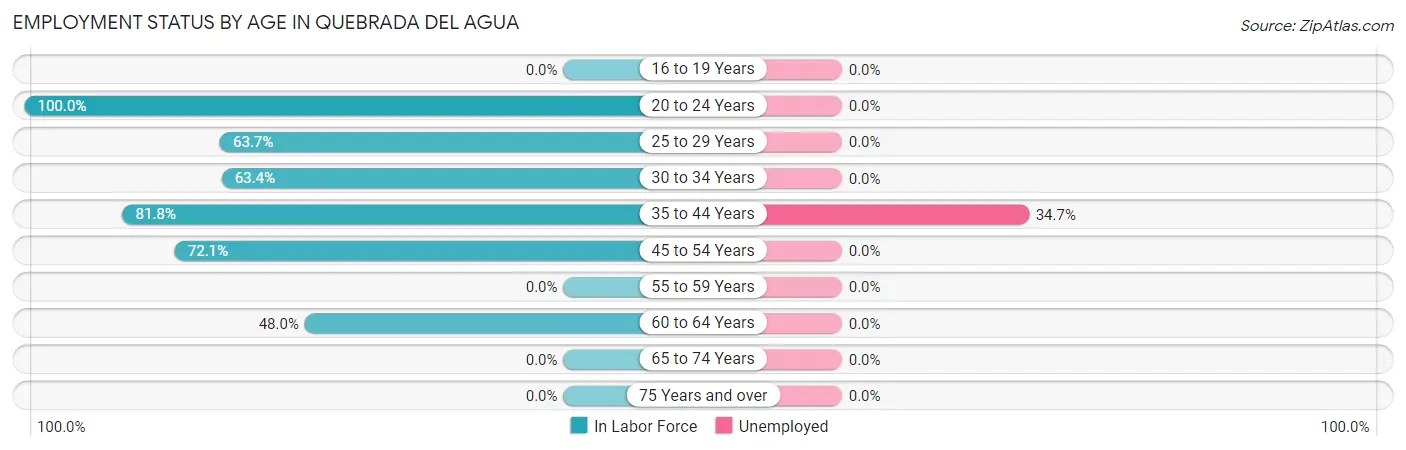
| Age Bracket | In Labor Force | Unemployed |
| 16 to 19 Years | 0 (0.0%) | 0 (0.0%) |
| 20 to 24 Years | 56 (100.0%) | 0 (0.0%) |
| 25 to 29 Years | 123 (63.7%) | 0 (0.0%) |
| 30 to 34 Years | 83 (63.4%) | 0 (0.0%) |
| 35 to 44 Years | 72 (81.8%) | 25 (34.7%) |
| 45 to 54 Years | 75 (72.1%) | 0 (0.0%) |
| 55 to 59 Years | 0 (0.0%) | 0 (0.0%) |
| 60 to 64 Years | 48 (48.0%) | 0 (0.0%) |
| 65 to 74 Years | 0 (0.0%) | 0 (0.0%) |
| 75 Years and over | 0 (0.0%) | 0 (0.0%) |
| Total | 457 (57.3%) | 25 (5.5%) |
Employment Status by Educational Attainment in Quebrada del Agua
According to labor force statistics for Quebrada del Agua, 64.1% of individuals (401) out of the total population between 25 and 64 years of age (626) are in the labor force, with 6.2% or 25 of them being unemployed. The group with the highest labor force participation rate are those with the educational attainment of college / associate degree, with 89.5% or 85 individuals in the labor force. Within the labor force, individuals with high school diploma education have the highest percentage of unemployment, with 11.6% or 25 of them being unemployed.
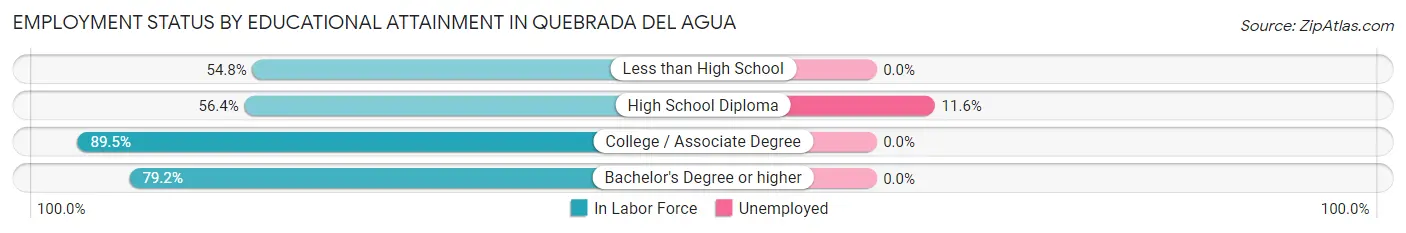
| Educational Attainment | In Labor Force | Unemployed |
| Less than High School | 40 (54.8%) | 0 (0.0%) |
| High School Diploma | 215 (56.4%) | 44 (11.6%) |
| College / Associate Degree | 85 (89.5%) | 0 (0.0%) |
| Bachelor's Degree or higher | 61 (79.2%) | 0 (0.0%) |
| Total | 401 (64.1%) | 39 (6.2%) |
Employment Occupations by Sex in Quebrada del Agua
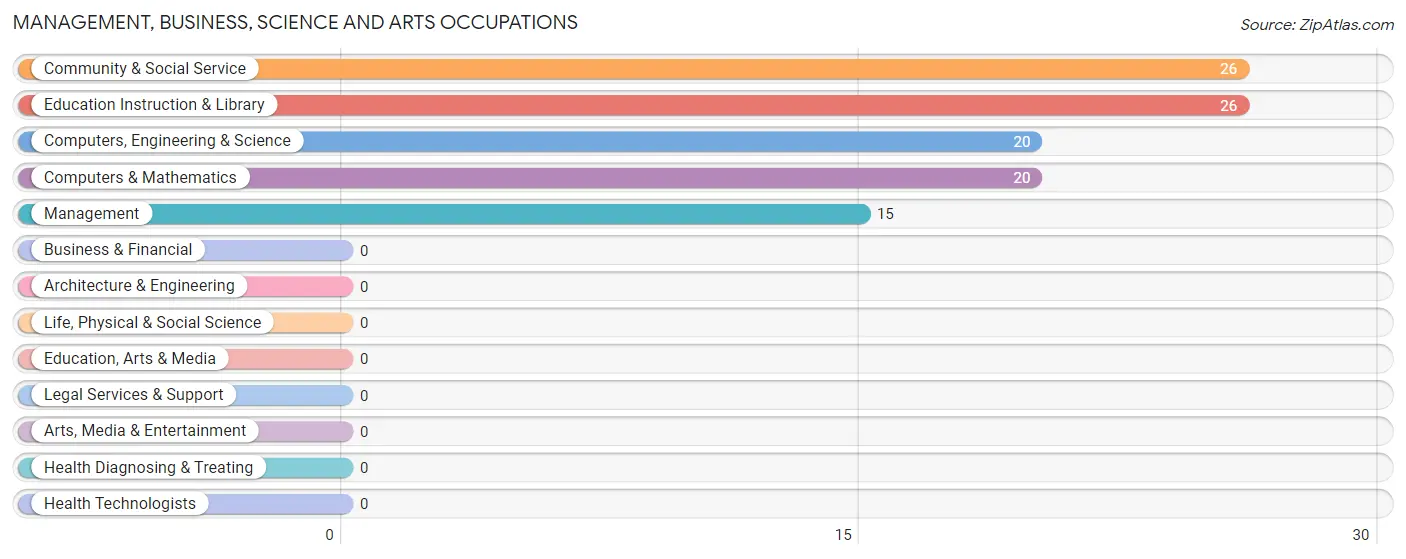
Management, Business, Science and Arts Occupations
The most common Management, Business, Science and Arts occupations in Quebrada del Agua are Community & Social Service (26 | 6.0%), Education Instruction & Library (26 | 6.0%), Computers, Engineering & Science (20 | 4.6%), Computers & Mathematics (20 | 4.6%), and Management (15 | 3.5%).
Management, Business, Science and Arts Occupations by Sex
Within the Management, Business, Science and Arts occupations in Quebrada del Agua, the most male-oriented occupations are Computers, Engineering & Science (100.0%), and Computers & Mathematics (100.0%), while the most female-oriented occupations are Management (100.0%), Community & Social Service (100.0%), and Education Instruction & Library (100.0%).
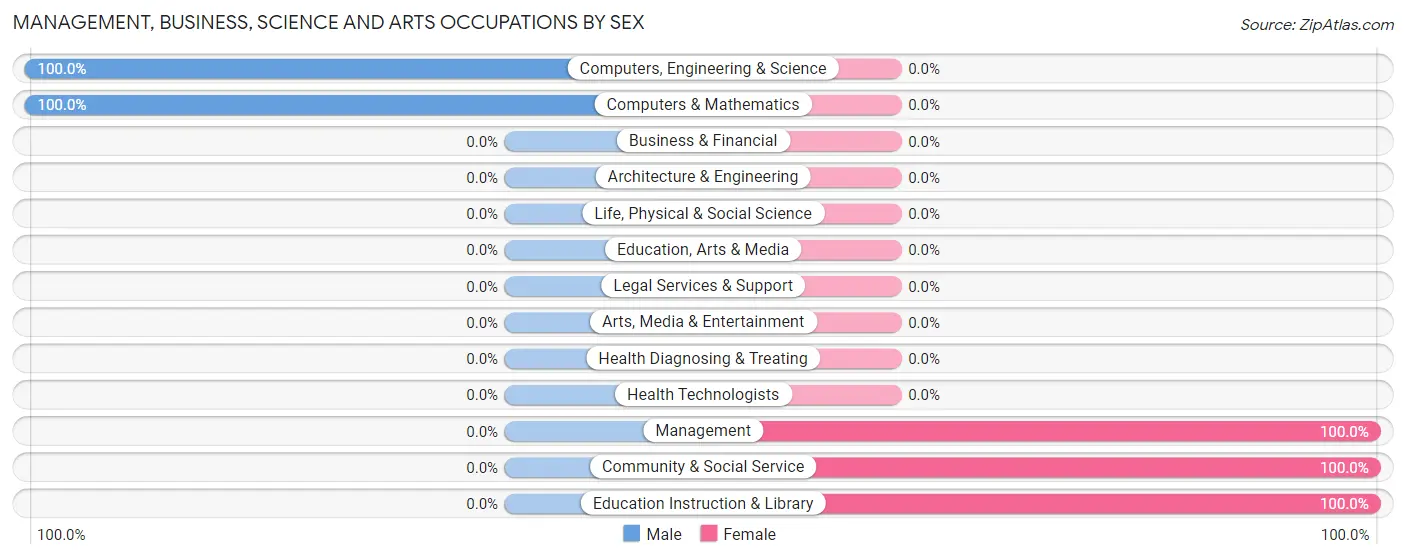
| Occupation | Male | Female |
| Management | 0 (0.0%) | 15 (100.0%) |
| Business & Financial | 0 (0.0%) | 0 (0.0%) |
| Computers, Engineering & Science | 20 (100.0%) | 0 (0.0%) |
| Computers & Mathematics | 20 (100.0%) | 0 (0.0%) |
| Architecture & Engineering | 0 (0.0%) | 0 (0.0%) |
| Life, Physical & Social Science | 0 (0.0%) | 0 (0.0%) |
| Community & Social Service | 0 (0.0%) | 26 (100.0%) |
| Education, Arts & Media | 0 (0.0%) | 0 (0.0%) |
| Legal Services & Support | 0 (0.0%) | 0 (0.0%) |
| Education Instruction & Library | 0 (0.0%) | 26 (100.0%) |
| Arts, Media & Entertainment | 0 (0.0%) | 0 (0.0%) |
| Health Diagnosing & Treating | 0 (0.0%) | 0 (0.0%) |
| Health Technologists | 0 (0.0%) | 0 (0.0%) |
| Total (Category) | 20 (32.8%) | 41 (67.2%) |
| Total (Overall) | 279 (64.6%) | 153 (35.4%) |
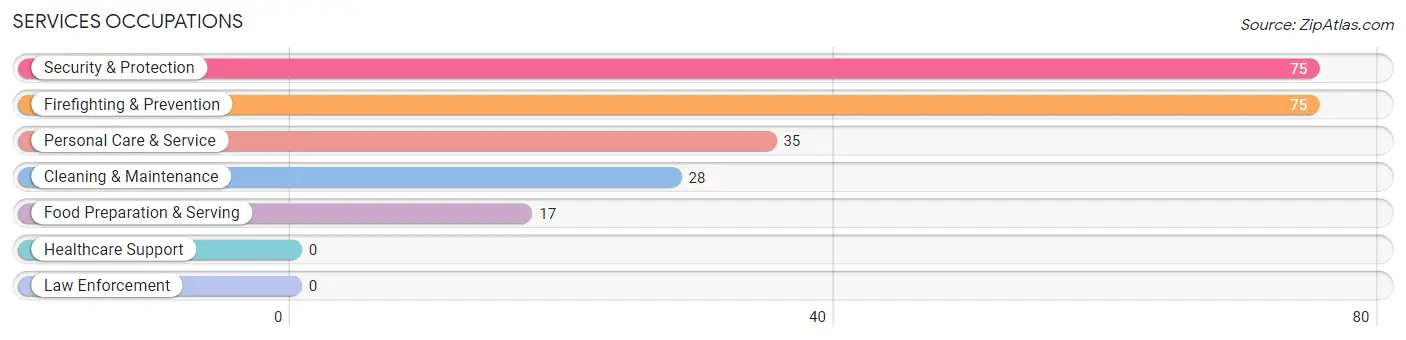
Services Occupations
The most common Services occupations in Quebrada del Agua are Security & Protection (75 | 17.4%), Firefighting & Prevention (75 | 17.4%), Personal Care & Service (35 | 8.1%), Cleaning & Maintenance (28 | 6.5%), and Food Preparation & Serving (17 | 3.9%).
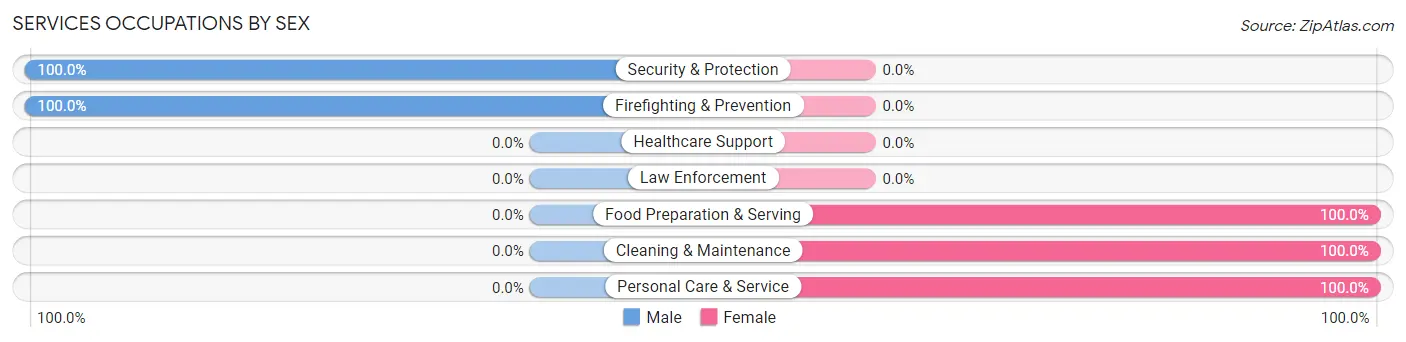
Services Occupations by Sex
Within the Services occupations in Quebrada del Agua, the most male-oriented occupations are Security & Protection (100.0%), and Firefighting & Prevention (100.0%), while the most female-oriented occupations are Food Preparation & Serving (100.0%), Cleaning & Maintenance (100.0%), and Personal Care & Service (100.0%).
| Occupation | Male | Female |
| Healthcare Support | 0 (0.0%) | 0 (0.0%) |
| Security & Protection | 75 (100.0%) | 0 (0.0%) |
| Firefighting & Prevention | 75 (100.0%) | 0 (0.0%) |
| Law Enforcement | 0 (0.0%) | 0 (0.0%) |
| Food Preparation & Serving | 0 (0.0%) | 17 (100.0%) |
| Cleaning & Maintenance | 0 (0.0%) | 28 (100.0%) |
| Personal Care & Service | 0 (0.0%) | 35 (100.0%) |
| Total (Category) | 75 (48.4%) | 80 (51.6%) |
| Total (Overall) | 279 (64.6%) | 153 (35.4%) |
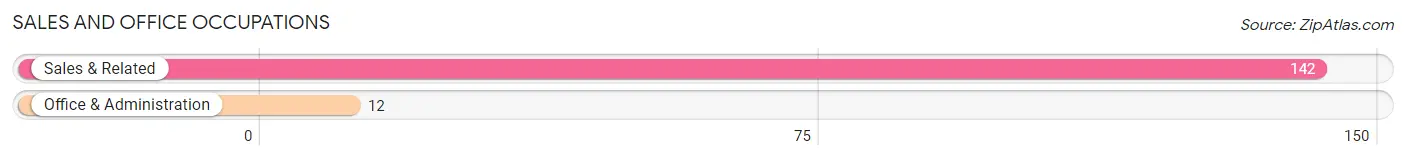
Sales and Office Occupations
The most common Sales and Office occupations in Quebrada del Agua are Sales & Related (142 | 32.9%), and Office & Administration (12 | 2.8%).
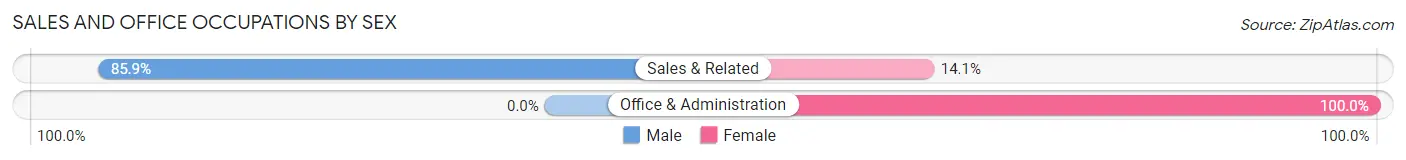
Sales and Office Occupations by Sex
| Occupation | Male | Female |
| Sales & Related | 122 (85.9%) | 20 (14.1%) |
| Office & Administration | 0 (0.0%) | 12 (100.0%) |
| Total (Category) | 122 (79.2%) | 32 (20.8%) |
| Total (Overall) | 279 (64.6%) | 153 (35.4%) |
Natural Resources, Construction and Maintenance Occupations
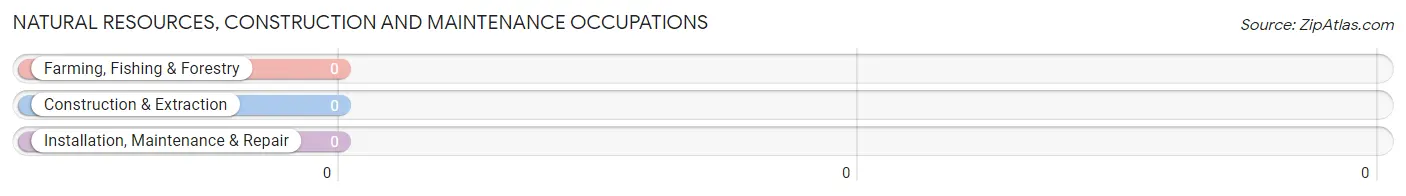
Natural Resources, Construction and Maintenance Occupations by Sex
| Occupation | Male | Female |
| Farming, Fishing & Forestry | 0 (0.0%) | 0 (0.0%) |
| Construction & Extraction | 0 (0.0%) | 0 (0.0%) |
| Installation, Maintenance & Repair | 0 (0.0%) | 0 (0.0%) |
| Total (Category) | 0 (0.0%) | 0 (0.0%) |
| Total (Overall) | 279 (64.6%) | 153 (35.4%) |
Production, Transportation and Moving Occupations
The most common Production, Transportation and Moving occupations in Quebrada del Agua are Transportation (30 | 6.9%), Material Moving (22 | 5.1%), and Production (10 | 2.3%).
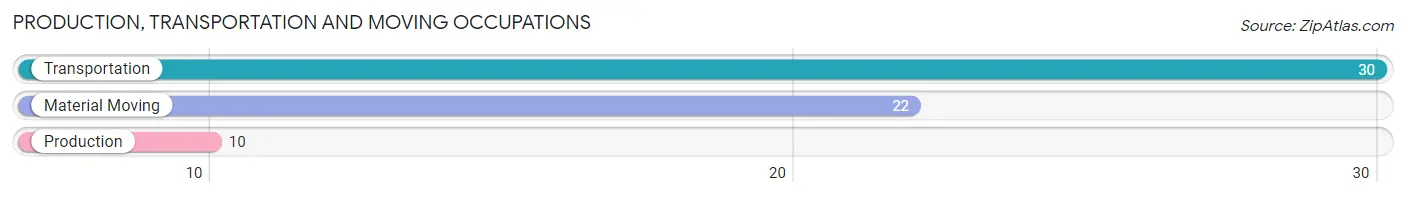
Production, Transportation and Moving Occupations by Sex
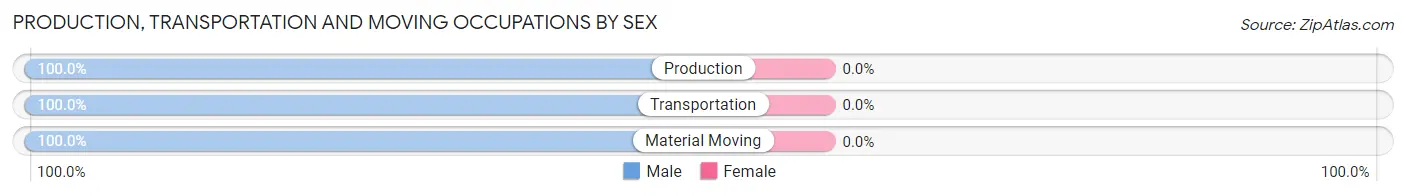
| Occupation | Male | Female |
| Production | 10 (100.0%) | 0 (0.0%) |
| Transportation | 30 (100.0%) | 0 (0.0%) |
| Material Moving | 22 (100.0%) | 0 (0.0%) |
| Total (Category) | 62 (100.0%) | 0 (0.0%) |
| Total (Overall) | 279 (64.6%) | 153 (35.4%) |
Employment Industries by Sex in Quebrada del Agua
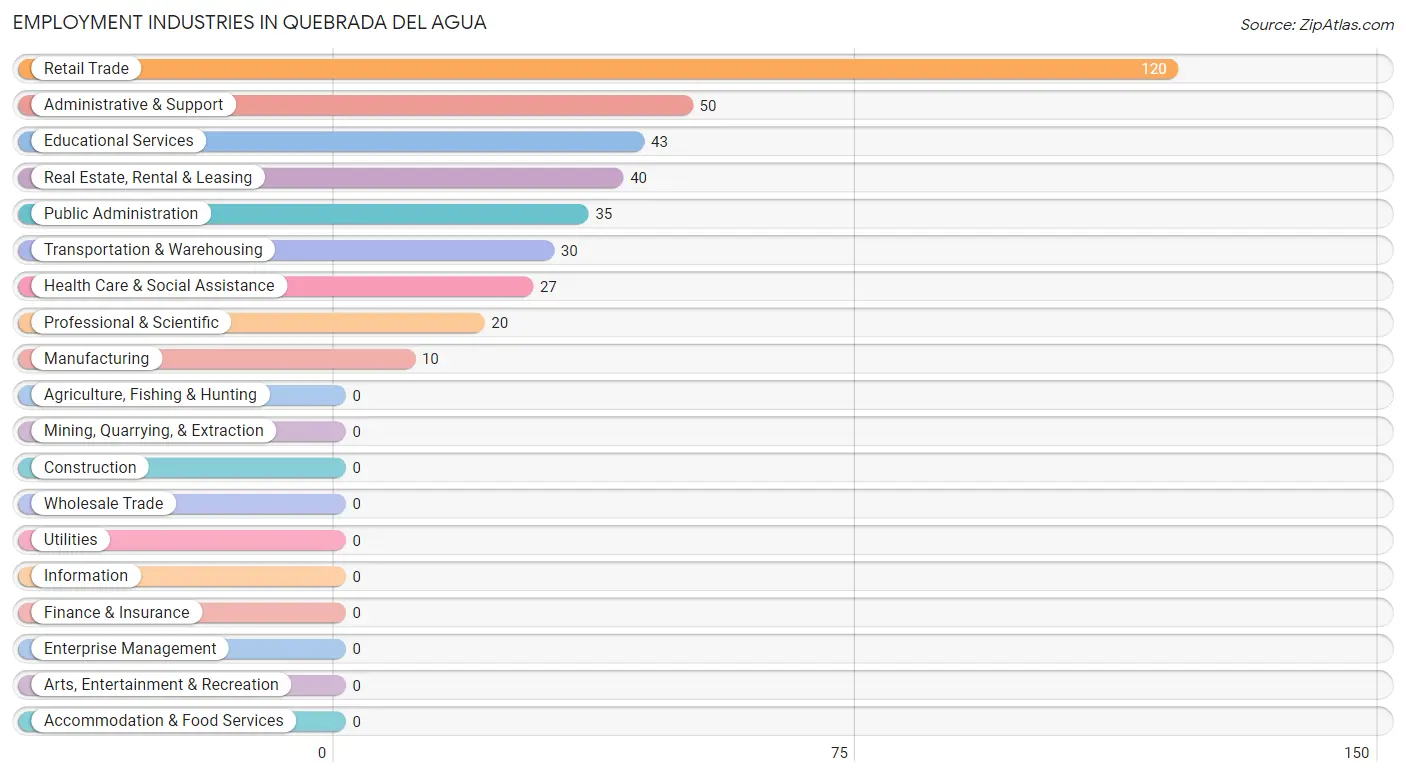
Employment Industries in Quebrada del Agua
The major employment industries in Quebrada del Agua include Retail Trade (120 | 27.8%), Administrative & Support (50 | 11.6%), Educational Services (43 | 10.0%), Real Estate, Rental & Leasing (40 | 9.3%), and Public Administration (35 | 8.1%).
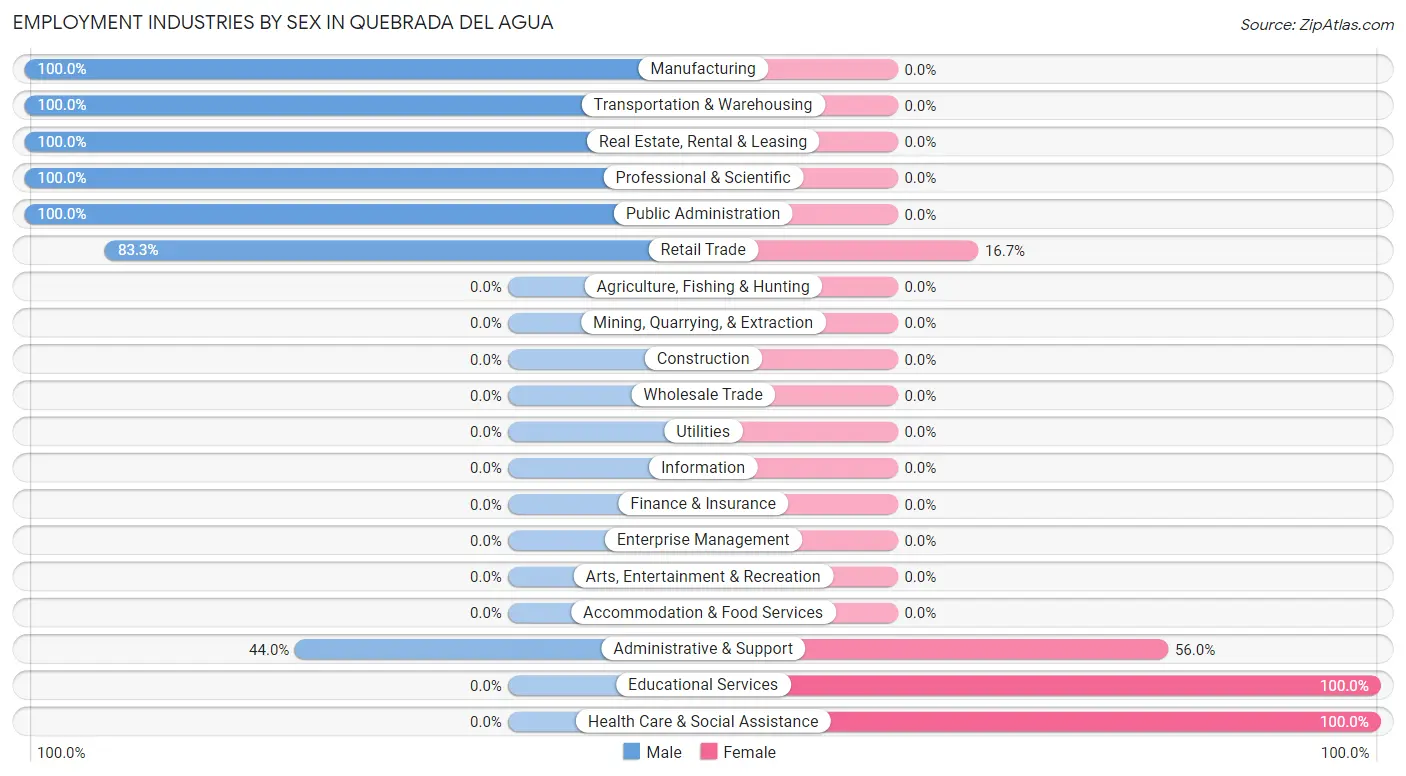
Employment Industries by Sex in Quebrada del Agua
The Quebrada del Agua industries that see more men than women are Manufacturing (100.0%), Transportation & Warehousing (100.0%), and Real Estate, Rental & Leasing (100.0%), whereas the industries that tend to have a higher number of women are Educational Services (100.0%), Health Care & Social Assistance (100.0%), and Administrative & Support (56.0%).
| Industry | Male | Female |
| Agriculture, Fishing & Hunting | 0 (0.0%) | 0 (0.0%) |
| Mining, Quarrying, & Extraction | 0 (0.0%) | 0 (0.0%) |
| Construction | 0 (0.0%) | 0 (0.0%) |
| Manufacturing | 10 (100.0%) | 0 (0.0%) |
| Wholesale Trade | 0 (0.0%) | 0 (0.0%) |
| Retail Trade | 100 (83.3%) | 20 (16.7%) |
| Transportation & Warehousing | 30 (100.0%) | 0 (0.0%) |
| Utilities | 0 (0.0%) | 0 (0.0%) |
| Information | 0 (0.0%) | 0 (0.0%) |
| Finance & Insurance | 0 (0.0%) | 0 (0.0%) |
| Real Estate, Rental & Leasing | 40 (100.0%) | 0 (0.0%) |
| Professional & Scientific | 20 (100.0%) | 0 (0.0%) |
| Enterprise Management | 0 (0.0%) | 0 (0.0%) |
| Administrative & Support | 22 (44.0%) | 28 (56.0%) |
| Educational Services | 0 (0.0%) | 43 (100.0%) |
| Health Care & Social Assistance | 0 (0.0%) | 27 (100.0%) |
| Arts, Entertainment & Recreation | 0 (0.0%) | 0 (0.0%) |
| Accommodation & Food Services | 0 (0.0%) | 0 (0.0%) |
| Public Administration | 35 (100.0%) | 0 (0.0%) |
| Total | 279 (64.6%) | 153 (35.4%) |
Education in Quebrada del Agua
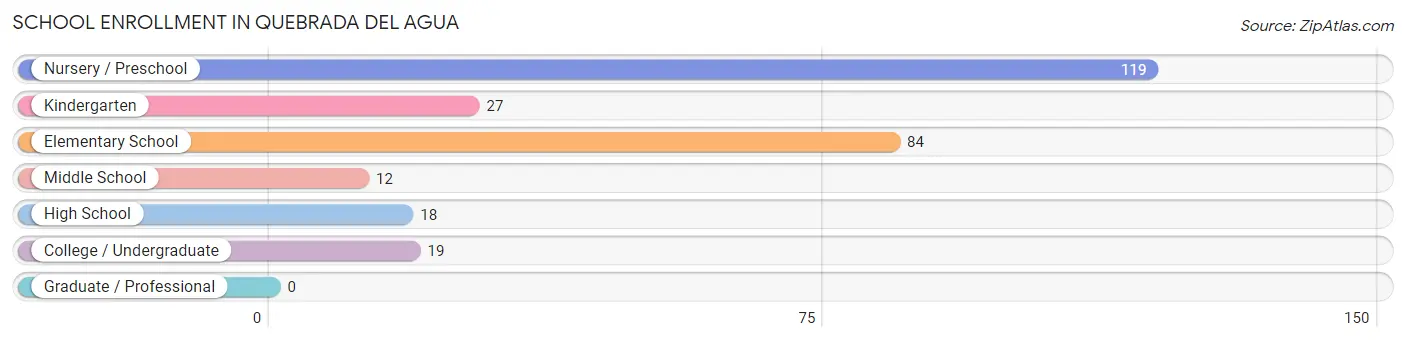
School Enrollment in Quebrada del Agua
The most common levels of schooling among the 279 students in Quebrada del Agua are nursery / preschool (119 | 42.6%), elementary school (84 | 30.1%), and kindergarten (27 | 9.7%).
| School Level | # Students | % Students |
| Nursery / Preschool | 119 | 42.6% |
| Kindergarten | 27 | 9.7% |
| Elementary School | 84 | 30.1% |
| Middle School | 12 | 4.3% |
| High School | 18 | 6.5% |
| College / Undergraduate | 19 | 6.8% |
| Graduate / Professional | 0 | 0.0% |
| Total | 279 | 100.0% |
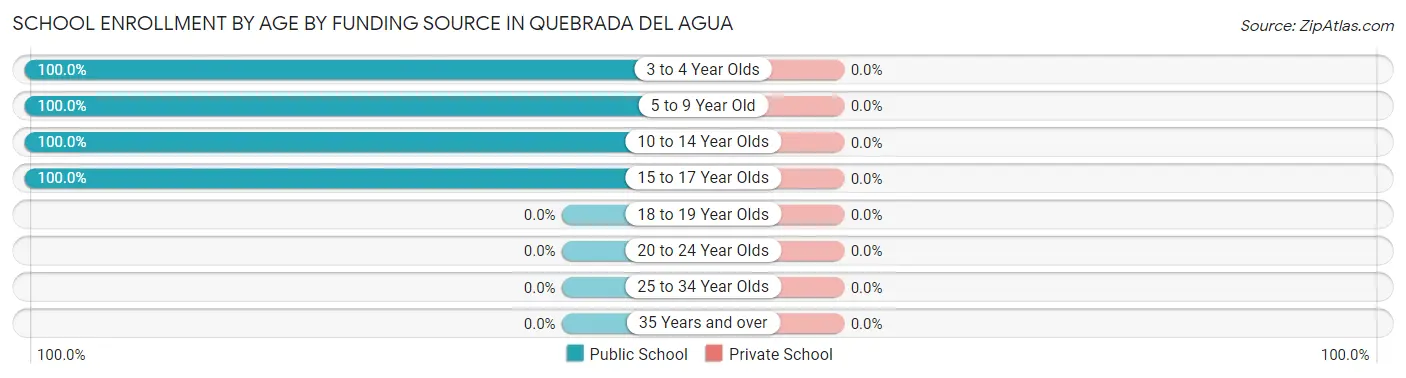
School Enrollment by Age by Funding Source in Quebrada del Agua
| Age Bracket | Public School | Private School |
| 3 to 4 Year Olds | 146 (100.0%) | 0 (0.0%) |
| 5 to 9 Year Old | 46 (100.0%) | 0 (0.0%) |
| 10 to 14 Year Olds | 50 (100.0%) | 0 (0.0%) |
| 15 to 17 Year Olds | 37 (100.0%) | 0 (0.0%) |
| 18 to 19 Year Olds | 0 (0.0%) | 0 (0.0%) |
| 20 to 24 Year Olds | 0 (0.0%) | 0 (0.0%) |
| 25 to 34 Year Olds | 0 (0.0%) | 0 (0.0%) |
| 35 Years and over | 0 (0.0%) | 0 (0.0%) |
| Total | 279 (100.0%) | 0 (0.0%) |
Educational Attainment by Field of Study in Quebrada del Agua
Computers & mathematics (36 | 44.4%), education (26 | 32.1%), science & technology (15 | 18.5%), and business (4 | 4.9%) are the most common fields of study among 81 individuals in Quebrada del Agua who have obtained a bachelor's degree or higher.
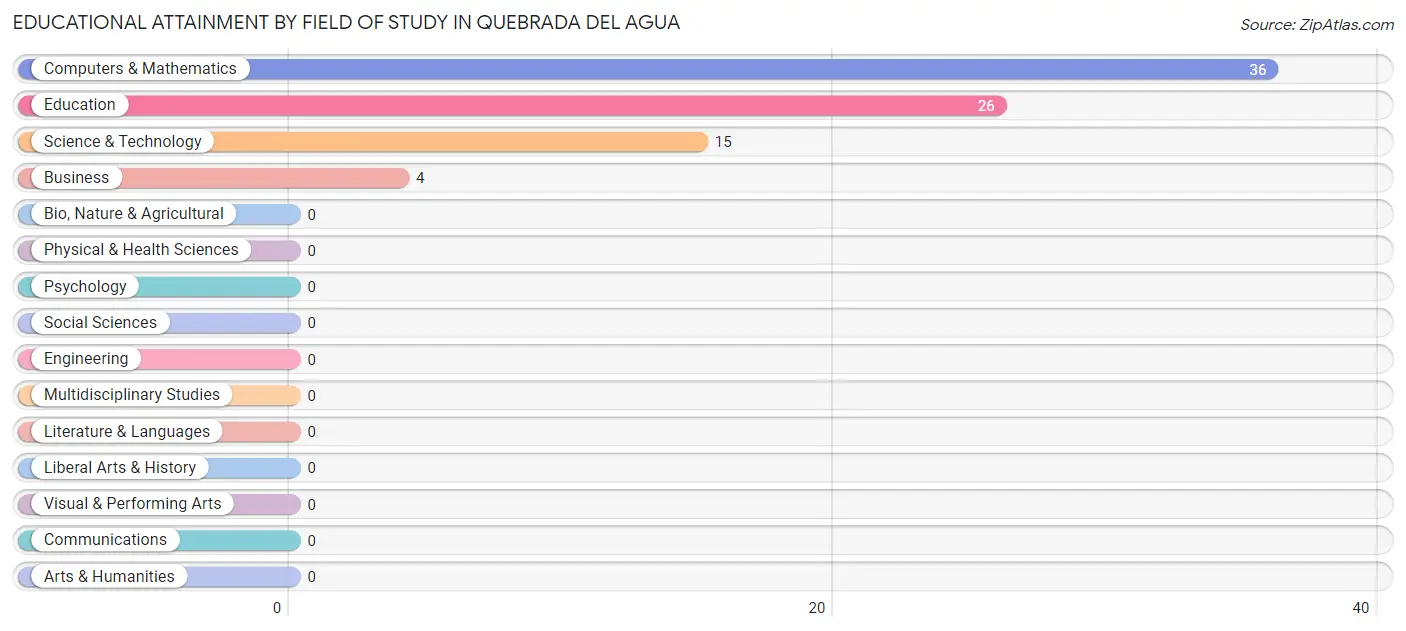
| Field of Study | # Graduates | % Graduates |
| Computers & Mathematics | 36 | 44.4% |
| Bio, Nature & Agricultural | 0 | 0.0% |
| Physical & Health Sciences | 0 | 0.0% |
| Psychology | 0 | 0.0% |
| Social Sciences | 0 | 0.0% |
| Engineering | 0 | 0.0% |
| Multidisciplinary Studies | 0 | 0.0% |
| Science & Technology | 15 | 18.5% |
| Business | 4 | 4.9% |
| Education | 26 | 32.1% |
| Literature & Languages | 0 | 0.0% |
| Liberal Arts & History | 0 | 0.0% |
| Visual & Performing Arts | 0 | 0.0% |
| Communications | 0 | 0.0% |
| Arts & Humanities | 0 | 0.0% |
| Total | 81 | 100.0% |
Transportation & Commute in Quebrada del Agua
Vehicle Availability by Sex in Quebrada del Agua
The most prevalent vehicle ownership categories in Quebrada del Agua are males with 2 vehicles (159, accounting for 57.0%) and females with 2 vehicles (112, making up 103.9%).
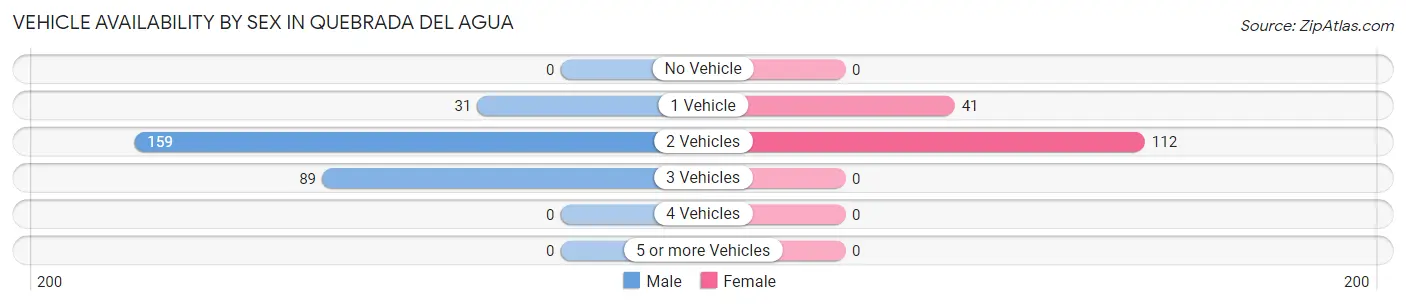
| Vehicles Available | Male | Female |
| No Vehicle | 0 (0.0%) | 0 (0.0%) |
| 1 Vehicle | 31 (11.1%) | 41 (26.8%) |
| 2 Vehicles | 159 (57.0%) | 112 (73.2%) |
| 3 Vehicles | 89 (31.9%) | 0 (0.0%) |
| 4 Vehicles | 0 (0.0%) | 0 (0.0%) |
| 5 or more Vehicles | 0 (0.0%) | 0 (0.0%) |
| Total | 279 (100.0%) | 153 (100.0%) |
Commute Time in Quebrada del Agua
The most frequently occuring commute durations in Quebrada del Agua are 20 to 24 minutes (156 commuters, 39.3%), 30 to 34 minutes (95 commuters, 23.9%), and 15 to 19 minutes (57 commuters, 14.4%).
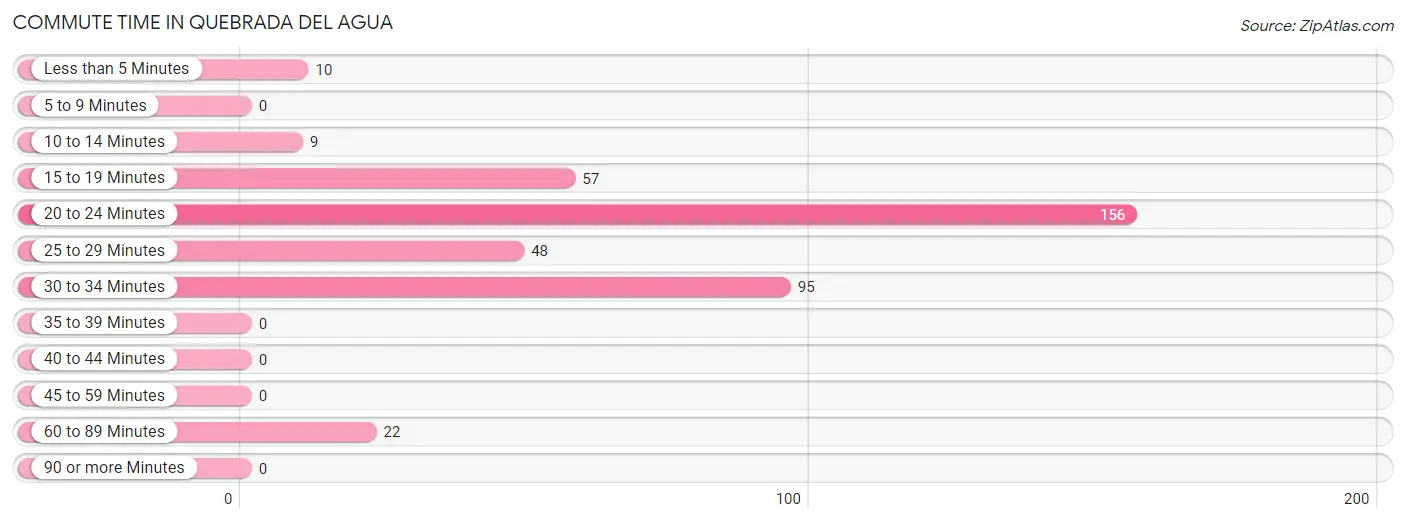
| Commute Time | # Commuters | % Commuters |
| Less than 5 Minutes | 10 | 2.5% |
| 5 to 9 Minutes | 0 | 0.0% |
| 10 to 14 Minutes | 9 | 2.3% |
| 15 to 19 Minutes | 57 | 14.4% |
| 20 to 24 Minutes | 156 | 39.3% |
| 25 to 29 Minutes | 48 | 12.1% |
| 30 to 34 Minutes | 95 | 23.9% |
| 35 to 39 Minutes | 0 | 0.0% |
| 40 to 44 Minutes | 0 | 0.0% |
| 45 to 59 Minutes | 0 | 0.0% |
| 60 to 89 Minutes | 22 | 5.5% |
| 90 or more Minutes | 0 | 0.0% |
Commute Time by Sex in Quebrada del Agua
The most common commute times in Quebrada del Agua are 20 to 24 minutes (108 commuters, 38.7%) for males and 30 to 34 minutes (53 commuters, 44.9%) for females.
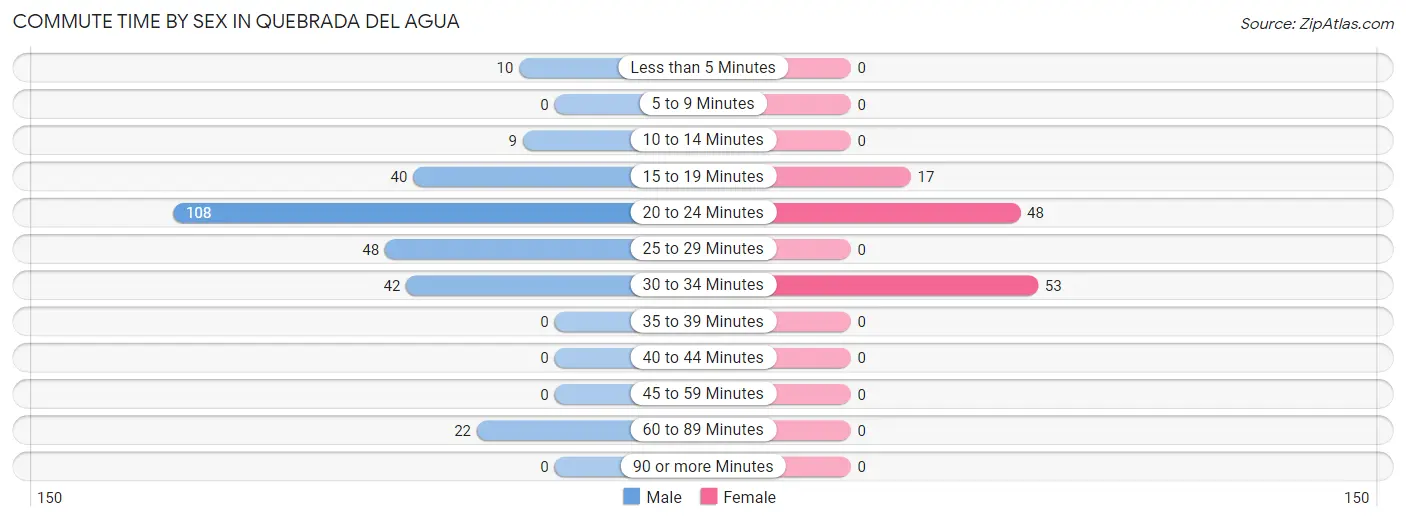
| Commute Time | Male | Female |
| Less than 5 Minutes | 10 (3.6%) | 0 (0.0%) |
| 5 to 9 Minutes | 0 (0.0%) | 0 (0.0%) |
| 10 to 14 Minutes | 9 (3.2%) | 0 (0.0%) |
| 15 to 19 Minutes | 40 (14.3%) | 17 (14.4%) |
| 20 to 24 Minutes | 108 (38.7%) | 48 (40.7%) |
| 25 to 29 Minutes | 48 (17.2%) | 0 (0.0%) |
| 30 to 34 Minutes | 42 (15.0%) | 53 (44.9%) |
| 35 to 39 Minutes | 0 (0.0%) | 0 (0.0%) |
| 40 to 44 Minutes | 0 (0.0%) | 0 (0.0%) |
| 45 to 59 Minutes | 0 (0.0%) | 0 (0.0%) |
| 60 to 89 Minutes | 22 (7.9%) | 0 (0.0%) |
| 90 or more Minutes | 0 (0.0%) | 0 (0.0%) |
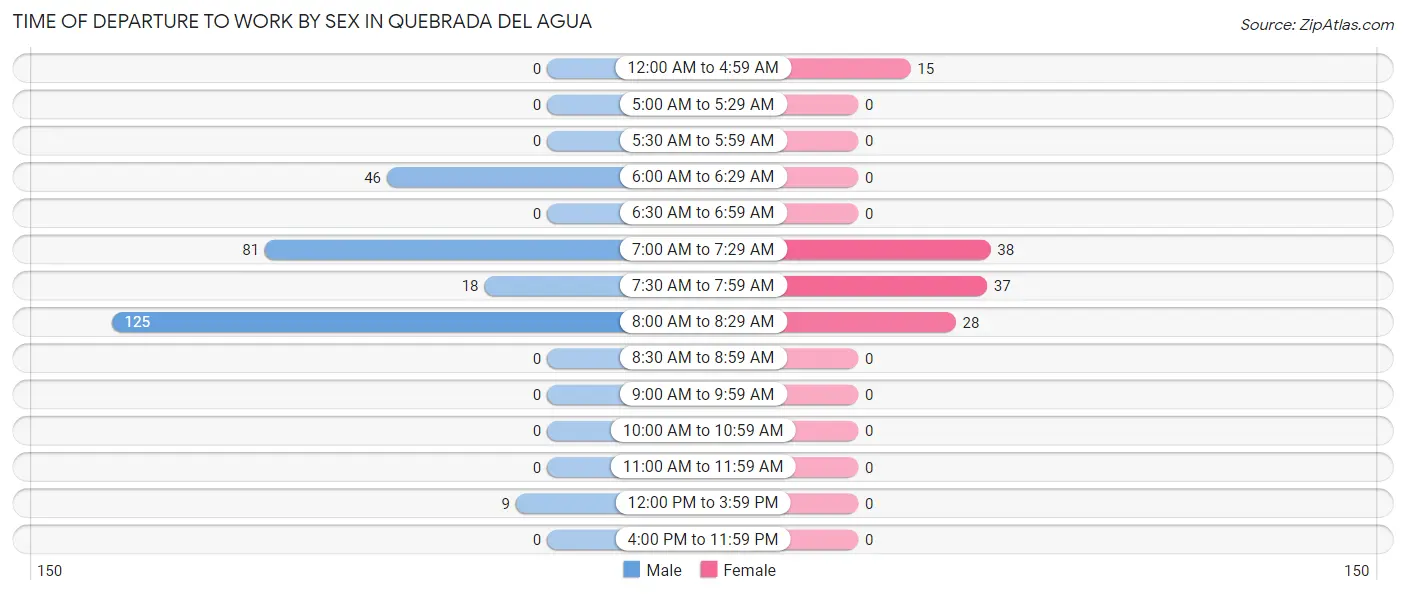
Time of Departure to Work by Sex in Quebrada del Agua
The most frequent times of departure to work in Quebrada del Agua are 8:00 AM to 8:29 AM (125, 44.8%) for males and 7:00 AM to 7:29 AM (38, 32.2%) for females.
| Time of Departure | Male | Female |
| 12:00 AM to 4:59 AM | 0 (0.0%) | 15 (12.7%) |
| 5:00 AM to 5:29 AM | 0 (0.0%) | 0 (0.0%) |
| 5:30 AM to 5:59 AM | 0 (0.0%) | 0 (0.0%) |
| 6:00 AM to 6:29 AM | 46 (16.5%) | 0 (0.0%) |
| 6:30 AM to 6:59 AM | 0 (0.0%) | 0 (0.0%) |
| 7:00 AM to 7:29 AM | 81 (29.0%) | 38 (32.2%) |
| 7:30 AM to 7:59 AM | 18 (6.5%) | 37 (31.4%) |
| 8:00 AM to 8:29 AM | 125 (44.8%) | 28 (23.7%) |
| 8:30 AM to 8:59 AM | 0 (0.0%) | 0 (0.0%) |
| 9:00 AM to 9:59 AM | 0 (0.0%) | 0 (0.0%) |
| 10:00 AM to 10:59 AM | 0 (0.0%) | 0 (0.0%) |
| 11:00 AM to 11:59 AM | 0 (0.0%) | 0 (0.0%) |
| 12:00 PM to 3:59 PM | 9 (3.2%) | 0 (0.0%) |
| 4:00 PM to 11:59 PM | 0 (0.0%) | 0 (0.0%) |
| Total | 279 (100.0%) | 118 (100.0%) |
Housing Occupancy in Quebrada del Agua
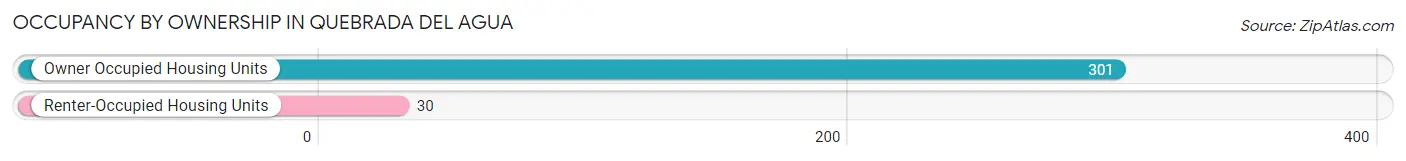
Occupancy by Ownership in Quebrada del Agua
Of the total 331 dwellings in Quebrada del Agua, owner-occupied units account for 301 (90.9%), while renter-occupied units make up 30 (9.1%).
| Occupancy | # Housing Units | % Housing Units |
| Owner Occupied Housing Units | 301 | 90.9% |
| Renter-Occupied Housing Units | 30 | 9.1% |
| Total Occupied Housing Units | 331 | 100.0% |
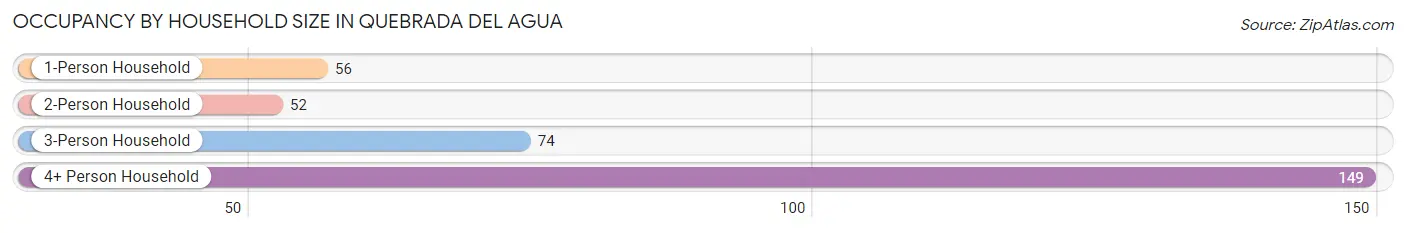
Occupancy by Household Size in Quebrada del Agua
| Household Size | # Housing Units | % Housing Units |
| 1-Person Household | 56 | 16.9% |
| 2-Person Household | 52 | 15.7% |
| 3-Person Household | 74 | 22.4% |
| 4+ Person Household | 149 | 45.0% |
| Total Housing Units | 331 | 100.0% |
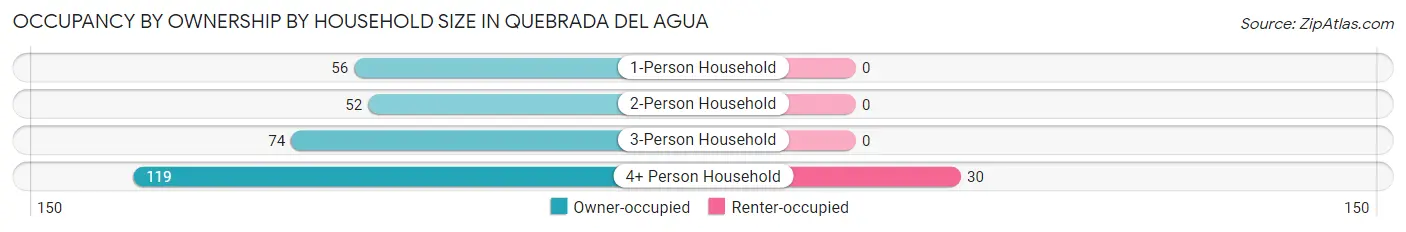
Occupancy by Ownership by Household Size in Quebrada del Agua
| Household Size | Owner-occupied | Renter-occupied |
| 1-Person Household | 56 (100.0%) | 0 (0.0%) |
| 2-Person Household | 52 (100.0%) | 0 (0.0%) |
| 3-Person Household | 74 (100.0%) | 0 (0.0%) |
| 4+ Person Household | 119 (79.9%) | 30 (20.1%) |
| Total Housing Units | 301 (90.9%) | 30 (9.1%) |
Occupancy by Educational Attainment in Quebrada del Agua
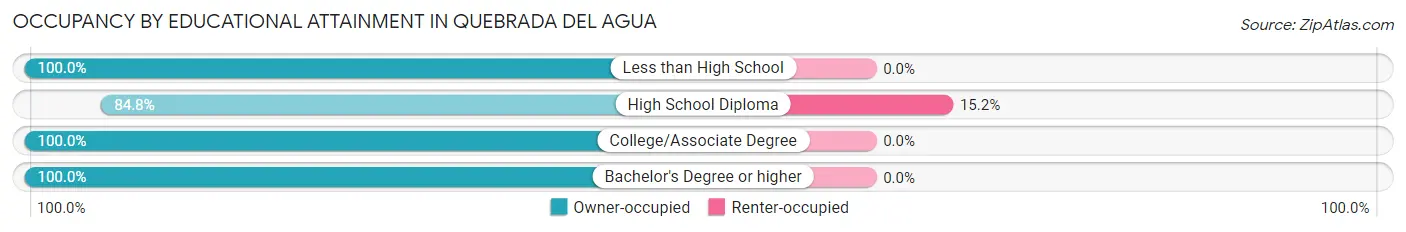
| Household Size | Owner-occupied | Renter-occupied |
| Less than High School | 70 (100.0%) | 0 (0.0%) |
| High School Diploma | 167 (84.8%) | 30 (15.2%) |
| College/Associate Degree | 23 (100.0%) | 0 (0.0%) |
| Bachelor's Degree or higher | 41 (100.0%) | 0 (0.0%) |
Occupancy by Age of Householder in Quebrada del Agua
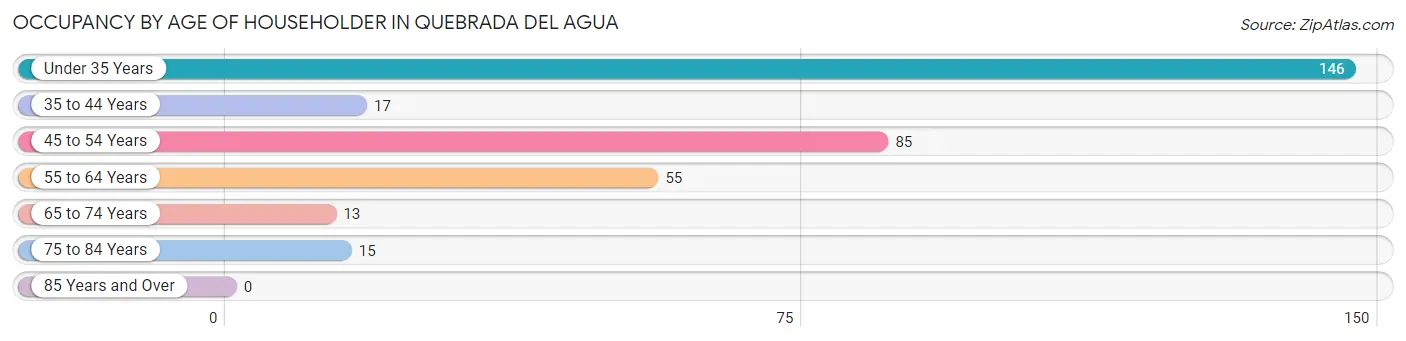
| Age Bracket | # Households | % Households |
| Under 35 Years | 146 | 44.1% |
| 35 to 44 Years | 17 | 5.1% |
| 45 to 54 Years | 85 | 25.7% |
| 55 to 64 Years | 55 | 16.6% |
| 65 to 74 Years | 13 | 3.9% |
| 75 to 84 Years | 15 | 4.5% |
| 85 Years and Over | 0 | 0.0% |
| Total | 331 | 100.0% |
Housing Finances in Quebrada del Agua
Median Income by Occupancy in Quebrada del Agua
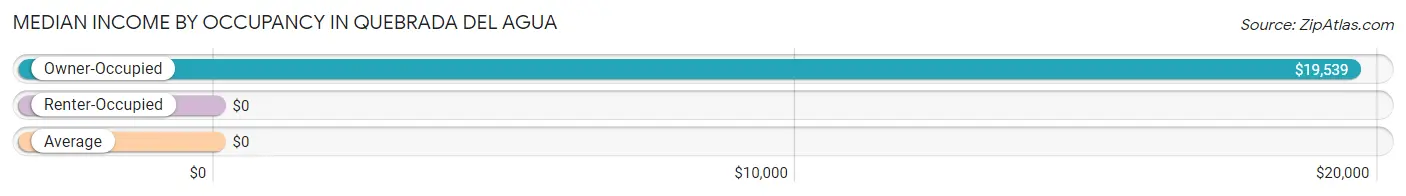
| Occupancy Type | # Households | Median Income |
| Owner-Occupied | 301 (90.9%) | $19,539 |
| Renter-Occupied | 30 (9.1%) | $0 |
| Average | 331 (100.0%) | $0 |
Occupancy by Householder Income Bracket in Quebrada del Agua
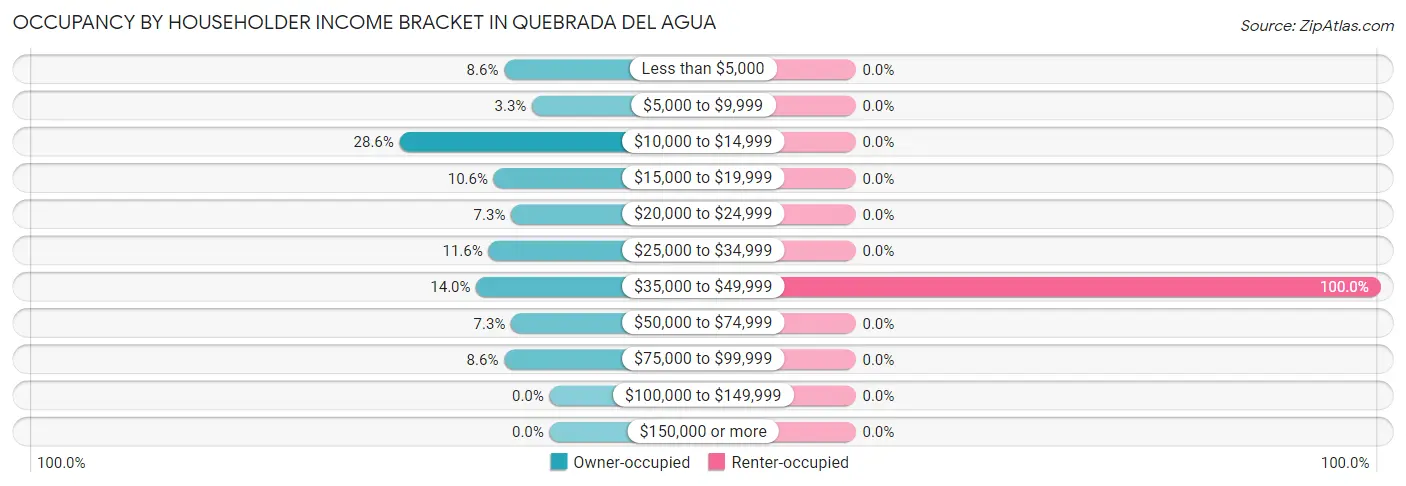
| Income Bracket | Owner-occupied | Renter-occupied |
| Less than $5,000 | 26 (8.6%) | 0 (0.0%) |
| $5,000 to $9,999 | 10 (3.3%) | 0 (0.0%) |
| $10,000 to $14,999 | 86 (28.6%) | 0 (0.0%) |
| $15,000 to $19,999 | 32 (10.6%) | 0 (0.0%) |
| $20,000 to $24,999 | 22 (7.3%) | 0 (0.0%) |
| $25,000 to $34,999 | 35 (11.6%) | 0 (0.0%) |
| $35,000 to $49,999 | 42 (14.0%) | 30 (100.0%) |
| $50,000 to $74,999 | 22 (7.3%) | 0 (0.0%) |
| $75,000 to $99,999 | 26 (8.6%) | 0 (0.0%) |
| $100,000 to $149,999 | 0 (0.0%) | 0 (0.0%) |
| $150,000 or more | 0 (0.0%) | 0 (0.0%) |
| Total | 301 (100.0%) | 30 (100.0%) |
Monthly Housing Cost Tiers in Quebrada del Agua
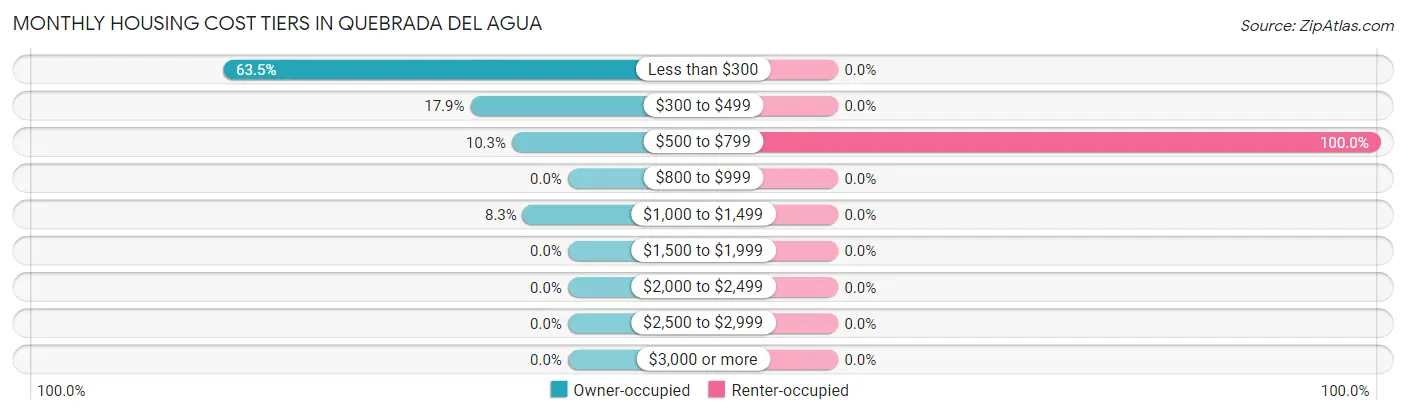
| Monthly Cost | Owner-occupied | Renter-occupied |
| Less than $300 | 191 (63.5%) | 0 (0.0%) |
| $300 to $499 | 54 (17.9%) | 0 (0.0%) |
| $500 to $799 | 31 (10.3%) | 30 (100.0%) |
| $800 to $999 | 0 (0.0%) | 0 (0.0%) |
| $1,000 to $1,499 | 25 (8.3%) | 0 (0.0%) |
| $1,500 to $1,999 | 0 (0.0%) | 0 (0.0%) |
| $2,000 to $2,499 | 0 (0.0%) | 0 (0.0%) |
| $2,500 to $2,999 | 0 (0.0%) | 0 (0.0%) |
| $3,000 or more | 0 (0.0%) | 0 (0.0%) |
| Total | 301 (100.0%) | 30 (100.0%) |
Physical Housing Characteristics in Quebrada del Agua
Housing Structures in Quebrada del Agua
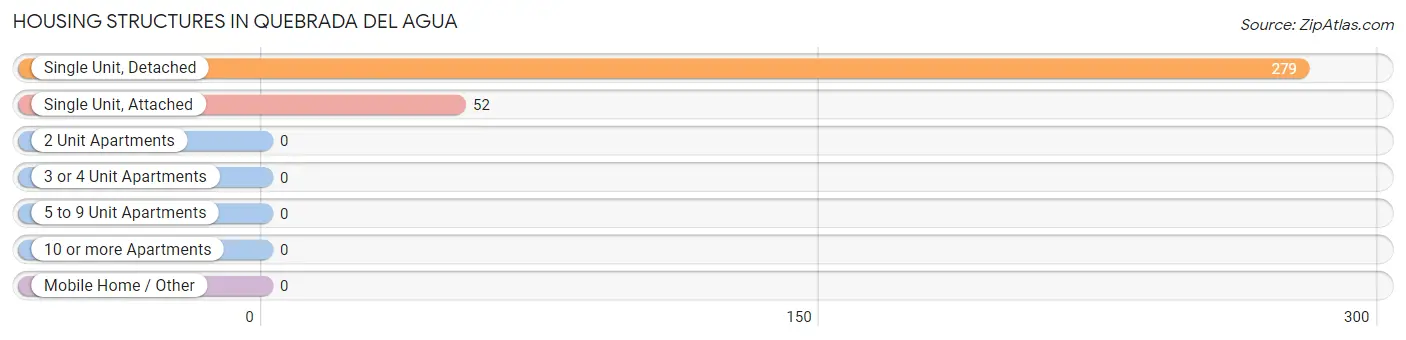
| Structure Type | # Housing Units | % Housing Units |
| Single Unit, Detached | 279 | 84.3% |
| Single Unit, Attached | 52 | 15.7% |
| 2 Unit Apartments | 0 | 0.0% |
| 3 or 4 Unit Apartments | 0 | 0.0% |
| 5 to 9 Unit Apartments | 0 | 0.0% |
| 10 or more Apartments | 0 | 0.0% |
| Mobile Home / Other | 0 | 0.0% |
| Total | 331 | 100.0% |
Housing Structures by Occupancy in Quebrada del Agua
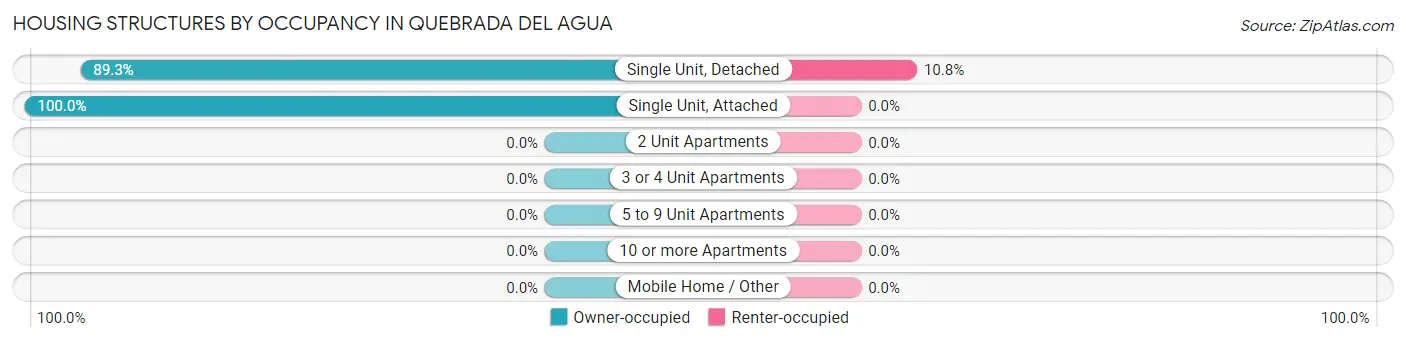
| Structure Type | Owner-occupied | Renter-occupied |
| Single Unit, Detached | 249 (89.2%) | 30 (10.7%) |
| Single Unit, Attached | 52 (100.0%) | 0 (0.0%) |
| 2 Unit Apartments | 0 (0.0%) | 0 (0.0%) |
| 3 or 4 Unit Apartments | 0 (0.0%) | 0 (0.0%) |
| 5 to 9 Unit Apartments | 0 (0.0%) | 0 (0.0%) |
| 10 or more Apartments | 0 (0.0%) | 0 (0.0%) |
| Mobile Home / Other | 0 (0.0%) | 0 (0.0%) |
| Total | 301 (90.9%) | 30 (9.1%) |
Housing Structures by Number of Rooms in Quebrada del Agua
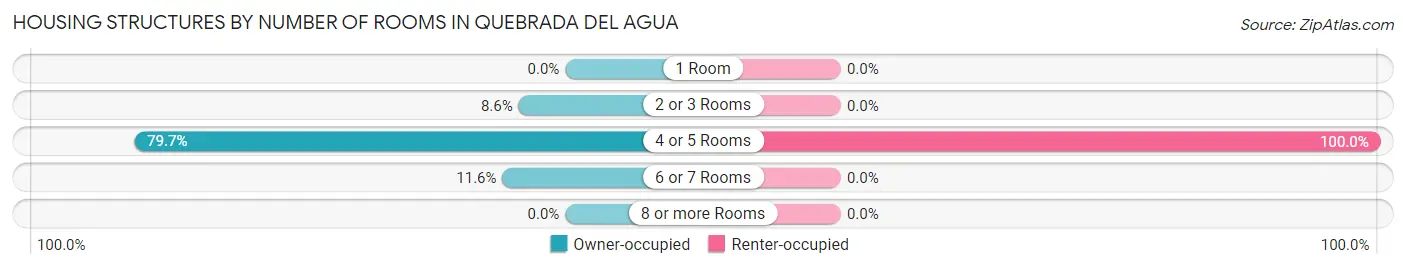
| Number of Rooms | Owner-occupied | Renter-occupied |
| 1 Room | 0 (0.0%) | 0 (0.0%) |
| 2 or 3 Rooms | 26 (8.6%) | 0 (0.0%) |
| 4 or 5 Rooms | 240 (79.7%) | 30 (100.0%) |
| 6 or 7 Rooms | 35 (11.6%) | 0 (0.0%) |
| 8 or more Rooms | 0 (0.0%) | 0 (0.0%) |
| Total | 301 (100.0%) | 30 (100.0%) |
Housing Structure by Heating Type in Quebrada del Agua
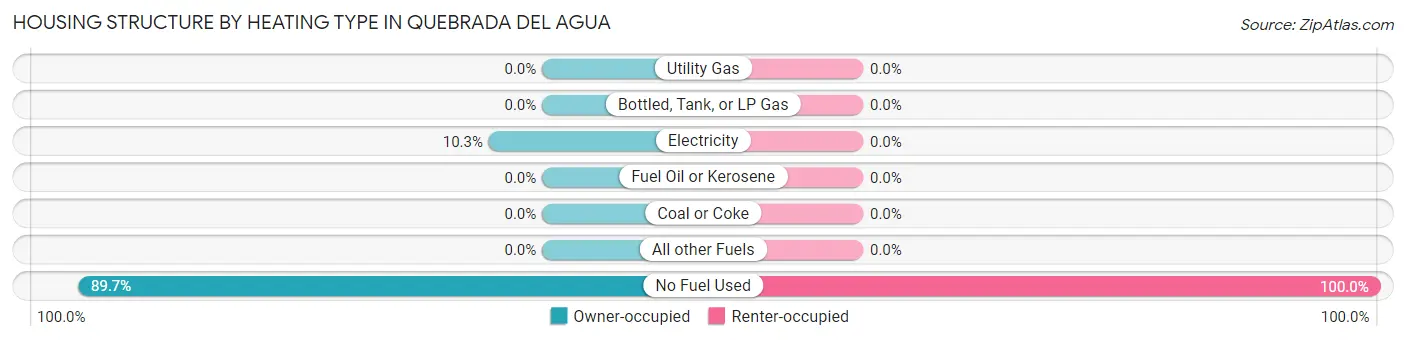
| Heating Type | Owner-occupied | Renter-occupied |
| Utility Gas | 0 (0.0%) | 0 (0.0%) |
| Bottled, Tank, or LP Gas | 0 (0.0%) | 0 (0.0%) |
| Electricity | 31 (10.3%) | 0 (0.0%) |
| Fuel Oil or Kerosene | 0 (0.0%) | 0 (0.0%) |
| Coal or Coke | 0 (0.0%) | 0 (0.0%) |
| All other Fuels | 0 (0.0%) | 0 (0.0%) |
| No Fuel Used | 270 (89.7%) | 30 (100.0%) |
| Total | 301 (100.0%) | 30 (100.0%) |
Household Vehicle Usage in Quebrada del Agua
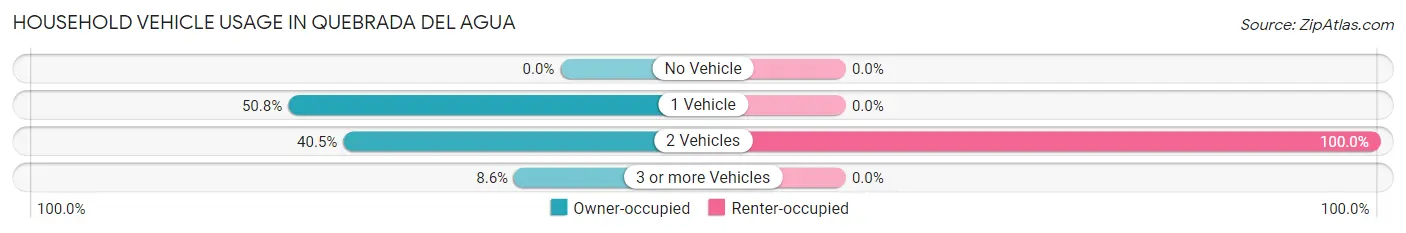
| Vehicles per Household | Owner-occupied | Renter-occupied |
| No Vehicle | 0 (0.0%) | 0 (0.0%) |
| 1 Vehicle | 153 (50.8%) | 0 (0.0%) |
| 2 Vehicles | 122 (40.5%) | 30 (100.0%) |
| 3 or more Vehicles | 26 (8.6%) | 0 (0.0%) |
| Total | 301 (100.0%) | 30 (100.0%) |
Real Estate & Mortgages in Quebrada del Agua
Real Estate and Mortgage Overview in Quebrada del Agua
| Characteristic | Without Mortgage | With Mortgage |
| Housing Units | 267 | 34 |
| Median Property Value | $83,800 | $0 |
| Median Household Income | $19,803 | $0 |
| Monthly Housing Costs | $230 | $0 |
| Real Estate Taxes | - | - |
Property Value by Mortgage Status in Quebrada del Agua
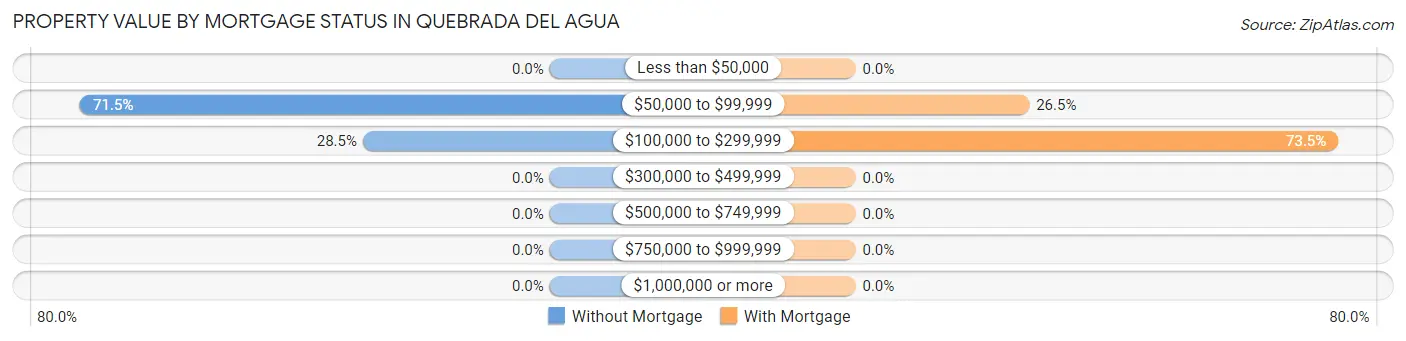
| Property Value | Without Mortgage | With Mortgage |
| Less than $50,000 | 0 (0.0%) | 0 (0.0%) |
| $50,000 to $99,999 | 191 (71.5%) | 9 (26.5%) |
| $100,000 to $299,999 | 76 (28.5%) | 25 (73.5%) |
| $300,000 to $499,999 | 0 (0.0%) | 0 (0.0%) |
| $500,000 to $749,999 | 0 (0.0%) | 0 (0.0%) |
| $750,000 to $999,999 | 0 (0.0%) | 0 (0.0%) |
| $1,000,000 or more | 0 (0.0%) | 0 (0.0%) |
| Total | 267 (100.0%) | 34 (100.0%) |
Household Income by Mortgage Status in Quebrada del Agua
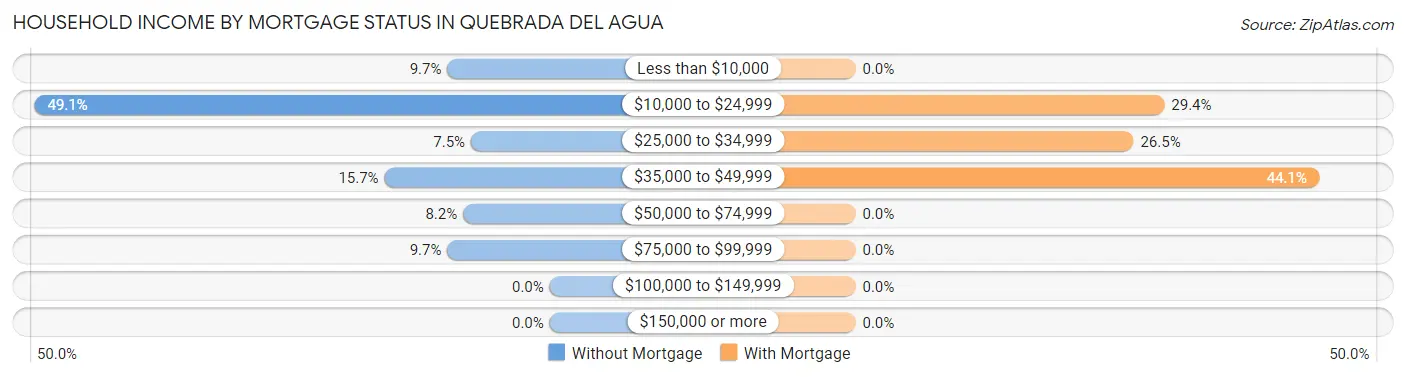
| Household Income | Without Mortgage | With Mortgage |
| Less than $10,000 | 26 (9.7%) | 0 (0.0%) |
| $10,000 to $24,999 | 131 (49.1%) | 10 (29.4%) |
| $25,000 to $34,999 | 20 (7.5%) | 9 (26.5%) |
| $35,000 to $49,999 | 42 (15.7%) | 15 (44.1%) |
| $50,000 to $74,999 | 22 (8.2%) | 0 (0.0%) |
| $75,000 to $99,999 | 26 (9.7%) | 0 (0.0%) |
| $100,000 to $149,999 | 0 (0.0%) | 0 (0.0%) |
| $150,000 or more | 0 (0.0%) | 0 (0.0%) |
| Total | 267 (100.0%) | 34 (100.0%) |
Property Value to Household Income Ratio in Quebrada del Agua
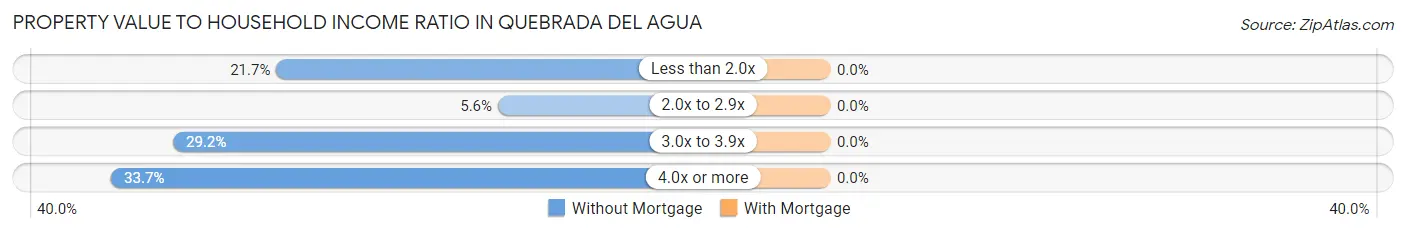
| Value-to-Income Ratio | Without Mortgage | With Mortgage |
| Less than 2.0x | 58 (21.7%) | 0 (0.0%) |
| 2.0x to 2.9x | 15 (5.6%) | 0 (0.0%) |
| 3.0x to 3.9x | 78 (29.2%) | 0 (0.0%) |
| 4.0x or more | 90 (33.7%) | 0 (0.0%) |
| Total | 267 (100.0%) | 34 (100.0%) |
Real Estate Taxes by Mortgage Status in Quebrada del Agua
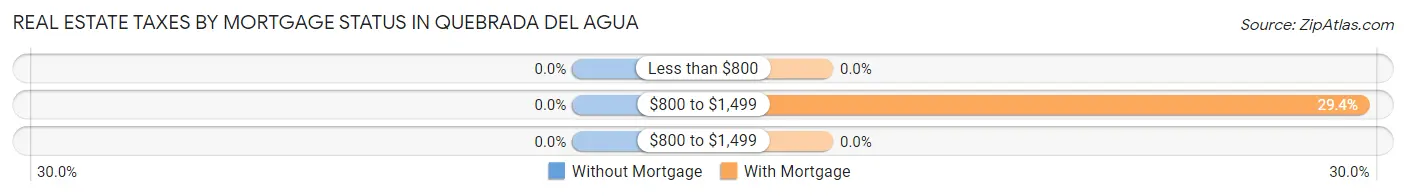
| Property Taxes | Without Mortgage | With Mortgage |
| Less than $800 | 0 (0.0%) | 0 (0.0%) |
| $800 to $1,499 | 0 (0.0%) | 10 (29.4%) |
| $800 to $1,499 | 0 (0.0%) | 0 (0.0%) |
| Total | 267 (100.0%) | 34 (100.0%) |
Health & Disability in Quebrada del Agua
Health Insurance Coverage by Age in Quebrada del Agua
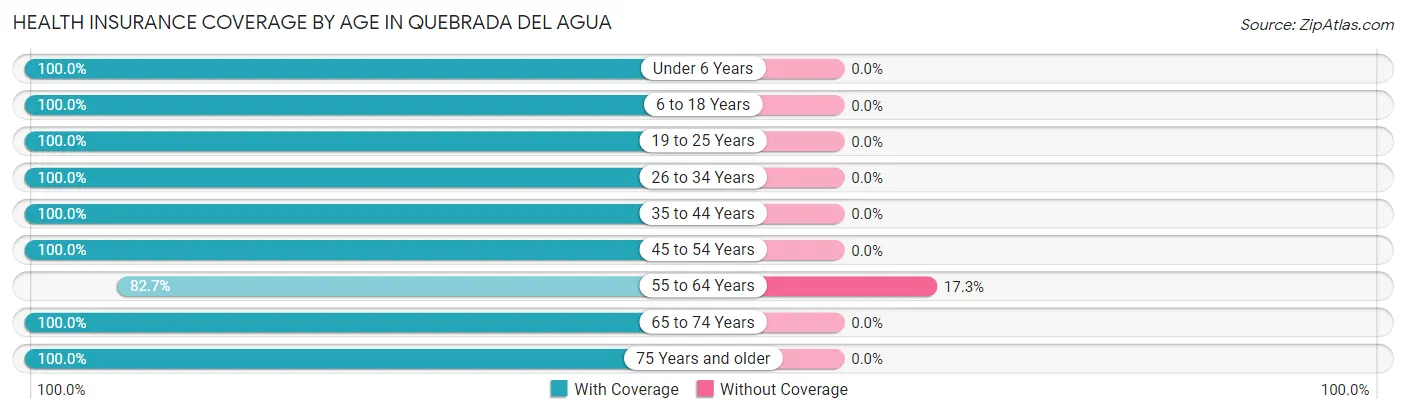
| Age Bracket | With Coverage | Without Coverage |
| Under 6 Years | 255 (100.0%) | 0 (0.0%) |
| 6 to 18 Years | 133 (100.0%) | 0 (0.0%) |
| 19 to 25 Years | 130 (100.0%) | 0 (0.0%) |
| 26 to 34 Years | 250 (100.0%) | 0 (0.0%) |
| 35 to 44 Years | 88 (100.0%) | 0 (0.0%) |
| 45 to 54 Years | 104 (100.0%) | 0 (0.0%) |
| 55 to 64 Years | 91 (82.7%) | 19 (17.3%) |
| 65 to 74 Years | 49 (100.0%) | 0 (0.0%) |
| 75 Years and older | 15 (100.0%) | 0 (0.0%) |
| Total | 1,115 (98.3%) | 19 (1.7%) |
Health Insurance Coverage by Citizenship Status in Quebrada del Agua
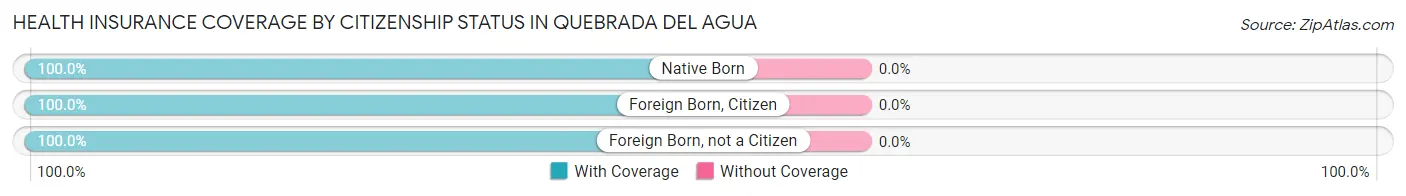
| Citizenship Status | With Coverage | Without Coverage |
| Native Born | 255 (100.0%) | 0 (0.0%) |
| Foreign Born, Citizen | 133 (100.0%) | 0 (0.0%) |
| Foreign Born, not a Citizen | 130 (100.0%) | 0 (0.0%) |
Health Insurance Coverage by Household Income in Quebrada del Agua
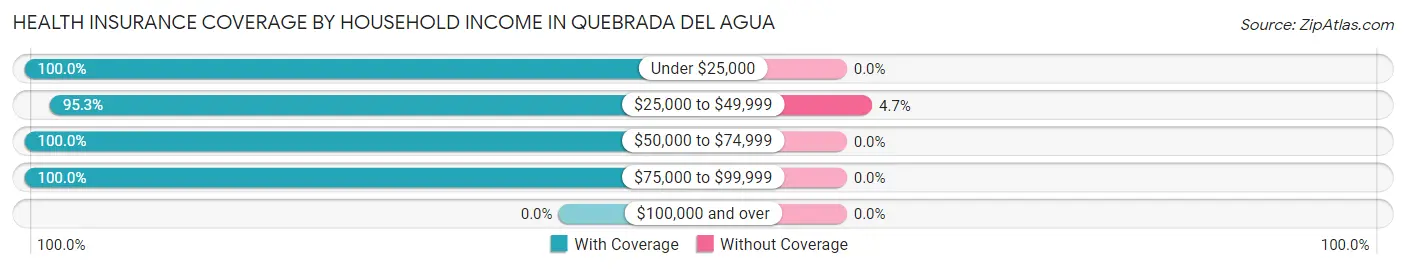
| Household Income | With Coverage | Without Coverage |
| Under $25,000 | 495 (100.0%) | 0 (0.0%) |
| $25,000 to $49,999 | 382 (95.3%) | 19 (4.7%) |
| $50,000 to $74,999 | 149 (100.0%) | 0 (0.0%) |
| $75,000 to $99,999 | 89 (100.0%) | 0 (0.0%) |
| $100,000 and over | 0 (0.0%) | 0 (0.0%) |
Public vs Private Health Insurance Coverage by Age in Quebrada del Agua
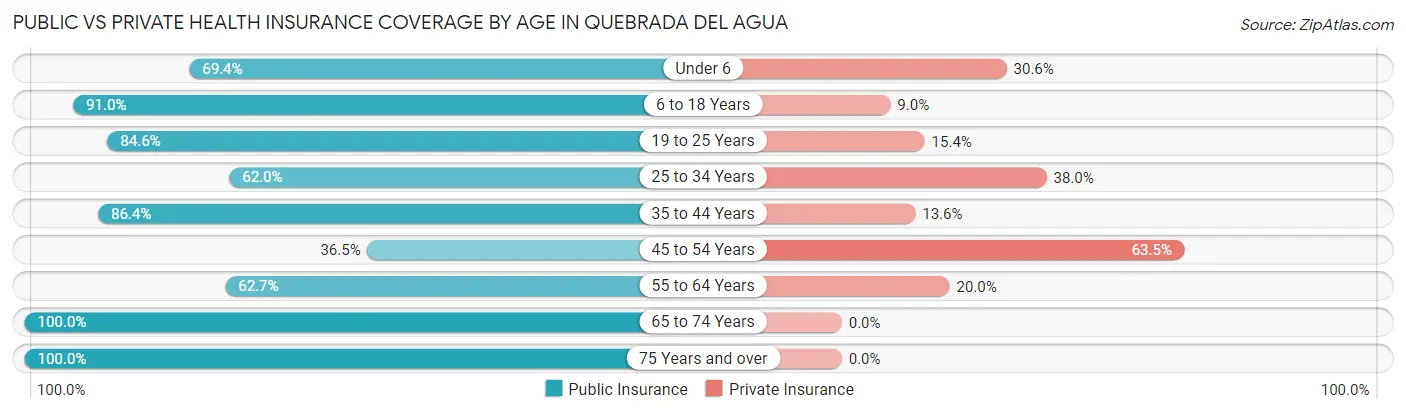
| Age Bracket | Public Insurance | Private Insurance |
| Under 6 | 177 (69.4%) | 78 (30.6%) |
| 6 to 18 Years | 121 (91.0%) | 12 (9.0%) |
| 19 to 25 Years | 110 (84.6%) | 20 (15.4%) |
| 25 to 34 Years | 155 (62.0%) | 95 (38.0%) |
| 35 to 44 Years | 76 (86.4%) | 12 (13.6%) |
| 45 to 54 Years | 38 (36.5%) | 66 (63.5%) |
| 55 to 64 Years | 69 (62.7%) | 22 (20.0%) |
| 65 to 74 Years | 49 (100.0%) | 0 (0.0%) |
| 75 Years and over | 15 (100.0%) | 0 (0.0%) |
| Total | 810 (71.4%) | 305 (26.9%) |
Disability Status by Sex by Age in Quebrada del Agua
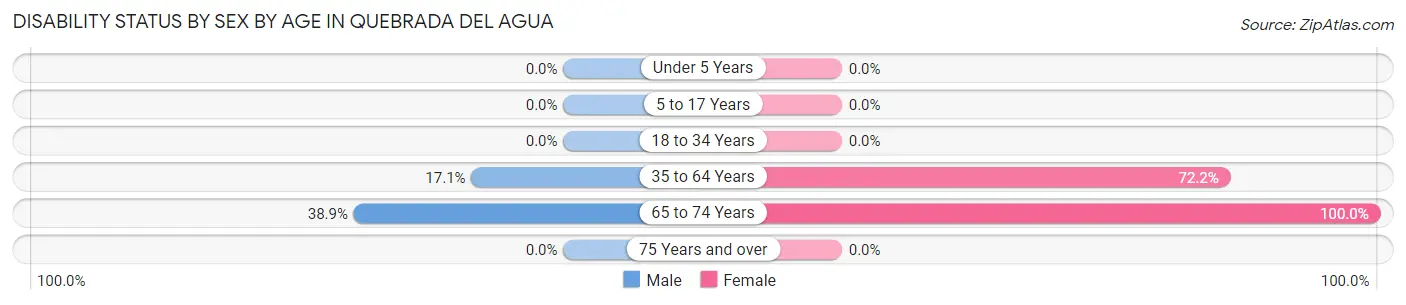
| Age Bracket | Male | Female |
| Under 5 Years | 0 (0.0%) | 0 (0.0%) |
| 5 to 17 Years | 0 (0.0%) | 0 (0.0%) |
| 18 to 34 Years | 0 (0.0%) | 0 (0.0%) |
| 35 to 64 Years | 35 (17.1%) | 70 (72.2%) |
| 65 to 74 Years | 14 (38.9%) | 13 (100.0%) |
| 75 Years and over | 0 (0.0%) | 0 (0.0%) |
Disability Class by Sex by Age in Quebrada del Agua
Disability Class: Hearing Difficulty
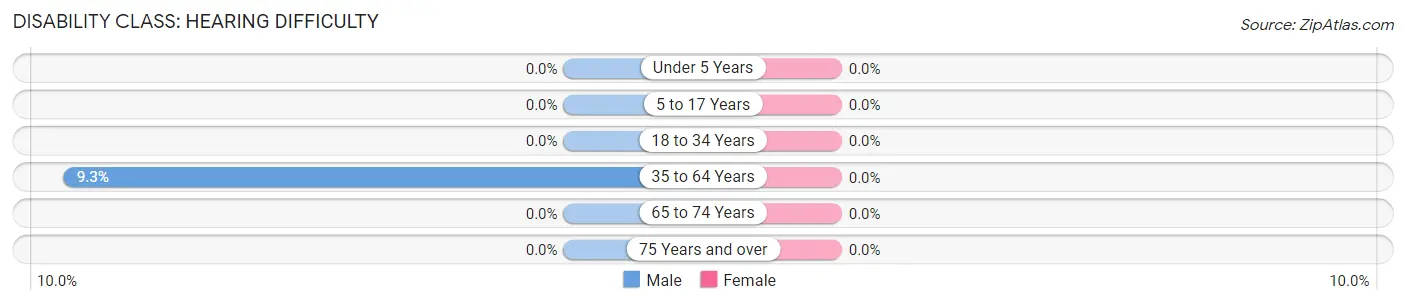
| Age Bracket | Male | Female |
| Under 5 Years | 0 (0.0%) | 0 (0.0%) |
| 5 to 17 Years | 0 (0.0%) | 0 (0.0%) |
| 18 to 34 Years | 0 (0.0%) | 0 (0.0%) |
| 35 to 64 Years | 19 (9.3%) | 0 (0.0%) |
| 65 to 74 Years | 0 (0.0%) | 0 (0.0%) |
| 75 Years and over | 0 (0.0%) | 0 (0.0%) |
Disability Class: Vision Difficulty
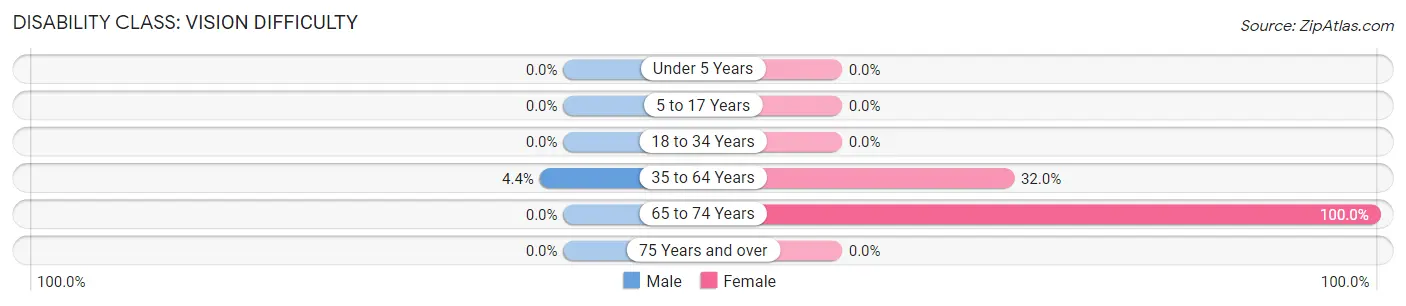
| Age Bracket | Male | Female |
| Under 5 Years | 0 (0.0%) | 0 (0.0%) |
| 5 to 17 Years | 0 (0.0%) | 0 (0.0%) |
| 18 to 34 Years | 0 (0.0%) | 0 (0.0%) |
| 35 to 64 Years | 9 (4.4%) | 31 (32.0%) |
| 65 to 74 Years | 0 (0.0%) | 13 (100.0%) |
| 75 Years and over | 0 (0.0%) | 0 (0.0%) |
Disability Class: Cognitive Difficulty
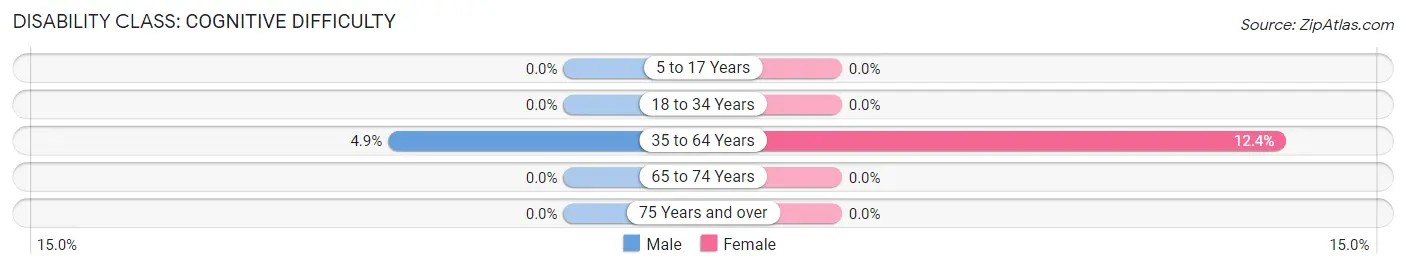
| Age Bracket | Male | Female |
| 5 to 17 Years | 0 (0.0%) | 0 (0.0%) |
| 18 to 34 Years | 0 (0.0%) | 0 (0.0%) |
| 35 to 64 Years | 10 (4.9%) | 12 (12.4%) |
| 65 to 74 Years | 0 (0.0%) | 0 (0.0%) |
| 75 Years and over | 0 (0.0%) | 0 (0.0%) |
Disability Class: Ambulatory Difficulty
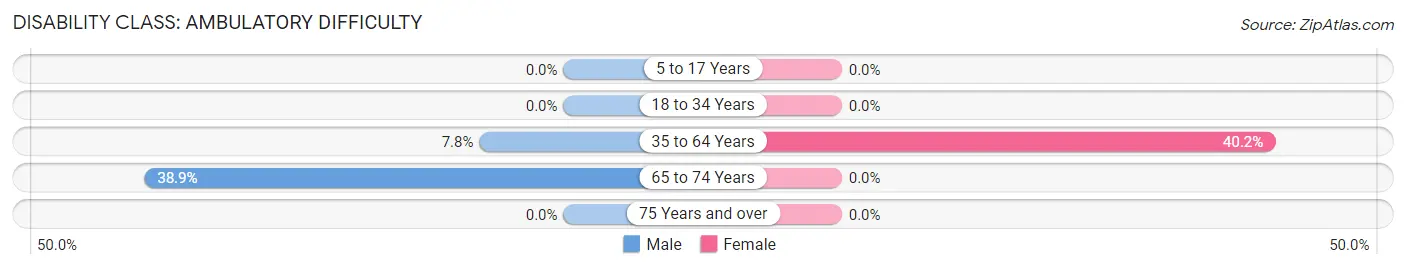
| Age Bracket | Male | Female |
| 5 to 17 Years | 0 (0.0%) | 0 (0.0%) |
| 18 to 34 Years | 0 (0.0%) | 0 (0.0%) |
| 35 to 64 Years | 16 (7.8%) | 39 (40.2%) |
| 65 to 74 Years | 14 (38.9%) | 0 (0.0%) |
| 75 Years and over | 0 (0.0%) | 0 (0.0%) |
Disability Class: Self-Care Difficulty
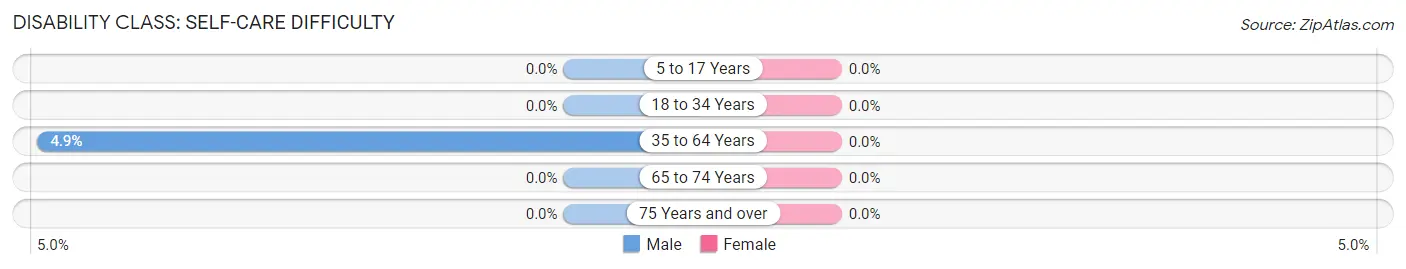
| Age Bracket | Male | Female |
| 5 to 17 Years | 0 (0.0%) | 0 (0.0%) |
| 18 to 34 Years | 0 (0.0%) | 0 (0.0%) |
| 35 to 64 Years | 10 (4.9%) | 0 (0.0%) |
| 65 to 74 Years | 0 (0.0%) | 0 (0.0%) |
| 75 Years and over | 0 (0.0%) | 0 (0.0%) |
Technology Access in Quebrada del Agua
Computing Device Access in Quebrada del Agua
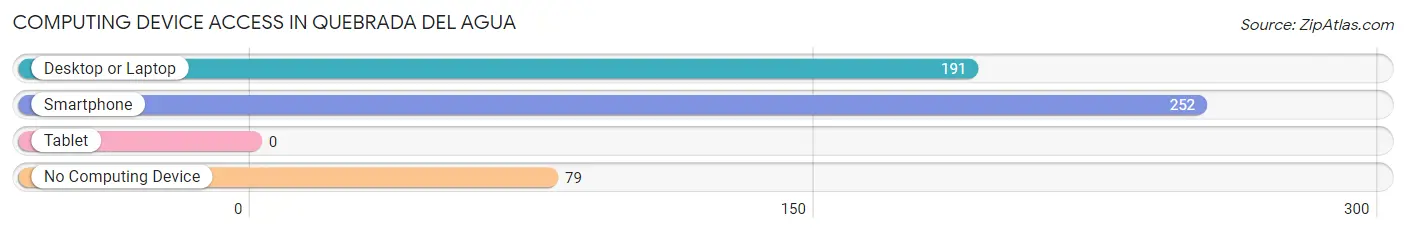
| Device Type | # Households | % Households |
| Desktop or Laptop | 191 | 57.7% |
| Smartphone | 252 | 76.1% |
| Tablet | 0 | 0.0% |
| No Computing Device | 79 | 23.9% |
| Total | 331 | 100.0% |
Internet Access in Quebrada del Agua
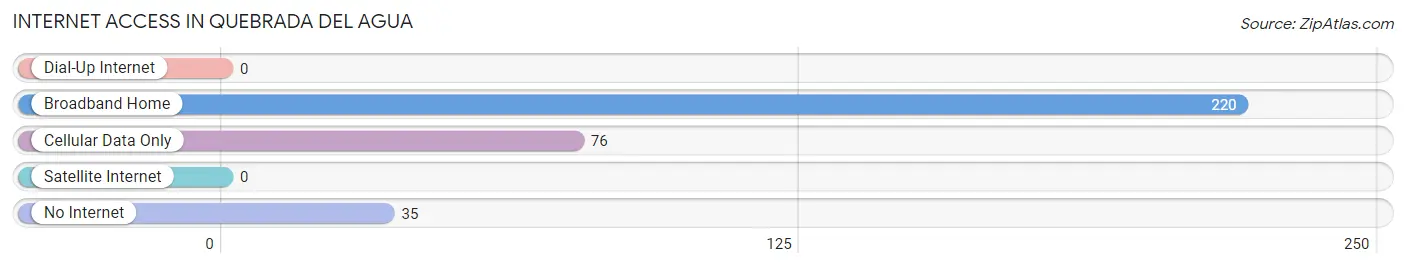
| Internet Type | # Households | % Households |
| Dial-Up Internet | 0 | 0.0% |
| Broadband Home | 220 | 66.5% |
| Cellular Data Only | 76 | 23.0% |
| Satellite Internet | 0 | 0.0% |
| No Internet | 35 | 10.6% |
| Total | 331 | 100.0% |
Quebrada del Agua Summary
Quebrada Del Agua is a small municipality located in the northern region of Puerto Rico. It is part of the San Juan-Caguas-Guaynabo Metropolitan Statistical Area. The municipality is located in the northern part of the island, in the foothills of the Cordillera Central mountain range. It is bordered by the municipalities of San Sebastián, Las Marías, and Maricao.
History
The area of Quebrada Del Agua was originally inhabited by the Taíno Indians. The Taíno were the indigenous people of Puerto Rico and the Caribbean. They were a peaceful people who lived in small villages and subsisted on fishing, hunting, and farming. The Taíno were eventually displaced by the Spanish conquistadors in the 16th century.
The area was then settled by Spanish colonists in the 17th century. The area was originally known as Quebrada de San Antonio, named after the nearby San Antonio River. The name was later changed to Quebrada Del Agua, which means “water break” in Spanish.
Geography
Quebrada Del Agua is located in the northern region of Puerto Rico. It is bordered by the municipalities of San Sebastián, Las Marías, and Maricao. The municipality is located in the foothills of the Cordillera Central mountain range. The terrain is mostly mountainous and hilly, with some flat areas. The highest point in the municipality is Cerro de la Cruz, which is 1,845 feet (562 meters) above sea level.
The climate in Quebrada Del Agua is tropical, with temperatures ranging from the low 70s to the mid-80s Fahrenheit (low 20s to mid-30s Celsius). The average annual precipitation is around 50 inches (127 cm).
Economy
The economy of Quebrada Del Agua is largely based on agriculture. The main crops grown in the area are coffee, bananas, plantains, and sugarcane. Livestock farming is also an important part of the local economy.
Tourism is also an important part of the local economy. The municipality is home to several attractions, including the San Antonio River, the Cerro de la Cruz, and the Quebrada Del Agua Waterfall.
Demographics
As of the 2010 census, the population of Quebrada Del Agua was 5,845. The population is mostly of mixed European and Taíno descent. The majority of the population (90.3%) is of Hispanic or Latino origin. The median age of the population is 38.7 years.
The majority of the population (90.3%) speaks Spanish as their first language. English is spoken by 8.2% of the population. The median household income is $14,845. The poverty rate is 44.3%.
Conclusion
Quebrada Del Agua is a small municipality located in the northern region of Puerto Rico. It is part of the San Juan-Caguas-Guaynabo Metropolitan Statistical Area. The municipality is located in the foothills of the Cordillera Central mountain range and is bordered by the municipalities of San Sebastián, Las Marías, and Maricao. The economy of Quebrada Del Agua is largely based on agriculture and tourism. The population of Quebrada Del Agua is mostly of mixed European and Taíno descent. The majority of the population speaks Spanish as their first language and the median household income is $14,845.
Common Questions
What is Per Capita Income in Quebrada del Agua?
Per Capita income in Quebrada del Agua is $10,236.
What is the Median Family Income in Quebrada del Agua?
Median Family Income in Quebrada del Agua is $20,208.
What is Income or Wage Gap in Quebrada del Agua?
Income or Wage Gap in Quebrada del Agua is 23.6%.
Women in Quebrada del Agua earn 76.4 cents for every dollar earned by a man.
What is Inequality or Gini Index in Quebrada del Agua?
Inequality or Gini Index in Quebrada del Agua is 0.43.
What is the Total Population of Quebrada del Agua?
Total Population of Quebrada del Agua is 1,167.
What is the Total Male Population of Quebrada del Agua?
Total Male Population of Quebrada del Agua is 700.
What is the Total Female Population of Quebrada del Agua?
Total Female Population of Quebrada del Agua is 467.
What is the Ratio of Males per 100 Females in Quebrada del Agua?
There are 149.89 Males per 100 Females in Quebrada del Agua.
What is the Ratio of Females per 100 Males in Quebrada del Agua?
There are 66.71 Females per 100 Males in Quebrada del Agua.
What is the Median Population Age in Quebrada del Agua?
Median Population Age in Quebrada del Agua is 29.3 Years.
What is the Average Family Size in Quebrada del Agua
Average Family Size in Quebrada del Agua is 3.6 People.
What is the Average Household Size in Quebrada del Agua
Average Household Size in Quebrada del Agua is 3.4 People.
How Large is the Labor Force in Quebrada del Agua?
There are 457 People in the Labor Forcein in Quebrada del Agua.
What is the Percentage of People in the Labor Force in Quebrada del Agua?
57.3% of People are in the Labor Force in Quebrada del Agua.
What is the Unemployment Rate in Quebrada del Agua?
Unemployment Rate in Quebrada del Agua is 5.5%.