Zip Codes with the Highest Percentage of Population Employed in Community & Social Service in Oregon
RELATED REPORTS & OPTIONS
Community & Social Service
Oregon
Compare Zip Codes
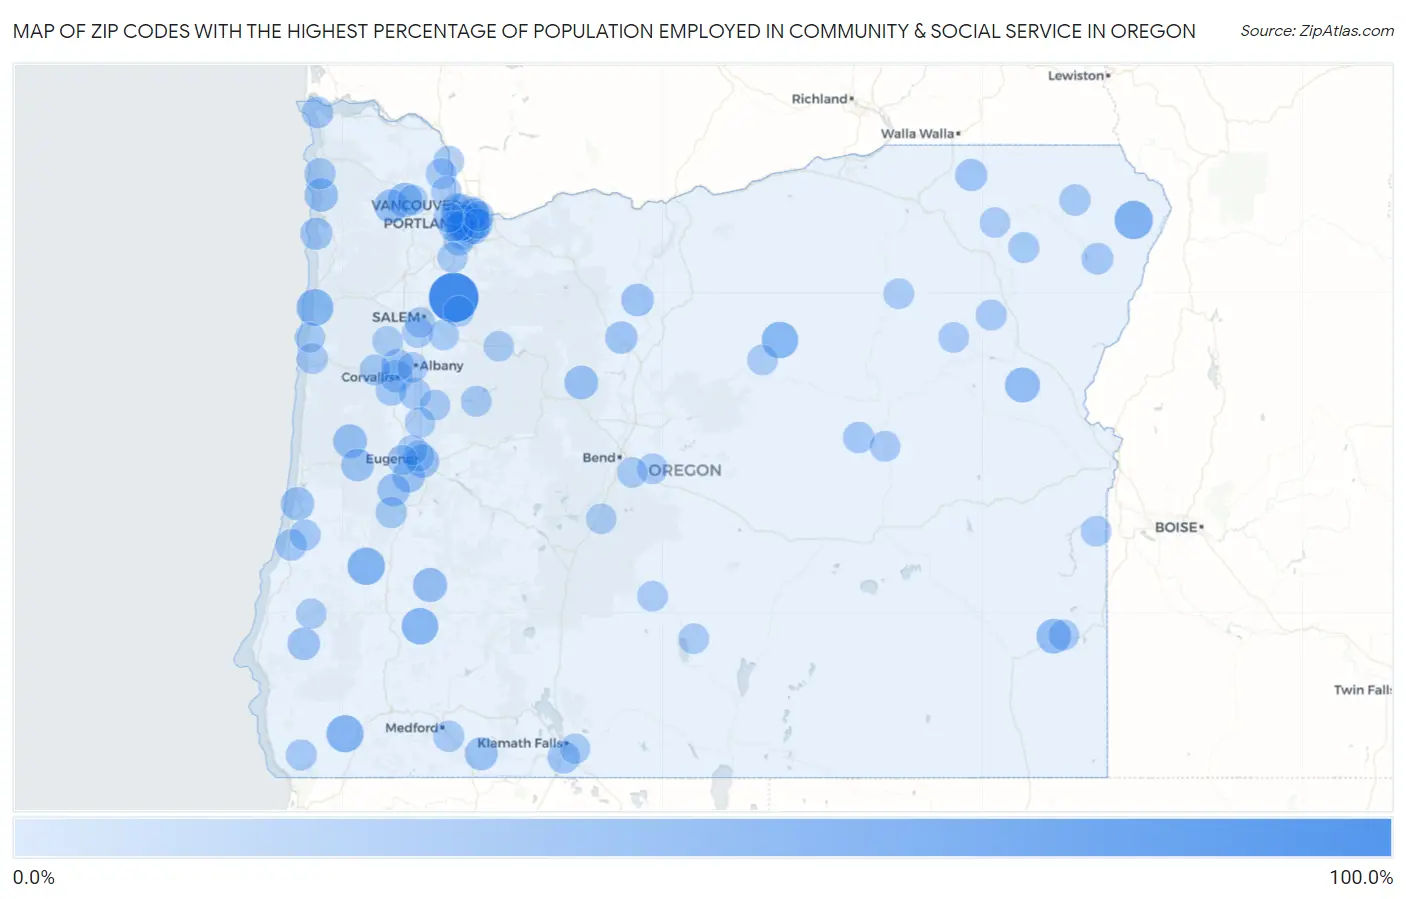
Map of Zip Codes with the Highest Percentage of Population Employed in Community & Social Service in Oregon
0.0%
100.0%
Zip Codes with the Highest Percentage of Population Employed in Community & Social Service in Oregon
| Zip Code | % Employed | vs State | vs National | |
| 1. | 97373 | 87.5% | 11.4%(+76.1)#1 | 11.2%(+76.3)#31 |
| 2. | 97842 | 42.9% | 11.4%(+31.5)#2 | 11.2%(+31.6)#248 |
| 3. | 97486 | 39.6% | 11.4%(+28.3)#3 | 11.2%(+28.4)#293 |
| 4. | 97538 | 38.1% | 11.4%(+26.8)#4 | 11.2%(+26.9)#324 |
| 5. | 97364 | 36.8% | 11.4%(+25.5)#5 | 11.2%(+25.6)#353 |
| 6. | 97429 | 36.0% | 11.4%(+24.6)#6 | 11.2%(+24.7)#372 |
| 7. | 97874 | 35.7% | 11.4%(+24.3)#7 | 11.2%(+24.4)#377 |
| 8. | 97819 | 30.0% | 11.4%(+18.6)#8 | 11.2%(+18.8)#590 |
| 9. | 97902 | 28.6% | 11.4%(+17.2)#9 | 11.2%(+17.4)#664 |
| 10. | 97125 | 27.6% | 11.4%(+16.2)#10 | 11.2%(+16.4)#724 |
| 11. | 97443 | 26.9% | 11.4%(+15.5)#11 | 11.2%(+15.7)#787 |
| 12. | 97117 | 25.9% | 11.4%(+14.6)#12 | 11.2%(+14.7)#876 |
| 13. | 97430 | 25.5% | 11.4%(+14.1)#13 | 11.2%(+14.3)#917 |
| 14. | 97730 | 24.7% | 11.4%(+13.3)#14 | 11.2%(+13.5)#1,022 |
| 15. | 97403 | 24.1% | 11.4%(+12.7)#15 | 11.2%(+12.9)#1,094 |
| 16. | 97130 | 23.9% | 11.4%(+12.5)#16 | 11.2%(+12.7)#1,124 |
| 17. | 97441 | 23.5% | 11.4%(+12.1)#17 | 11.2%(+12.3)#1,185 |
| 18. | 97520 | 22.5% | 11.4%(+11.1)#18 | 11.2%(+11.3)#1,362 |
| 19. | 97215 | 21.8% | 11.4%(+10.4)#19 | 11.2%(+10.6)#1,518 |
| 20. | 97466 | 21.3% | 11.4%(+9.93)#20 | 11.2%(+10.1)#1,632 |
| 21. | 97405 | 21.2% | 11.4%(+9.82)#21 | 11.2%(+9.99)#1,662 |
| 22. | 97214 | 21.1% | 11.4%(+9.70)#22 | 11.2%(+9.87)#1,693 |
| 23. | 97490 | 20.9% | 11.4%(+9.56)#23 | 11.2%(+9.73)#1,725 |
| 24. | 97451 | 20.8% | 11.4%(+9.45)#24 | 11.2%(+9.62)#1,763 |
| 25. | 97037 | 20.8% | 11.4%(+9.43)#25 | 11.2%(+9.60)#1,774 |
| 26. | 97202 | 20.5% | 11.4%(+9.07)#26 | 11.2%(+9.24)#1,883 |
| 27. | 97634 | 20.2% | 11.4%(+8.85)#27 | 11.2%(+9.02)#1,946 |
| 28. | 97331 | 20.2% | 11.4%(+8.82)#28 | 11.2%(+8.99)#1,951 |
| 29. | 97761 | 20.2% | 11.4%(+8.81)#29 | 11.2%(+8.97)#1,959 |
| 30. | 97213 | 19.4% | 11.4%(+8.02)#30 | 11.2%(+8.19)#2,233 |
| 31. | 97330 | 19.4% | 11.4%(+7.98)#31 | 11.2%(+8.15)#2,252 |
| 32. | 97210 | 19.2% | 11.4%(+7.83)#32 | 11.2%(+7.99)#2,305 |
| 33. | 97886 | 19.1% | 11.4%(+7.76)#33 | 11.2%(+7.93)#2,336 |
| 34. | 97134 | 18.8% | 11.4%(+7.46)#34 | 11.2%(+7.63)#2,455 |
| 35. | 97219 | 18.7% | 11.4%(+7.29)#35 | 11.2%(+7.46)#2,519 |
| 36. | 97217 | 18.5% | 11.4%(+7.16)#36 | 11.2%(+7.33)#2,580 |
| 37. | 97232 | 17.6% | 11.4%(+6.26)#37 | 11.2%(+6.42)#3,006 |
| 38. | 97377 | 17.5% | 11.4%(+6.16)#38 | 11.2%(+6.33)#3,047 |
| 39. | 97212 | 17.5% | 11.4%(+6.14)#39 | 11.2%(+6.31)#3,052 |
| 40. | 97211 | 17.2% | 11.4%(+5.80)#40 | 11.2%(+5.97)#3,261 |
| 41. | 97846 | 17.1% | 11.4%(+5.69)#41 | 11.2%(+5.85)#3,334 |
| 42. | 97121 | 16.7% | 11.4%(+5.29)#42 | 11.2%(+5.45)#3,585 |
| 43. | 97459 | 16.6% | 11.4%(+5.23)#43 | 11.2%(+5.40)#3,636 |
| 44. | 97333 | 16.5% | 11.4%(+5.14)#44 | 11.2%(+5.30)#3,684 |
| 45. | 97820 | 16.3% | 11.4%(+4.92)#45 | 11.2%(+5.08)#3,843 |
| 46. | 97435 | 15.9% | 11.4%(+4.48)#46 | 11.2%(+4.64)#4,182 |
| 47. | 97828 | 15.8% | 11.4%(+4.42)#47 | 11.2%(+4.59)#4,235 |
| 48. | 97535 | 15.4% | 11.4%(+4.00)#48 | 11.2%(+4.17)#4,609 |
| 49. | 97035 | 15.3% | 11.4%(+3.91)#49 | 11.2%(+4.08)#4,708 |
| 50. | 97206 | 15.3% | 11.4%(+3.90)#50 | 11.2%(+4.06)#4,722 |
| 51. | 97401 | 15.3% | 11.4%(+3.89)#51 | 11.2%(+4.06)#4,736 |
| 52. | 97449 | 15.2% | 11.4%(+3.86)#52 | 11.2%(+4.03)#4,754 |
| 53. | 97102 | 15.2% | 11.4%(+3.86)#53 | 11.2%(+4.02)#4,765 |
| 54. | 97415 | 14.8% | 11.4%(+3.44)#54 | 11.2%(+3.61)#5,134 |
| 55. | 97370 | 14.8% | 11.4%(+3.38)#55 | 11.2%(+3.54)#5,199 |
| 56. | 97824 | 14.7% | 11.4%(+3.33)#56 | 11.2%(+3.50)#5,251 |
| 57. | 97218 | 14.6% | 11.4%(+3.25)#57 | 11.2%(+3.42)#5,328 |
| 58. | 97209 | 14.6% | 11.4%(+3.21)#58 | 11.2%(+3.38)#5,373 |
| 59. | 97239 | 14.5% | 11.4%(+3.08)#59 | 11.2%(+3.24)#5,517 |
| 60. | 97833 | 14.5% | 11.4%(+3.08)#60 | 11.2%(+3.24)#5,518 |
| 61. | 97018 | 14.4% | 11.4%(+3.00)#61 | 11.2%(+3.16)#5,617 |
| 62. | 97201 | 14.3% | 11.4%(+2.91)#62 | 11.2%(+3.08)#5,700 |
| 63. | 97910 | 14.2% | 11.4%(+2.85)#63 | 11.2%(+3.02)#5,798 |
| 64. | 97365 | 14.2% | 11.4%(+2.78)#64 | 11.2%(+2.95)#5,872 |
| 65. | 97345 | 14.2% | 11.4%(+2.77)#65 | 11.2%(+2.94)#5,896 |
| 66. | 97053 | 14.1% | 11.4%(+2.69)#66 | 11.2%(+2.86)#5,996 |
| 67. | 97203 | 14.0% | 11.4%(+2.57)#67 | 11.2%(+2.74)#6,152 |
| 68. | 97381 | 13.9% | 11.4%(+2.52)#68 | 11.2%(+2.69)#6,212 |
| 69. | 97877 | 13.8% | 11.4%(+2.41)#69 | 11.2%(+2.58)#6,353 |
| 70. | 97873 | 13.8% | 11.4%(+2.41)#70 | 11.2%(+2.58)#6,356 |
| 71. | 97306 | 13.5% | 11.4%(+2.16)#71 | 11.2%(+2.32)#6,697 |
| 72. | 97750 | 13.5% | 11.4%(+2.08)#72 | 11.2%(+2.25)#6,808 |
| 73. | 97327 | 13.4% | 11.4%(+2.03)#73 | 11.2%(+2.20)#6,888 |
| 74. | 97701 | 13.4% | 11.4%(+2.00)#74 | 11.2%(+2.17)#6,927 |
| 75. | 97901 | 13.4% | 11.4%(+1.98)#75 | 11.2%(+2.14)#6,964 |
| 76. | 97321 | 13.3% | 11.4%(+1.93)#76 | 11.2%(+2.09)#7,063 |
| 77. | 97638 | 13.2% | 11.4%(+1.85)#77 | 11.2%(+2.01)#7,191 |
| 78. | 97640 | 13.2% | 11.4%(+1.83)#78 | 11.2%(+1.99)#7,229 |
| 79. | 97221 | 13.2% | 11.4%(+1.80)#79 | 11.2%(+1.96)#7,272 |
| 80. | 97325 | 13.1% | 11.4%(+1.75)#80 | 11.2%(+1.92)#7,337 |
| 81. | 97880 | 13.1% | 11.4%(+1.73)#81 | 11.2%(+1.90)#7,371 |
| 82. | 97225 | 13.1% | 11.4%(+1.69)#82 | 11.2%(+1.86)#7,439 |
| 83. | 97446 | 13.0% | 11.4%(+1.66)#83 | 11.2%(+1.83)#7,489 |
| 84. | 97302 | 13.0% | 11.4%(+1.57)#84 | 11.2%(+1.74)#7,632 |
| 85. | 97739 | 12.9% | 11.4%(+1.54)#85 | 11.2%(+1.71)#7,683 |
| 86. | 97216 | 12.9% | 11.4%(+1.53)#86 | 11.2%(+1.70)#7,699 |
| 87. | 97404 | 12.9% | 11.4%(+1.48)#87 | 11.2%(+1.64)#7,800 |
| 88. | 97220 | 12.8% | 11.4%(+1.38)#88 | 11.2%(+1.55)#7,963 |
| 89. | 97361 | 12.7% | 11.4%(+1.34)#89 | 11.2%(+1.51)#8,025 |
| 90. | 97702 | 12.7% | 11.4%(+1.33)#90 | 11.2%(+1.49)#8,054 |
| 91. | 97458 | 12.7% | 11.4%(+1.30)#91 | 11.2%(+1.47)#8,101 |
| 92. | 97106 | 12.6% | 11.4%(+1.26)#92 | 11.2%(+1.43)#8,177 |
| 93. | 97231 | 12.6% | 11.4%(+1.25)#93 | 11.2%(+1.42)#8,194 |
| 94. | 97603 | 12.6% | 11.4%(+1.20)#94 | 11.2%(+1.37)#8,269 |
| 95. | 97346 | 12.6% | 11.4%(+1.19)#95 | 11.2%(+1.36)#8,299 |
| 96. | 97876 | 12.4% | 11.4%(+1.03)#96 | 11.2%(+1.19)#8,580 |
| 97. | 97070 | 12.4% | 11.4%(+1.01)#97 | 11.2%(+1.17)#8,614 |
| 98. | 97229 | 12.4% | 11.4%(+0.985)#98 | 11.2%(+1.15)#8,659 |
| 99. | 97341 | 12.4% | 11.4%(+0.971)#99 | 11.2%(+1.14)#8,689 |
| 100. | 97402 | 12.3% | 11.4%(+0.966)#100 | 11.2%(+1.13)#8,698 |
Common Questions
What are the Top 10 Zip Codes with the Highest Percentage of Population Employed in Community & Social Service in Oregon?
Top 10 Zip Codes with the Highest Percentage of Population Employed in Community & Social Service in Oregon are:
What zip code has the Highest Percentage of Population Employed in Community & Social Service in Oregon?
97373 has the Highest Percentage of Population Employed in Community & Social Service in Oregon with 87.5%.
What is the Percentage of Population Employed in Community & Social Service in the State of Oregon?
Percentage of Population Employed in Community & Social Service in Oregon is 11.4%.
What is the Percentage of Population Employed in Community & Social Service in the United States?
Percentage of Population Employed in Community & Social Service in the United States is 11.2%.