Zip Codes with the Highest Percentage of Scotch-Irish Population in Oregon
RELATED REPORTS & OPTIONS
Scotch-Irish
Oregon
Compare Zip Codes
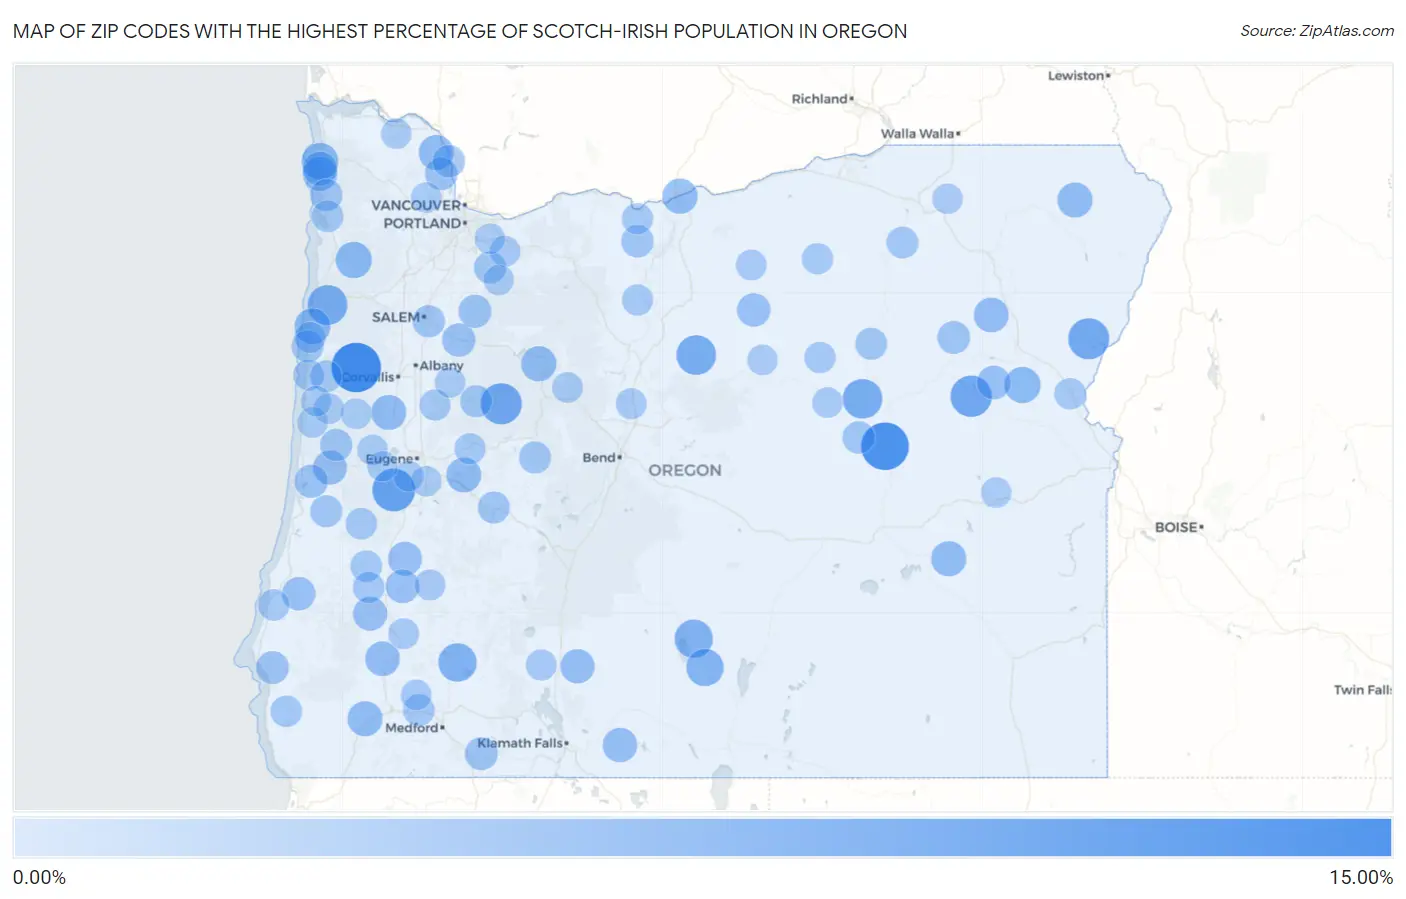
Map of Zip Codes with the Highest Percentage of Scotch-Irish Population in Oregon
0.00%
15.00%
Zip Codes with the Highest Percentage of Scotch-Irish Population in Oregon
| Zip Code | Scotch-Irish | vs State | vs National | |
| 1. | 97326 | 14.45% | 1.18%(+13.3)#1 | 0.82%(+13.6)#111 |
| 2. | 97873 | 13.17% | 1.18%(+12.0)#2 | 0.82%(+12.4)#131 |
| 3. | 97451 | 9.98% | 1.18%(+8.80)#3 | 0.82%(+9.16)#222 |
| 4. | 97884 | 9.02% | 1.18%(+7.83)#4 | 0.82%(+8.20)#269 |
| 5. | 97329 | 8.82% | 1.18%(+7.64)#5 | 0.82%(+8.01)#281 |
| 6. | 97870 | 8.79% | 1.18%(+7.61)#6 | 0.82%(+7.98)#283 |
| 7. | 97368 | 8.03% | 1.18%(+6.85)#7 | 0.82%(+7.22)#336 |
| 8. | 97711 | 7.89% | 1.18%(+6.71)#8 | 0.82%(+7.08)#349 |
| 9. | 97865 | 7.86% | 1.18%(+6.67)#9 | 0.82%(+7.04)#352 |
| 10. | 97541 | 7.03% | 1.18%(+5.85)#10 | 0.82%(+6.21)#432 |
| 11. | 97640 | 6.92% | 1.18%(+5.74)#11 | 0.82%(+6.11)#439 |
| 12. | 97636 | 6.31% | 1.18%(+5.13)#12 | 0.82%(+5.50)#509 |
| 13. | 97110 | 5.82% | 1.18%(+4.64)#13 | 0.82%(+5.00)#580 |
| 14. | 97108 | 5.67% | 1.18%(+4.48)#14 | 0.82%(+4.85)#615 |
| 15. | 97819 | 5.56% | 1.18%(+4.37)#15 | 0.82%(+4.74)#637 |
| 16. | 97388 | 5.43% | 1.18%(+4.25)#16 | 0.82%(+4.62)#661 |
| 17. | 97050 | 5.00% | 1.18%(+3.82)#17 | 0.82%(+4.18)#759 |
| 18. | 97350 | 4.96% | 1.18%(+3.78)#18 | 0.82%(+4.15)#776 |
| 19. | 97732 | 4.93% | 1.18%(+3.75)#19 | 0.82%(+4.11)#786 |
| 20. | 97543 | 4.88% | 1.18%(+3.70)#20 | 0.82%(+4.06)#796 |
| 21. | 97456 | 4.86% | 1.18%(+3.68)#21 | 0.82%(+4.04)#804 |
| 22. | 97828 | 4.85% | 1.18%(+3.66)#22 | 0.82%(+4.03)#807 |
| 23. | 97054 | 4.80% | 1.18%(+3.62)#23 | 0.82%(+3.98)#822 |
| 24. | 97438 | 4.78% | 1.18%(+3.60)#24 | 0.82%(+3.97)#826 |
| 25. | 97833 | 4.66% | 1.18%(+3.48)#25 | 0.82%(+3.84)#858 |
| 26. | 97442 | 4.61% | 1.18%(+3.42)#26 | 0.82%(+3.79)#876 |
| 27. | 97102 | 4.52% | 1.18%(+3.34)#27 | 0.82%(+3.71)#909 |
| 28. | 97623 | 4.47% | 1.18%(+3.29)#28 | 0.82%(+3.66)#928 |
| 29. | 97145 | 4.46% | 1.18%(+3.28)#29 | 0.82%(+3.65)#930 |
| 30. | 97624 | 4.34% | 1.18%(+3.15)#30 | 0.82%(+3.52)#984 |
| 31. | 97479 | 4.17% | 1.18%(+2.99)#31 | 0.82%(+3.35)#1,055 |
| 32. | 97496 | 4.16% | 1.18%(+2.97)#32 | 0.82%(+3.34)#1,061 |
| 33. | 97453 | 4.14% | 1.18%(+2.96)#33 | 0.82%(+3.32)#1,064 |
| 34. | 97837 | 4.00% | 1.18%(+2.82)#34 | 0.82%(+3.18)#1,130 |
| 35. | 97470 | 4.00% | 1.18%(+2.81)#35 | 0.82%(+3.18)#1,131 |
| 36. | 97423 | 3.84% | 1.18%(+2.65)#36 | 0.82%(+3.02)#1,221 |
| 37. | 97383 | 3.81% | 1.18%(+2.63)#37 | 0.82%(+3.00)#1,234 |
| 38. | 97830 | 3.78% | 1.18%(+2.60)#38 | 0.82%(+2.96)#1,257 |
| 39. | 97493 | 3.70% | 1.18%(+2.52)#39 | 0.82%(+2.89)#1,305 |
| 40. | 97375 | 3.52% | 1.18%(+2.33)#40 | 0.82%(+2.70)#1,426 |
| 41. | 97877 | 3.45% | 1.18%(+2.27)#41 | 0.82%(+2.63)#1,477 |
| 42. | 97520 | 3.44% | 1.18%(+2.26)#42 | 0.82%(+2.62)#1,481 |
| 43. | 97465 | 3.44% | 1.18%(+2.25)#43 | 0.82%(+2.62)#1,487 |
| 44. | 97053 | 3.30% | 1.18%(+2.12)#44 | 0.82%(+2.49)#1,614 |
| 45. | 97018 | 3.21% | 1.18%(+2.03)#45 | 0.82%(+2.40)#1,716 |
| 46. | 97021 | 3.17% | 1.18%(+1.99)#46 | 0.82%(+2.36)#1,753 |
| 47. | 97310 | 3.09% | 1.18%(+1.91)#47 | 0.82%(+2.28)#1,841 |
| 48. | 97820 | 3.08% | 1.18%(+1.90)#48 | 0.82%(+2.26)#1,863 |
| 49. | 97480 | 3.05% | 1.18%(+1.87)#49 | 0.82%(+2.23)#1,898 |
| 50. | 97147 | 3.03% | 1.18%(+1.85)#50 | 0.82%(+2.21)#1,923 |
| 51. | 97345 | 3.00% | 1.18%(+1.81)#51 | 0.82%(+2.18)#1,967 |
| 52. | 97004 | 2.96% | 1.18%(+1.78)#52 | 0.82%(+2.15)#1,992 |
| 53. | 97369 | 2.92% | 1.18%(+1.74)#53 | 0.82%(+2.10)#2,055 |
| 54. | 97413 | 2.91% | 1.18%(+1.73)#54 | 0.82%(+2.10)#2,062 |
| 55. | 97467 | 2.89% | 1.18%(+1.71)#55 | 0.82%(+2.08)#2,088 |
| 56. | 97463 | 2.86% | 1.18%(+1.67)#56 | 0.82%(+2.04)#2,137 |
| 57. | 97856 | 2.81% | 1.18%(+1.63)#57 | 0.82%(+1.99)#2,193 |
| 58. | 97868 | 2.76% | 1.18%(+1.58)#58 | 0.82%(+1.94)#2,256 |
| 59. | 97107 | 2.73% | 1.18%(+1.55)#59 | 0.82%(+1.92)#2,282 |
| 60. | 97525 | 2.73% | 1.18%(+1.55)#60 | 0.82%(+1.91)#2,289 |
| 61. | 97391 | 2.72% | 1.18%(+1.53)#61 | 0.82%(+1.90)#2,312 |
| 62. | 97486 | 2.62% | 1.18%(+1.43)#62 | 0.82%(+1.80)#2,460 |
| 63. | 97444 | 2.56% | 1.18%(+1.38)#63 | 0.82%(+1.75)#2,556 |
| 64. | 97471 | 2.56% | 1.18%(+1.38)#64 | 0.82%(+1.75)#2,564 |
| 65. | 97436 | 2.56% | 1.18%(+1.38)#65 | 0.82%(+1.74)#2,568 |
| 66. | 97411 | 2.50% | 1.18%(+1.31)#66 | 0.82%(+1.68)#2,674 |
| 67. | 97907 | 2.50% | 1.18%(+1.31)#67 | 0.82%(+1.68)#2,676 |
| 68. | 97341 | 2.38% | 1.18%(+1.20)#68 | 0.82%(+1.57)#2,868 |
| 69. | 97327 | 2.35% | 1.18%(+1.17)#69 | 0.82%(+1.53)#2,928 |
| 70. | 97836 | 2.34% | 1.18%(+1.16)#70 | 0.82%(+1.53)#2,941 |
| 71. | 97848 | 2.33% | 1.18%(+1.14)#71 | 0.82%(+1.51)#2,985 |
| 72. | 97366 | 2.32% | 1.18%(+1.14)#72 | 0.82%(+1.51)#2,989 |
| 73. | 97058 | 2.30% | 1.18%(+1.12)#73 | 0.82%(+1.48)#3,034 |
| 74. | 97037 | 2.26% | 1.18%(+1.08)#74 | 0.82%(+1.45)#3,107 |
| 75. | 97489 | 2.26% | 1.18%(+1.08)#75 | 0.82%(+1.45)#3,110 |
| 76. | 97626 | 2.24% | 1.18%(+1.06)#76 | 0.82%(+1.42)#3,166 |
| 77. | 97760 | 2.17% | 1.18%(+0.990)#77 | 0.82%(+1.35)#3,346 |
| 78. | 97022 | 2.15% | 1.18%(+0.965)#78 | 0.82%(+1.33)#3,392 |
| 79. | 97417 | 2.11% | 1.18%(+0.929)#79 | 0.82%(+1.29)#3,488 |
| 80. | 97443 | 2.09% | 1.18%(+0.907)#80 | 0.82%(+1.27)#3,550 |
| 81. | 97759 | 2.08% | 1.18%(+0.898)#81 | 0.82%(+1.26)#3,568 |
| 82. | 97823 | 2.08% | 1.18%(+0.893)#82 | 0.82%(+1.26)#3,583 |
| 83. | 97537 | 2.07% | 1.18%(+0.884)#83 | 0.82%(+1.25)#3,606 |
| 84. | 97324 | 2.04% | 1.18%(+0.859)#84 | 0.82%(+1.22)#3,684 |
| 85. | 97461 | 2.04% | 1.18%(+0.856)#85 | 0.82%(+1.22)#3,701 |
| 86. | 97750 | 1.99% | 1.18%(+0.807)#86 | 0.82%(+1.17)#3,860 |
| 87. | 97426 | 1.99% | 1.18%(+0.805)#87 | 0.82%(+1.17)#3,865 |
| 88. | 97089 | 1.97% | 1.18%(+0.789)#88 | 0.82%(+1.15)#3,937 |
| 89. | 97825 | 1.97% | 1.18%(+0.783)#89 | 0.82%(+1.15)#3,950 |
| 90. | 97498 | 1.96% | 1.18%(+0.774)#90 | 0.82%(+1.14)#3,984 |
| 91. | 97405 | 1.95% | 1.18%(+0.766)#91 | 0.82%(+1.13)#4,003 |
| 92. | 97390 | 1.94% | 1.18%(+0.759)#92 | 0.82%(+1.12)#4,021 |
| 93. | 97017 | 1.94% | 1.18%(+0.754)#93 | 0.82%(+1.12)#4,037 |
| 94. | 97394 | 1.92% | 1.18%(+0.740)#94 | 0.82%(+1.11)#4,078 |
| 95. | 97016 | 1.92% | 1.18%(+0.740)#95 | 0.82%(+1.11)#4,079 |
| 96. | 97911 | 1.92% | 1.18%(+0.740)#96 | 0.82%(+1.11)#4,085 |
| 97. | 97810 | 1.91% | 1.18%(+0.727)#97 | 0.82%(+1.09)#4,129 |
| 98. | 97133 | 1.91% | 1.18%(+0.727)#98 | 0.82%(+1.09)#4,132 |
| 99. | 97355 | 1.89% | 1.18%(+0.703)#99 | 0.82%(+1.07)#4,215 |
| 100. | 97487 | 1.88% | 1.18%(+0.701)#100 | 0.82%(+1.07)#4,222 |
Common Questions
What are the Top 10 Zip Codes with the Highest Percentage of Scotch-Irish Population in Oregon?
Top 10 Zip Codes with the Highest Percentage of Scotch-Irish Population in Oregon are:
What zip code has the Highest Percentage of Scotch-Irish Population in Oregon?
97326 has the Highest Percentage of Scotch-Irish Population in Oregon with 14.45%.
What is the Percentage of Scotch-Irish Population in the State of Oregon?
Percentage of Scotch-Irish Population in Oregon is 1.18%.
What is the Percentage of Scotch-Irish Population in the United States?
Percentage of Scotch-Irish Population in the United States is 0.82%.