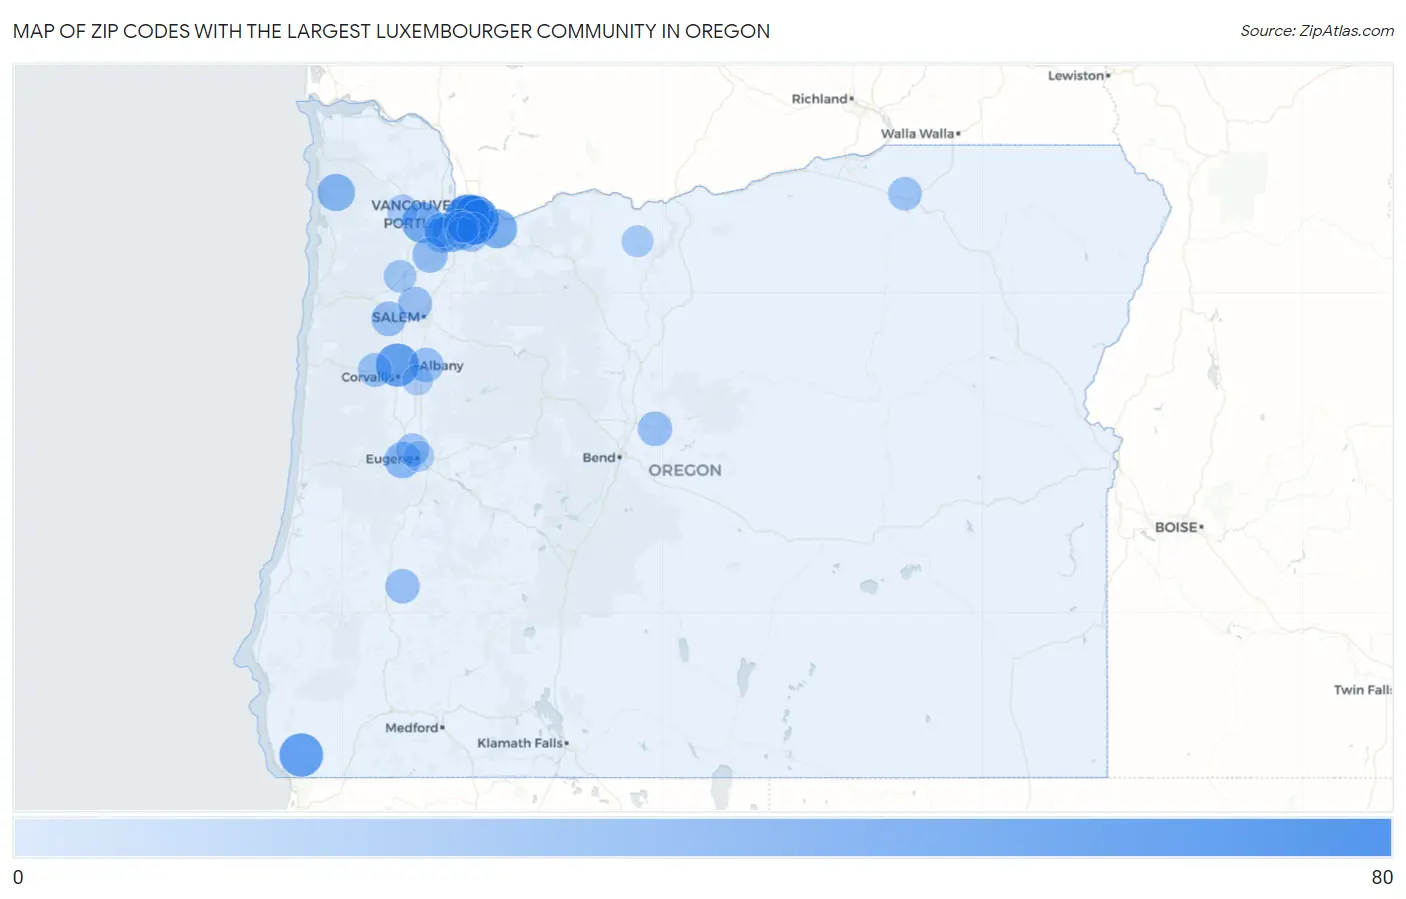
Zip Codes with the Largest Luxembourger Community in Oregon
RELATED REPORTS & OPTIONS
Luxembourger
Oregon
Compare Zip Codes
Map of Zip Codes with the Largest Luxembourger Community in Oregon
0
80
Zip Codes with the Largest Luxembourger Community in Oregon
| Zip Code | Luxembourger | vs State | vs National | |
| 1. | 97213 | 66 | 593(11.13%)#1 | 42,059(0.16%)#93 |
| 2. | 97212 | 62 | 593(10.46%)#2 | 42,059(0.15%)#110 |
| 3. | 97415 | 45 | 593(7.59%)#3 | 42,059(0.11%)#204 |
| 4. | 97330 | 44 | 593(7.42%)#4 | 42,059(0.10%)#207 |
| 5. | 97113 | 37 | 593(6.24%)#5 | 42,059(0.09%)#255 |
| 6. | 97080 | 30 | 593(5.06%)#6 | 42,059(0.07%)#335 |
| 7. | 97008 | 30 | 593(5.06%)#7 | 42,059(0.07%)#339 |
| 8. | 97131 | 24 | 593(4.05%)#8 | 42,059(0.06%)#450 |
| 9. | 97402 | 21 | 593(3.54%)#9 | 42,059(0.05%)#509 |
| 10. | 97007 | 18 | 593(3.04%)#10 | 42,059(0.04%)#613 |
| 11. | 97132 | 17 | 593(2.87%)#11 | 42,059(0.04%)#671 |
| 12. | 97078 | 15 | 593(2.53%)#12 | 42,059(0.04%)#767 |
| 13. | 97338 | 15 | 593(2.53%)#13 | 42,059(0.04%)#771 |
| 14. | 97322 | 14 | 593(2.36%)#14 | 42,059(0.03%)#802 |
| 15. | 97470 | 14 | 593(2.36%)#15 | 42,059(0.03%)#829 |
| 16. | 97753 | 14 | 593(2.36%)#16 | 42,059(0.03%)#847 |
| 17. | 97304 | 13 | 593(2.19%)#17 | 42,059(0.03%)#876 |
| 18. | 97211 | 12 | 593(2.02%)#18 | 42,059(0.03%)#957 |
| 19. | 97370 | 12 | 593(2.02%)#19 | 42,059(0.03%)#999 |
| 20. | 97222 | 11 | 593(1.85%)#20 | 42,059(0.03%)#1,033 |
| 21. | 97801 | 11 | 593(1.85%)#21 | 42,059(0.03%)#1,057 |
| 22. | 97404 | 10 | 593(1.69%)#22 | 42,059(0.02%)#1,113 |
| 23. | 97220 | 10 | 593(1.69%)#23 | 42,059(0.02%)#1,125 |
| 24. | 97221 | 10 | 593(1.69%)#24 | 42,059(0.02%)#1,159 |
| 25. | 97219 | 8 | 593(1.35%)#25 | 42,059(0.02%)#1,325 |
| 26. | 97128 | 8 | 593(1.35%)#26 | 42,059(0.02%)#1,335 |
| 27. | 97206 | 7 | 593(1.18%)#27 | 42,059(0.02%)#1,435 |
| 28. | 97021 | 5 | 593(0.84%)#28 | 42,059(0.01%)#1,724 |
| 29. | 97116 | 3 | 593(0.51%)#29 | 42,059(0.01%)#1,863 |
| 30. | 97239 | 3 | 593(0.51%)#30 | 42,059(0.01%)#1,878 |
| 31. | 97401 | 2 | 593(0.34%)#31 | 42,059(0.00%)#1,983 |
| 32. | 97389 | 2 | 593(0.34%)#32 | 42,059(0.00%)#2,079 |
Common Questions
What are the Top 10 Zip Codes with the Largest Luxembourger Community in Oregon?
Top 10 Zip Codes with the Largest Luxembourger Community in Oregon are:
What zip code has the Largest Luxembourger Community in Oregon?
97213 has the Largest Luxembourger Community in Oregon with 66.
What is the Total Luxembourger Population in the State of Oregon?
Total Luxembourger Population in Oregon is 593.
What is the Total Luxembourger Population in the United States?
Total Luxembourger Population in the United States is 42,059.