Zip Codes with the Highest Percentage of Population Employed in Sales & Related in Oregon
RELATED REPORTS & OPTIONS
Sales & Related
Oregon
Compare Zip Codes
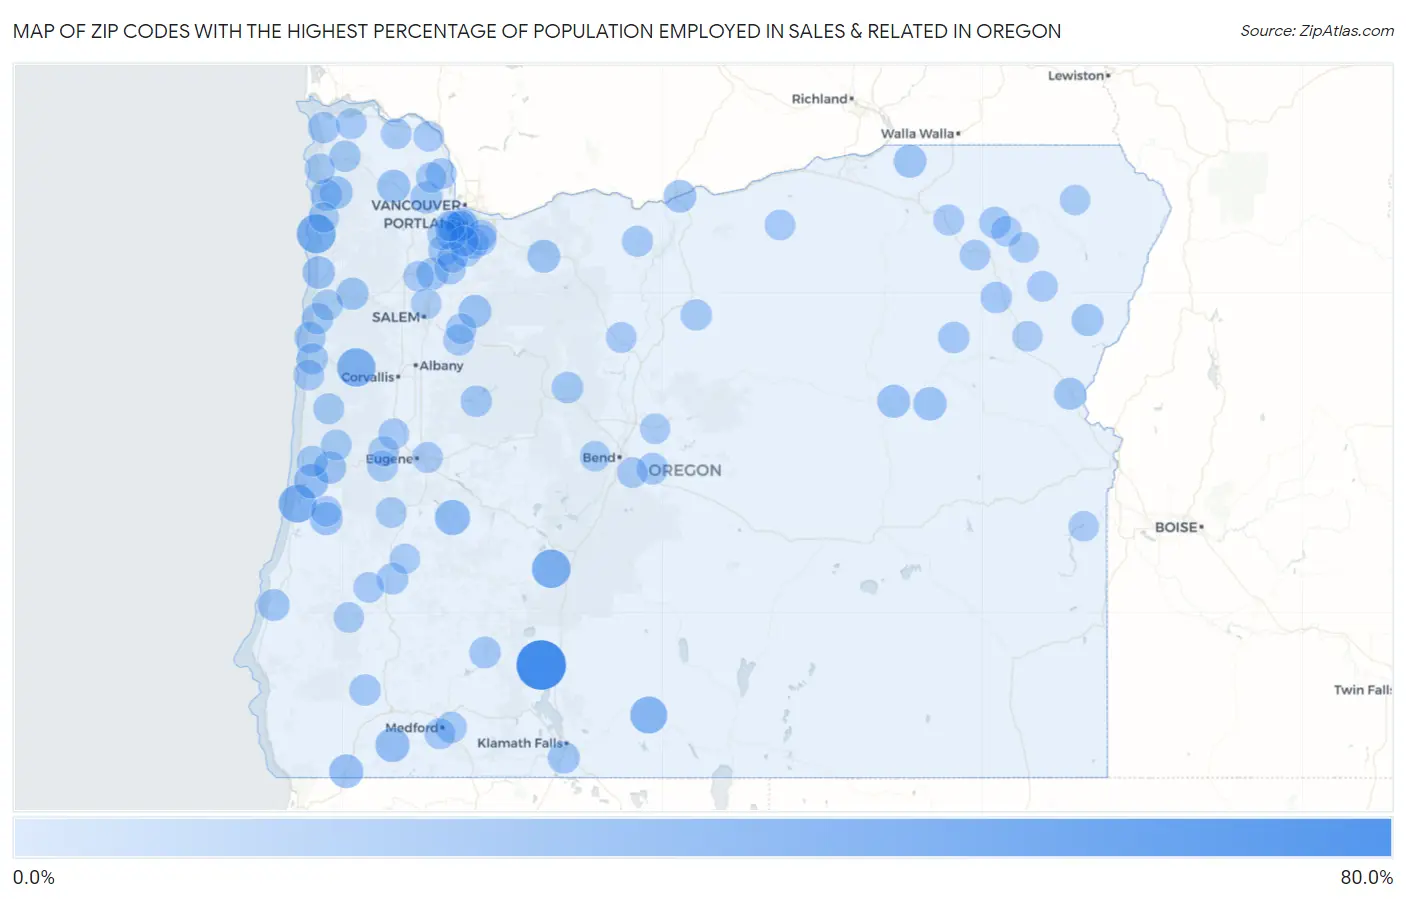
Map of Zip Codes with the Highest Percentage of Population Employed in Sales & Related in Oregon
0.0%
80.0%
Zip Codes with the Highest Percentage of Population Employed in Sales & Related in Oregon
| Zip Code | % Employed | vs State | vs National | |
| 1. | 97626 | 76.1% | 9.2%(+67.0)#1 | 9.6%(+66.5)#46 |
| 2. | 97134 | 39.1% | 9.2%(+30.0)#2 | 9.6%(+29.5)#214 |
| 3. | 97733 | 38.0% | 9.2%(+28.9)#3 | 9.6%(+28.4)#227 |
| 4. | 97326 | 37.0% | 9.2%(+27.8)#4 | 9.6%(+27.4)#239 |
| 5. | 97441 | 35.3% | 9.2%(+26.1)#5 | 9.6%(+25.7)#265 |
| 6. | 97622 | 32.7% | 9.2%(+23.5)#6 | 9.6%(+23.1)#324 |
| 7. | 97434 | 26.5% | 9.2%(+17.4)#7 | 9.6%(+16.9)#540 |
| 8. | 97493 | 24.2% | 9.2%(+15.0)#8 | 9.6%(+14.6)#704 |
| 9. | 97544 | 23.2% | 9.2%(+14.1)#9 | 9.6%(+13.6)#772 |
| 10. | 97534 | 21.8% | 9.2%(+12.6)#10 | 9.6%(+12.2)#922 |
| 11. | 97869 | 20.3% | 9.2%(+11.1)#11 | 9.6%(+10.7)#1,117 |
| 12. | 97144 | 19.4% | 9.2%(+10.2)#12 | 9.6%(+9.81)#1,260 |
| 13. | 97845 | 19.2% | 9.2%(+10.0)#13 | 9.6%(+9.61)#1,299 |
| 14. | 97067 | 18.9% | 9.2%(+9.76)#14 | 9.6%(+9.33)#1,363 |
| 15. | 97473 | 18.9% | 9.2%(+9.70)#15 | 9.6%(+9.27)#1,377 |
| 16. | 97835 | 18.8% | 9.2%(+9.61)#16 | 9.6%(+9.18)#1,388 |
| 17. | 97131 | 18.7% | 9.2%(+9.55)#17 | 9.6%(+9.12)#1,399 |
| 18. | 97375 | 18.6% | 9.2%(+9.40)#18 | 9.6%(+8.97)#1,424 |
| 19. | 97050 | 18.2% | 9.2%(+9.02)#19 | 9.6%(+8.59)#1,526 |
| 20. | 97135 | 17.8% | 9.2%(+8.62)#20 | 9.6%(+8.19)#1,618 |
| 21. | 97453 | 17.4% | 9.2%(+8.27)#21 | 9.6%(+7.84)#1,708 |
| 22. | 97347 | 16.5% | 9.2%(+7.29)#22 | 9.6%(+6.86)#2,033 |
| 23. | 97634 | 16.2% | 9.2%(+7.02)#23 | 9.6%(+6.59)#2,152 |
| 24. | 97834 | 15.8% | 9.2%(+6.68)#24 | 9.6%(+6.25)#2,314 |
| 25. | 97907 | 15.7% | 9.2%(+6.52)#25 | 9.6%(+6.09)#2,385 |
| 26. | 97137 | 15.7% | 9.2%(+6.52)#26 | 9.6%(+6.09)#2,392 |
| 27. | 97133 | 15.7% | 9.2%(+6.50)#27 | 9.6%(+6.07)#2,399 |
| 28. | 97411 | 15.1% | 9.2%(+5.91)#28 | 9.6%(+5.48)#2,687 |
| 29. | 97146 | 14.9% | 9.2%(+5.73)#29 | 9.6%(+5.30)#2,804 |
| 30. | 97701 | 14.9% | 9.2%(+5.69)#30 | 9.6%(+5.26)#2,834 |
| 31. | 97759 | 14.8% | 9.2%(+5.63)#31 | 9.6%(+5.20)#2,869 |
| 32. | 97147 | 14.6% | 9.2%(+5.48)#32 | 9.6%(+5.05)#2,978 |
| 33. | 97495 | 14.6% | 9.2%(+5.39)#33 | 9.6%(+4.96)#3,049 |
| 34. | 97536 | 14.5% | 9.2%(+5.33)#34 | 9.6%(+4.90)#3,086 |
| 35. | 97876 | 14.4% | 9.2%(+5.19)#35 | 9.6%(+4.76)#3,199 |
| 36. | 97345 | 14.2% | 9.2%(+4.99)#36 | 9.6%(+4.56)#3,358 |
| 37. | 97532 | 14.0% | 9.2%(+4.86)#37 | 9.6%(+4.43)#3,454 |
| 38. | 97867 | 14.0% | 9.2%(+4.81)#38 | 9.6%(+4.38)#3,502 |
| 39. | 97205 | 13.8% | 9.2%(+4.63)#39 | 9.6%(+4.20)#3,648 |
| 40. | 97877 | 13.8% | 9.2%(+4.63)#40 | 9.6%(+4.20)#3,655 |
| 41. | 97341 | 13.7% | 9.2%(+4.51)#41 | 9.6%(+4.08)#3,770 |
| 42. | 97140 | 13.6% | 9.2%(+4.48)#42 | 9.6%(+4.05)#3,793 |
| 43. | 97001 | 13.6% | 9.2%(+4.47)#43 | 9.6%(+4.04)#3,806 |
| 44. | 97138 | 13.6% | 9.2%(+4.39)#44 | 9.6%(+3.96)#3,889 |
| 45. | 97504 | 13.5% | 9.2%(+4.29)#45 | 9.6%(+3.87)#3,981 |
| 46. | 97002 | 13.4% | 9.2%(+4.24)#46 | 9.6%(+3.81)#4,031 |
| 47. | 97367 | 13.3% | 9.2%(+4.18)#47 | 9.6%(+3.75)#4,109 |
| 48. | 97365 | 13.2% | 9.2%(+4.02)#48 | 9.6%(+3.59)#4,292 |
| 49. | 97021 | 12.8% | 9.2%(+3.59)#49 | 9.6%(+3.16)#4,812 |
| 50. | 97501 | 12.7% | 9.2%(+3.55)#50 | 9.6%(+3.12)#4,855 |
| 51. | 97383 | 12.7% | 9.2%(+3.52)#51 | 9.6%(+3.09)#4,897 |
| 52. | 97439 | 12.7% | 9.2%(+3.52)#52 | 9.6%(+3.09)#4,898 |
| 53. | 97053 | 12.6% | 9.2%(+3.44)#53 | 9.6%(+3.01)#5,012 |
| 54. | 97390 | 12.5% | 9.2%(+3.33)#54 | 9.6%(+2.90)#5,178 |
| 55. | 97068 | 12.3% | 9.2%(+3.13)#55 | 9.6%(+2.70)#5,491 |
| 56. | 97859 | 12.3% | 9.2%(+3.12)#56 | 9.6%(+2.69)#5,515 |
| 57. | 97366 | 12.3% | 9.2%(+3.10)#57 | 9.6%(+2.67)#5,540 |
| 58. | 97103 | 12.2% | 9.2%(+2.99)#58 | 9.6%(+2.56)#5,750 |
| 59. | 97368 | 12.1% | 9.2%(+2.89)#59 | 9.6%(+2.46)#5,940 |
| 60. | 97477 | 12.1% | 9.2%(+2.89)#60 | 9.6%(+2.46)#5,949 |
| 61. | 97480 | 12.0% | 9.2%(+2.88)#61 | 9.6%(+2.45)#5,962 |
| 62. | 97843 | 11.9% | 9.2%(+2.69)#62 | 9.6%(+2.26)#6,319 |
| 63. | 97201 | 11.8% | 9.2%(+2.66)#63 | 9.6%(+2.23)#6,367 |
| 64. | 97761 | 11.8% | 9.2%(+2.59)#64 | 9.6%(+2.16)#6,493 |
| 65. | 97385 | 11.7% | 9.2%(+2.57)#65 | 9.6%(+2.14)#6,531 |
| 66. | 97114 | 11.7% | 9.2%(+2.52)#66 | 9.6%(+2.09)#6,632 |
| 67. | 97435 | 11.7% | 9.2%(+2.51)#67 | 9.6%(+2.08)#6,644 |
| 68. | 97448 | 11.5% | 9.2%(+2.36)#68 | 9.6%(+1.93)#6,957 |
| 69. | 97883 | 11.5% | 9.2%(+2.34)#69 | 9.6%(+1.91)#7,000 |
| 70. | 97016 | 11.5% | 9.2%(+2.32)#70 | 9.6%(+1.89)#7,040 |
| 71. | 97015 | 11.5% | 9.2%(+2.31)#71 | 9.6%(+1.88)#7,078 |
| 72. | 97702 | 11.4% | 9.2%(+2.26)#72 | 9.6%(+1.83)#7,194 |
| 73. | 97027 | 11.4% | 9.2%(+2.25)#73 | 9.6%(+1.83)#7,206 |
| 74. | 97048 | 11.4% | 9.2%(+2.24)#74 | 9.6%(+1.81)#7,240 |
| 75. | 97850 | 11.4% | 9.2%(+2.23)#75 | 9.6%(+1.80)#7,258 |
| 76. | 97467 | 11.4% | 9.2%(+2.22)#76 | 9.6%(+1.79)#7,276 |
| 77. | 97487 | 11.4% | 9.2%(+2.21)#77 | 9.6%(+1.78)#7,303 |
| 78. | 97225 | 11.4% | 9.2%(+2.20)#78 | 9.6%(+1.77)#7,315 |
| 79. | 97471 | 11.3% | 9.2%(+2.11)#79 | 9.6%(+1.68)#7,548 |
| 80. | 97086 | 11.3% | 9.2%(+2.10)#80 | 9.6%(+1.67)#7,552 |
| 81. | 97070 | 11.2% | 9.2%(+2.08)#81 | 9.6%(+1.65)#7,597 |
| 82. | 97841 | 11.2% | 9.2%(+2.06)#82 | 9.6%(+1.63)#7,638 |
| 83. | 97416 | 11.2% | 9.2%(+2.06)#83 | 9.6%(+1.63)#7,645 |
| 84. | 97221 | 11.2% | 9.2%(+2.00)#84 | 9.6%(+1.57)#7,774 |
| 85. | 97303 | 11.0% | 9.2%(+1.86)#85 | 9.6%(+1.43)#8,142 |
| 86. | 97437 | 11.0% | 9.2%(+1.85)#86 | 9.6%(+1.42)#8,156 |
| 87. | 97056 | 11.0% | 9.2%(+1.84)#87 | 9.6%(+1.41)#8,175 |
| 88. | 97223 | 11.0% | 9.2%(+1.82)#88 | 9.6%(+1.39)#8,254 |
| 89. | 97753 | 10.9% | 9.2%(+1.73)#89 | 9.6%(+1.30)#8,464 |
| 90. | 97824 | 10.9% | 9.2%(+1.73)#90 | 9.6%(+1.30)#8,470 |
| 91. | 97007 | 10.9% | 9.2%(+1.72)#91 | 9.6%(+1.29)#8,484 |
| 92. | 97703 | 10.8% | 9.2%(+1.67)#92 | 9.6%(+1.24)#8,617 |
| 93. | 97034 | 10.8% | 9.2%(+1.64)#93 | 9.6%(+1.21)#8,699 |
| 94. | 97814 | 10.8% | 9.2%(+1.62)#94 | 9.6%(+1.19)#8,760 |
| 95. | 97828 | 10.8% | 9.2%(+1.59)#95 | 9.6%(+1.16)#8,827 |
| 96. | 97005 | 10.7% | 9.2%(+1.56)#96 | 9.6%(+1.13)#8,916 |
| 97. | 97913 | 10.5% | 9.2%(+1.35)#97 | 9.6%(+0.917)#9,489 |
| 98. | 97145 | 10.5% | 9.2%(+1.30)#98 | 9.6%(+0.870)#9,622 |
| 99. | 97118 | 10.4% | 9.2%(+1.27)#99 | 9.6%(+0.843)#9,691 |
| 100. | 97479 | 10.4% | 9.2%(+1.26)#100 | 9.6%(+0.835)#9,718 |
Common Questions
What are the Top 10 Zip Codes with the Highest Percentage of Population Employed in Sales & Related in Oregon?
Top 10 Zip Codes with the Highest Percentage of Population Employed in Sales & Related in Oregon are:
What zip code has the Highest Percentage of Population Employed in Sales & Related in Oregon?
97626 has the Highest Percentage of Population Employed in Sales & Related in Oregon with 76.1%.
What is the Percentage of Population Employed in Sales & Related in the State of Oregon?
Percentage of Population Employed in Sales & Related in Oregon is 9.2%.
What is the Percentage of Population Employed in Sales & Related in the United States?
Percentage of Population Employed in Sales & Related in the United States is 9.6%.