Zip Codes with the Highest Percentage of Population with a Degree in Business in Oregon
RELATED REPORTS & OPTIONS
Business
Oregon
Compare Zip Codes
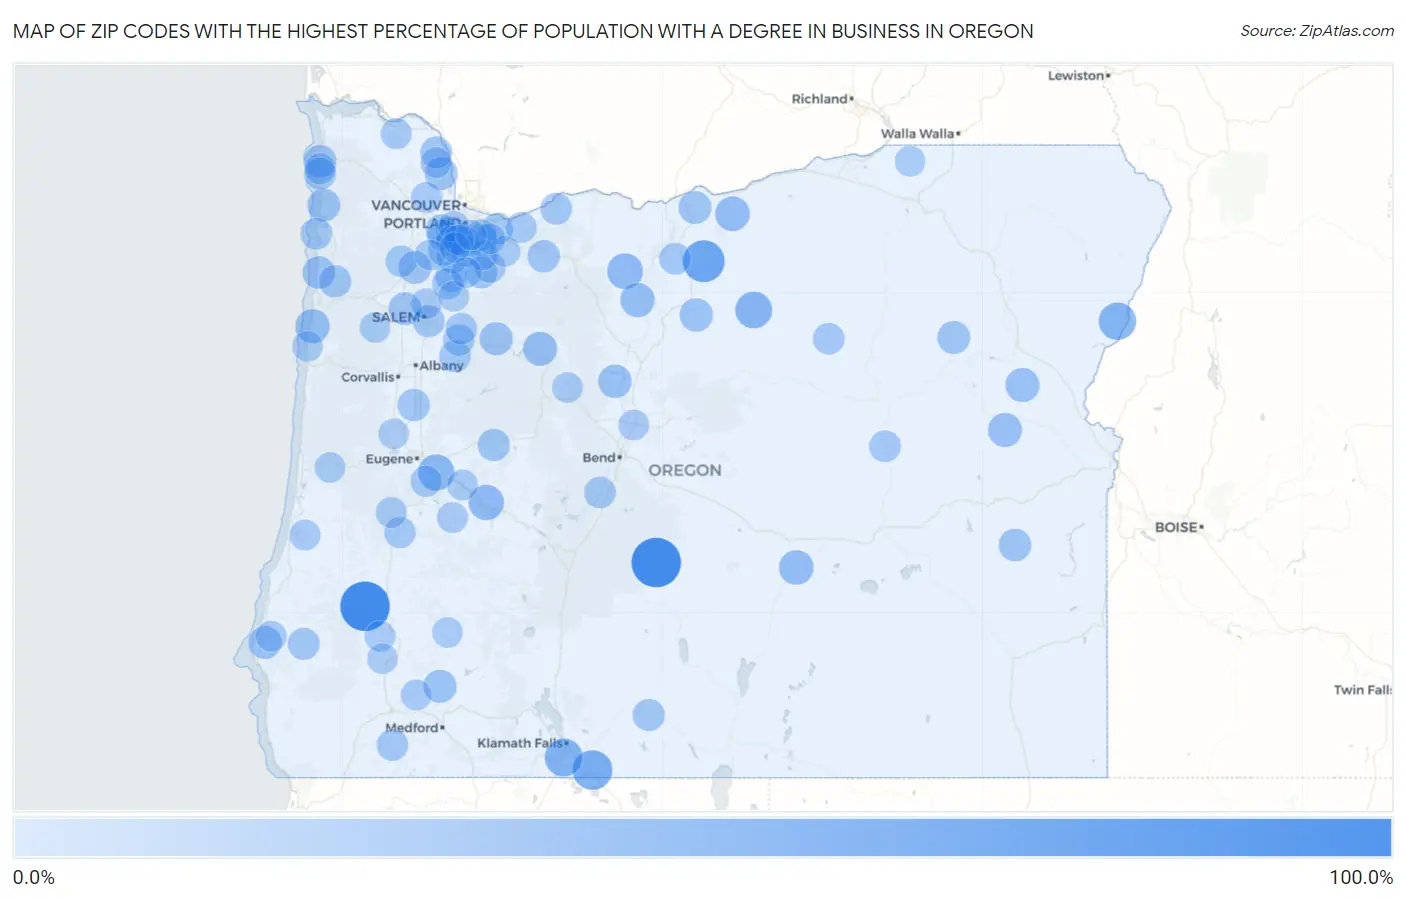
Map of Zip Codes with the Highest Percentage of Population with a Degree in Business in Oregon
0.0%
100.0%
Zip Codes with the Highest Percentage of Population with a Degree in Business in Oregon
| Zip Code | % Graduates | vs State | vs National | |
| 1. | 97481 | 100.0% | 14.6%(+85.4)#1 | 19.5%(+80.5)#15 |
| 2. | 97735 | 100.0% | 14.6%(+85.4)#2 | 19.5%(+80.5)#90 |
| 3. | 97033 | 66.7% | 14.6%(+52.1)#3 | 19.5%(+47.2)#343 |
| 4. | 97633 | 57.1% | 14.6%(+42.6)#4 | 19.5%(+37.6)#474 |
| 5. | 97634 | 50.0% | 14.6%(+35.4)#5 | 19.5%(+30.5)#655 |
| 6. | 97840 | 47.8% | 14.6%(+33.3)#6 | 19.5%(+28.3)#763 |
| 7. | 97830 | 45.5% | 14.6%(+30.9)#7 | 19.5%(+26.0)#867 |
| 8. | 97455 | 43.1% | 14.6%(+28.5)#8 | 19.5%(+23.6)#988 |
| 9. | 97063 | 40.3% | 14.6%(+25.8)#9 | 19.5%(+20.8)#1,192 |
| 10. | 97492 | 38.8% | 14.6%(+24.3)#10 | 19.5%(+19.3)#1,316 |
| 11. | 97812 | 36.4% | 14.6%(+21.8)#11 | 19.5%(+16.9)#1,551 |
| 12. | 97758 | 35.7% | 14.6%(+21.2)#12 | 19.5%(+16.2)#1,650 |
| 13. | 97388 | 34.5% | 14.6%(+20.0)#13 | 19.5%(+15.0)#1,803 |
| 14. | 97037 | 34.3% | 14.6%(+19.8)#14 | 19.5%(+14.8)#1,836 |
| 15. | 97342 | 33.3% | 14.6%(+18.8)#15 | 19.5%(+13.8)#2,029 |
| 16. | 97908 | 33.3% | 14.6%(+18.8)#16 | 19.5%(+13.8)#2,042 |
| 17. | 97819 | 33.3% | 14.6%(+18.8)#17 | 19.5%(+13.8)#2,043 |
| 18. | 97734 | 31.1% | 14.6%(+16.6)#18 | 19.5%(+11.6)#2,491 |
| 19. | 97001 | 30.3% | 14.6%(+15.8)#19 | 19.5%(+10.8)#2,716 |
| 20. | 97358 | 29.8% | 14.6%(+15.3)#20 | 19.5%(+10.3)#2,901 |
| 21. | 97503 | 29.6% | 14.6%(+15.1)#21 | 19.5%(+10.1)#2,972 |
| 22. | 97476 | 28.9% | 14.6%(+14.4)#22 | 19.5%(+9.45)#3,227 |
| 23. | 97127 | 28.9% | 14.6%(+14.3)#23 | 19.5%(+9.39)#3,249 |
| 24. | 97136 | 28.8% | 14.6%(+14.2)#24 | 19.5%(+9.30)#3,290 |
| 25. | 97877 | 28.6% | 14.6%(+14.0)#25 | 19.5%(+9.07)#3,395 |
| 26. | 97065 | 28.4% | 14.6%(+13.9)#26 | 19.5%(+8.91)#3,466 |
| 27. | 97371 | 28.4% | 14.6%(+13.8)#27 | 19.5%(+8.89)#3,479 |
| 28. | 97053 | 28.2% | 14.6%(+13.7)#28 | 19.5%(+8.71)#3,563 |
| 29. | 97110 | 27.8% | 14.6%(+13.2)#29 | 19.5%(+8.28)#3,794 |
| 30. | 97135 | 27.4% | 14.6%(+12.8)#30 | 19.5%(+7.89)#3,993 |
| 31. | 97906 | 27.3% | 14.6%(+12.7)#31 | 19.5%(+7.77)#4,061 |
| 32. | 97122 | 26.5% | 14.6%(+11.9)#32 | 19.5%(+6.97)#4,570 |
| 33. | 97348 | 26.4% | 14.6%(+11.9)#33 | 19.5%(+6.92)#4,606 |
| 34. | 97067 | 26.2% | 14.6%(+11.7)#34 | 19.5%(+6.74)#4,719 |
| 35. | 97488 | 26.2% | 14.6%(+11.6)#35 | 19.5%(+6.66)#4,771 |
| 36. | 97622 | 25.6% | 14.6%(+11.1)#36 | 19.5%(+6.14)#5,146 |
| 37. | 97466 | 25.0% | 14.6%(+10.4)#37 | 19.5%(+5.50)#5,642 |
| 38. | 97310 | 24.7% | 14.6%(+10.1)#38 | 19.5%(+5.19)#5,953 |
| 39. | 97102 | 24.4% | 14.6%(+9.88)#39 | 19.5%(+4.94)#6,187 |
| 40. | 97054 | 24.1% | 14.6%(+9.59)#40 | 19.5%(+4.64)#6,473 |
| 41. | 97042 | 24.1% | 14.6%(+9.50)#41 | 19.5%(+4.55)#6,552 |
| 42. | 97374 | 23.9% | 14.6%(+9.38)#42 | 19.5%(+4.43)#6,674 |
| 43. | 97134 | 23.9% | 14.6%(+9.33)#43 | 19.5%(+4.38)#6,733 |
| 44. | 97014 | 23.9% | 14.6%(+9.31)#44 | 19.5%(+4.36)#6,752 |
| 45. | 97029 | 23.7% | 14.6%(+9.13)#45 | 19.5%(+4.19)#6,934 |
| 46. | 97032 | 23.5% | 14.6%(+8.98)#46 | 19.5%(+4.03)#7,085 |
| 47. | 97873 | 23.5% | 14.6%(+8.98)#47 | 19.5%(+4.03)#7,099 |
| 48. | 97383 | 23.4% | 14.6%(+8.81)#48 | 19.5%(+3.86)#7,259 |
| 49. | 97707 | 23.3% | 14.6%(+8.76)#49 | 19.5%(+3.81)#7,325 |
| 50. | 97015 | 23.2% | 14.6%(+8.69)#50 | 19.5%(+3.74)#7,417 |
| 51. | 97008 | 23.2% | 14.6%(+8.68)#51 | 19.5%(+3.74)#7,419 |
| 52. | 97544 | 23.2% | 14.6%(+8.68)#52 | 19.5%(+3.74)#7,421 |
| 53. | 97111 | 23.2% | 14.6%(+8.67)#53 | 19.5%(+3.72)#7,428 |
| 54. | 97385 | 23.2% | 14.6%(+8.67)#54 | 19.5%(+3.72)#7,429 |
| 55. | 97864 | 23.1% | 14.6%(+8.53)#55 | 19.5%(+3.58)#7,589 |
| 56. | 97499 | 23.0% | 14.6%(+8.49)#56 | 19.5%(+3.54)#7,628 |
| 57. | 97070 | 22.7% | 14.6%(+8.20)#57 | 19.5%(+3.25)#7,911 |
| 58. | 97140 | 22.2% | 14.6%(+7.64)#58 | 19.5%(+2.70)#8,570 |
| 59. | 97078 | 22.1% | 14.6%(+7.58)#59 | 19.5%(+2.63)#8,630 |
| 60. | 97080 | 22.0% | 14.6%(+7.44)#60 | 19.5%(+2.49)#8,834 |
| 61. | 97426 | 21.7% | 14.6%(+7.17)#61 | 19.5%(+2.22)#9,190 |
| 62. | 97086 | 21.6% | 14.6%(+7.09)#62 | 19.5%(+2.14)#9,275 |
| 63. | 97007 | 21.4% | 14.6%(+6.80)#63 | 19.5%(+1.85)#9,671 |
| 64. | 97071 | 21.0% | 14.6%(+6.40)#64 | 19.5%(+1.45)#10,220 |
| 65. | 97145 | 20.9% | 14.6%(+6.34)#65 | 19.5%(+1.40)#10,297 |
| 66. | 97435 | 20.7% | 14.6%(+6.17)#66 | 19.5%(+1.23)#10,565 |
| 67. | 97449 | 20.5% | 14.6%(+5.96)#67 | 19.5%(+1.01)#10,864 |
| 68. | 97434 | 20.5% | 14.6%(+5.90)#68 | 19.5%(+0.956)#10,961 |
| 69. | 97016 | 20.4% | 14.6%(+5.84)#69 | 19.5%(+0.893)#11,034 |
| 70. | 97034 | 20.2% | 14.6%(+5.66)#70 | 19.5%(+0.709)#11,298 |
| 71. | 97450 | 20.1% | 14.6%(+5.59)#71 | 19.5%(+0.642)#11,382 |
| 72. | 97537 | 20.1% | 14.6%(+5.57)#72 | 19.5%(+0.622)#11,407 |
| 73. | 97019 | 20.1% | 14.6%(+5.55)#73 | 19.5%(+0.607)#11,420 |
| 74. | 97224 | 20.1% | 14.6%(+5.55)#74 | 19.5%(+0.602)#11,428 |
| 75. | 97303 | 20.0% | 14.6%(+5.45)#75 | 19.5%(+0.506)#11,555 |
| 76. | 97452 | 20.0% | 14.6%(+5.45)#76 | 19.5%(+0.501)#11,583 |
| 77. | 97004 | 20.0% | 14.6%(+5.43)#77 | 19.5%(+0.485)#11,675 |
| 78. | 97068 | 19.9% | 14.6%(+5.36)#78 | 19.5%(+0.408)#11,761 |
| 79. | 97051 | 19.8% | 14.6%(+5.26)#79 | 19.5%(+0.310)#11,909 |
| 80. | 97045 | 19.8% | 14.6%(+5.22)#80 | 19.5%(+0.277)#11,957 |
| 81. | 97022 | 19.7% | 14.6%(+5.15)#81 | 19.5%(+0.198)#12,065 |
| 82. | 97133 | 19.7% | 14.6%(+5.11)#82 | 19.5%(+0.164)#12,113 |
| 83. | 97756 | 19.5% | 14.6%(+4.99)#83 | 19.5%(+0.044)#12,303 |
| 84. | 97225 | 19.3% | 14.6%(+4.74)#84 | 19.5%(-0.209)#12,673 |
| 85. | 97369 | 19.2% | 14.6%(+4.68)#85 | 19.5%(-0.268)#12,777 |
| 86. | 97759 | 19.2% | 14.6%(+4.63)#86 | 19.5%(-0.313)#12,853 |
| 87. | 97469 | 19.1% | 14.6%(+4.57)#87 | 19.5%(-0.381)#12,957 |
| 88. | 97344 | 19.1% | 14.6%(+4.55)#88 | 19.5%(-0.398)#12,986 |
| 89. | 97362 | 19.1% | 14.6%(+4.52)#89 | 19.5%(-0.429)#13,020 |
| 90. | 97835 | 19.0% | 14.6%(+4.50)#90 | 19.5%(-0.451)#13,058 |
| 91. | 97442 | 18.9% | 14.6%(+4.35)#91 | 19.5%(-0.597)#13,286 |
| 92. | 97484 | 18.8% | 14.6%(+4.20)#92 | 19.5%(-0.749)#13,515 |
| 93. | 97453 | 18.7% | 14.6%(+4.12)#93 | 19.5%(-0.832)#13,605 |
| 94. | 97448 | 18.6% | 14.6%(+4.10)#94 | 19.5%(-0.849)#13,632 |
| 95. | 97013 | 18.6% | 14.6%(+4.08)#95 | 19.5%(-0.872)#13,681 |
| 96. | 97035 | 18.6% | 14.6%(+4.01)#96 | 19.5%(-0.933)#13,752 |
| 97. | 97089 | 18.5% | 14.6%(+3.99)#97 | 19.5%(-0.954)#13,791 |
| 98. | 97132 | 18.5% | 14.6%(+3.98)#98 | 19.5%(-0.965)#13,808 |
| 99. | 97062 | 18.5% | 14.6%(+3.95)#99 | 19.5%(-0.998)#13,863 |
| 100. | 97222 | 18.3% | 14.6%(+3.74)#100 | 19.5%(-1.21)#14,164 |
Common Questions
What are the Top 10 Zip Codes with the Highest Percentage of Population with a Degree in Business in Oregon?
Top 10 Zip Codes with the Highest Percentage of Population with a Degree in Business in Oregon are:
What zip code has the Highest Percentage of Population with a Degree in Business in Oregon?
97481 has the Highest Percentage of Population with a Degree in Business in Oregon with 100.0%.
What is the Percentage of Population with a Degree in Business in the State of Oregon?
Percentage of Population with a Degree in Business in Oregon is 14.6%.
What is the Percentage of Population with a Degree in Business in the United States?
Percentage of Population with a Degree in Business in the United States is 19.5%.