Zip Codes with the Highest Percentage of Households Without a Vehicle in Oregon
RELATED REPORTS & OPTIONS
Households without a Cars
Oregon
Compare Zip Codes
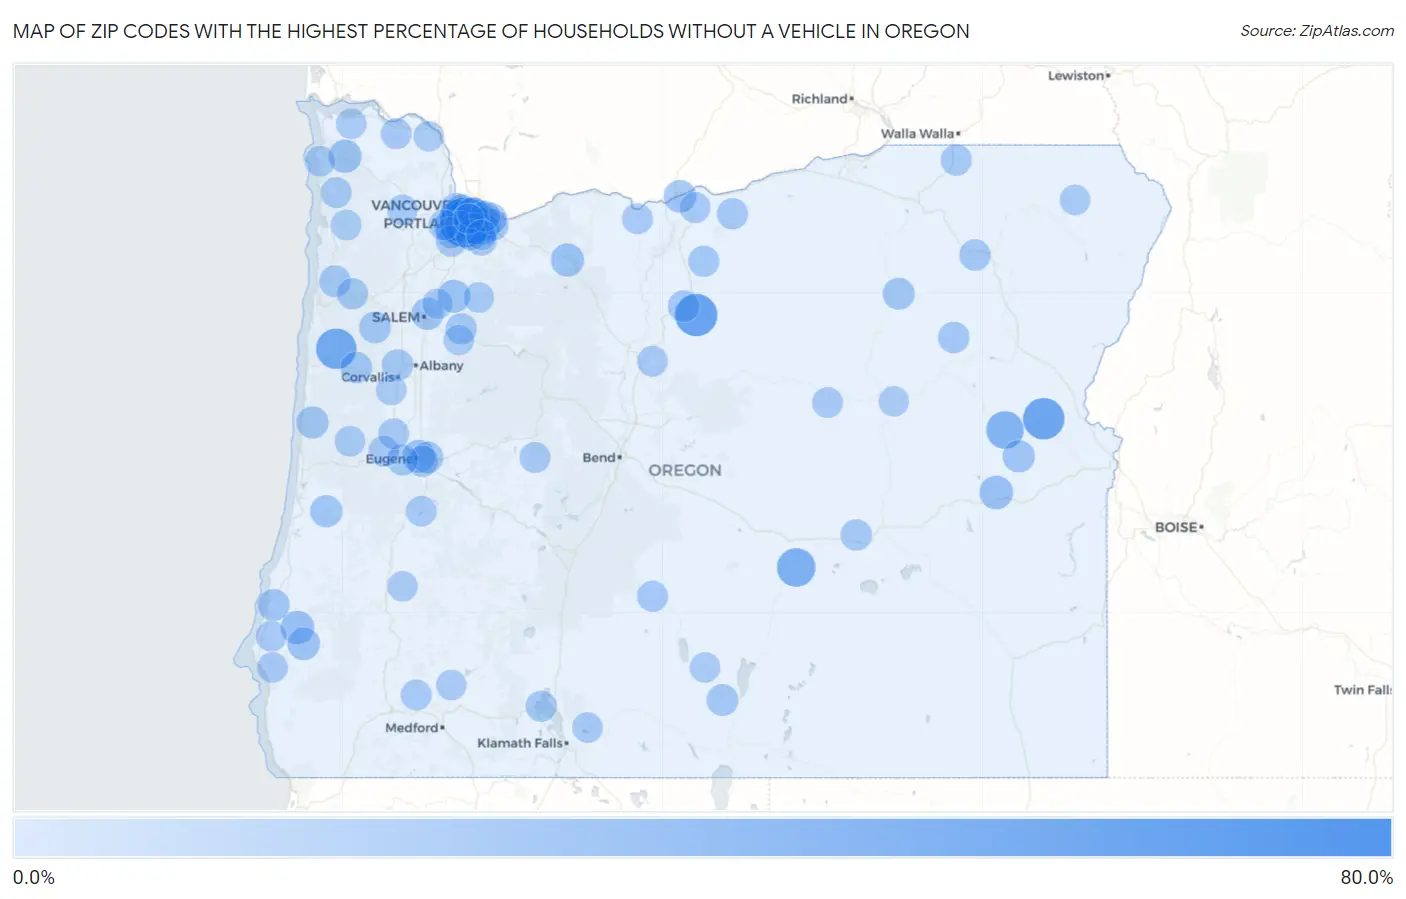
Map of Zip Codes with the Highest Percentage of Households Without a Vehicle in Oregon
0.0%
80.0%
Zip Codes with the Highest Percentage of Households Without a Vehicle in Oregon
| Zip Code | Housholds Without a Car | vs State | vs National | |
| 1. | 97204 | 70.0% | 7.0%(+63.0)#1 | 8.3%(+61.7)#192 |
| 2. | 97205 | 52.1% | 7.0%(+45.1)#2 | 8.3%(+43.8)#330 |
| 3. | 97001 | 45.6% | 7.0%(+38.6)#3 | 8.3%(+37.3)#397 |
| 4. | 97903 | 42.9% | 7.0%(+35.9)#4 | 8.3%(+34.6)#455 |
| 5. | 97357 | 39.5% | 7.0%(+32.5)#5 | 8.3%(+31.2)#524 |
| 6. | 97201 | 33.8% | 7.0%(+26.8)#6 | 8.3%(+25.5)#662 |
| 7. | 97758 | 33.3% | 7.0%(+26.3)#7 | 8.3%(+25.0)#681 |
| 8. | 97209 | 30.5% | 7.0%(+23.5)#8 | 8.3%(+22.2)#779 |
| 9. | 97908 | 30.0% | 7.0%(+23.0)#9 | 8.3%(+21.7)#802 |
| 10. | 97227 | 28.2% | 7.0%(+21.2)#10 | 8.3%(+19.9)#887 |
| 11. | 97210 | 23.3% | 7.0%(+16.3)#11 | 8.3%(+15.0)#1,188 |
| 12. | 97232 | 22.9% | 7.0%(+15.9)#12 | 8.3%(+14.6)#1,224 |
| 13. | 97216 | 17.3% | 7.0%(+10.3)#13 | 8.3%(+9.00)#1,898 |
| 14. | 97911 | 17.1% | 7.0%(+10.1)#14 | 8.3%(+8.80)#1,951 |
| 15. | 97414 | 16.5% | 7.0%(+9.50)#15 | 8.3%(+8.20)#2,070 |
| 16. | 97028 | 15.9% | 7.0%(+8.90)#16 | 8.3%(+7.60)#2,194 |
| 17. | 97138 | 15.7% | 7.0%(+8.70)#17 | 8.3%(+7.40)#2,217 |
| 18. | 97233 | 15.6% | 7.0%(+8.60)#18 | 8.3%(+7.30)#2,232 |
| 19. | 97214 | 15.5% | 7.0%(+8.50)#19 | 8.3%(+7.20)#2,253 |
| 20. | 97362 | 15.0% | 7.0%(+8.00)#20 | 8.3%(+6.70)#2,391 |
| 21. | 97401 | 14.5% | 7.0%(+7.50)#21 | 8.3%(+6.20)#2,519 |
| 22. | 97466 | 14.2% | 7.0%(+7.20)#22 | 8.3%(+5.90)#2,649 |
| 23. | 97050 | 13.7% | 7.0%(+6.70)#23 | 8.3%(+5.40)#2,836 |
| 24. | 97220 | 13.1% | 7.0%(+6.10)#24 | 8.3%(+4.80)#3,050 |
| 25. | 97301 | 12.7% | 7.0%(+5.70)#25 | 8.3%(+4.40)#3,217 |
| 26. | 97920 | 12.5% | 7.0%(+5.50)#26 | 8.3%(+4.20)#3,353 |
| 27. | 97239 | 12.4% | 7.0%(+5.40)#27 | 8.3%(+4.10)#3,367 |
| 28. | 97467 | 12.2% | 7.0%(+5.20)#28 | 8.3%(+3.90)#3,467 |
| 29. | 97498 | 12.1% | 7.0%(+5.10)#29 | 8.3%(+3.80)#3,532 |
| 30. | 97005 | 11.6% | 7.0%(+4.60)#30 | 8.3%(+3.30)#3,764 |
| 31. | 97880 | 11.6% | 7.0%(+4.60)#31 | 8.3%(+3.30)#3,810 |
| 32. | 97030 | 11.5% | 7.0%(+4.50)#32 | 8.3%(+3.20)#3,819 |
| 33. | 97218 | 11.5% | 7.0%(+4.50)#33 | 8.3%(+3.20)#3,831 |
| 34. | 97266 | 11.2% | 7.0%(+4.20)#34 | 8.3%(+2.90)#4,006 |
| 35. | 97411 | 11.2% | 7.0%(+4.20)#35 | 8.3%(+2.90)#4,029 |
| 36. | 97477 | 11.1% | 7.0%(+4.10)#36 | 8.3%(+2.80)#4,071 |
| 37. | 97057 | 11.1% | 7.0%(+4.10)#37 | 8.3%(+2.80)#4,122 |
| 38. | 97630 | 11.0% | 7.0%(+4.00)#38 | 8.3%(+2.70)#4,149 |
| 39. | 97122 | 11.0% | 7.0%(+4.00)#39 | 8.3%(+2.70)#4,172 |
| 40. | 97344 | 10.9% | 7.0%(+3.90)#40 | 8.3%(+2.60)#4,224 |
| 41. | 97326 | 10.9% | 7.0%(+3.90)#41 | 8.3%(+2.60)#4,228 |
| 42. | 97236 | 10.5% | 7.0%(+3.50)#42 | 8.3%(+2.20)#4,448 |
| 43. | 97203 | 10.5% | 7.0%(+3.50)#43 | 8.3%(+2.20)#4,456 |
| 44. | 97330 | 10.1% | 7.0%(+3.10)#44 | 8.3%(+1.80)#4,764 |
| 45. | 97850 | 10.0% | 7.0%(+3.00)#45 | 8.3%(+1.70)#4,864 |
| 46. | 97202 | 9.9% | 7.0%(+2.90)#46 | 8.3%(+1.60)#4,928 |
| 47. | 97877 | 9.9% | 7.0%(+2.90)#47 | 8.3%(+1.60)#4,999 |
| 48. | 97024 | 9.8% | 7.0%(+2.80)#48 | 8.3%(+1.50)#5,039 |
| 49. | 97738 | 9.8% | 7.0%(+2.80)#49 | 8.3%(+1.50)#5,067 |
| 50. | 97403 | 9.7% | 7.0%(+2.70)#50 | 8.3%(+1.40)#5,116 |
| 51. | 97015 | 9.4% | 7.0%(+2.40)#51 | 8.3%(+1.10)#5,349 |
| 52. | 97402 | 9.3% | 7.0%(+2.30)#52 | 8.3%(+1.00)#5,415 |
| 53. | 97347 | 9.3% | 7.0%(+2.30)#53 | 8.3%(+1.00)#5,489 |
| 54. | 97217 | 9.1% | 7.0%(+2.10)#54 | 8.3%(+0.800)#5,620 |
| 55. | 97213 | 9.1% | 7.0%(+2.10)#55 | 8.3%(+0.800)#5,622 |
| 56. | 97008 | 9.1% | 7.0%(+2.10)#56 | 8.3%(+0.800)#5,624 |
| 57. | 97385 | 9.1% | 7.0%(+2.10)#57 | 8.3%(+0.800)#5,667 |
| 58. | 97812 | 9.0% | 7.0%(+2.00)#58 | 8.3%(+0.700)#5,808 |
| 59. | 97638 | 9.0% | 7.0%(+2.00)#59 | 8.3%(+0.700)#5,818 |
| 60. | 97601 | 8.9% | 7.0%(+1.90)#60 | 8.3%(+0.600)#5,850 |
| 61. | 97862 | 8.9% | 7.0%(+1.90)#61 | 8.3%(+0.600)#5,862 |
| 62. | 97033 | 8.9% | 7.0%(+1.90)#62 | 8.3%(+0.600)#5,936 |
| 63. | 97206 | 8.6% | 7.0%(+1.60)#63 | 8.3%(+0.300)#6,162 |
| 64. | 97221 | 8.6% | 7.0%(+1.60)#64 | 8.3%(+0.300)#6,213 |
| 65. | 97224 | 8.5% | 7.0%(+1.50)#65 | 8.3%(+0.200)#6,309 |
| 66. | 97537 | 8.5% | 7.0%(+1.50)#66 | 8.3%(+0.200)#6,359 |
| 67. | 97413 | 8.4% | 7.0%(+1.40)#67 | 8.3%(+0.100)#6,506 |
| 68. | 97065 | 8.4% | 7.0%(+1.40)#68 | 8.3%(+0.100)#6,509 |
| 69. | 97437 | 8.2% | 7.0%(+1.20)#69 | 8.3%(-0.100)#6,721 |
| 70. | 97222 | 8.1% | 7.0%(+1.10)#70 | 8.3%(-0.200)#6,787 |
| 71. | 97131 | 8.1% | 7.0%(+1.10)#71 | 8.3%(-0.200)#6,853 |
| 72. | 97450 | 8.1% | 7.0%(+1.10)#72 | 8.3%(-0.200)#6,876 |
| 73. | 97211 | 8.0% | 7.0%(+1.000)#73 | 8.3%(-0.300)#6,912 |
| 74. | 97230 | 7.9% | 7.0%(+0.900)#74 | 8.3%(-0.400)#7,069 |
| 75. | 97116 | 7.9% | 7.0%(+0.900)#75 | 8.3%(-0.400)#7,085 |
| 76. | 97448 | 7.9% | 7.0%(+0.900)#76 | 8.3%(-0.400)#7,120 |
| 77. | 97825 | 7.9% | 7.0%(+0.900)#77 | 8.3%(-0.400)#7,191 |
| 78. | 97016 | 7.8% | 7.0%(+0.800)#78 | 8.3%(-0.500)#7,274 |
| 79. | 97058 | 7.7% | 7.0%(+0.700)#79 | 8.3%(-0.600)#7,398 |
| 80. | 97424 | 7.7% | 7.0%(+0.700)#80 | 8.3%(-0.600)#7,402 |
| 81. | 97741 | 7.7% | 7.0%(+0.700)#81 | 8.3%(-0.600)#7,412 |
| 82. | 97003 | 7.5% | 7.0%(+0.500)#82 | 8.3%(-0.800)#7,701 |
| 83. | 97141 | 7.5% | 7.0%(+0.500)#83 | 8.3%(-0.800)#7,736 |
| 84. | 97465 | 7.5% | 7.0%(+0.500)#84 | 8.3%(-0.800)#7,802 |
| 85. | 97625 | 7.4% | 7.0%(+0.400)#85 | 8.3%(-0.900)#8,006 |
| 86. | 97212 | 7.2% | 7.0%(+0.200)#86 | 8.3%(-1.10)#8,206 |
| 87. | 97828 | 7.2% | 7.0%(+0.200)#87 | 8.3%(-1.10)#8,282 |
| 88. | 97636 | 7.2% | 7.0%(+0.200)#88 | 8.3%(-1.10)#8,343 |
| 89. | 97430 | 7.2% | 7.0%(+0.200)#89 | 8.3%(-1.10)#8,344 |
| 90. | 97333 | 7.1% | 7.0%(+0.100)#90 | 8.3%(-1.20)#8,390 |
| 91. | 97103 | 7.1% | 7.0%(+0.100)#91 | 8.3%(-1.20)#8,406 |
| 92. | 97110 | 7.1% | 7.0%(+0.100)#92 | 8.3%(-1.20)#8,492 |
| 93. | 97086 | 6.9% | 7.0%(-0.100)#93 | 8.3%(-1.40)#8,704 |
| 94. | 97038 | 6.9% | 7.0%(-0.100)#94 | 8.3%(-1.40)#8,734 |
| 95. | 97845 | 6.9% | 7.0%(-0.100)#95 | 8.3%(-1.40)#8,800 |
| 96. | 97383 | 6.8% | 7.0%(-0.200)#96 | 8.3%(-1.50)#8,897 |
| 97. | 97048 | 6.8% | 7.0%(-0.200)#97 | 8.3%(-1.50)#8,904 |
| 98. | 97539 | 6.8% | 7.0%(-0.200)#98 | 8.3%(-1.50)#8,923 |
| 99. | 97305 | 6.7% | 7.0%(-0.300)#99 | 8.3%(-1.60)#9,006 |
| 100. | 97470 | 6.7% | 7.0%(-0.300)#100 | 8.3%(-1.60)#9,045 |
Common Questions
What are the Top 10 Zip Codes with the Highest Percentage of Households Without a Vehicle in Oregon?
Top 10 Zip Codes with the Highest Percentage of Households Without a Vehicle in Oregon are:
What zip code has the Highest Percentage of Households Without a Vehicle in Oregon?
97204 has the Highest Percentage of Households Without a Vehicle in Oregon with 70.0%.
What is the Percentage of Households Without a Vehicle in the State of Oregon?
Percentage of Households Without a Vehicle in Oregon is 7.0%.
What is the Percentage of Households Without a Vehicle in the United States?
Percentage of Households Without a Vehicle in the United States is 8.3%.