Zip Codes with the Highest Percentage of Families with Income Above $100,000 in Oregon
RELATED REPORTS & OPTIONS
Family Income | $100k+
Oregon
Compare Zip Codes
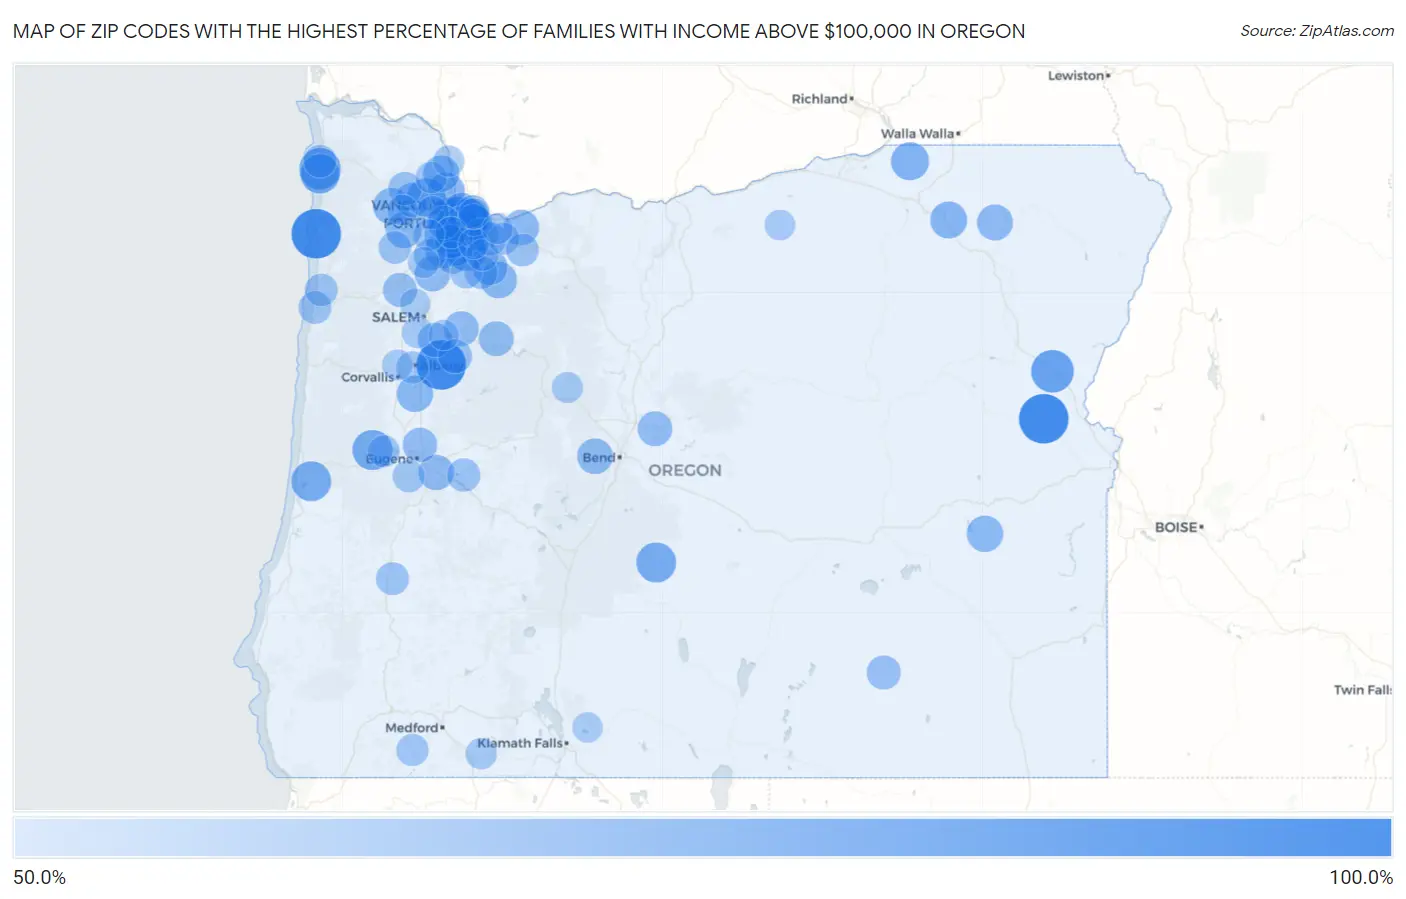
Map of Zip Codes with the Highest Percentage of Families with Income Above $100,000 in Oregon
50.0%
100.0%
Zip Codes with the Highest Percentage of Families with Income Above $100,000 in Oregon
| Zip Code | Families with Income > $100k | vs State | vs National | |
| 1. | 97204 | 100.0% | 47.1%(+52.9)#1 | 46.1%(+53.9)#20 |
| 2. | 97335 | 100.0% | 47.1%(+52.9)#2 | 46.1%(+53.9)#48 |
| 3. | 97134 | 100.0% | 47.1%(+52.9)#3 | 46.1%(+53.9)#90 |
| 4. | 97903 | 100.0% | 47.1%(+52.9)#4 | 46.1%(+53.9)#238 |
| 5. | 97905 | 82.4% | 47.1%(+35.3)#5 | 46.1%(+36.3)#784 |
| 6. | 97210 | 79.5% | 47.1%(+32.4)#6 | 46.1%(+33.4)#1,081 |
| 7. | 97145 | 79.4% | 47.1%(+32.3)#7 | 46.1%(+33.3)#1,099 |
| 8. | 97034 | 79.1% | 47.1%(+32.0)#8 | 46.1%(+33.0)#1,130 |
| 9. | 97209 | 78.7% | 47.1%(+31.6)#9 | 46.1%(+32.6)#1,173 |
| 10. | 97461 | 76.2% | 47.1%(+29.1)#10 | 46.1%(+30.1)#1,536 |
| 11. | 97735 | 75.5% | 47.1%(+28.4)#11 | 46.1%(+29.4)#1,635 |
| 12. | 97493 | 75.3% | 47.1%(+28.2)#12 | 46.1%(+29.2)#1,668 |
| 13. | 97229 | 75.0% | 47.1%(+27.9)#13 | 46.1%(+28.9)#1,695 |
| 14. | 97102 | 74.5% | 47.1%(+27.4)#14 | 46.1%(+28.4)#1,788 |
| 15. | 97068 | 73.8% | 47.1%(+26.7)#15 | 46.1%(+27.7)#1,904 |
| 16. | 97212 | 73.8% | 47.1%(+26.7)#16 | 46.1%(+27.7)#1,905 |
| 17. | 97035 | 73.3% | 47.1%(+26.2)#17 | 46.1%(+27.2)#1,979 |
| 18. | 97219 | 72.7% | 47.1%(+25.6)#18 | 46.1%(+26.6)#2,086 |
| 19. | 97227 | 72.6% | 47.1%(+25.5)#19 | 46.1%(+26.5)#2,124 |
| 20. | 97225 | 72.4% | 47.1%(+25.3)#20 | 46.1%(+26.3)#2,151 |
| 21. | 97221 | 72.4% | 47.1%(+25.3)#21 | 46.1%(+26.3)#2,158 |
| 22. | 97133 | 71.8% | 47.1%(+24.7)#22 | 46.1%(+25.7)#2,267 |
| 23. | 97201 | 71.6% | 47.1%(+24.5)#23 | 46.1%(+25.5)#2,295 |
| 24. | 97214 | 71.0% | 47.1%(+23.9)#24 | 46.1%(+24.9)#2,400 |
| 25. | 97835 | 70.6% | 47.1%(+23.5)#25 | 46.1%(+24.5)#2,497 |
| 26. | 97232 | 69.8% | 47.1%(+22.7)#26 | 46.1%(+23.7)#2,649 |
| 27. | 97215 | 69.7% | 47.1%(+22.6)#27 | 46.1%(+23.6)#2,675 |
| 28. | 97231 | 68.8% | 47.1%(+21.7)#28 | 46.1%(+22.7)#2,865 |
| 29. | 97859 | 68.0% | 47.1%(+20.9)#29 | 46.1%(+21.9)#3,027 |
| 30. | 97062 | 67.3% | 47.1%(+20.2)#30 | 46.1%(+21.2)#3,182 |
| 31. | 97140 | 67.1% | 47.1%(+20.0)#31 | 46.1%(+21.0)#3,222 |
| 32. | 97017 | 67.0% | 47.1%(+19.9)#32 | 46.1%(+20.9)#3,249 |
| 33. | 97377 | 67.0% | 47.1%(+19.9)#33 | 46.1%(+20.9)#3,254 |
| 34. | 97053 | 66.9% | 47.1%(+19.8)#34 | 46.1%(+20.8)#3,271 |
| 35. | 97202 | 66.8% | 47.1%(+19.7)#35 | 46.1%(+20.7)#3,279 |
| 36. | 97117 | 66.8% | 47.1%(+19.7)#36 | 46.1%(+20.7)#3,292 |
| 37. | 97917 | 66.7% | 47.1%(+19.6)#37 | 46.1%(+20.6)#3,328 |
| 38. | 97205 | 66.4% | 47.1%(+19.3)#38 | 46.1%(+20.3)#3,392 |
| 39. | 97119 | 66.4% | 47.1%(+19.3)#39 | 46.1%(+20.3)#3,397 |
| 40. | 97007 | 65.8% | 47.1%(+18.7)#40 | 46.1%(+19.7)#3,529 |
| 41. | 97876 | 65.7% | 47.1%(+18.6)#41 | 46.1%(+19.6)#3,563 |
| 42. | 97239 | 65.6% | 47.1%(+18.5)#42 | 46.1%(+19.5)#3,579 |
| 43. | 97223 | 64.9% | 47.1%(+17.8)#43 | 46.1%(+18.8)#3,758 |
| 44. | 97703 | 64.7% | 47.1%(+17.6)#44 | 46.1%(+18.6)#3,818 |
| 45. | 97019 | 64.5% | 47.1%(+17.4)#45 | 46.1%(+18.4)#3,886 |
| 46. | 97455 | 64.4% | 47.1%(+17.3)#46 | 46.1%(+18.3)#3,910 |
| 47. | 97137 | 64.4% | 47.1%(+17.3)#47 | 46.1%(+18.3)#3,911 |
| 48. | 97004 | 63.8% | 47.1%(+16.7)#48 | 46.1%(+17.7)#4,076 |
| 49. | 97385 | 63.1% | 47.1%(+16.0)#49 | 46.1%(+17.0)#4,262 |
| 50. | 97358 | 63.0% | 47.1%(+15.9)#50 | 46.1%(+16.9)#4,289 |
| 51. | 97753 | 62.8% | 47.1%(+15.7)#51 | 46.1%(+16.7)#4,337 |
| 52. | 97217 | 62.3% | 47.1%(+15.2)#52 | 46.1%(+16.2)#4,465 |
| 53. | 97106 | 62.3% | 47.1%(+15.2)#53 | 46.1%(+16.2)#4,479 |
| 54. | 97392 | 62.2% | 47.1%(+15.1)#54 | 46.1%(+16.1)#4,500 |
| 55. | 97408 | 62.0% | 47.1%(+14.9)#55 | 46.1%(+15.9)#4,555 |
| 56. | 97211 | 61.9% | 47.1%(+14.8)#56 | 46.1%(+15.8)#4,574 |
| 57. | 97101 | 61.0% | 47.1%(+13.9)#57 | 46.1%(+14.9)#4,862 |
| 58. | 97374 | 60.8% | 47.1%(+13.7)#58 | 46.1%(+14.7)#4,918 |
| 59. | 97736 | 60.8% | 47.1%(+13.7)#59 | 46.1%(+14.7)#4,929 |
| 60. | 97224 | 59.9% | 47.1%(+12.8)#60 | 46.1%(+13.8)#5,160 |
| 61. | 97006 | 59.5% | 47.1%(+12.4)#61 | 46.1%(+13.4)#5,286 |
| 62. | 97109 | 59.4% | 47.1%(+12.3)#62 | 46.1%(+13.3)#5,333 |
| 63. | 97086 | 59.2% | 47.1%(+12.1)#63 | 46.1%(+13.1)#5,381 |
| 64. | 97438 | 59.0% | 47.1%(+11.9)#64 | 46.1%(+12.9)#5,455 |
| 65. | 97089 | 58.6% | 47.1%(+11.5)#65 | 46.1%(+12.5)#5,587 |
| 66. | 97124 | 58.5% | 47.1%(+11.4)#66 | 46.1%(+12.4)#5,602 |
| 67. | 97042 | 58.2% | 47.1%(+11.1)#67 | 46.1%(+12.1)#5,714 |
| 68. | 97495 | 58.1% | 47.1%(+11.0)#68 | 46.1%(+12.0)#5,744 |
| 69. | 97110 | 57.7% | 47.1%(+10.6)#69 | 46.1%(+11.6)#5,896 |
| 70. | 97364 | 57.7% | 47.1%(+10.6)#70 | 46.1%(+11.6)#5,899 |
| 71. | 97055 | 57.6% | 47.1%(+10.5)#71 | 46.1%(+11.5)#5,916 |
| 72. | 97149 | 57.6% | 47.1%(+10.5)#72 | 46.1%(+11.5)#5,936 |
| 73. | 97070 | 57.5% | 47.1%(+10.4)#73 | 46.1%(+11.4)#5,945 |
| 74. | 97148 | 57.5% | 47.1%(+10.4)#74 | 46.1%(+11.4)#5,958 |
| 75. | 97321 | 56.8% | 47.1%(+9.70)#75 | 46.1%(+10.7)#6,155 |
| 76. | 97405 | 56.3% | 47.1%(+9.20)#76 | 46.1%(+10.2)#6,305 |
| 77. | 97530 | 56.3% | 47.1%(+9.20)#77 | 46.1%(+10.2)#6,323 |
| 78. | 97213 | 56.1% | 47.1%(+9.00)#78 | 46.1%(+10.0)#6,400 |
| 79. | 97437 | 55.7% | 47.1%(+8.60)#79 | 46.1%(+9.60)#6,563 |
| 80. | 97132 | 55.6% | 47.1%(+8.50)#80 | 46.1%(+9.50)#6,589 |
| 81. | 97013 | 55.6% | 47.1%(+8.50)#81 | 46.1%(+9.50)#6,591 |
| 82. | 97045 | 55.5% | 47.1%(+8.40)#82 | 46.1%(+9.40)#6,623 |
| 83. | 97008 | 55.4% | 47.1%(+8.30)#83 | 46.1%(+9.30)#6,654 |
| 84. | 97009 | 55.2% | 47.1%(+8.10)#84 | 46.1%(+9.10)#6,730 |
| 85. | 97123 | 54.8% | 47.1%(+7.70)#85 | 46.1%(+8.70)#6,866 |
| 86. | 97056 | 54.8% | 47.1%(+7.70)#86 | 46.1%(+8.70)#6,880 |
| 87. | 97018 | 53.9% | 47.1%(+6.80)#87 | 46.1%(+7.80)#7,215 |
| 88. | 97520 | 53.8% | 47.1%(+6.70)#88 | 46.1%(+7.70)#7,235 |
| 89. | 97306 | 53.6% | 47.1%(+6.50)#89 | 46.1%(+7.50)#7,304 |
| 90. | 97759 | 53.5% | 47.1%(+6.40)#90 | 46.1%(+7.40)#7,362 |
| 91. | 97115 | 53.3% | 47.1%(+6.20)#91 | 46.1%(+7.20)#7,432 |
| 92. | 97027 | 53.1% | 47.1%(+6.00)#92 | 46.1%(+7.00)#7,503 |
| 93. | 97330 | 53.0% | 47.1%(+5.90)#93 | 46.1%(+6.90)#7,532 |
| 94. | 97116 | 53.0% | 47.1%(+5.90)#94 | 46.1%(+6.90)#7,536 |
| 95. | 97218 | 53.0% | 47.1%(+5.90)#95 | 46.1%(+6.90)#7,542 |
| 96. | 97080 | 52.4% | 47.1%(+5.30)#96 | 46.1%(+6.30)#7,787 |
| 97. | 97843 | 52.3% | 47.1%(+5.20)#97 | 46.1%(+6.20)#7,870 |
| 98. | 97325 | 52.0% | 47.1%(+4.90)#98 | 46.1%(+5.90)#7,991 |
| 99. | 97625 | 52.0% | 47.1%(+4.90)#99 | 46.1%(+5.90)#8,014 |
| 100. | 97304 | 51.8% | 47.1%(+4.70)#100 | 46.1%(+5.70)#8,056 |
Common Questions
What are the Top 10 Zip Codes with the Highest Percentage of Families with Income Above $100,000 in Oregon?
Top 10 Zip Codes with the Highest Percentage of Families with Income Above $100,000 in Oregon are:
What zip code has the Highest Percentage of Families with Income Above $100,000 in Oregon?
97204 has the Highest Percentage of Families with Income Above $100,000 in Oregon with 100.0%.
What is the Percentage of Families with Income Above $100,000 in the State of Oregon?
Percentage of Families with Income Above $100,000 in Oregon is 47.1%.
What is the Percentage of Families with Income Above $100,000 in the United States?
Percentage of Families with Income Above $100,000 in the United States is 46.1%.