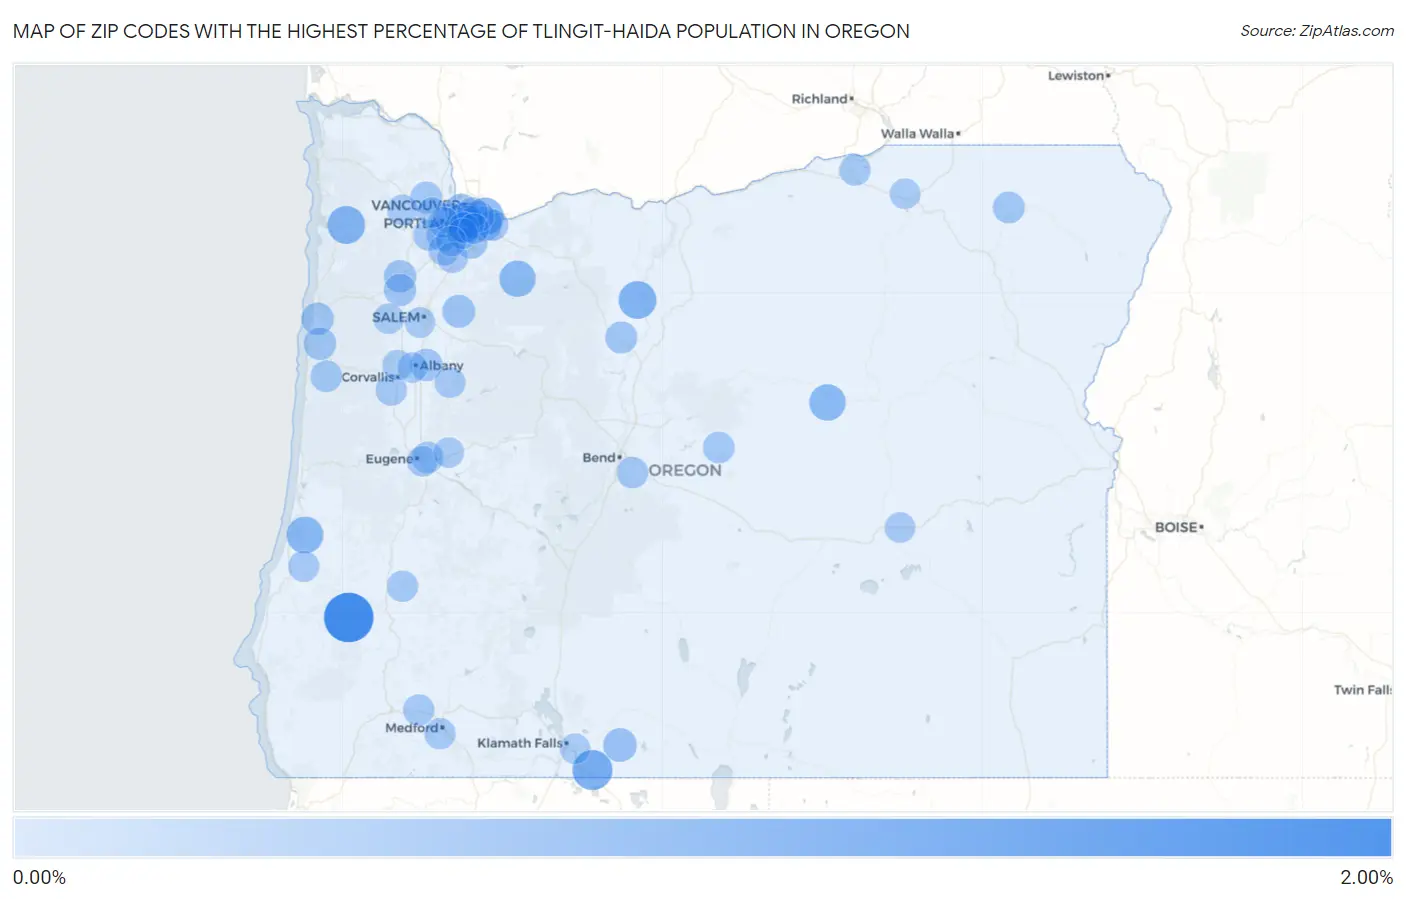
Zip Codes with the Highest Percentage of Tlingit-Haida Population in Oregon
RELATED REPORTS & OPTIONS
Tlingit-Haida
Oregon
Compare Zip Codes
Map of Zip Codes with the Highest Percentage of Tlingit-Haida Population in Oregon
0.00%
2.00%
Zip Codes with the Highest Percentage of Tlingit-Haida Population in Oregon
| Zip Code | Tlingit-Haida | vs State | vs National | |
| 1. | 97416 | 1.60% | 0.034%(+1.57)#1 | 0.0082%(+1.59)#39 |
| 2. | 97204 | 0.79% | 0.034%(+0.760)#2 | 0.0082%(+0.785)#69 |
| 3. | 97633 | 0.79% | 0.034%(+0.753)#3 | 0.0082%(+0.778)#70 |
| 4. | 97141 | 0.60% | 0.034%(+0.568)#4 | 0.0082%(+0.594)#86 |
| 5. | 97037 | 0.60% | 0.034%(+0.562)#5 | 0.0082%(+0.588)#87 |
| 6. | 97230 | 0.56% | 0.034%(+0.524)#6 | 0.0082%(+0.549)#90 |
| 7. | 97449 | 0.52% | 0.034%(+0.487)#7 | 0.0082%(+0.512)#95 |
| 8. | 97825 | 0.49% | 0.034%(+0.458)#8 | 0.0082%(+0.483)#100 |
| 9. | 97023 | 0.48% | 0.034%(+0.445)#9 | 0.0082%(+0.471)#104 |
| 10. | 97233 | 0.31% | 0.034%(+0.272)#10 | 0.0082%(+0.297)#147 |
| 11. | 97623 | 0.26% | 0.034%(+0.225)#11 | 0.0082%(+0.251)#168 |
| 12. | 97381 | 0.20% | 0.034%(+0.166)#12 | 0.0082%(+0.191)#193 |
| 13. | 97217 | 0.18% | 0.034%(+0.150)#13 | 0.0082%(+0.175)#205 |
| 14. | 97367 | 0.18% | 0.034%(+0.145)#14 | 0.0082%(+0.170)#209 |
| 15. | 97380 | 0.17% | 0.034%(+0.141)#15 | 0.0082%(+0.166)#214 |
| 16. | 97128 | 0.17% | 0.034%(+0.134)#16 | 0.0082%(+0.159)#224 |
| 17. | 97267 | 0.17% | 0.034%(+0.134)#17 | 0.0082%(+0.159)#226 |
| 18. | 97322 | 0.16% | 0.034%(+0.129)#18 | 0.0082%(+0.154)#231 |
| 19. | 97101 | 0.15% | 0.034%(+0.121)#19 | 0.0082%(+0.146)#242 |
| 20. | 97761 | 0.12% | 0.034%(+0.090)#20 | 0.0082%(+0.116)#278 |
| 21. | 97007 | 0.12% | 0.034%(+0.084)#21 | 0.0082%(+0.109)#286 |
| 22. | 97827 | 0.12% | 0.034%(+0.082)#22 | 0.0082%(+0.107)#288 |
| 23. | 97133 | 0.11% | 0.034%(+0.072)#23 | 0.0082%(+0.097)#307 |
| 24. | 97030 | 0.10% | 0.034%(+0.067)#24 | 0.0082%(+0.092)#317 |
| 25. | 97477 | 0.100% | 0.034%(+0.066)#25 | 0.0082%(+0.092)#319 |
| 26. | 97391 | 0.099% | 0.034%(+0.065)#26 | 0.0082%(+0.091)#322 |
| 27. | 97754 | 0.093% | 0.034%(+0.059)#27 | 0.0082%(+0.085)#334 |
| 28. | 97702 | 0.088% | 0.034%(+0.054)#28 | 0.0082%(+0.080)#341 |
| 29. | 97333 | 0.074% | 0.034%(+0.040)#29 | 0.0082%(+0.066)#360 |
| 30. | 97470 | 0.068% | 0.034%(+0.035)#30 | 0.0082%(+0.060)#371 |
| 31. | 97123 | 0.066% | 0.034%(+0.033)#31 | 0.0082%(+0.058)#380 |
| 32. | 97501 | 0.065% | 0.034%(+0.032)#32 | 0.0082%(+0.057)#384 |
| 33. | 97220 | 0.064% | 0.034%(+0.031)#33 | 0.0082%(+0.056)#387 |
| 34. | 97214 | 0.063% | 0.034%(+0.029)#34 | 0.0082%(+0.055)#390 |
| 35. | 97838 | 0.061% | 0.034%(+0.028)#35 | 0.0082%(+0.053)#393 |
| 36. | 97232 | 0.060% | 0.034%(+0.027)#36 | 0.0082%(+0.052)#395 |
| 37. | 97525 | 0.060% | 0.034%(+0.027)#37 | 0.0082%(+0.052)#396 |
| 38. | 97221 | 0.053% | 0.034%(+0.020)#38 | 0.0082%(+0.045)#418 |
| 39. | 97140 | 0.053% | 0.034%(+0.019)#39 | 0.0082%(+0.045)#420 |
| 40. | 97420 | 0.050% | 0.034%(+0.016)#40 | 0.0082%(+0.041)#428 |
| 41. | 97229 | 0.044% | 0.034%(+0.011)#41 | 0.0082%(+0.036)#453 |
| 42. | 97070 | 0.042% | 0.034%(+0.009)#42 | 0.0082%(+0.034)#461 |
| 43. | 97116 | 0.038% | 0.034%(+0.004)#43 | 0.0082%(+0.029)#482 |
| 44. | 97006 | 0.035% | 0.034%(+0.002)#44 | 0.0082%(+0.027)#491 |
| 45. | 97211 | 0.032% | 0.034%(-0.002)#45 | 0.0082%(+0.024)#511 |
| 46. | 97355 | 0.031% | 0.034%(-0.003)#46 | 0.0082%(+0.022)#518 |
| 47. | 97239 | 0.027% | 0.034%(-0.006)#47 | 0.0082%(+0.019)#529 |
| 48. | 97403 | 0.026% | 0.034%(-0.007)#48 | 0.0082%(+0.018)#538 |
| 49. | 97219 | 0.025% | 0.034%(-0.009)#49 | 0.0082%(+0.017)#544 |
| 50. | 97720 | 0.023% | 0.034%(-0.011)#50 | 0.0082%(+0.014)#551 |
| 51. | 97206 | 0.020% | 0.034%(-0.014)#51 | 0.0082%(+0.011)#567 |
| 52. | 97603 | 0.019% | 0.034%(-0.015)#52 | 0.0082%(+0.010)#573 |
| 53. | 97801 | 0.018% | 0.034%(-0.015)#53 | 0.0082%(+0.010)#575 |
| 54. | 97338 | 0.017% | 0.034%(-0.016)#54 | 0.0082%(+0.009)#581 |
| 55. | 97124 | 0.013% | 0.034%(-0.021)#55 | 0.0082%(+0.005)#610 |
| 56. | 97478 | 0.013% | 0.034%(-0.021)#56 | 0.0082%(+0.005)#611 |
| 57. | 97302 | 0.012% | 0.034%(-0.021)#57 | 0.0082%(+0.004)#612 |
| 58. | 97224 | 0.011% | 0.034%(-0.023)#58 | 0.0082%(+0.003)#620 |
| 59. | 97330 | 0.0045% | 0.034%(-0.029)#59 | 0.0082%(-0.004)#655 |
| 60. | 97321 | 0.0033% | 0.034%(-0.030)#60 | 0.0082%(-0.005)#658 |
Common Questions
What are the Top 10 Zip Codes with the Highest Percentage of Tlingit-Haida Population in Oregon?
Top 10 Zip Codes with the Highest Percentage of Tlingit-Haida Population in Oregon are:
What zip code has the Highest Percentage of Tlingit-Haida Population in Oregon?
97416 has the Highest Percentage of Tlingit-Haida Population in Oregon with 1.60%.
What is the Percentage of Tlingit-Haida Population in the State of Oregon?
Percentage of Tlingit-Haida Population in Oregon is 0.034%.
What is the Percentage of Tlingit-Haida Population in the United States?
Percentage of Tlingit-Haida Population in the United States is 0.0082%.