Zip Codes with the Highest Percentage of Households Heated by Bottled Gas / Liquid Propane in Oregon
RELATED REPORTS & OPTIONS
Bottled Gas / LP Heating
Oregon
Compare Zip Codes
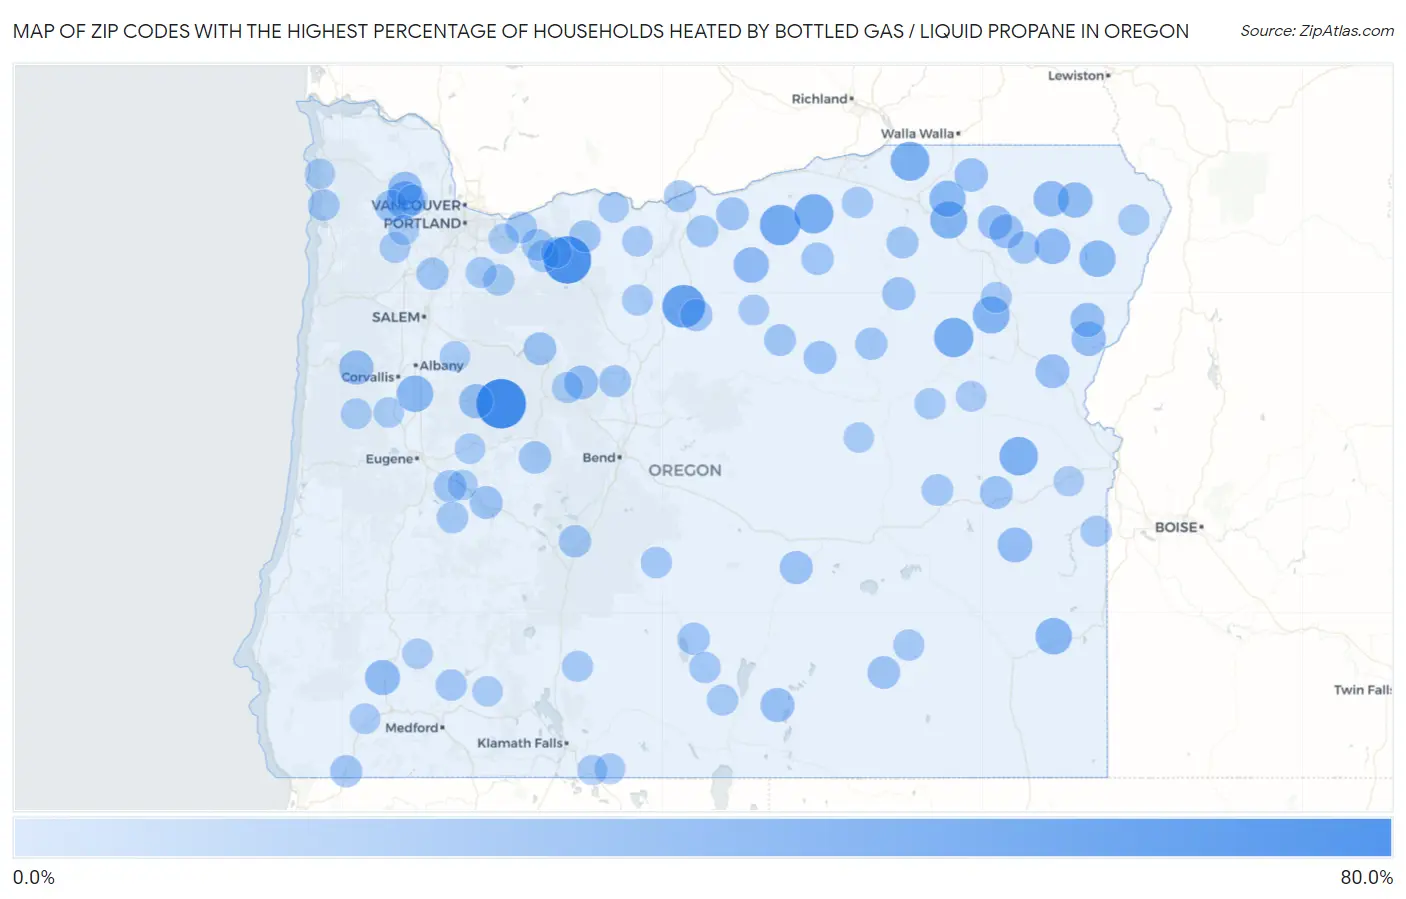
Map of Zip Codes with the Highest Percentage of Households Heated by Bottled Gas / Liquid Propane in Oregon
0.0%
80.0%
Zip Codes with the Highest Percentage of Households Heated by Bottled Gas / Liquid Propane in Oregon
| Zip Code | Bottled Gas / LP Heating | vs State | vs National | |
| 1. | 97329 | 65.8% | 1.9%(+63.9)#1 | 4.9%(+60.9)#980 |
| 2. | 97028 | 58.9% | 1.9%(+57.0)#2 | 4.9%(+54.0)#1,469 |
| 3. | 97057 | 44.4% | 1.9%(+42.5)#3 | 4.9%(+39.5)#2,927 |
| 4. | 97843 | 36.9% | 1.9%(+35.0)#4 | 4.9%(+32.0)#4,087 |
| 5. | 97877 | 34.0% | 1.9%(+32.1)#5 | 4.9%(+29.1)#4,664 |
| 6. | 97839 | 33.9% | 1.9%(+32.0)#6 | 4.9%(+29.0)#4,692 |
| 7. | 97835 | 32.3% | 1.9%(+30.4)#7 | 4.9%(+27.4)#5,060 |
| 8. | 97920 | 31.3% | 1.9%(+29.4)#8 | 4.9%(+26.4)#5,319 |
| 9. | 97125 | 28.1% | 1.9%(+26.2)#9 | 4.9%(+23.2)#6,163 |
| 10. | 97859 | 27.3% | 1.9%(+25.4)#10 | 4.9%(+22.4)#6,421 |
| 11. | 97833 | 26.8% | 1.9%(+24.9)#11 | 4.9%(+21.9)#6,577 |
| 12. | 97377 | 25.0% | 1.9%(+23.1)#12 | 4.9%(+20.1)#7,144 |
| 13. | 97902 | 25.0% | 1.9%(+23.1)#13 | 4.9%(+20.1)#7,161 |
| 14. | 97846 | 24.7% | 1.9%(+22.8)#14 | 4.9%(+19.8)#7,243 |
| 15. | 97810 | 24.1% | 1.9%(+22.2)#15 | 4.9%(+19.2)#7,459 |
| 16. | 97857 | 22.0% | 1.9%(+20.1)#16 | 4.9%(+17.1)#8,206 |
| 17. | 97823 | 21.9% | 1.9%(+20.0)#17 | 4.9%(+17.0)#8,237 |
| 18. | 97885 | 21.6% | 1.9%(+19.7)#18 | 4.9%(+16.7)#8,343 |
| 19. | 97828 | 21.3% | 1.9%(+19.4)#19 | 4.9%(+16.4)#8,446 |
| 20. | 97497 | 20.7% | 1.9%(+18.8)#20 | 4.9%(+15.8)#8,696 |
| 21. | 97906 | 20.0% | 1.9%(+18.1)#21 | 4.9%(+15.1)#8,955 |
| 22. | 97870 | 18.7% | 1.9%(+16.8)#22 | 4.9%(+13.8)#9,493 |
| 23. | 97834 | 18.2% | 1.9%(+16.3)#23 | 4.9%(+13.3)#9,715 |
| 24. | 97326 | 18.2% | 1.9%(+16.3)#24 | 4.9%(+13.3)#9,720 |
| 25. | 97345 | 18.2% | 1.9%(+16.3)#25 | 4.9%(+13.3)#9,727 |
| 26. | 97876 | 17.7% | 1.9%(+15.8)#26 | 4.9%(+12.8)#9,954 |
| 27. | 97841 | 17.6% | 1.9%(+15.7)#27 | 4.9%(+12.7)#9,997 |
| 28. | 97637 | 17.6% | 1.9%(+15.7)#28 | 4.9%(+12.7)#10,001 |
| 29. | 97109 | 17.3% | 1.9%(+15.4)#29 | 4.9%(+12.4)#10,156 |
| 30. | 97905 | 17.0% | 1.9%(+15.1)#30 | 4.9%(+12.1)#10,313 |
| 31. | 97730 | 16.9% | 1.9%(+15.0)#31 | 4.9%(+12.0)#10,367 |
| 32. | 97886 | 16.1% | 1.9%(+14.2)#32 | 4.9%(+11.2)#10,769 |
| 33. | 97880 | 14.8% | 1.9%(+12.9)#33 | 4.9%(+9.90)#11,437 |
| 34. | 97758 | 14.8% | 1.9%(+12.9)#34 | 4.9%(+9.90)#11,443 |
| 35. | 97848 | 14.3% | 1.9%(+12.4)#35 | 4.9%(+9.40)#11,717 |
| 36. | 97911 | 14.3% | 1.9%(+12.4)#36 | 4.9%(+9.40)#11,724 |
| 37. | 97812 | 14.1% | 1.9%(+12.2)#37 | 4.9%(+9.20)#11,829 |
| 38. | 97492 | 14.0% | 1.9%(+12.1)#38 | 4.9%(+9.10)#11,890 |
| 39. | 97117 | 13.6% | 1.9%(+11.7)#39 | 4.9%(+8.70)#12,094 |
| 40. | 97736 | 13.3% | 1.9%(+11.4)#40 | 4.9%(+8.40)#12,273 |
| 41. | 97342 | 13.2% | 1.9%(+11.3)#41 | 4.9%(+8.30)#12,337 |
| 42. | 97413 | 13.0% | 1.9%(+11.1)#42 | 4.9%(+8.10)#12,451 |
| 43. | 97431 | 12.8% | 1.9%(+10.9)#43 | 4.9%(+7.90)#12,552 |
| 44. | 97836 | 12.8% | 1.9%(+10.9)#44 | 4.9%(+7.90)#12,556 |
| 45. | 97640 | 12.5% | 1.9%(+10.6)#45 | 4.9%(+7.60)#12,787 |
| 46. | 97856 | 12.4% | 1.9%(+10.5)#46 | 4.9%(+7.50)#12,851 |
| 47. | 97137 | 12.3% | 1.9%(+10.4)#47 | 4.9%(+7.40)#12,896 |
| 48. | 97737 | 12.3% | 1.9%(+10.4)#48 | 4.9%(+7.40)#12,908 |
| 49. | 97001 | 12.3% | 1.9%(+10.4)#49 | 4.9%(+7.40)#12,911 |
| 50. | 97824 | 12.1% | 1.9%(+10.2)#50 | 4.9%(+7.20)#13,032 |
| 51. | 97534 | 12.0% | 1.9%(+10.1)#51 | 4.9%(+7.10)#13,118 |
| 52. | 97050 | 12.0% | 1.9%(+10.1)#52 | 4.9%(+7.10)#13,128 |
| 53. | 97734 | 11.4% | 1.9%(+9.50)#53 | 4.9%(+6.50)#13,489 |
| 54. | 97868 | 11.1% | 1.9%(+9.20)#54 | 4.9%(+6.20)#13,723 |
| 55. | 97041 | 11.0% | 1.9%(+9.10)#55 | 4.9%(+6.10)#13,780 |
| 56. | 97067 | 11.0% | 1.9%(+9.10)#56 | 4.9%(+6.10)#13,788 |
| 57. | 97011 | 10.9% | 1.9%(+9.00)#57 | 4.9%(+6.00)#13,869 |
| 58. | 97039 | 10.8% | 1.9%(+8.90)#58 | 4.9%(+5.90)#13,934 |
| 59. | 97874 | 10.7% | 1.9%(+8.80)#59 | 4.9%(+5.80)#13,996 |
| 60. | 97019 | 10.5% | 1.9%(+8.60)#60 | 4.9%(+5.60)#14,110 |
| 61. | 97136 | 10.5% | 1.9%(+8.60)#61 | 4.9%(+5.60)#14,117 |
| 62. | 97904 | 10.3% | 1.9%(+8.40)#62 | 4.9%(+5.40)#14,300 |
| 63. | 97434 | 10.1% | 1.9%(+8.20)#63 | 4.9%(+5.20)#14,437 |
| 64. | 97735 | 10.0% | 1.9%(+8.10)#64 | 4.9%(+5.10)#14,520 |
| 65. | 97539 | 9.6% | 1.9%(+7.70)#65 | 4.9%(+4.70)#14,766 |
| 66. | 97636 | 9.6% | 1.9%(+7.70)#66 | 4.9%(+4.70)#14,786 |
| 67. | 97721 | 9.4% | 1.9%(+7.50)#67 | 4.9%(+4.50)#14,915 |
| 68. | 97759 | 9.3% | 1.9%(+7.40)#68 | 4.9%(+4.40)#14,946 |
| 69. | 97630 | 9.3% | 1.9%(+7.40)#69 | 4.9%(+4.40)#14,955 |
| 70. | 97017 | 9.3% | 1.9%(+7.40)#70 | 4.9%(+4.40)#14,967 |
| 71. | 97042 | 9.1% | 1.9%(+7.20)#71 | 4.9%(+4.20)#15,121 |
| 72. | 97049 | 9.1% | 1.9%(+7.20)#72 | 4.9%(+4.20)#15,127 |
| 73. | 97826 | 9.1% | 1.9%(+7.20)#73 | 4.9%(+4.20)#15,140 |
| 74. | 97037 | 8.8% | 1.9%(+6.90)#74 | 4.9%(+3.90)#15,352 |
| 75. | 97901 | 8.8% | 1.9%(+6.90)#75 | 4.9%(+3.90)#15,354 |
| 76. | 97867 | 8.7% | 1.9%(+6.80)#76 | 4.9%(+3.80)#15,435 |
| 77. | 97842 | 8.6% | 1.9%(+6.70)#77 | 4.9%(+3.70)#15,523 |
| 78. | 97624 | 8.5% | 1.9%(+6.60)#78 | 4.9%(+3.60)#15,554 |
| 79. | 97869 | 8.4% | 1.9%(+6.50)#79 | 4.9%(+3.50)#15,662 |
| 80. | 97632 | 8.1% | 1.9%(+6.20)#80 | 4.9%(+3.20)#15,904 |
| 81. | 97884 | 8.1% | 1.9%(+6.20)#81 | 4.9%(+3.20)#15,933 |
| 82. | 97106 | 7.7% | 1.9%(+5.80)#82 | 4.9%(+2.80)#16,192 |
| 83. | 97148 | 7.7% | 1.9%(+5.80)#83 | 4.9%(+2.80)#16,203 |
| 84. | 97021 | 7.7% | 1.9%(+5.80)#84 | 4.9%(+2.80)#16,221 |
| 85. | 97324 | 7.6% | 1.9%(+5.70)#85 | 4.9%(+2.70)#16,305 |
| 86. | 97543 | 7.4% | 1.9%(+5.50)#86 | 4.9%(+2.50)#16,481 |
| 87. | 97830 | 7.3% | 1.9%(+5.40)#87 | 4.9%(+2.40)#16,568 |
| 88. | 97522 | 7.2% | 1.9%(+5.30)#88 | 4.9%(+2.30)#16,640 |
| 89. | 97119 | 7.0% | 1.9%(+5.10)#89 | 4.9%(+2.10)#16,761 |
| 90. | 97374 | 7.0% | 1.9%(+5.10)#90 | 4.9%(+2.10)#16,769 |
| 91. | 97456 | 7.0% | 1.9%(+5.10)#91 | 4.9%(+2.10)#16,774 |
| 92. | 97489 | 7.0% | 1.9%(+5.10)#92 | 4.9%(+2.10)#16,802 |
| 93. | 97040 | 6.7% | 1.9%(+4.80)#93 | 4.9%(+1.80)#17,041 |
| 94. | 97452 | 6.7% | 1.9%(+4.80)#94 | 4.9%(+1.80)#17,042 |
| 95. | 97820 | 6.7% | 1.9%(+4.80)#95 | 4.9%(+1.80)#17,047 |
| 96. | 97009 | 6.6% | 1.9%(+4.70)#96 | 4.9%(+1.70)#17,100 |
| 97. | 97410 | 6.6% | 1.9%(+4.70)#97 | 4.9%(+1.70)#17,149 |
| 98. | 97918 | 6.5% | 1.9%(+4.60)#98 | 4.9%(+1.60)#17,184 |
| 99. | 97633 | 6.5% | 1.9%(+4.60)#99 | 4.9%(+1.60)#17,199 |
| 100. | 97102 | 6.5% | 1.9%(+4.60)#100 | 4.9%(+1.60)#17,218 |
Common Questions
What are the Top 10 Zip Codes with the Highest Percentage of Households Heated by Bottled Gas / Liquid Propane in Oregon?
Top 10 Zip Codes with the Highest Percentage of Households Heated by Bottled Gas / Liquid Propane in Oregon are:
What zip code has the Highest Percentage of Households Heated by Bottled Gas / Liquid Propane in Oregon?
97329 has the Highest Percentage of Households Heated by Bottled Gas / Liquid Propane in Oregon with 65.8%.
What is the Percentage of Households Heated by Bottled Gas / Liquid Propane in the State of Oregon?
Percentage of Households Heated by Bottled Gas / Liquid Propane in Oregon is 1.9%.
What is the Percentage of Households Heated by Bottled Gas / Liquid Propane in the United States?
Percentage of Households Heated by Bottled Gas / Liquid Propane in the United States is 4.9%.