Zip Codes with the Highest Percentage of Population with a Degree in Arts and Humanities in Ohio
RELATED REPORTS & OPTIONS
Arts and Humanities
Ohio
Compare Zip Codes
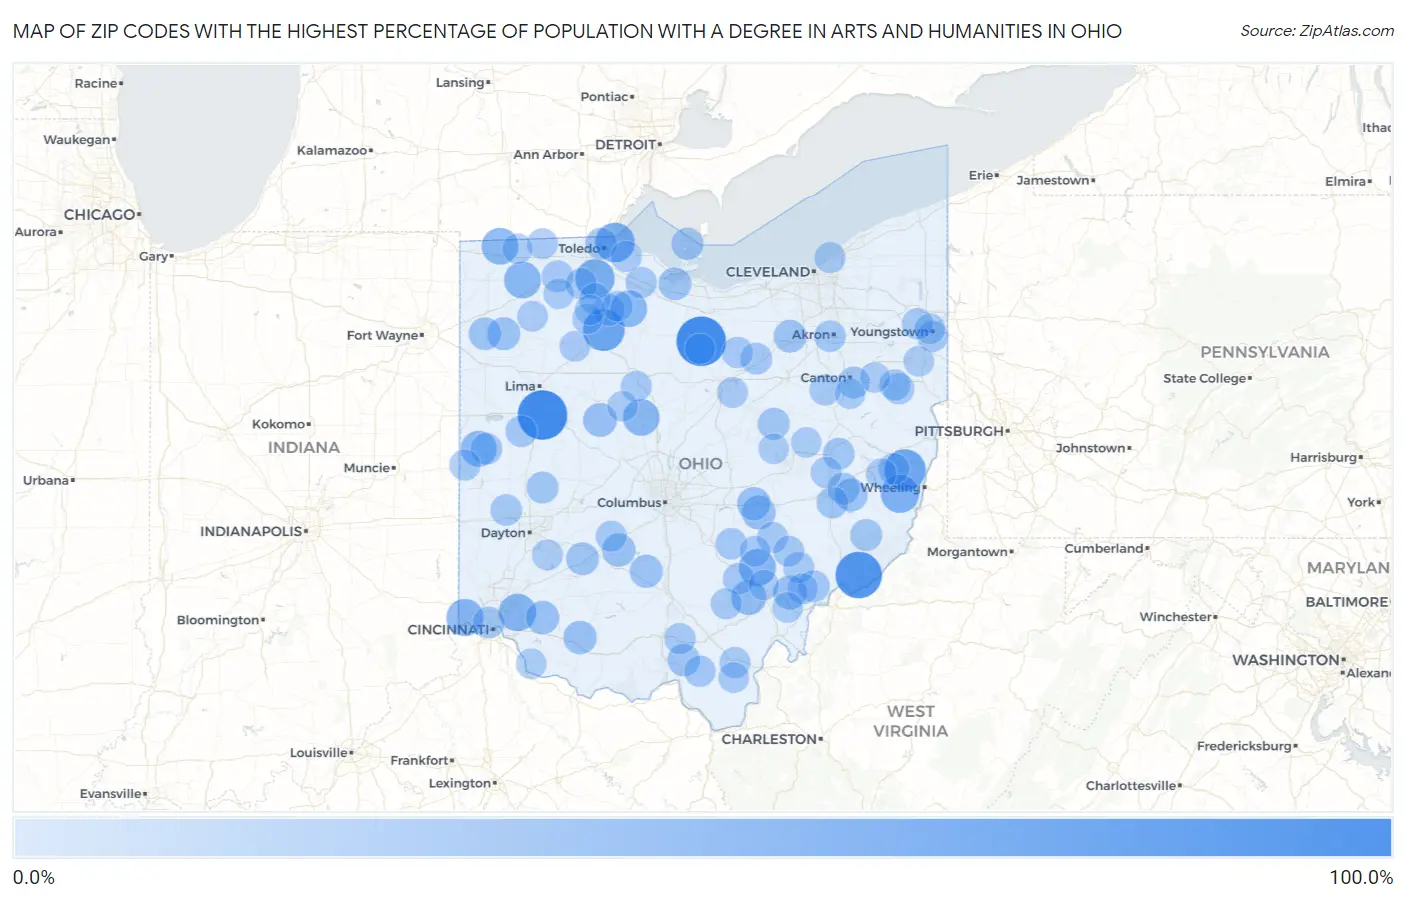
Map of Zip Codes with the Highest Percentage of Population with a Degree in Arts and Humanities in Ohio
0.0%
100.0%
Zip Codes with the Highest Percentage of Population with a Degree in Arts and Humanities in Ohio
| Zip Code | % Graduates | vs State | vs National | |
| 1. | 44850 | 100.0% | 5.8%(+94.2)#1 | 6.0%(+94.0)#35 |
| 2. | 45884 | 100.0% | 5.8%(+94.2)#2 | 6.0%(+94.0)#45 |
| 3. | 45773 | 86.0% | 5.8%(+80.3)#3 | 6.0%(+80.1)#88 |
| 4. | 44804 | 65.4% | 5.8%(+59.7)#4 | 6.0%(+59.4)#140 |
| 5. | 43974 | 63.6% | 5.8%(+57.9)#5 | 6.0%(+57.6)#146 |
| 6. | 43434 | 55.6% | 5.8%(+49.8)#6 | 6.0%(+49.6)#177 |
| 7. | 43414 | 53.6% | 5.8%(+47.8)#7 | 6.0%(+47.6)#185 |
| 8. | 43967 | 50.0% | 5.8%(+44.2)#8 | 6.0%(+44.0)#223 |
| 9. | 45147 | 46.2% | 5.8%(+40.4)#9 | 6.0%(+40.2)#267 |
| 10. | 45033 | 44.4% | 5.8%(+38.7)#10 | 6.0%(+38.4)#280 |
| 11. | 43144 | 43.8% | 5.8%(+38.0)#11 | 6.0%(+37.8)#293 |
| 12. | 43555 | 42.9% | 5.8%(+37.1)#12 | 6.0%(+36.9)#304 |
| 13. | 43501 | 42.3% | 5.8%(+36.5)#13 | 6.0%(+36.3)#310 |
| 14. | 44841 | 42.0% | 5.8%(+36.2)#14 | 6.0%(+36.0)#314 |
| 15. | 43322 | 41.7% | 5.8%(+35.9)#15 | 6.0%(+35.7)#319 |
| 16. | 45348 | 39.5% | 5.8%(+33.7)#16 | 6.0%(+33.5)#358 |
| 17. | 45766 | 35.0% | 5.8%(+29.3)#17 | 6.0%(+29.0)#473 |
| 18. | 45778 | 30.6% | 5.8%(+24.8)#18 | 6.0%(+24.6)#638 |
| 19. | 43760 | 30.3% | 5.8%(+24.6)#19 | 6.0%(+24.3)#644 |
| 20. | 43345 | 29.5% | 5.8%(+23.7)#20 | 6.0%(+23.5)#684 |
| 21. | 45155 | 28.0% | 5.8%(+22.2)#21 | 6.0%(+22.0)#756 |
| 22. | 43106 | 27.9% | 5.8%(+22.1)#22 | 6.0%(+21.9)#764 |
| 23. | 45158 | 27.8% | 5.8%(+22.0)#23 | 6.0%(+21.8)#772 |
| 24. | 43740 | 27.8% | 5.8%(+22.0)#24 | 6.0%(+21.8)#779 |
| 25. | 43115 | 27.0% | 5.8%(+21.2)#25 | 6.0%(+21.0)#823 |
| 26. | 45861 | 26.7% | 5.8%(+20.9)#26 | 6.0%(+20.7)#844 |
| 27. | 43778 | 25.6% | 5.8%(+19.8)#27 | 6.0%(+19.6)#912 |
| 28. | 44215 | 25.3% | 5.8%(+19.6)#28 | 6.0%(+19.3)#930 |
| 29. | 43464 | 25.2% | 5.8%(+19.4)#29 | 6.0%(+19.2)#939 |
| 30. | 45307 | 25.0% | 5.8%(+19.2)#30 | 6.0%(+19.0)#966 |
| 31. | 45855 | 25.0% | 5.8%(+19.2)#31 | 6.0%(+19.0)#976 |
| 32. | 45653 | 24.4% | 5.8%(+18.6)#32 | 6.0%(+18.4)#1,012 |
| 33. | 43446 | 22.7% | 5.8%(+16.9)#33 | 6.0%(+16.7)#1,144 |
| 34. | 43754 | 21.8% | 5.8%(+16.0)#34 | 6.0%(+15.8)#1,257 |
| 35. | 45312 | 21.8% | 5.8%(+16.0)#35 | 6.0%(+15.8)#1,258 |
| 36. | 44637 | 21.5% | 5.8%(+15.7)#36 | 6.0%(+15.5)#1,287 |
| 37. | 44707 | 21.4% | 5.8%(+15.6)#37 | 6.0%(+15.4)#1,305 |
| 38. | 43610 | 21.3% | 5.8%(+15.5)#38 | 6.0%(+15.3)#1,312 |
| 39. | 43755 | 21.2% | 5.8%(+15.4)#39 | 6.0%(+15.2)#1,326 |
| 40. | 45225 | 21.1% | 5.8%(+15.3)#40 | 6.0%(+15.1)#1,340 |
| 41. | 45350 | 21.1% | 5.8%(+15.3)#41 | 6.0%(+15.1)#1,345 |
| 42. | 45784 | 21.0% | 5.8%(+15.2)#42 | 6.0%(+15.0)#1,347 |
| 43. | 43837 | 20.8% | 5.8%(+15.0)#43 | 6.0%(+14.8)#1,377 |
| 44. | 43723 | 20.8% | 5.8%(+15.0)#44 | 6.0%(+14.8)#1,380 |
| 45. | 44866 | 20.7% | 5.8%(+15.0)#45 | 6.0%(+14.7)#1,382 |
| 46. | 43510 | 20.5% | 5.8%(+14.7)#46 | 6.0%(+14.5)#1,418 |
| 47. | 45354 | 20.3% | 5.8%(+14.5)#47 | 6.0%(+14.3)#1,449 |
| 48. | 43158 | 20.0% | 5.8%(+14.2)#48 | 6.0%(+14.0)#1,489 |
| 49. | 43467 | 20.0% | 5.8%(+14.2)#49 | 6.0%(+14.0)#1,502 |
| 50. | 45336 | 20.0% | 5.8%(+14.2)#50 | 6.0%(+14.0)#1,506 |
| 51. | 44307 | 19.8% | 5.8%(+14.0)#51 | 6.0%(+13.8)#1,533 |
| 52. | 43107 | 19.5% | 5.8%(+13.7)#52 | 6.0%(+13.5)#1,570 |
| 53. | 45682 | 19.2% | 5.8%(+13.4)#53 | 6.0%(+13.2)#1,622 |
| 54. | 43565 | 19.0% | 5.8%(+13.3)#54 | 6.0%(+13.1)#1,645 |
| 55. | 43981 | 19.0% | 5.8%(+13.3)#55 | 6.0%(+13.1)#1,648 |
| 56. | 44427 | 19.0% | 5.8%(+13.2)#56 | 6.0%(+13.0)#1,651 |
| 57. | 44874 | 18.9% | 5.8%(+13.1)#57 | 6.0%(+12.9)#1,677 |
| 58. | 44625 | 18.8% | 5.8%(+13.0)#58 | 6.0%(+12.8)#1,687 |
| 59. | 43451 | 18.6% | 5.8%(+12.8)#59 | 6.0%(+12.6)#1,702 |
| 60. | 45613 | 18.4% | 5.8%(+12.7)#60 | 6.0%(+12.4)#1,741 |
| 61. | 43749 | 18.3% | 5.8%(+12.6)#61 | 6.0%(+12.4)#1,766 |
| 62. | 44507 | 18.3% | 5.8%(+12.5)#62 | 6.0%(+12.3)#1,770 |
| 63. | 43442 | 18.3% | 5.8%(+12.5)#63 | 6.0%(+12.3)#1,779 |
| 64. | 44440 | 18.2% | 5.8%(+12.4)#64 | 6.0%(+12.2)#1,793 |
| 65. | 43787 | 18.2% | 5.8%(+12.4)#65 | 6.0%(+12.2)#1,798 |
| 66. | 43151 | 18.2% | 5.8%(+12.4)#66 | 6.0%(+12.2)#1,807 |
| 67. | 45390 | 18.0% | 5.8%(+12.2)#67 | 6.0%(+12.0)#1,844 |
| 68. | 45674 | 17.9% | 5.8%(+12.1)#68 | 6.0%(+11.9)#1,863 |
| 69. | 43731 | 17.8% | 5.8%(+12.0)#69 | 6.0%(+11.8)#1,891 |
| 70. | 43323 | 17.8% | 5.8%(+12.0)#70 | 6.0%(+11.8)#1,893 |
| 71. | 45651 | 17.8% | 5.8%(+12.0)#71 | 6.0%(+11.8)#1,900 |
| 72. | 43758 | 17.5% | 5.8%(+11.7)#72 | 6.0%(+11.5)#1,961 |
| 73. | 44119 | 17.4% | 5.8%(+11.7)#73 | 6.0%(+11.4)#1,980 |
| 74. | 44613 | 17.4% | 5.8%(+11.6)#74 | 6.0%(+11.4)#1,997 |
| 75. | 45724 | 17.2% | 5.8%(+11.4)#75 | 6.0%(+11.2)#2,034 |
| 76. | 43468 | 17.2% | 5.8%(+11.4)#76 | 6.0%(+11.2)#2,040 |
| 77. | 44843 | 16.7% | 5.8%(+10.9)#77 | 6.0%(+10.7)#2,138 |
| 78. | 45370 | 16.7% | 5.8%(+10.9)#78 | 6.0%(+10.7)#2,140 |
| 79. | 44510 | 16.7% | 5.8%(+10.9)#79 | 6.0%(+10.7)#2,145 |
| 80. | 43533 | 16.6% | 5.8%(+10.8)#80 | 6.0%(+10.6)#2,206 |
| 81. | 45658 | 16.5% | 5.8%(+10.7)#81 | 6.0%(+10.5)#2,219 |
| 82. | 43782 | 16.3% | 5.8%(+10.5)#82 | 6.0%(+10.3)#2,258 |
| 83. | 45816 | 16.2% | 5.8%(+10.4)#83 | 6.0%(+10.2)#2,298 |
| 84. | 43548 | 16.1% | 5.8%(+10.3)#84 | 6.0%(+10.1)#2,319 |
| 85. | 43977 | 16.0% | 5.8%(+10.2)#85 | 6.0%(+9.97)#2,359 |
| 86. | 43457 | 15.9% | 5.8%(+10.1)#86 | 6.0%(+9.86)#2,385 |
| 87. | 43534 | 15.7% | 5.8%(+9.96)#87 | 6.0%(+9.75)#2,409 |
| 88. | 45153 | 15.7% | 5.8%(+9.89)#88 | 6.0%(+9.68)#2,432 |
| 89. | 45872 | 15.5% | 5.8%(+9.73)#89 | 6.0%(+9.52)#2,486 |
| 90. | 43332 | 15.4% | 5.8%(+9.66)#90 | 6.0%(+9.45)#2,513 |
| 91. | 45735 | 15.4% | 5.8%(+9.66)#91 | 6.0%(+9.45)#2,516 |
| 92. | 44865 | 15.4% | 5.8%(+9.60)#92 | 6.0%(+9.39)#2,529 |
| 93. | 44490 | 15.3% | 5.8%(+9.49)#93 | 6.0%(+9.28)#2,567 |
| 94. | 43824 | 15.1% | 5.8%(+9.28)#94 | 6.0%(+9.07)#2,647 |
| 95. | 43844 | 15.0% | 5.8%(+9.25)#95 | 6.0%(+9.04)#2,659 |
| 96. | 44669 | 15.0% | 5.8%(+9.17)#96 | 6.0%(+8.96)#2,696 |
| 97. | 45719 | 14.9% | 5.8%(+9.14)#97 | 6.0%(+8.93)#2,708 |
| 98. | 43521 | 14.9% | 5.8%(+9.11)#98 | 6.0%(+8.90)#2,716 |
| 99. | 43413 | 14.9% | 5.8%(+9.11)#99 | 6.0%(+8.90)#2,717 |
| 100. | 44626 | 14.8% | 5.8%(+9.02)#100 | 6.0%(+8.81)#2,756 |
Common Questions
What are the Top 10 Zip Codes with the Highest Percentage of Population with a Degree in Arts and Humanities in Ohio?
Top 10 Zip Codes with the Highest Percentage of Population with a Degree in Arts and Humanities in Ohio are:
What zip code has the Highest Percentage of Population with a Degree in Arts and Humanities in Ohio?
44850 has the Highest Percentage of Population with a Degree in Arts and Humanities in Ohio with 100.0%.
What is the Percentage of Population with a Degree in Arts and Humanities in the State of Ohio?
Percentage of Population with a Degree in Arts and Humanities in Ohio is 5.8%.
What is the Percentage of Population with a Degree in Arts and Humanities in the United States?
Percentage of Population with a Degree in Arts and Humanities in the United States is 6.0%.