Zip Codes with the Highest Percentage of Population with a Degree in Visual and Performing Arts in Ohio
RELATED REPORTS & OPTIONS
Visual and Performing Arts
Ohio
Compare Zip Codes
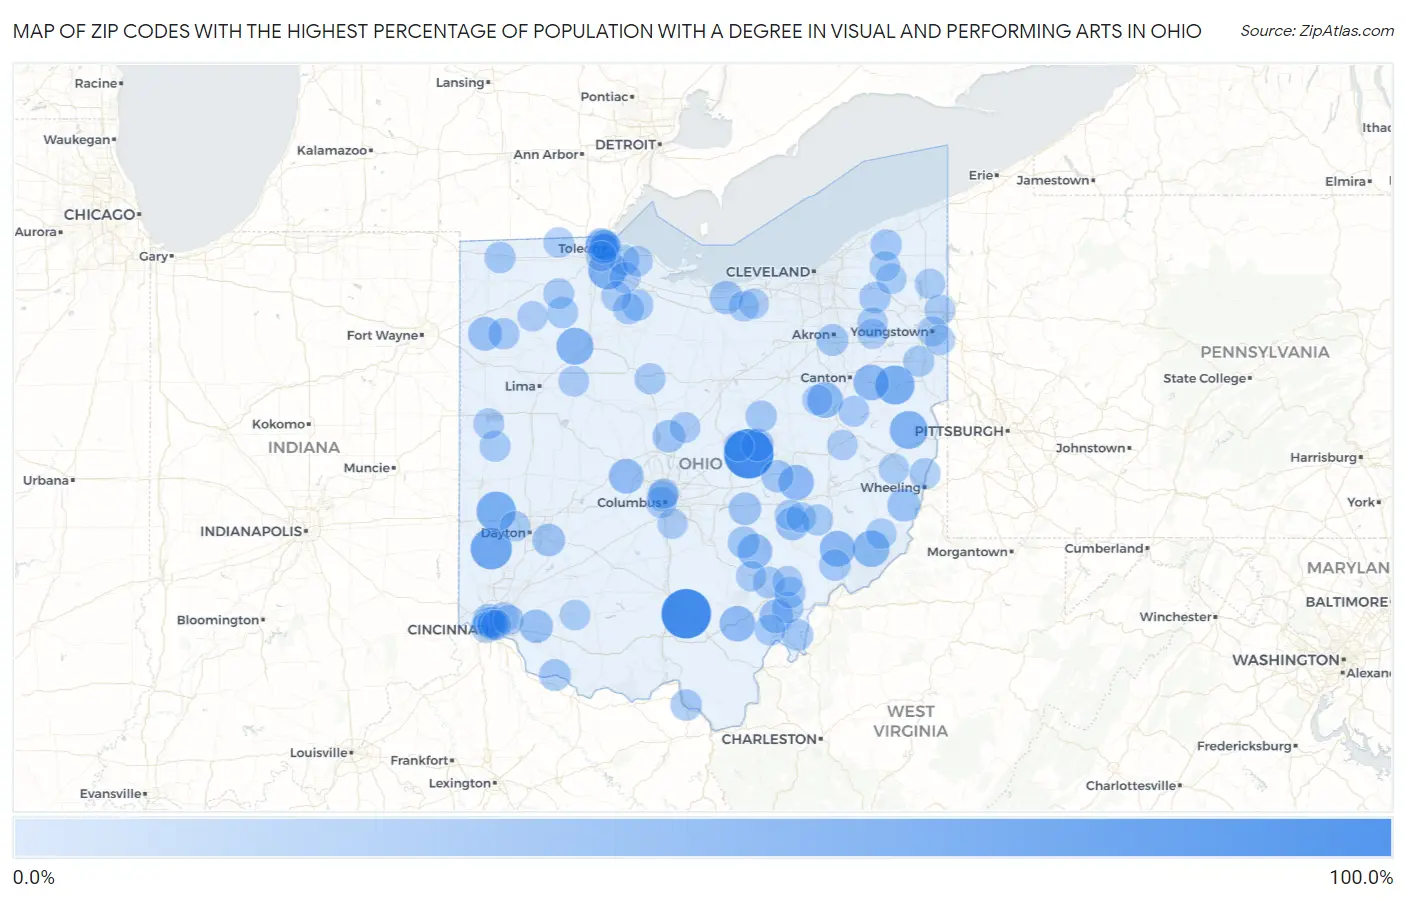
Map of Zip Codes with the Highest Percentage of Population with a Degree in Visual and Performing Arts in Ohio
0.0%
100.0%
Zip Codes with the Highest Percentage of Population with a Degree in Visual and Performing Arts in Ohio
| Zip Code | % Graduates | vs State | vs National | |
| 1. | 43005 | 100.0% | 3.7%(+96.3)#1 | 4.3%(+95.7)#6 |
| 2. | 45673 | 100.0% | 3.7%(+96.3)#2 | 4.3%(+95.7)#7 |
| 3. | 45330 | 60.0% | 3.7%(+56.3)#3 | 4.3%(+55.7)#46 |
| 4. | 45378 | 51.4% | 3.7%(+47.6)#4 | 4.3%(+47.1)#66 |
| 5. | 44625 | 50.0% | 3.7%(+46.3)#5 | 4.3%(+45.7)#70 |
| 6. | 43463 | 47.5% | 3.7%(+43.7)#6 | 4.3%(+43.2)#88 |
| 7. | 43925 | 44.1% | 3.7%(+40.4)#7 | 4.3%(+39.9)#106 |
| 8. | 45816 | 39.7% | 3.7%(+36.0)#8 | 4.3%(+35.5)#121 |
| 9. | 45734 | 37.5% | 3.7%(+33.8)#9 | 4.3%(+33.2)#131 |
| 10. | 44608 | 33.3% | 3.7%(+29.6)#10 | 4.3%(+29.1)#170 |
| 11. | 45727 | 33.3% | 3.7%(+29.6)#11 | 4.3%(+29.1)#171 |
| 12. | 44670 | 33.3% | 3.7%(+29.6)#12 | 4.3%(+29.1)#177 |
| 13. | 45695 | 32.6% | 3.7%(+28.9)#13 | 4.3%(+28.4)#190 |
| 14. | 43802 | 31.5% | 3.7%(+27.8)#14 | 4.3%(+27.3)#206 |
| 15. | 43782 | 28.6% | 3.7%(+24.9)#15 | 4.3%(+24.3)#244 |
| 16. | 43077 | 28.6% | 3.7%(+24.9)#16 | 4.3%(+24.3)#248 |
| 17. | 45855 | 25.0% | 3.7%(+21.3)#17 | 4.3%(+20.7)#319 |
| 18. | 45776 | 24.2% | 3.7%(+20.5)#18 | 4.3%(+20.0)#332 |
| 19. | 43720 | 22.8% | 3.7%(+19.1)#19 | 4.3%(+18.5)#367 |
| 20. | 45160 | 22.6% | 3.7%(+18.9)#20 | 4.3%(+18.4)#374 |
| 21. | 44814 | 21.7% | 3.7%(+18.0)#21 | 4.3%(+17.5)#404 |
| 22. | 43620 | 21.0% | 3.7%(+17.2)#22 | 4.3%(+16.7)#433 |
| 23. | 43933 | 20.7% | 3.7%(+17.0)#23 | 4.3%(+16.5)#443 |
| 24. | 43843 | 19.2% | 3.7%(+15.5)#24 | 4.3%(+15.0)#501 |
| 25. | 43739 | 19.1% | 3.7%(+15.4)#25 | 4.3%(+14.8)#510 |
| 26. | 43003 | 18.9% | 3.7%(+15.2)#26 | 4.3%(+14.7)#523 |
| 27. | 45301 | 18.8% | 3.7%(+15.1)#27 | 4.3%(+14.6)#525 |
| 28. | 43842 | 17.9% | 3.7%(+14.2)#28 | 4.3%(+13.7)#581 |
| 29. | 45223 | 17.1% | 3.7%(+13.4)#29 | 4.3%(+12.8)#632 |
| 30. | 43748 | 16.0% | 3.7%(+12.3)#30 | 4.3%(+11.7)#715 |
| 31. | 45131 | 15.4% | 3.7%(+11.7)#31 | 4.3%(+11.1)#771 |
| 32. | 44301 | 15.1% | 3.7%(+11.4)#32 | 4.3%(+10.9)#796 |
| 33. | 45743 | 14.5% | 3.7%(+10.7)#33 | 4.3%(+10.2)#885 |
| 34. | 45761 | 14.3% | 3.7%(+10.6)#34 | 4.3%(+10.0)#907 |
| 35. | 43407 | 14.3% | 3.7%(+10.6)#35 | 4.3%(+10.0)#912 |
| 36. | 45744 | 14.2% | 3.7%(+10.5)#36 | 4.3%(+9.97)#928 |
| 37. | 45735 | 14.1% | 3.7%(+10.4)#37 | 4.3%(+9.88)#938 |
| 38. | 45636 | 13.9% | 3.7%(+10.2)#38 | 4.3%(+9.64)#970 |
| 39. | 44234 | 13.8% | 3.7%(+10.1)#39 | 4.3%(+9.57)#976 |
| 40. | 44628 | 13.4% | 3.7%(+9.70)#40 | 4.3%(+9.16)#1,031 |
| 41. | 45861 | 13.3% | 3.7%(+9.62)#41 | 4.3%(+9.08)#1,043 |
| 42. | 43570 | 13.3% | 3.7%(+9.54)#42 | 4.3%(+9.00)#1,059 |
| 43. | 44086 | 13.1% | 3.7%(+9.41)#43 | 4.3%(+8.87)#1,083 |
| 44. | 43516 | 13.0% | 3.7%(+9.29)#44 | 4.3%(+8.75)#1,106 |
| 45. | 45778 | 13.0% | 3.7%(+9.25)#45 | 4.3%(+8.71)#1,109 |
| 46. | 44490 | 12.5% | 3.7%(+8.79)#46 | 4.3%(+8.25)#1,189 |
| 47. | 43408 | 12.5% | 3.7%(+8.79)#47 | 4.3%(+8.25)#1,193 |
| 48. | 43732 | 12.3% | 3.7%(+8.57)#48 | 4.3%(+8.03)#1,233 |
| 49. | 43610 | 12.2% | 3.7%(+8.53)#49 | 4.3%(+7.99)#1,243 |
| 50. | 43971 | 12.2% | 3.7%(+8.48)#50 | 4.3%(+7.94)#1,250 |
| 51. | 45225 | 12.1% | 3.7%(+8.38)#51 | 4.3%(+7.84)#1,269 |
| 52. | 44841 | 12.0% | 3.7%(+8.29)#52 | 4.3%(+7.75)#1,287 |
| 53. | 44849 | 11.9% | 3.7%(+8.18)#53 | 4.3%(+7.64)#1,307 |
| 54. | 45769 | 11.7% | 3.7%(+8.03)#54 | 4.3%(+7.49)#1,338 |
| 55. | 45220 | 11.5% | 3.7%(+7.81)#55 | 4.3%(+7.27)#1,395 |
| 56. | 45351 | 11.4% | 3.7%(+7.72)#56 | 4.3%(+7.18)#1,410 |
| 57. | 45205 | 11.3% | 3.7%(+7.54)#57 | 4.3%(+7.00)#1,453 |
| 58. | 43222 | 11.2% | 3.7%(+7.48)#58 | 4.3%(+6.94)#1,470 |
| 59. | 45866 | 11.1% | 3.7%(+7.40)#59 | 4.3%(+6.86)#1,509 |
| 60. | 43534 | 11.0% | 3.7%(+7.31)#60 | 4.3%(+6.77)#1,521 |
| 61. | 44656 | 11.0% | 3.7%(+7.28)#61 | 4.3%(+6.73)#1,534 |
| 62. | 43321 | 10.8% | 3.7%(+7.10)#62 | 4.3%(+6.56)#1,584 |
| 63. | 43469 | 10.7% | 3.7%(+7.00)#63 | 4.3%(+6.46)#1,619 |
| 64. | 43210 | 10.4% | 3.7%(+6.66)#64 | 4.3%(+6.12)#1,715 |
| 65. | 45810 | 10.1% | 3.7%(+6.36)#65 | 4.3%(+5.82)#1,798 |
| 66. | 43432 | 10.0% | 3.7%(+6.29)#66 | 4.3%(+5.75)#1,829 |
| 67. | 43605 | 10.0% | 3.7%(+6.25)#67 | 4.3%(+5.70)#1,855 |
| 68. | 43604 | 9.9% | 3.7%(+6.19)#68 | 4.3%(+5.64)#1,876 |
| 69. | 45213 | 9.7% | 3.7%(+5.96)#69 | 4.3%(+5.42)#1,955 |
| 70. | 44266 | 9.7% | 3.7%(+5.95)#70 | 4.3%(+5.41)#1,959 |
| 71. | 44062 | 9.6% | 3.7%(+5.90)#71 | 4.3%(+5.36)#1,977 |
| 72. | 43793 | 9.6% | 3.7%(+5.88)#72 | 4.3%(+5.34)#1,993 |
| 73. | 44403 | 9.6% | 3.7%(+5.84)#73 | 4.3%(+5.30)#2,005 |
| 74. | 43981 | 9.5% | 3.7%(+5.81)#74 | 4.3%(+5.27)#2,016 |
| 75. | 44049 | 9.5% | 3.7%(+5.81)#75 | 4.3%(+5.27)#2,017 |
| 76. | 45764 | 9.5% | 3.7%(+5.78)#76 | 4.3%(+5.24)#2,027 |
| 77. | 44046 | 9.4% | 3.7%(+5.71)#77 | 4.3%(+5.17)#2,057 |
| 78. | 45426 | 9.4% | 3.7%(+5.69)#78 | 4.3%(+5.15)#2,062 |
| 79. | 45142 | 9.3% | 3.7%(+5.56)#79 | 4.3%(+5.02)#2,127 |
| 80. | 43406 | 9.3% | 3.7%(+5.55)#80 | 4.3%(+5.01)#2,135 |
| 81. | 43540 | 9.2% | 3.7%(+5.54)#81 | 4.3%(+4.99)#2,146 |
| 82. | 45219 | 9.2% | 3.7%(+5.46)#82 | 4.3%(+4.92)#2,182 |
| 83. | 44272 | 9.2% | 3.7%(+5.45)#83 | 4.3%(+4.91)#2,187 |
| 84. | 45711 | 9.1% | 3.7%(+5.43)#84 | 4.3%(+4.88)#2,192 |
| 85. | 44074 | 9.1% | 3.7%(+5.42)#85 | 4.3%(+4.88)#2,196 |
| 86. | 43734 | 9.1% | 3.7%(+5.40)#86 | 4.3%(+4.86)#2,202 |
| 87. | 44689 | 9.1% | 3.7%(+5.38)#87 | 4.3%(+4.84)#2,223 |
| 88. | 44417 | 9.0% | 3.7%(+5.32)#88 | 4.3%(+4.78)#2,249 |
| 89. | 43217 | 9.0% | 3.7%(+5.29)#89 | 4.3%(+4.75)#2,264 |
| 90. | 44503 | 9.0% | 3.7%(+5.26)#90 | 4.3%(+4.72)#2,271 |
| 91. | 43022 | 8.9% | 3.7%(+5.21)#91 | 4.3%(+4.67)#2,296 |
| 92. | 44629 | 8.9% | 3.7%(+5.18)#92 | 4.3%(+4.64)#2,309 |
| 93. | 43608 | 8.9% | 3.7%(+5.15)#93 | 4.3%(+4.61)#2,325 |
| 94. | 44471 | 8.8% | 3.7%(+5.13)#94 | 4.3%(+4.59)#2,333 |
| 95. | 45227 | 8.8% | 3.7%(+5.09)#95 | 4.3%(+4.55)#2,356 |
| 96. | 43548 | 8.7% | 3.7%(+5.01)#96 | 4.3%(+4.47)#2,403 |
| 97. | 43727 | 8.7% | 3.7%(+4.98)#97 | 4.3%(+4.44)#2,420 |
| 98. | 43202 | 8.7% | 3.7%(+4.97)#98 | 4.3%(+4.43)#2,433 |
| 99. | 43460 | 8.6% | 3.7%(+4.93)#99 | 4.3%(+4.39)#2,458 |
| 100. | 45206 | 8.5% | 3.7%(+4.83)#100 | 4.3%(+4.29)#2,503 |
Common Questions
What are the Top 10 Zip Codes with the Highest Percentage of Population with a Degree in Visual and Performing Arts in Ohio?
Top 10 Zip Codes with the Highest Percentage of Population with a Degree in Visual and Performing Arts in Ohio are:
What zip code has the Highest Percentage of Population with a Degree in Visual and Performing Arts in Ohio?
43005 has the Highest Percentage of Population with a Degree in Visual and Performing Arts in Ohio with 100.0%.
What is the Percentage of Population with a Degree in Visual and Performing Arts in the State of Ohio?
Percentage of Population with a Degree in Visual and Performing Arts in Ohio is 3.7%.
What is the Percentage of Population with a Degree in Visual and Performing Arts in the United States?
Percentage of Population with a Degree in Visual and Performing Arts in the United States is 4.3%.