Zip Codes with the Highest Percentage of Population Employed in Community & Social Service in Ohio
RELATED REPORTS & OPTIONS
Community & Social Service
Ohio
Compare Zip Codes
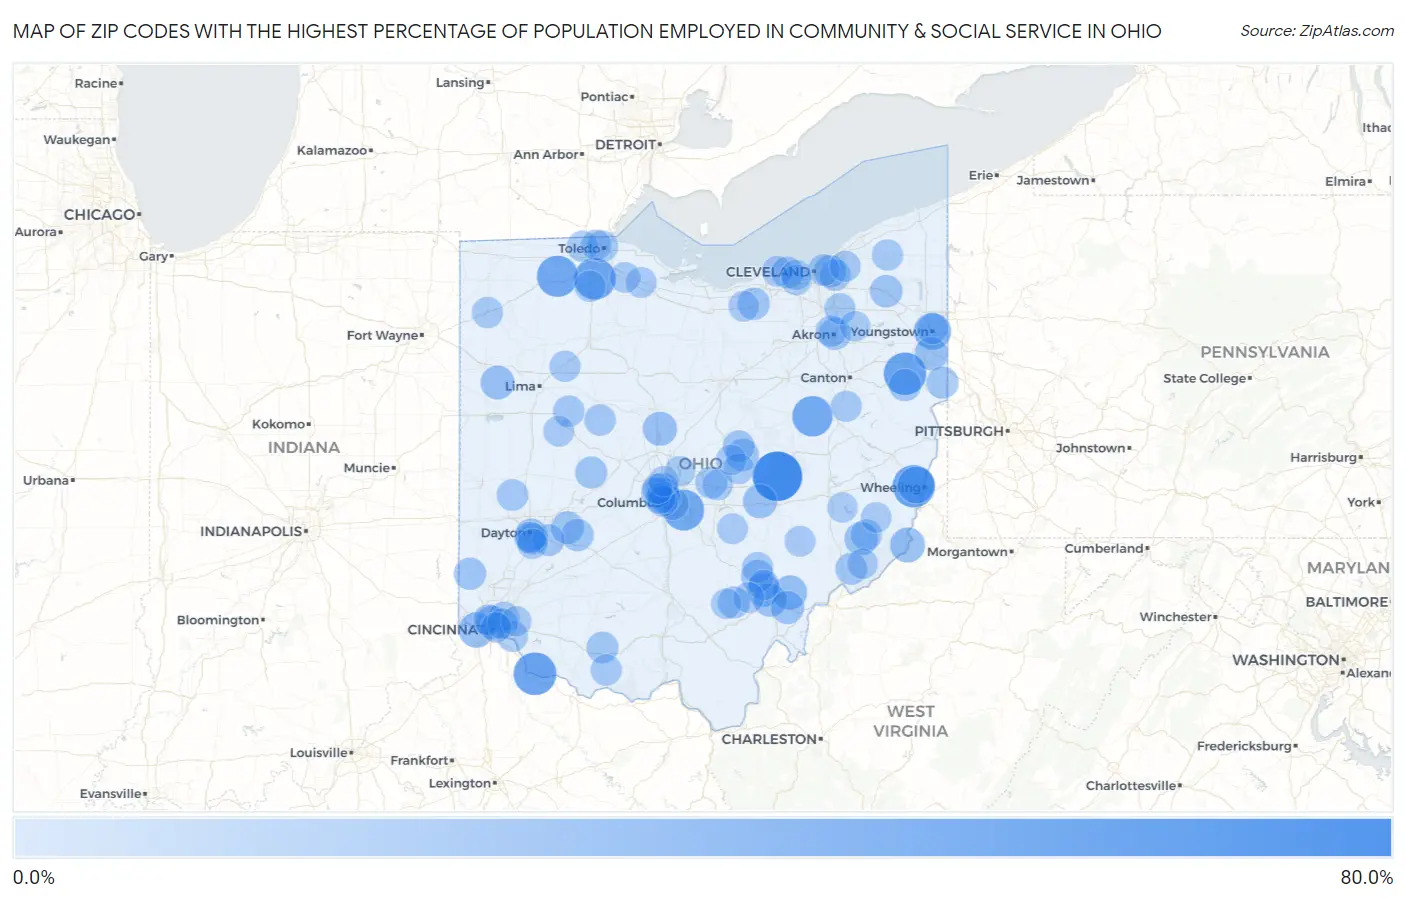
Map of Zip Codes with the Highest Percentage of Population Employed in Community & Social Service in Ohio
0.0%
80.0%
Zip Codes with the Highest Percentage of Population Employed in Community & Social Service in Ohio
| Zip Code | % Employed | vs State | vs National | |
| 1. | 43842 | 69.6% | 10.0%(+59.7)#1 | 11.2%(+58.4)#57 |
| 2. | 45112 | 50.0% | 10.0%(+40.0)#2 | 11.2%(+38.8)#169 |
| 3. | 44493 | 49.2% | 10.0%(+39.3)#3 | 11.2%(+38.0)#174 |
| 4. | 43909 | 49.0% | 10.0%(+39.0)#4 | 11.2%(+37.8)#176 |
| 5. | 43414 | 47.1% | 10.0%(+37.2)#5 | 11.2%(+35.9)#192 |
| 6. | 43510 | 45.5% | 10.0%(+35.5)#6 | 11.2%(+34.2)#215 |
| 7. | 43109 | 44.7% | 10.0%(+34.8)#7 | 11.2%(+33.5)#227 |
| 8. | 44687 | 43.1% | 10.0%(+33.2)#8 | 11.2%(+31.9)#245 |
| 9. | 44555 | 34.0% | 10.0%(+24.1)#9 | 11.2%(+22.8)#415 |
| 10. | 43934 | 33.3% | 10.0%(+23.4)#10 | 11.2%(+22.1)#442 |
| 11. | 45051 | 28.9% | 10.0%(+19.0)#11 | 11.2%(+17.7)#639 |
| 12. | 43931 | 27.9% | 10.0%(+17.9)#12 | 11.2%(+16.7)#700 |
| 13. | 45778 | 26.1% | 10.0%(+16.2)#13 | 11.2%(+14.9)#854 |
| 14. | 43356 | 25.4% | 10.0%(+15.4)#14 | 11.2%(+14.2)#929 |
| 15. | 43746 | 25.3% | 10.0%(+15.3)#15 | 11.2%(+14.0)#938 |
| 16. | 45220 | 25.0% | 10.0%(+15.0)#16 | 11.2%(+13.8)#970 |
| 17. | 45894 | 24.9% | 10.0%(+14.9)#17 | 11.2%(+13.7)#992 |
| 18. | 44452 | 23.9% | 10.0%(+13.9)#18 | 11.2%(+12.7)#1,122 |
| 19. | 43786 | 23.8% | 10.0%(+13.9)#19 | 11.2%(+12.6)#1,141 |
| 20. | 45780 | 23.6% | 10.0%(+13.7)#20 | 11.2%(+12.4)#1,165 |
| 21. | 45701 | 23.6% | 10.0%(+13.6)#21 | 11.2%(+12.4)#1,174 |
| 22. | 45735 | 22.8% | 10.0%(+12.8)#22 | 11.2%(+11.6)#1,311 |
| 23. | 45716 | 22.1% | 10.0%(+12.1)#23 | 11.2%(+10.9)#1,461 |
| 24. | 45469 | 22.0% | 10.0%(+12.1)#24 | 11.2%(+10.8)#1,476 |
| 25. | 43037 | 21.5% | 10.0%(+11.6)#25 | 11.2%(+10.3)#1,591 |
| 26. | 45387 | 21.5% | 10.0%(+11.5)#26 | 11.2%(+10.3)#1,594 |
| 27. | 44080 | 21.2% | 10.0%(+11.3)#27 | 11.2%(+10.0)#1,648 |
| 28. | 43209 | 21.2% | 10.0%(+11.3)#28 | 11.2%(+9.99)#1,660 |
| 29. | 45314 | 21.0% | 10.0%(+11.1)#29 | 11.2%(+9.81)#1,711 |
| 30. | 44118 | 20.7% | 10.0%(+10.8)#30 | 11.2%(+9.52)#1,800 |
| 31. | 45056 | 20.7% | 10.0%(+10.8)#31 | 11.2%(+9.51)#1,804 |
| 32. | 44074 | 20.5% | 10.0%(+10.6)#32 | 11.2%(+9.33)#1,852 |
| 33. | 44423 | 20.5% | 10.0%(+10.6)#33 | 11.2%(+9.31)#1,853 |
| 34. | 43214 | 20.5% | 10.0%(+10.5)#34 | 11.2%(+9.27)#1,874 |
| 35. | 44304 | 20.4% | 10.0%(+10.5)#35 | 11.2%(+9.23)#1,893 |
| 36. | 43009 | 20.3% | 10.0%(+10.4)#36 | 11.2%(+9.10)#1,928 |
| 37. | 44441 | 20.0% | 10.0%(+10.0)#37 | 11.2%(+8.74)#2,036 |
| 38. | 43001 | 19.6% | 10.0%(+9.69)#38 | 11.2%(+8.43)#2,146 |
| 39. | 45698 | 19.6% | 10.0%(+9.64)#39 | 11.2%(+8.39)#2,162 |
| 40. | 45788 | 19.6% | 10.0%(+9.62)#40 | 11.2%(+8.37)#2,167 |
| 41. | 43202 | 19.6% | 10.0%(+9.62)#41 | 11.2%(+8.36)#2,171 |
| 42. | 43022 | 19.5% | 10.0%(+9.51)#42 | 11.2%(+8.25)#2,211 |
| 43. | 45679 | 19.3% | 10.0%(+9.35)#43 | 11.2%(+8.09)#2,268 |
| 44. | 44140 | 19.2% | 10.0%(+9.22)#44 | 11.2%(+7.96)#2,321 |
| 45. | 45301 | 19.1% | 10.0%(+9.19)#45 | 11.2%(+7.93)#2,333 |
| 46. | 44122 | 18.8% | 10.0%(+8.89)#46 | 11.2%(+7.63)#2,453 |
| 47. | 45339 | 18.8% | 10.0%(+8.83)#47 | 11.2%(+7.57)#2,474 |
| 48. | 44106 | 18.7% | 10.0%(+8.73)#48 | 11.2%(+7.47)#2,515 |
| 49. | 43346 | 18.6% | 10.0%(+8.69)#49 | 11.2%(+7.43)#2,535 |
| 50. | 43345 | 18.4% | 10.0%(+8.43)#50 | 11.2%(+7.17)#2,643 |
| 51. | 45419 | 18.3% | 10.0%(+8.38)#51 | 11.2%(+7.12)#2,657 |
| 52. | 43754 | 18.3% | 10.0%(+8.33)#52 | 11.2%(+7.07)#2,678 |
| 53. | 45409 | 18.3% | 10.0%(+8.32)#53 | 11.2%(+7.06)#2,684 |
| 54. | 43201 | 18.2% | 10.0%(+8.19)#54 | 11.2%(+6.94)#2,745 |
| 55. | 45693 | 17.8% | 10.0%(+7.81)#55 | 11.2%(+6.55)#2,938 |
| 56. | 43402 | 17.7% | 10.0%(+7.79)#56 | 11.2%(+6.53)#2,948 |
| 57. | 44303 | 17.7% | 10.0%(+7.77)#57 | 11.2%(+6.51)#2,956 |
| 58. | 44064 | 17.7% | 10.0%(+7.75)#58 | 11.2%(+6.49)#2,970 |
| 59. | 45213 | 17.6% | 10.0%(+7.65)#59 | 11.2%(+6.39)#3,019 |
| 60. | 45821 | 17.6% | 10.0%(+7.62)#60 | 11.2%(+6.36)#3,033 |
| 61. | 43620 | 17.4% | 10.0%(+7.49)#61 | 11.2%(+6.23)#3,085 |
| 62. | 44697 | 17.4% | 10.0%(+7.48)#62 | 11.2%(+6.22)#3,093 |
| 63. | 43617 | 17.3% | 10.0%(+7.38)#63 | 11.2%(+6.13)#3,163 |
| 64. | 44236 | 17.3% | 10.0%(+7.34)#64 | 11.2%(+6.09)#3,186 |
| 65. | 44040 | 17.3% | 10.0%(+7.32)#65 | 11.2%(+6.06)#3,203 |
| 66. | 45223 | 17.2% | 10.0%(+7.27)#66 | 11.2%(+6.02)#3,231 |
| 67. | 45817 | 17.2% | 10.0%(+7.22)#67 | 11.2%(+5.96)#3,266 |
| 68. | 45255 | 17.1% | 10.0%(+7.15)#68 | 11.2%(+5.89)#3,314 |
| 69. | 43144 | 17.1% | 10.0%(+7.13)#69 | 11.2%(+5.87)#3,323 |
| 70. | 44504 | 17.1% | 10.0%(+7.10)#70 | 11.2%(+5.84)#3,338 |
| 71. | 43333 | 16.9% | 10.0%(+6.92)#71 | 11.2%(+5.66)#3,466 |
| 72. | 43221 | 16.8% | 10.0%(+6.85)#72 | 11.2%(+5.59)#3,512 |
| 73. | 43150 | 16.8% | 10.0%(+6.84)#73 | 11.2%(+5.58)#3,517 |
| 74. | 43023 | 16.7% | 10.0%(+6.69)#74 | 11.2%(+5.44)#3,617 |
| 75. | 43442 | 16.5% | 10.0%(+6.58)#75 | 11.2%(+5.32)#3,672 |
| 76. | 43756 | 16.5% | 10.0%(+6.55)#76 | 11.2%(+5.29)#3,694 |
| 77. | 43071 | 16.5% | 10.0%(+6.53)#77 | 11.2%(+5.27)#3,701 |
| 78. | 43469 | 16.4% | 10.0%(+6.44)#78 | 11.2%(+5.18)#3,766 |
| 79. | 44049 | 16.3% | 10.0%(+6.32)#79 | 11.2%(+5.06)#3,854 |
| 80. | 45719 | 16.3% | 10.0%(+6.32)#80 | 11.2%(+5.06)#3,860 |
| 81. | 43215 | 16.2% | 10.0%(+6.26)#81 | 11.2%(+5.00)#3,894 |
| 82. | 45208 | 16.2% | 10.0%(+6.24)#82 | 11.2%(+4.98)#3,923 |
| 83. | 45789 | 16.2% | 10.0%(+6.22)#83 | 11.2%(+4.96)#3,934 |
| 84. | 43606 | 16.2% | 10.0%(+6.22)#84 | 11.2%(+4.96)#3,936 |
| 85. | 44012 | 16.1% | 10.0%(+6.17)#85 | 11.2%(+4.92)#3,969 |
| 86. | 45766 | 16.1% | 10.0%(+6.17)#86 | 11.2%(+4.91)#3,972 |
| 87. | 43080 | 15.9% | 10.0%(+5.98)#87 | 11.2%(+4.72)#4,116 |
| 88. | 43747 | 15.9% | 10.0%(+5.98)#88 | 11.2%(+4.72)#4,119 |
| 89. | 45651 | 15.8% | 10.0%(+5.88)#89 | 11.2%(+4.62)#4,204 |
| 90. | 44126 | 15.8% | 10.0%(+5.86)#90 | 11.2%(+4.61)#4,219 |
| 91. | 43082 | 15.8% | 10.0%(+5.83)#91 | 11.2%(+4.57)#4,262 |
| 92. | 45174 | 15.6% | 10.0%(+5.69)#92 | 11.2%(+4.43)#4,383 |
| 93. | 44240 | 15.6% | 10.0%(+5.68)#93 | 11.2%(+4.42)#4,391 |
| 94. | 44116 | 15.6% | 10.0%(+5.65)#94 | 11.2%(+4.39)#4,411 |
| 95. | 43212 | 15.6% | 10.0%(+5.64)#95 | 11.2%(+4.38)#4,415 |
| 96. | 43085 | 15.6% | 10.0%(+5.61)#96 | 11.2%(+4.35)#4,434 |
| 97. | 45202 | 15.5% | 10.0%(+5.59)#97 | 11.2%(+4.33)#4,454 |
| 98. | 43220 | 15.5% | 10.0%(+5.55)#98 | 11.2%(+4.29)#4,497 |
| 99. | 45429 | 15.4% | 10.0%(+5.41)#99 | 11.2%(+4.15)#4,647 |
| 100. | 43780 | 15.3% | 10.0%(+5.32)#100 | 11.2%(+4.06)#4,734 |
Common Questions
What are the Top 10 Zip Codes with the Highest Percentage of Population Employed in Community & Social Service in Ohio?
Top 10 Zip Codes with the Highest Percentage of Population Employed in Community & Social Service in Ohio are:
What zip code has the Highest Percentage of Population Employed in Community & Social Service in Ohio?
43842 has the Highest Percentage of Population Employed in Community & Social Service in Ohio with 69.6%.
What is the Percentage of Population Employed in Community & Social Service in the State of Ohio?
Percentage of Population Employed in Community & Social Service in Ohio is 10.0%.
What is the Percentage of Population Employed in Community & Social Service in the United States?
Percentage of Population Employed in Community & Social Service in the United States is 11.2%.