Zip Codes with the Highest Percentage of Population Employed in Education Instruction & Library in Ohio
RELATED REPORTS & OPTIONS
Education Instruction & Library
Ohio
Compare Zip Codes
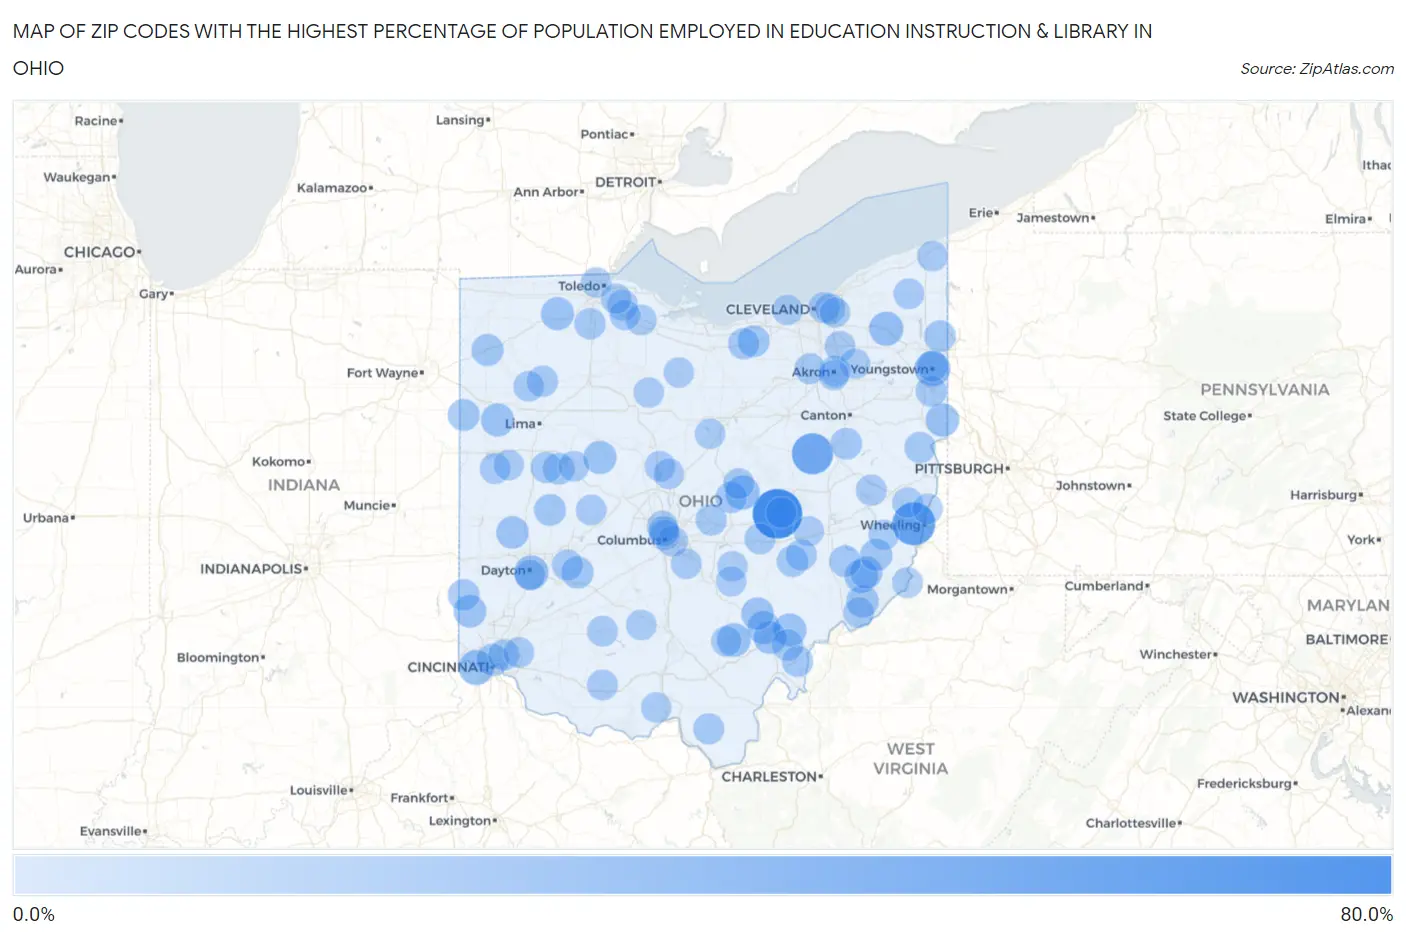
Map of Zip Codes with the Highest Percentage of Population Employed in Education Instruction & Library in Ohio
0.0%
80.0%
Zip Codes with the Highest Percentage of Population Employed in Education Instruction & Library in Ohio
| Zip Code | % Employed | vs State | vs National | |
| 1. | 43842 | 69.6% | 5.7%(+64.0)#1 | 6.2%(+63.4)#29 |
| 2. | 43909 | 49.0% | 5.7%(+43.3)#2 | 6.2%(+42.8)#80 |
| 3. | 44687 | 43.1% | 5.7%(+37.5)#3 | 6.2%(+37.0)#112 |
| 4. | 44555 | 25.8% | 5.7%(+20.1)#4 | 6.2%(+19.6)#346 |
| 5. | 45051 | 24.2% | 5.7%(+18.6)#5 | 6.2%(+18.0)#401 |
| 6. | 45469 | 22.0% | 5.7%(+16.4)#6 | 6.2%(+15.9)#512 |
| 7. | 43037 | 21.5% | 5.7%(+15.9)#7 | 6.2%(+15.3)#537 |
| 8. | 44080 | 21.2% | 5.7%(+15.6)#8 | 6.2%(+15.1)#558 |
| 9. | 45698 | 19.6% | 5.7%(+13.9)#9 | 6.2%(+13.4)#680 |
| 10. | 43786 | 19.0% | 5.7%(+13.4)#10 | 6.2%(+12.9)#733 |
| 11. | 44441 | 18.9% | 5.7%(+13.2)#11 | 6.2%(+12.7)#754 |
| 12. | 43345 | 18.2% | 5.7%(+12.5)#12 | 6.2%(+12.0)#814 |
| 13. | 45894 | 18.2% | 5.7%(+12.5)#13 | 6.2%(+12.0)#815 |
| 14. | 43510 | 18.2% | 5.7%(+12.5)#14 | 6.2%(+12.0)#817 |
| 15. | 45778 | 17.9% | 5.7%(+12.2)#15 | 6.2%(+11.7)#848 |
| 16. | 45780 | 17.8% | 5.7%(+12.1)#16 | 6.2%(+11.6)#864 |
| 17. | 45701 | 17.8% | 5.7%(+12.1)#17 | 6.2%(+11.6)#868 |
| 18. | 45056 | 16.8% | 5.7%(+11.2)#18 | 6.2%(+10.6)#976 |
| 19. | 45716 | 16.6% | 5.7%(+10.9)#19 | 6.2%(+10.4)#1,018 |
| 20. | 45339 | 16.4% | 5.7%(+10.7)#20 | 6.2%(+10.2)#1,046 |
| 21. | 45789 | 16.2% | 5.7%(+10.5)#21 | 6.2%(+9.99)#1,071 |
| 22. | 45220 | 16.1% | 5.7%(+10.4)#22 | 6.2%(+9.89)#1,089 |
| 23. | 43754 | 16.0% | 5.7%(+10.3)#23 | 6.2%(+9.78)#1,102 |
| 24. | 43747 | 15.7% | 5.7%(+10.1)#24 | 6.2%(+9.54)#1,147 |
| 25. | 45314 | 15.3% | 5.7%(+9.61)#25 | 6.2%(+9.07)#1,238 |
| 26. | 45821 | 15.0% | 5.7%(+9.34)#26 | 6.2%(+8.80)#1,284 |
| 27. | 45899 | 14.6% | 5.7%(+8.95)#27 | 6.2%(+8.42)#1,362 |
| 28. | 45317 | 14.2% | 5.7%(+8.54)#28 | 6.2%(+8.00)#1,487 |
| 29. | 44074 | 14.1% | 5.7%(+8.46)#29 | 6.2%(+7.92)#1,512 |
| 30. | 44424 | 14.0% | 5.7%(+8.35)#30 | 6.2%(+7.82)#1,539 |
| 31. | 43333 | 13.9% | 5.7%(+8.20)#31 | 6.2%(+7.67)#1,585 |
| 32. | 45003 | 13.9% | 5.7%(+8.20)#32 | 6.2%(+7.67)#1,586 |
| 33. | 44697 | 13.8% | 5.7%(+8.11)#33 | 6.2%(+7.58)#1,627 |
| 34. | 45735 | 13.3% | 5.7%(+7.62)#34 | 6.2%(+7.09)#1,793 |
| 35. | 43720 | 13.2% | 5.7%(+7.58)#35 | 6.2%(+7.05)#1,809 |
| 36. | 43779 | 13.1% | 5.7%(+7.47)#36 | 6.2%(+6.94)#1,855 |
| 37. | 43080 | 13.0% | 5.7%(+7.31)#37 | 6.2%(+6.78)#1,914 |
| 38. | 44049 | 12.8% | 5.7%(+7.14)#38 | 6.2%(+6.61)#1,977 |
| 39. | 43727 | 12.6% | 5.7%(+6.99)#39 | 6.2%(+6.46)#2,049 |
| 40. | 44304 | 12.6% | 5.7%(+6.90)#40 | 6.2%(+6.37)#2,095 |
| 41. | 45848 | 12.5% | 5.7%(+6.85)#41 | 6.2%(+6.32)#2,129 |
| 42. | 43001 | 12.5% | 5.7%(+6.81)#42 | 6.2%(+6.28)#2,147 |
| 43. | 43402 | 12.4% | 5.7%(+6.73)#43 | 6.2%(+6.20)#2,182 |
| 44. | 45334 | 12.3% | 5.7%(+6.69)#44 | 6.2%(+6.16)#2,214 |
| 45. | 45772 | 12.3% | 5.7%(+6.61)#45 | 6.2%(+6.08)#2,257 |
| 46. | 43930 | 12.2% | 5.7%(+6.56)#46 | 6.2%(+6.03)#2,277 |
| 47. | 43746 | 12.1% | 5.7%(+6.47)#47 | 6.2%(+5.94)#2,326 |
| 48. | 44452 | 12.1% | 5.7%(+6.42)#48 | 6.2%(+5.89)#2,346 |
| 49. | 44504 | 11.9% | 5.7%(+6.26)#49 | 6.2%(+5.73)#2,438 |
| 50. | 45213 | 11.9% | 5.7%(+6.26)#50 | 6.2%(+5.72)#2,440 |
| 51. | 43214 | 11.9% | 5.7%(+6.21)#51 | 6.2%(+5.67)#2,471 |
| 52. | 45659 | 11.8% | 5.7%(+6.15)#52 | 6.2%(+5.62)#2,499 |
| 53. | 45387 | 11.8% | 5.7%(+6.15)#53 | 6.2%(+5.62)#2,503 |
| 54. | 43022 | 11.7% | 5.7%(+6.03)#54 | 6.2%(+5.49)#2,585 |
| 55. | 43430 | 11.6% | 5.7%(+5.99)#55 | 6.2%(+5.46)#2,606 |
| 56. | 44274 | 11.6% | 5.7%(+5.98)#56 | 6.2%(+5.44)#2,615 |
| 57. | 43931 | 11.5% | 5.7%(+5.82)#57 | 6.2%(+5.29)#2,720 |
| 58. | 43209 | 11.4% | 5.7%(+5.74)#58 | 6.2%(+5.21)#2,784 |
| 59. | 44085 | 11.3% | 5.7%(+5.61)#59 | 6.2%(+5.08)#2,881 |
| 60. | 44106 | 11.2% | 5.7%(+5.59)#60 | 6.2%(+5.06)#2,891 |
| 61. | 45679 | 11.2% | 5.7%(+5.51)#61 | 6.2%(+4.98)#2,939 |
| 62. | 45773 | 11.1% | 5.7%(+5.46)#62 | 6.2%(+4.93)#2,977 |
| 63. | 44693 | 11.1% | 5.7%(+5.46)#63 | 6.2%(+4.93)#2,991 |
| 64. | 43821 | 11.1% | 5.7%(+5.44)#64 | 6.2%(+4.91)#3,002 |
| 65. | 45111 | 11.0% | 5.7%(+5.40)#65 | 6.2%(+4.87)#3,025 |
| 66. | 43442 | 11.0% | 5.7%(+5.37)#66 | 6.2%(+4.84)#3,044 |
| 67. | 43201 | 11.0% | 5.7%(+5.34)#67 | 6.2%(+4.81)#3,061 |
| 68. | 43324 | 10.9% | 5.7%(+5.22)#68 | 6.2%(+4.69)#3,150 |
| 69. | 45135 | 10.9% | 5.7%(+5.20)#69 | 6.2%(+4.67)#3,163 |
| 70. | 45853 | 10.8% | 5.7%(+5.18)#70 | 6.2%(+4.65)#3,181 |
| 71. | 44236 | 10.8% | 5.7%(+5.16)#71 | 6.2%(+4.63)#3,203 |
| 72. | 43901 | 10.7% | 5.7%(+5.07)#72 | 6.2%(+4.54)#3,257 |
| 73. | 43356 | 10.7% | 5.7%(+5.01)#73 | 6.2%(+4.47)#3,312 |
| 74. | 45826 | 10.6% | 5.7%(+4.99)#74 | 6.2%(+4.45)#3,324 |
| 75. | 44048 | 10.6% | 5.7%(+4.98)#75 | 6.2%(+4.45)#3,328 |
| 76. | 43136 | 10.6% | 5.7%(+4.95)#76 | 6.2%(+4.42)#3,362 |
| 77. | 44118 | 10.6% | 5.7%(+4.92)#77 | 6.2%(+4.38)#3,392 |
| 78. | 45652 | 10.5% | 5.7%(+4.88)#78 | 6.2%(+4.35)#3,425 |
| 79. | 43009 | 10.5% | 5.7%(+4.87)#79 | 6.2%(+4.34)#3,443 |
| 80. | 43202 | 10.5% | 5.7%(+4.85)#80 | 6.2%(+4.31)#3,461 |
| 81. | 43003 | 10.5% | 5.7%(+4.84)#81 | 6.2%(+4.31)#3,463 |
| 82. | 43469 | 10.4% | 5.7%(+4.78)#82 | 6.2%(+4.25)#3,522 |
| 83. | 44882 | 10.4% | 5.7%(+4.70)#83 | 6.2%(+4.17)#3,594 |
| 84. | 43762 | 10.3% | 5.7%(+4.70)#84 | 6.2%(+4.17)#3,596 |
| 85. | 44240 | 10.3% | 5.7%(+4.68)#85 | 6.2%(+4.15)#3,610 |
| 86. | 45628 | 10.3% | 5.7%(+4.67)#86 | 6.2%(+4.14)#3,620 |
| 87. | 45869 | 10.3% | 5.7%(+4.64)#87 | 6.2%(+4.11)#3,650 |
| 88. | 44311 | 10.2% | 5.7%(+4.57)#88 | 6.2%(+4.04)#3,720 |
| 89. | 43150 | 10.2% | 5.7%(+4.56)#89 | 6.2%(+4.03)#3,729 |
| 90. | 43606 | 10.2% | 5.7%(+4.56)#90 | 6.2%(+4.03)#3,730 |
| 91. | 45409 | 10.2% | 5.7%(+4.54)#91 | 6.2%(+4.01)#3,744 |
| 92. | 43963 | 10.1% | 5.7%(+4.43)#92 | 6.2%(+3.89)#3,848 |
| 93. | 43719 | 10.1% | 5.7%(+4.41)#93 | 6.2%(+3.88)#3,860 |
| 94. | 44904 | 10.0% | 5.7%(+4.36)#94 | 6.2%(+3.83)#3,905 |
| 95. | 44122 | 10.0% | 5.7%(+4.33)#95 | 6.2%(+3.80)#3,955 |
| 96. | 43447 | 9.9% | 5.7%(+4.26)#96 | 6.2%(+3.73)#4,035 |
| 97. | 45651 | 9.9% | 5.7%(+4.22)#97 | 6.2%(+3.68)#4,093 |
| 98. | 43107 | 9.9% | 5.7%(+4.21)#98 | 6.2%(+3.68)#4,104 |
| 99. | 44140 | 9.8% | 5.7%(+4.16)#99 | 6.2%(+3.63)#4,162 |
| 100. | 44807 | 9.8% | 5.7%(+4.13)#100 | 6.2%(+3.60)#4,192 |
Common Questions
What are the Top 10 Zip Codes with the Highest Percentage of Population Employed in Education Instruction & Library in Ohio?
Top 10 Zip Codes with the Highest Percentage of Population Employed in Education Instruction & Library in Ohio are:
What zip code has the Highest Percentage of Population Employed in Education Instruction & Library in Ohio?
43842 has the Highest Percentage of Population Employed in Education Instruction & Library in Ohio with 69.6%.
What is the Percentage of Population Employed in Education Instruction & Library in the State of Ohio?
Percentage of Population Employed in Education Instruction & Library in Ohio is 5.7%.
What is the Percentage of Population Employed in Education Instruction & Library in the United States?
Percentage of Population Employed in Education Instruction & Library in the United States is 6.2%.