Zip Codes with the Largest Hungarian Community in Ohio
RELATED REPORTS & OPTIONS
Hungarian
Ohio
Compare Zip Codes
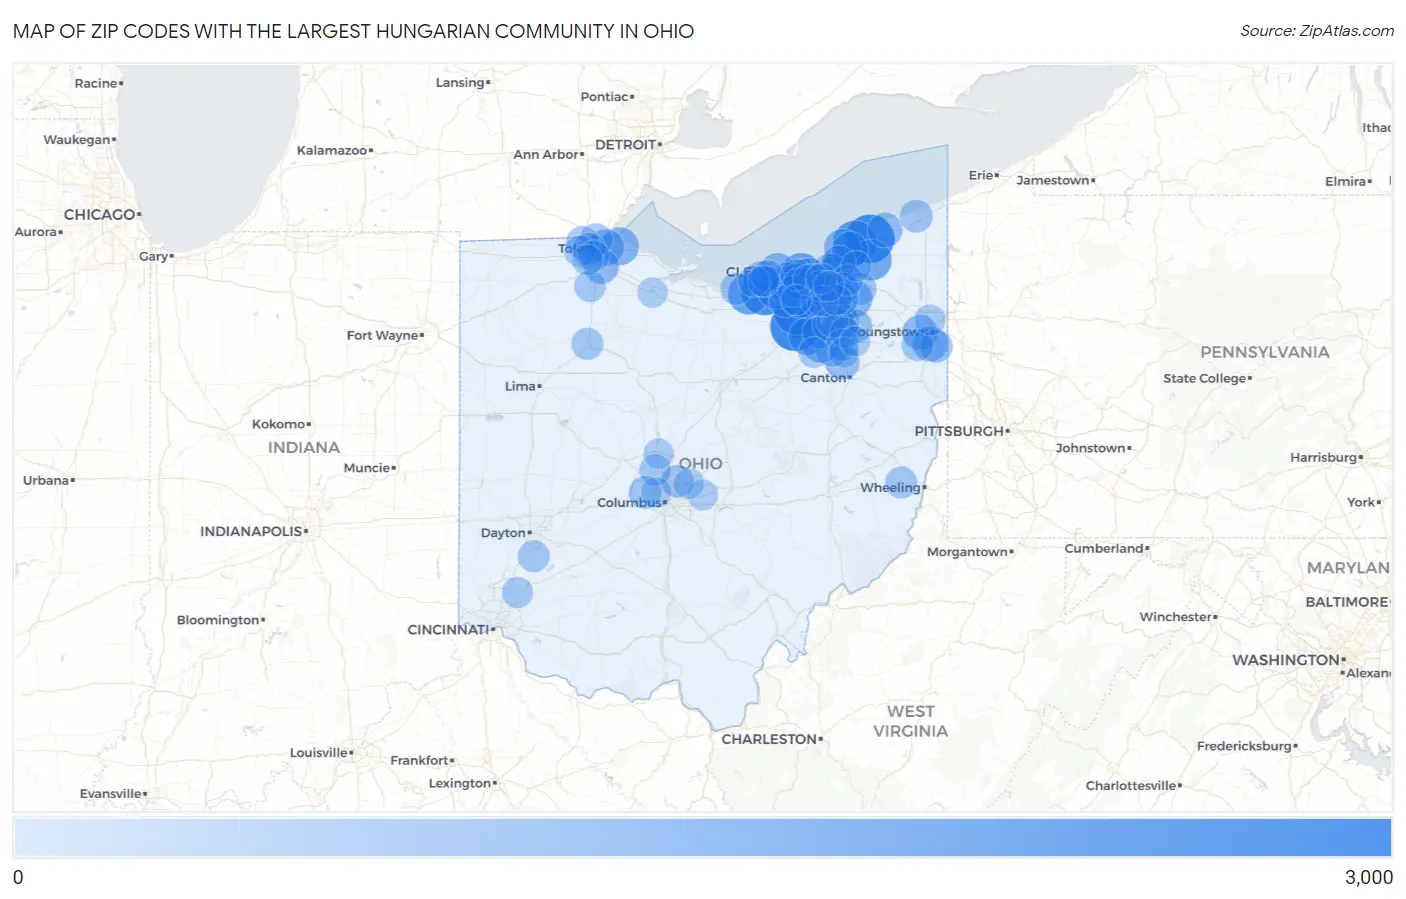
Map of Zip Codes with the Largest Hungarian Community in Ohio
0
3,000
Zip Codes with the Largest Hungarian Community in Ohio
| Zip Code | Hungarian | vs State | vs National | |
| 1. | 44256 | 2,628 | 164,712(1.60%)#1 | 1,294,135(0.20%)#10 |
| 2. | 44077 | 2,525 | 164,712(1.53%)#2 | 1,294,135(0.20%)#11 |
| 3. | 44035 | 2,441 | 164,712(1.48%)#3 | 1,294,135(0.19%)#12 |
| 4. | 44212 | 2,393 | 164,712(1.45%)#4 | 1,294,135(0.18%)#13 |
| 5. | 44060 | 2,000 | 164,712(1.21%)#5 | 1,294,135(0.15%)#14 |
| 6. | 44130 | 1,999 | 164,712(1.21%)#6 | 1,294,135(0.15%)#15 |
| 7. | 44134 | 1,997 | 164,712(1.21%)#7 | 1,294,135(0.15%)#16 |
| 8. | 44107 | 1,728 | 164,712(1.05%)#8 | 1,294,135(0.13%)#17 |
| 9. | 44001 | 1,712 | 164,712(1.04%)#9 | 1,294,135(0.13%)#18 |
| 10. | 44024 | 1,649 | 164,712(1.00%)#10 | 1,294,135(0.13%)#19 |
| 11. | 44124 | 1,383 | 164,712(0.84%)#11 | 1,294,135(0.11%)#23 |
| 12. | 44039 | 1,360 | 164,712(0.83%)#12 | 1,294,135(0.11%)#24 |
| 13. | 44203 | 1,330 | 164,712(0.81%)#13 | 1,294,135(0.10%)#25 |
| 14. | 43616 | 1,305 | 164,712(0.79%)#14 | 1,294,135(0.10%)#26 |
| 15. | 44281 | 1,290 | 164,712(0.78%)#15 | 1,294,135(0.10%)#27 |
| 16. | 44202 | 1,275 | 164,712(0.77%)#16 | 1,294,135(0.10%)#28 |
| 17. | 44111 | 1,261 | 164,712(0.77%)#17 | 1,294,135(0.10%)#29 |
| 18. | 44070 | 1,238 | 164,712(0.75%)#18 | 1,294,135(0.10%)#31 |
| 19. | 44095 | 1,215 | 164,712(0.74%)#19 | 1,294,135(0.09%)#33 |
| 20. | 44122 | 1,214 | 164,712(0.74%)#20 | 1,294,135(0.09%)#34 |
| 21. | 44012 | 1,177 | 164,712(0.71%)#21 | 1,294,135(0.09%)#35 |
| 22. | 44133 | 1,170 | 164,712(0.71%)#22 | 1,294,135(0.09%)#36 |
| 23. | 44094 | 1,168 | 164,712(0.71%)#23 | 1,294,135(0.09%)#37 |
| 24. | 43605 | 1,119 | 164,712(0.68%)#24 | 1,294,135(0.09%)#41 |
| 25. | 44136 | 1,059 | 164,712(0.64%)#25 | 1,294,135(0.08%)#47 |
| 26. | 44145 | 1,053 | 164,712(0.64%)#26 | 1,294,135(0.08%)#48 |
| 27. | 44129 | 1,044 | 164,712(0.63%)#27 | 1,294,135(0.08%)#49 |
| 28. | 43551 | 1,043 | 164,712(0.63%)#28 | 1,294,135(0.08%)#50 |
| 29. | 44515 | 1,039 | 164,712(0.63%)#29 | 1,294,135(0.08%)#51 |
| 30. | 44512 | 1,037 | 164,712(0.63%)#30 | 1,294,135(0.08%)#52 |
| 31. | 44052 | 1,022 | 164,712(0.62%)#31 | 1,294,135(0.08%)#54 |
| 32. | 44131 | 1,003 | 164,712(0.61%)#32 | 1,294,135(0.08%)#57 |
| 33. | 44118 | 987 | 164,712(0.60%)#33 | 1,294,135(0.08%)#58 |
| 34. | 44057 | 986 | 164,712(0.60%)#34 | 1,294,135(0.08%)#59 |
| 35. | 44067 | 943 | 164,712(0.57%)#35 | 1,294,135(0.07%)#62 |
| 36. | 44102 | 926 | 164,712(0.56%)#36 | 1,294,135(0.07%)#65 |
| 37. | 44720 | 921 | 164,712(0.56%)#37 | 1,294,135(0.07%)#67 |
| 38. | 44236 | 916 | 164,712(0.56%)#38 | 1,294,135(0.07%)#70 |
| 39. | 44240 | 915 | 164,712(0.56%)#39 | 1,294,135(0.07%)#71 |
| 40. | 44224 | 893 | 164,712(0.54%)#40 | 1,294,135(0.07%)#73 |
| 41. | 44142 | 878 | 164,712(0.53%)#41 | 1,294,135(0.07%)#77 |
| 42. | 44138 | 871 | 164,712(0.53%)#42 | 1,294,135(0.07%)#79 |
| 43. | 44143 | 864 | 164,712(0.52%)#43 | 1,294,135(0.07%)#81 |
| 44. | 44221 | 855 | 164,712(0.52%)#44 | 1,294,135(0.07%)#84 |
| 45. | 44319 | 838 | 164,712(0.51%)#45 | 1,294,135(0.06%)#86 |
| 46. | 44126 | 807 | 164,712(0.49%)#46 | 1,294,135(0.06%)#89 |
| 47. | 43613 | 799 | 164,712(0.49%)#47 | 1,294,135(0.06%)#92 |
| 48. | 44023 | 770 | 164,712(0.47%)#48 | 1,294,135(0.06%)#100 |
| 49. | 44146 | 769 | 164,712(0.47%)#49 | 1,294,135(0.06%)#101 |
| 50. | 44514 | 766 | 164,712(0.47%)#50 | 1,294,135(0.06%)#102 |
| 51. | 44004 | 761 | 164,712(0.46%)#51 | 1,294,135(0.06%)#104 |
| 52. | 43560 | 752 | 164,712(0.46%)#52 | 1,294,135(0.06%)#106 |
| 53. | 44321 | 742 | 164,712(0.45%)#53 | 1,294,135(0.06%)#108 |
| 54. | 43026 | 737 | 164,712(0.45%)#54 | 1,294,135(0.06%)#110 |
| 55. | 44313 | 731 | 164,712(0.44%)#55 | 1,294,135(0.06%)#112 |
| 56. | 44147 | 728 | 164,712(0.44%)#56 | 1,294,135(0.06%)#113 |
| 57. | 44139 | 727 | 164,712(0.44%)#57 | 1,294,135(0.06%)#114 |
| 58. | 43081 | 723 | 164,712(0.44%)#58 | 1,294,135(0.06%)#115 |
| 59. | 43615 | 718 | 164,712(0.44%)#59 | 1,294,135(0.06%)#118 |
| 60. | 44135 | 716 | 164,712(0.43%)#60 | 1,294,135(0.06%)#119 |
| 61. | 44089 | 691 | 164,712(0.42%)#61 | 1,294,135(0.05%)#131 |
| 62. | 44054 | 688 | 164,712(0.42%)#62 | 1,294,135(0.05%)#133 |
| 63. | 44223 | 675 | 164,712(0.41%)#63 | 1,294,135(0.05%)#140 |
| 64. | 44109 | 672 | 164,712(0.41%)#64 | 1,294,135(0.05%)#144 |
| 65. | 44312 | 666 | 164,712(0.40%)#65 | 1,294,135(0.05%)#146 |
| 66. | 43950 | 666 | 164,712(0.40%)#66 | 1,294,135(0.05%)#147 |
| 67. | 45840 | 661 | 164,712(0.40%)#67 | 1,294,135(0.05%)#150 |
| 68. | 45458 | 661 | 164,712(0.40%)#68 | 1,294,135(0.05%)#152 |
| 69. | 44406 | 660 | 164,712(0.40%)#69 | 1,294,135(0.05%)#154 |
| 70. | 44028 | 656 | 164,712(0.40%)#70 | 1,294,135(0.05%)#158 |
| 71. | 44087 | 647 | 164,712(0.39%)#71 | 1,294,135(0.05%)#162 |
| 72. | 43065 | 638 | 164,712(0.39%)#72 | 1,294,135(0.05%)#167 |
| 73. | 43528 | 629 | 164,712(0.38%)#73 | 1,294,135(0.05%)#171 |
| 74. | 44017 | 624 | 164,712(0.38%)#74 | 1,294,135(0.05%)#176 |
| 75. | 43402 | 618 | 164,712(0.38%)#75 | 1,294,135(0.05%)#178 |
| 76. | 44022 | 617 | 164,712(0.37%)#76 | 1,294,135(0.05%)#180 |
| 77. | 44116 | 605 | 164,712(0.37%)#77 | 1,294,135(0.05%)#183 |
| 78. | 43614 | 599 | 164,712(0.36%)#78 | 1,294,135(0.05%)#187 |
| 79. | 44053 | 597 | 164,712(0.36%)#79 | 1,294,135(0.05%)#188 |
| 80. | 44055 | 596 | 164,712(0.36%)#80 | 1,294,135(0.05%)#189 |
| 81. | 44125 | 587 | 164,712(0.36%)#81 | 1,294,135(0.05%)#193 |
| 82. | 44144 | 584 | 164,712(0.35%)#82 | 1,294,135(0.05%)#195 |
| 83. | 44420 | 565 | 164,712(0.34%)#83 | 1,294,135(0.04%)#206 |
| 84. | 45040 | 559 | 164,712(0.34%)#84 | 1,294,135(0.04%)#211 |
| 85. | 44141 | 538 | 164,712(0.33%)#85 | 1,294,135(0.04%)#237 |
| 86. | 43537 | 536 | 164,712(0.33%)#86 | 1,294,135(0.04%)#240 |
| 87. | 44056 | 531 | 164,712(0.32%)#87 | 1,294,135(0.04%)#242 |
| 88. | 44105 | 525 | 164,712(0.32%)#88 | 1,294,135(0.04%)#245 |
| 89. | 44230 | 524 | 164,712(0.32%)#89 | 1,294,135(0.04%)#247 |
| 90. | 44149 | 521 | 164,712(0.32%)#90 | 1,294,135(0.04%)#250 |
| 91. | 43062 | 520 | 164,712(0.32%)#91 | 1,294,135(0.04%)#252 |
| 92. | 44137 | 518 | 164,712(0.31%)#92 | 1,294,135(0.04%)#255 |
| 93. | 44026 | 513 | 164,712(0.31%)#93 | 1,294,135(0.04%)#261 |
| 94. | 44278 | 511 | 164,712(0.31%)#94 | 1,294,135(0.04%)#265 |
| 95. | 44685 | 510 | 164,712(0.31%)#95 | 1,294,135(0.04%)#266 |
| 96. | 43221 | 507 | 164,712(0.31%)#96 | 1,294,135(0.04%)#270 |
| 97. | 43054 | 493 | 164,712(0.30%)#97 | 1,294,135(0.04%)#284 |
| 98. | 43015 | 487 | 164,712(0.30%)#98 | 1,294,135(0.04%)#288 |
| 99. | 44260 | 487 | 164,712(0.30%)#99 | 1,294,135(0.04%)#290 |
| 100. | 43420 | 486 | 164,712(0.30%)#100 | 1,294,135(0.04%)#291 |
Common Questions
What are the Top 10 Zip Codes with the Largest Hungarian Community in Ohio?
Top 10 Zip Codes with the Largest Hungarian Community in Ohio are:
What zip code has the Largest Hungarian Community in Ohio?
44256 has the Largest Hungarian Community in Ohio with 2,628.
What is the Total Hungarian Population in the State of Ohio?
Total Hungarian Population in Ohio is 164,712.
What is the Total Hungarian Population in the United States?
Total Hungarian Population in the United States is 1,294,135.