Zip Codes with the Highest Percentage of Not-for-profit Organizations in Ohio
RELATED REPORTS & OPTIONS
Not-for-profit Organizations
Ohio
Compare Zip Codes
Map of Zip Codes with the Highest Percentage of Not-for-profit Organizations in Ohio
0.0%
100.0%
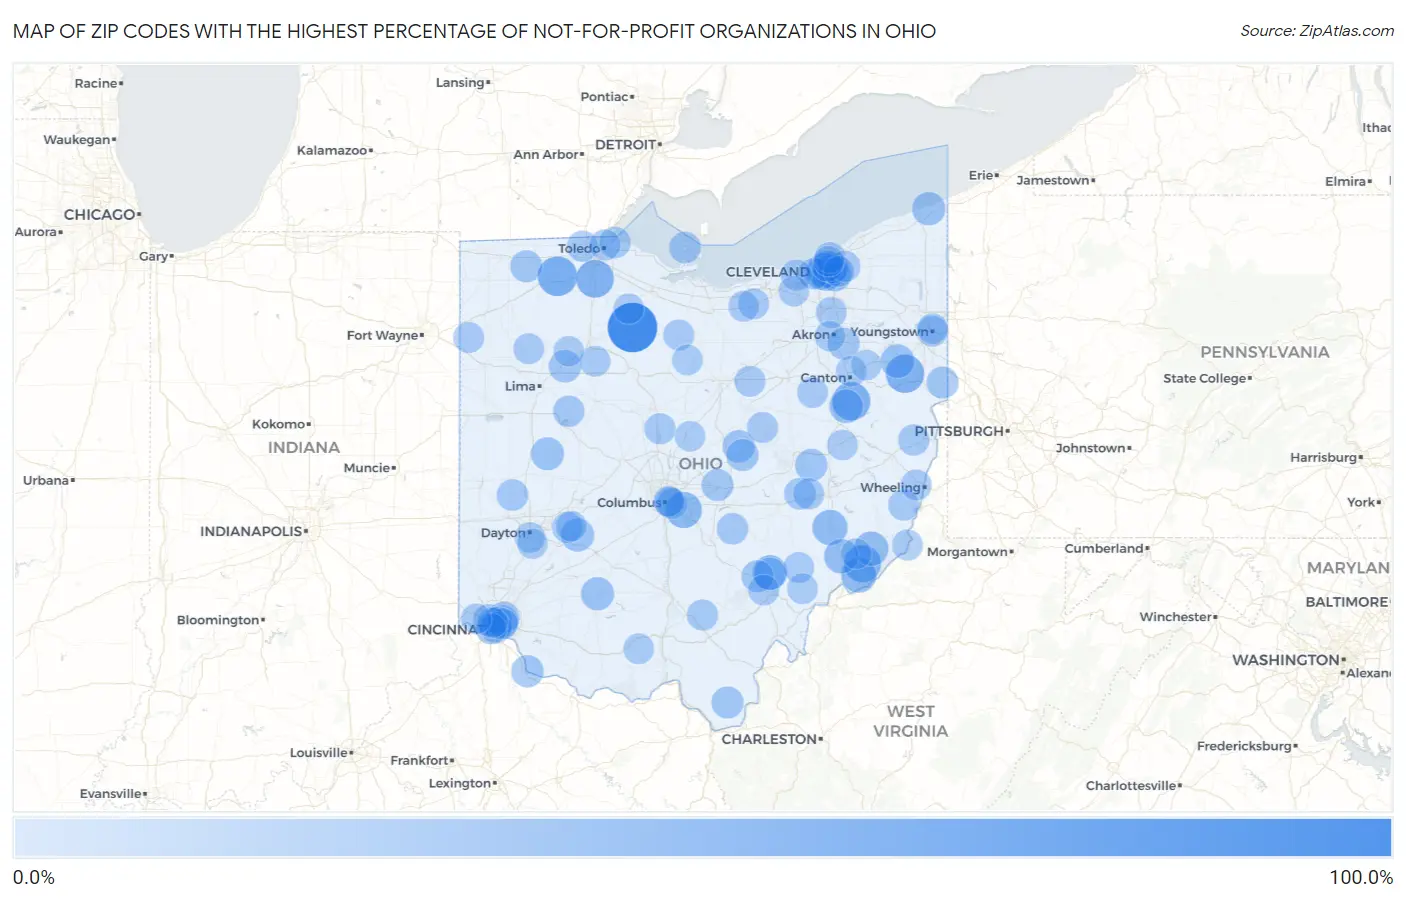
Zip Codes with the Highest Percentage of Not-for-profit Organizations in Ohio
| Zip Code | % Employed in Not-for-profit | vs State | vs National | |
| 1. | 44809 | 100.0% | 9.8% (+90.2)#1 | 8.4% (+91.6)#11 |
| 2. | 43510 | 54.5% | 9.8% (+44.7)#2 | 8.4% (+46.1)#104 |
| 3. | 44493 | 49.2% | 9.8% (+39.4)#3 | 8.4% (+40.8)#148 |
| 4. | 44671 | 48.7% | 9.8% (+38.9)#4 | 8.4% (+40.3)#151 |
| 5. | 43414 | 47.1% | 9.8% (+37.3)#5 | 8.4% (+38.7)#167 |
| 6. | 45789 | 44.1% | 9.8% (+34.3)#6 | 8.4% (+35.7)#193 |
| 7. | 43109 | 39.5% | 9.8% (+29.6)#7 | 8.4% (+31.0)#239 |
| 8. | 45773 | 35.6% | 9.8% (+25.7)#8 | 8.4% (+27.1)#313 |
| 9. | 43717 | 35.3% | 9.8% (+25.4)#9 | 8.4% (+26.8)#319 |
| 10. | 45782 | 32.9% | 9.8% (+23.1)#10 | 8.4% (+24.5)#363 |
| 11. | 45734 | 31.5% | 9.8% (+21.7)#11 | 8.4% (+23.1)#395 |
| 12. | 45746 | 31.3% | 9.8% (+21.5)#12 | 8.4% (+22.9)#406 |
| 13. | 44106 | 29.0% | 9.8% (+19.1)#13 | 8.4% (+20.5)#480 |
| 14. | 44619 | 28.8% | 9.8% (+18.9)#14 | 8.4% (+20.3)#489 |
| 15. | 44697 | 28.4% | 9.8% (+18.6)#15 | 8.4% (+20.0)#501 |
| 16. | 45314 | 26.9% | 9.8% (+17.1)#16 | 8.4% (+18.5)#578 |
| 17. | 44068 | 26.8% | 9.8% (+17.0)#17 | 8.4% (+18.4)#582 |
| 18. | 45132 | 26.7% | 9.8% (+16.8)#18 | 8.4% (+18.2)#591 |
| 19. | 44118 | 26.1% | 9.8% (+16.3)#19 | 8.4% (+17.7)#622 |
| 20. | 45353 | 25.5% | 9.8% (+15.6)#20 | 8.4% (+17.0)#667 |
| 21. | 44122 | 24.4% | 9.8% (+14.6)#21 | 8.4% (+16.0)#744 |
| 22. | 45817 | 23.6% | 9.8% (+13.7)#22 | 8.4% (+15.1)#827 |
| 23. | 43022 | 22.9% | 9.8% (+13.1)#23 | 8.4% (+14.5)#892 |
| 24. | 43836 | 22.8% | 9.8% (+13.0)#24 | 8.4% (+14.4)#901 |
| 25. | 45156 | 22.2% | 9.8% (+12.4)#25 | 8.4% (+13.8)#988 |
| 26. | 44120 | 21.7% | 9.8% (+11.8)#26 | 8.4% (+13.3)#1,051 |
| 27. | 43037 | 21.5% | 9.8% (+11.7)#27 | 8.4% (+13.1)#1,073 |
| 28. | 45740 | 21.4% | 9.8% (+11.5)#28 | 8.4% (+12.9)#1,095 |
| 29. | 43553 | 21.2% | 9.8% (+11.4)#29 | 8.4% (+12.8)#1,111 |
| 30. | 45716 | 21.2% | 9.8% (+11.3)#30 | 8.4% (+12.7)#1,122 |
| 31. | 43023 | 21.0% | 9.8% (+11.2)#31 | 8.4% (+12.6)#1,146 |
| 32. | 45696 | 20.9% | 9.8% (+11.1)#32 | 8.4% (+12.5)#1,158 |
| 33. | 45209 | 20.9% | 9.8% (+11.0)#33 | 8.4% (+12.4)#1,167 |
| 34. | 44250 | 20.8% | 9.8% (+11.0)#34 | 8.4% (+12.4)#1,168 |
| 35. | 44104 | 20.7% | 9.8% (+10.9)#35 | 8.4% (+12.3)#1,182 |
| 36. | 44441 | 20.7% | 9.8% (+10.9)#36 | 8.4% (+12.3)#1,189 |
| 37. | 45213 | 20.1% | 9.8% (+10.2)#37 | 8.4% (+11.6)#1,275 |
| 38. | 43456 | 20.0% | 9.8% (+10.2)#38 | 8.4% (+11.6)#1,288 |
| 39. | 43767 | 19.9% | 9.8% (+10.1)#39 | 8.4% (+11.5)#1,305 |
| 40. | 45223 | 19.3% | 9.8% (+9.44)#40 | 8.4% (+10.8)#1,430 |
| 41. | 43150 | 19.1% | 9.8% (+9.26)#41 | 8.4% (+10.7)#1,468 |
| 42. | 45339 | 19.0% | 9.8% (+9.18)#42 | 8.4% (+10.6)#1,481 |
| 43. | 43434 | 19.0% | 9.8% (+9.12)#43 | 8.4% (+10.5)#1,498 |
| 44. | 44121 | 18.7% | 9.8% (+8.87)#44 | 8.4% (+10.3)#1,542 |
| 45. | 43346 | 18.6% | 9.8% (+8.80)#45 | 8.4% (+10.2)#1,556 |
| 46. | 45207 | 18.2% | 9.8% (+8.39)#46 | 8.4% (+9.79)#1,648 |
| 47. | 44113 | 18.1% | 9.8% (+8.23)#47 | 8.4% (+9.63)#1,693 |
| 48. | 43910 | 17.8% | 9.8% (+7.96)#48 | 8.4% (+9.36)#1,760 |
| 49. | 43933 | 17.7% | 9.8% (+7.81)#49 | 8.4% (+9.21)#1,808 |
| 50. | 45202 | 17.5% | 9.8% (+7.70)#50 | 8.4% (+9.10)#1,848 |
| 51. | 45672 | 17.5% | 9.8% (+7.66)#51 | 8.4% (+9.06)#1,858 |
| 52. | 43617 | 17.2% | 9.8% (+7.31)#52 | 8.4% (+8.71)#1,975 |
| 53. | 45208 | 17.2% | 9.8% (+7.30)#53 | 8.4% (+8.71)#1,978 |
| 54. | 45203 | 17.0% | 9.8% (+7.18)#54 | 8.4% (+8.59)#2,014 |
| 55. | 43762 | 17.0% | 9.8% (+7.12)#55 | 8.4% (+8.52)#2,030 |
| 56. | 43356 | 16.9% | 9.8% (+7.06)#56 | 8.4% (+8.46)#2,053 |
| 57. | 43608 | 16.8% | 9.8% (+6.99)#57 | 8.4% (+8.39)#2,085 |
| 58. | 43006 | 16.8% | 9.8% (+6.94)#58 | 8.4% (+8.34)#2,111 |
| 59. | 45880 | 16.7% | 9.8% (+6.86)#59 | 8.4% (+8.26)#2,136 |
| 60. | 43934 | 16.7% | 9.8% (+6.82)#60 | 8.4% (+8.22)#2,165 |
| 61. | 45387 | 16.6% | 9.8% (+6.80)#61 | 8.4% (+8.20)#2,173 |
| 62. | 44040 | 16.5% | 9.8% (+6.69)#62 | 8.4% (+8.09)#2,216 |
| 63. | 44074 | 16.5% | 9.8% (+6.67)#63 | 8.4% (+8.07)#2,222 |
| 64. | 44838 | 16.5% | 9.8% (+6.66)#64 | 8.4% (+8.06)#2,226 |
| 65. | 44112 | 16.5% | 9.8% (+6.63)#65 | 8.4% (+8.04)#2,241 |
| 66. | 43931 | 16.4% | 9.8% (+6.55)#66 | 8.4% (+7.95)#2,282 |
| 67. | 44116 | 16.3% | 9.8% (+6.42)#67 | 8.4% (+7.82)#2,331 |
| 68. | 44807 | 16.2% | 9.8% (+6.35)#68 | 8.4% (+7.75)#2,357 |
| 69. | 44503 | 16.1% | 9.8% (+6.21)#69 | 8.4% (+7.61)#2,426 |
| 70. | 44119 | 16.0% | 9.8% (+6.18)#70 | 8.4% (+7.58)#2,438 |
| 71. | 45853 | 15.9% | 9.8% (+6.04)#71 | 8.4% (+7.44)#2,493 |
| 72. | 44659 | 15.9% | 9.8% (+6.01)#72 | 8.4% (+7.41)#2,504 |
| 73. | 45780 | 15.8% | 9.8% (+5.97)#73 | 8.4% (+7.37)#2,523 |
| 74. | 44264 | 15.7% | 9.8% (+5.81)#74 | 8.4% (+7.21)#2,599 |
| 75. | 44124 | 15.6% | 9.8% (+5.73)#75 | 8.4% (+7.14)#2,635 |
| 76. | 45814 | 15.5% | 9.8% (+5.67)#76 | 8.4% (+7.07)#2,672 |
| 77. | 44049 | 15.5% | 9.8% (+5.63)#77 | 8.4% (+7.03)#2,688 |
| 78. | 43787 | 15.5% | 9.8% (+5.61)#78 | 8.4% (+7.01)#2,701 |
| 79. | 44887 | 15.4% | 9.8% (+5.59)#79 | 8.4% (+6.99)#2,707 |
| 80. | 45671 | 15.4% | 9.8% (+5.57)#80 | 8.4% (+6.97)#2,718 |
| 81. | 45724 | 15.4% | 9.8% (+5.54)#81 | 8.4% (+6.94)#2,728 |
| 82. | 44504 | 15.3% | 9.8% (+5.45)#82 | 8.4% (+6.85)#2,777 |
| 83. | 44714 | 15.2% | 9.8% (+5.36)#83 | 8.4% (+6.76)#2,824 |
| 84. | 45316 | 15.2% | 9.8% (+5.30)#84 | 8.4% (+6.71)#2,853 |
| 85. | 44110 | 15.1% | 9.8% (+5.28)#85 | 8.4% (+6.69)#2,866 |
| 86. | 43205 | 15.1% | 9.8% (+5.26)#86 | 8.4% (+6.66)#2,881 |
| 87. | 45409 | 15.0% | 9.8% (+5.17)#87 | 8.4% (+6.57)#2,932 |
| 88. | 44629 | 15.0% | 9.8% (+5.14)#88 | 8.4% (+6.54)#2,951 |
| 89. | 43334 | 14.9% | 9.8% (+5.09)#89 | 8.4% (+6.50)#2,976 |
| 90. | 43209 | 14.9% | 9.8% (+5.09)#90 | 8.4% (+6.49)#2,978 |
| 91. | 44841 | 14.9% | 9.8% (+5.06)#91 | 8.4% (+6.46)#2,993 |
| 92. | 44017 | 14.9% | 9.8% (+5.01)#92 | 8.4% (+6.41)#3,025 |
| 93. | 43203 | 14.8% | 9.8% (+4.93)#93 | 8.4% (+6.33)#3,076 |
| 94. | 45745 | 14.7% | 9.8% (+4.87)#94 | 8.4% (+6.28)#3,101 |
| 95. | 45220 | 14.7% | 9.8% (+4.86)#95 | 8.4% (+6.26)#3,113 |
| 96. | 45248 | 14.6% | 9.8% (+4.79)#96 | 8.4% (+6.19)#3,153 |
| 97. | 44641 | 14.4% | 9.8% (+4.56)#97 | 8.4% (+5.96)#3,306 |
| 98. | 45868 | 14.4% | 9.8% (+4.50)#98 | 8.4% (+5.91)#3,339 |
| 99. | 44307 | 14.3% | 9.8% (+4.48)#99 | 8.4% (+5.88)#3,354 |
| 100. | 45429 | 14.3% | 9.8% (+4.44)#100 | 8.4% (+5.84)#3,396 |
Common Questions
What are the Top 10 Zip Codes with the Highest Percentage of Not-for-profit Organizations in Ohio?
Top 10 Zip Codes with the Highest Percentage of Not-for-profit Organizations in Ohio are:
What zip code has the Highest Percentage of Not-for-profit Organizations in Ohio?
44809 has the Highest Percentage of Not-for-profit Organizations in Ohio with 100.0%.
What is the Percentage of Not-for-profit Organizations in the State of Ohio?
Percentage of Not-for-profit Organizations in Ohio is 9.8%.
What is the Percentage of Not-for-profit Organizations in the United States?
Percentage of Not-for-profit Organizations in the United States is 8.4%.