Zip Codes with the Highest Percentage of Population with a Degree in Literature and Languages in Ohio
RELATED REPORTS & OPTIONS
Literature and Languages
Ohio
Compare Zip Codes
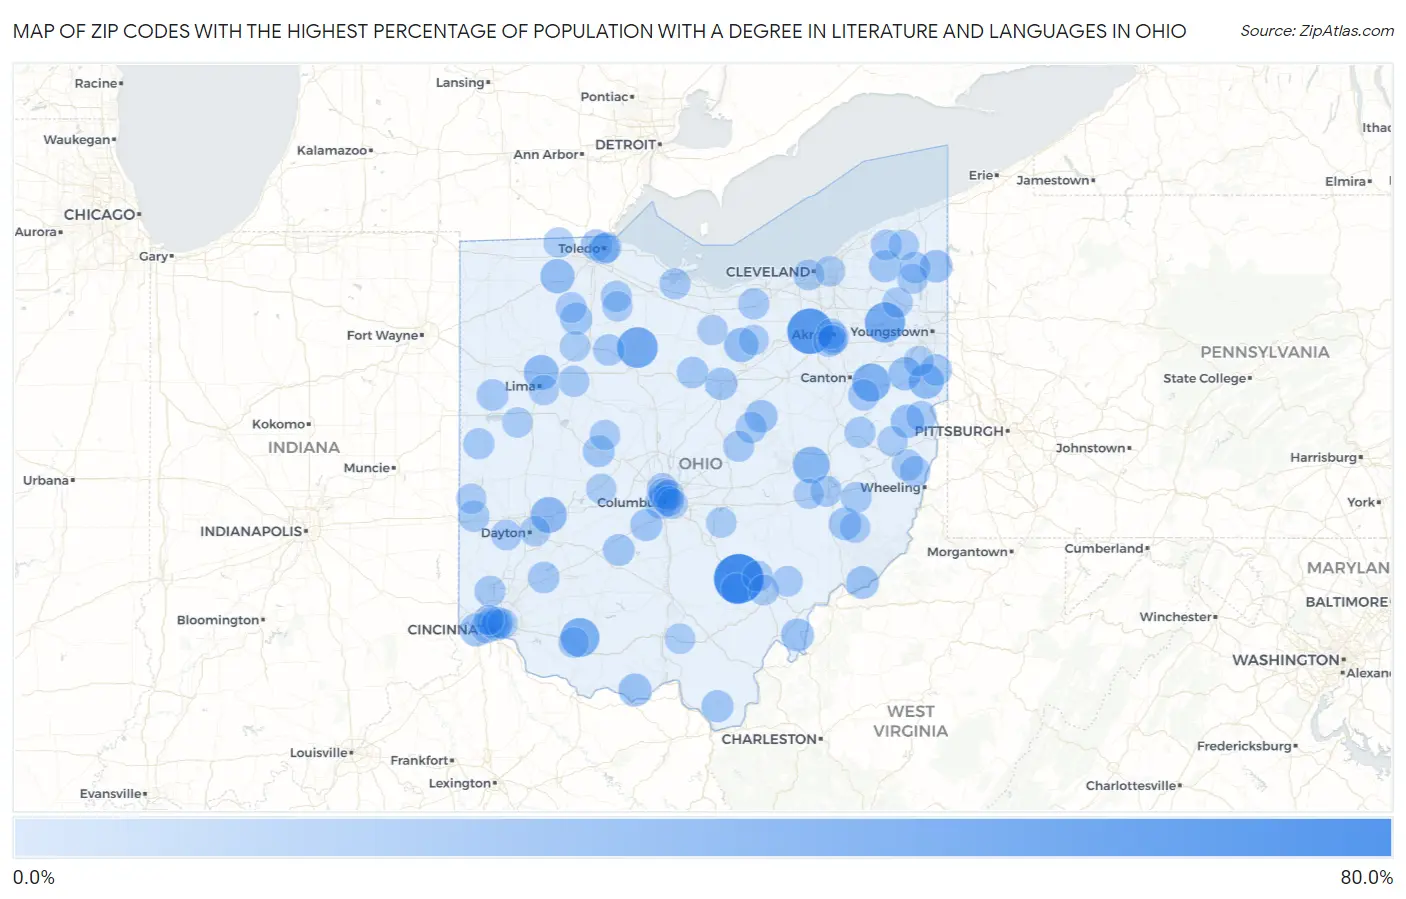
Map of Zip Codes with the Highest Percentage of Population with a Degree in Literature and Languages in Ohio
0.0%
80.0%
Zip Codes with the Highest Percentage of Population with a Degree in Literature and Languages in Ohio
| Zip Code | % Graduates | vs State | vs National | |
| 1. | 43158 | 74.5% | 3.7%(+70.9)#1 | 4.4%(+70.1)#30 |
| 2. | 44274 | 60.0% | 3.7%(+56.3)#2 | 4.4%(+55.6)#40 |
| 3. | 44844 | 42.6% | 3.7%(+38.9)#3 | 4.4%(+38.2)#106 |
| 4. | 44285 | 41.2% | 3.7%(+37.5)#4 | 4.4%(+36.8)#115 |
| 5. | 45155 | 36.0% | 3.7%(+32.3)#5 | 4.4%(+31.6)#141 |
| 6. | 44670 | 33.3% | 3.7%(+29.7)#6 | 4.4%(+28.9)#166 |
| 7. | 43836 | 28.6% | 3.7%(+24.9)#7 | 4.4%(+24.2)#225 |
| 8. | 45341 | 26.3% | 3.7%(+22.7)#8 | 4.4%(+21.9)#271 |
| 9. | 45820 | 22.6% | 3.7%(+18.9)#9 | 4.4%(+18.2)#369 |
| 10. | 44415 | 22.5% | 3.7%(+18.8)#10 | 4.4%(+18.1)#375 |
| 11. | 44859 | 20.9% | 3.7%(+17.3)#11 | 4.4%(+16.5)#440 |
| 12. | 43510 | 20.5% | 3.7%(+16.8)#12 | 4.4%(+16.0)#456 |
| 13. | 43908 | 17.2% | 3.7%(+13.6)#13 | 4.4%(+12.8)#618 |
| 14. | 44493 | 17.1% | 3.7%(+13.4)#14 | 4.4%(+12.7)#630 |
| 15. | 45051 | 16.1% | 3.7%(+12.4)#15 | 4.4%(+11.7)#713 |
| 16. | 45684 | 15.7% | 3.7%(+12.0)#16 | 4.4%(+11.3)#754 |
| 17. | 45743 | 15.7% | 3.7%(+12.0)#17 | 4.4%(+11.3)#755 |
| 18. | 43222 | 15.2% | 3.7%(+11.5)#18 | 4.4%(+10.8)#802 |
| 19. | 45768 | 14.8% | 3.7%(+11.1)#19 | 4.4%(+10.4)#832 |
| 20. | 44093 | 14.7% | 3.7%(+11.0)#20 | 4.4%(+10.2)#854 |
| 21. | 44628 | 14.6% | 3.7%(+11.0)#21 | 4.4%(+10.2)#858 |
| 22. | 43779 | 14.3% | 3.7%(+10.6)#22 | 4.4%(+9.88)#895 |
| 23. | 44902 | 13.7% | 3.7%(+10.00)#23 | 4.4%(+9.27)#951 |
| 24. | 43126 | 13.0% | 3.7%(+9.37)#24 | 4.4%(+8.63)#1,042 |
| 25. | 43529 | 12.9% | 3.7%(+9.23)#25 | 4.4%(+8.49)#1,068 |
| 26. | 44046 | 12.6% | 3.7%(+8.89)#26 | 4.4%(+8.16)#1,126 |
| 27. | 45645 | 12.5% | 3.7%(+8.78)#27 | 4.4%(+8.05)#1,150 |
| 28. | 43319 | 11.8% | 3.7%(+8.17)#28 | 4.4%(+7.44)#1,248 |
| 29. | 43106 | 11.7% | 3.7%(+8.04)#29 | 4.4%(+7.30)#1,278 |
| 30. | 44445 | 11.3% | 3.7%(+7.61)#30 | 4.4%(+6.88)#1,389 |
| 31. | 45862 | 11.2% | 3.7%(+7.55)#31 | 4.4%(+6.81)#1,403 |
| 32. | 44314 | 10.9% | 3.7%(+7.22)#32 | 4.4%(+6.49)#1,503 |
| 33. | 45054 | 10.8% | 3.7%(+7.17)#33 | 4.4%(+6.44)#1,516 |
| 34. | 45890 | 10.8% | 3.7%(+7.16)#34 | 4.4%(+6.42)#1,519 |
| 35. | 45205 | 10.8% | 3.7%(+7.12)#35 | 4.4%(+6.38)#1,528 |
| 36. | 44827 | 10.5% | 3.7%(+6.82)#36 | 4.4%(+6.09)#1,637 |
| 37. | 44076 | 10.4% | 3.7%(+6.75)#37 | 4.4%(+6.02)#1,660 |
| 38. | 44688 | 10.3% | 3.7%(+6.67)#38 | 4.4%(+5.94)#1,694 |
| 39. | 43214 | 10.2% | 3.7%(+6.52)#39 | 4.4%(+5.78)#1,745 |
| 40. | 45321 | 10.1% | 3.7%(+6.47)#40 | 4.4%(+5.74)#1,759 |
| 41. | 45220 | 10.1% | 3.7%(+6.42)#41 | 4.4%(+5.68)#1,782 |
| 42. | 43901 | 10.1% | 3.7%(+6.38)#42 | 4.4%(+5.65)#1,795 |
| 43. | 45207 | 10.0% | 3.7%(+6.33)#43 | 4.4%(+5.60)#1,813 |
| 44. | 43606 | 9.9% | 3.7%(+6.22)#44 | 4.4%(+5.49)#1,874 |
| 45. | 44074 | 9.9% | 3.7%(+6.21)#45 | 4.4%(+5.48)#1,878 |
| 46. | 43014 | 9.9% | 3.7%(+6.18)#46 | 4.4%(+5.44)#1,893 |
| 47. | 43022 | 9.7% | 3.7%(+6.04)#47 | 4.4%(+5.31)#1,949 |
| 48. | 45810 | 9.7% | 3.7%(+6.00)#48 | 4.4%(+5.27)#1,960 |
| 49. | 44621 | 9.5% | 3.7%(+5.85)#49 | 4.4%(+5.11)#2,024 |
| 50. | 45310 | 9.5% | 3.7%(+5.85)#50 | 4.4%(+5.11)#2,030 |
| 51. | 43725 | 9.5% | 3.7%(+5.79)#51 | 4.4%(+5.06)#2,062 |
| 52. | 43604 | 9.3% | 3.7%(+5.65)#52 | 4.4%(+4.92)#2,133 |
| 53. | 45206 | 9.3% | 3.7%(+5.62)#53 | 4.4%(+4.89)#2,150 |
| 54. | 45654 | 9.3% | 3.7%(+5.61)#54 | 4.4%(+4.88)#2,153 |
| 55. | 43406 | 9.3% | 3.7%(+5.58)#55 | 4.4%(+4.85)#2,171 |
| 56. | 43464 | 9.2% | 3.7%(+5.53)#56 | 4.4%(+4.79)#2,205 |
| 57. | 45015 | 9.2% | 3.7%(+5.51)#57 | 4.4%(+4.78)#2,217 |
| 58. | 43773 | 8.9% | 3.7%(+5.22)#58 | 4.4%(+4.49)#2,375 |
| 59. | 44086 | 8.7% | 3.7%(+5.07)#59 | 4.4%(+4.34)#2,443 |
| 60. | 43511 | 8.7% | 3.7%(+5.05)#60 | 4.4%(+4.32)#2,461 |
| 61. | 43201 | 8.7% | 3.7%(+4.99)#61 | 4.4%(+4.26)#2,504 |
| 62. | 43202 | 8.6% | 3.7%(+4.88)#62 | 4.4%(+4.15)#2,573 |
| 63. | 43211 | 8.4% | 3.7%(+4.72)#63 | 4.4%(+3.98)#2,686 |
| 64. | 45716 | 8.3% | 3.7%(+4.66)#64 | 4.4%(+3.92)#2,729 |
| 65. | 44102 | 8.3% | 3.7%(+4.62)#65 | 4.4%(+3.88)#2,754 |
| 66. | 45711 | 8.1% | 3.7%(+4.45)#66 | 4.4%(+3.71)#2,884 |
| 67. | 43939 | 8.1% | 3.7%(+4.43)#67 | 4.4%(+3.70)#2,897 |
| 68. | 45171 | 8.1% | 3.7%(+4.42)#68 | 4.4%(+3.69)#2,908 |
| 69. | 43932 | 7.9% | 3.7%(+4.26)#69 | 4.4%(+3.53)#3,036 |
| 70. | 45780 | 7.9% | 3.7%(+4.21)#70 | 4.4%(+3.48)#3,074 |
| 71. | 44311 | 7.9% | 3.7%(+4.20)#71 | 4.4%(+3.47)#3,085 |
| 72. | 43788 | 7.8% | 3.7%(+4.12)#72 | 4.4%(+3.38)#3,167 |
| 73. | 45345 | 7.8% | 3.7%(+4.09)#73 | 4.4%(+3.35)#3,193 |
| 74. | 44470 | 7.7% | 3.7%(+3.98)#74 | 4.4%(+3.25)#3,295 |
| 75. | 45613 | 7.5% | 3.7%(+3.82)#75 | 4.4%(+3.08)#3,446 |
| 76. | 44084 | 7.5% | 3.7%(+3.80)#76 | 4.4%(+3.07)#3,464 |
| 77. | 45208 | 7.4% | 3.7%(+3.77)#77 | 4.4%(+3.04)#3,500 |
| 78. | 44450 | 7.4% | 3.7%(+3.73)#78 | 4.4%(+3.00)#3,538 |
| 79. | 45816 | 7.4% | 3.7%(+3.68)#79 | 4.4%(+2.94)#3,602 |
| 80. | 45346 | 7.3% | 3.7%(+3.66)#80 | 4.4%(+2.93)#3,621 |
| 81. | 45804 | 7.3% | 3.7%(+3.66)#81 | 4.4%(+2.92)#3,625 |
| 82. | 43148 | 7.3% | 3.7%(+3.64)#82 | 4.4%(+2.91)#3,642 |
| 83. | 43457 | 7.3% | 3.7%(+3.64)#83 | 4.4%(+2.91)#3,643 |
| 84. | 43605 | 7.3% | 3.7%(+3.59)#84 | 4.4%(+2.85)#3,692 |
| 85. | 43209 | 7.3% | 3.7%(+3.58)#85 | 4.4%(+2.84)#3,704 |
| 86. | 44302 | 7.2% | 3.7%(+3.56)#86 | 4.4%(+2.83)#3,721 |
| 87. | 44880 | 7.2% | 3.7%(+3.56)#87 | 4.4%(+2.82)#3,724 |
| 88. | 44118 | 7.2% | 3.7%(+3.55)#88 | 4.4%(+2.81)#3,731 |
| 89. | 43986 | 7.1% | 3.7%(+3.47)#89 | 4.4%(+2.73)#3,808 |
| 90. | 43762 | 7.1% | 3.7%(+3.42)#90 | 4.4%(+2.69)#3,865 |
| 91. | 43203 | 7.1% | 3.7%(+3.42)#91 | 4.4%(+2.69)#3,870 |
| 92. | 43358 | 7.1% | 3.7%(+3.41)#92 | 4.4%(+2.68)#3,883 |
| 93. | 45223 | 7.1% | 3.7%(+3.39)#93 | 4.4%(+2.66)#3,921 |
| 94. | 44855 | 7.1% | 3.7%(+3.38)#94 | 4.4%(+2.65)#3,932 |
| 95. | 45871 | 7.0% | 3.7%(+3.33)#95 | 4.4%(+2.60)#3,984 |
| 96. | 44490 | 6.9% | 3.7%(+3.27)#96 | 4.4%(+2.53)#4,061 |
| 97. | 44301 | 6.9% | 3.7%(+3.22)#97 | 4.4%(+2.49)#4,106 |
| 98. | 43044 | 6.9% | 3.7%(+3.21)#98 | 4.4%(+2.48)#4,125 |
| 99. | 45403 | 6.9% | 3.7%(+3.18)#99 | 4.4%(+2.45)#4,168 |
| 100. | 43540 | 6.8% | 3.7%(+3.17)#100 | 4.4%(+2.44)#4,177 |
Common Questions
What are the Top 10 Zip Codes with the Highest Percentage of Population with a Degree in Literature and Languages in Ohio?
Top 10 Zip Codes with the Highest Percentage of Population with a Degree in Literature and Languages in Ohio are:
What zip code has the Highest Percentage of Population with a Degree in Literature and Languages in Ohio?
43158 has the Highest Percentage of Population with a Degree in Literature and Languages in Ohio with 74.5%.
What is the Percentage of Population with a Degree in Literature and Languages in the State of Ohio?
Percentage of Population with a Degree in Literature and Languages in Ohio is 3.7%.
What is the Percentage of Population with a Degree in Literature and Languages in the United States?
Percentage of Population with a Degree in Literature and Languages in the United States is 4.4%.