Maxville, MT Map & Demographics
Maxville Map
Maxville Overview
$31,661
PER CAPITA INCOME
$105,500
AVG HOUSEHOLD INCOME
22.2%
WAGE / INCOME GAP [ % ]
77.8¢/ $1
WAGE / INCOME GAP [ $ ]
0.31
INEQUALITY / GINI INDEX
113
TOTAL POPULATION
53
MALE POPULATION
60
FEMALE POPULATION
88.33
MALES / 100 FEMALES
113.21
FEMALES / 100 MALES
25.6
MEDIAN AGE
3.1
AVG FAMILY SIZE
3.1
AVG HOUSEHOLD SIZE
61
LABOR FORCE [ PEOPLE ]
65.6%
PERCENT IN LABOR FORCE
Income in Maxville
Income Overview in Maxville
| Characteristic | Number | Measure |
| Per Capita Income | 113 | $31,661 |
| Median Family Income | 27 | $0 |
| Mean Family Income | 27 | $53,300 |
| Median Household Income | 36 | $105,500 |
| Mean Household Income | 36 | $87,508 |
| Income Deficit | 27 | $0 |
| Wage / Income Gap (%) | 113 | 22.17% |
| Wage / Income Gap ($) | 113 | 77.83¢ per $1 |
| Gini / Inequality Index | 113 | 0.31 |
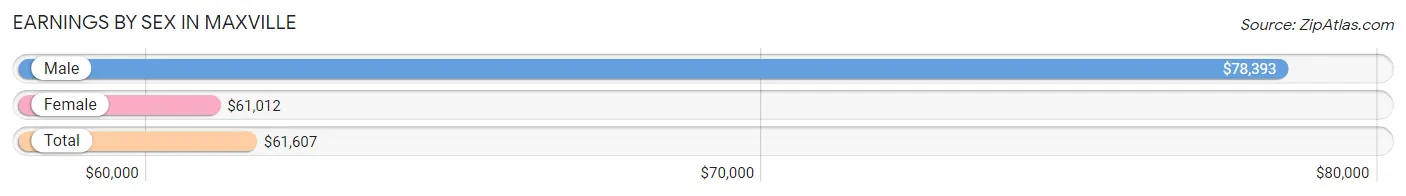
Earnings by Sex in Maxville
Average Earnings in Maxville are $61,607, $78,393 for men and $61,012 for women, a difference of 22.2%.
| Sex | Number | Average Earnings |
| Male | 28 (45.9%) | $78,393 |
| Female | 33 (54.1%) | $61,012 |
| Total | 61 (100.0%) | $61,607 |
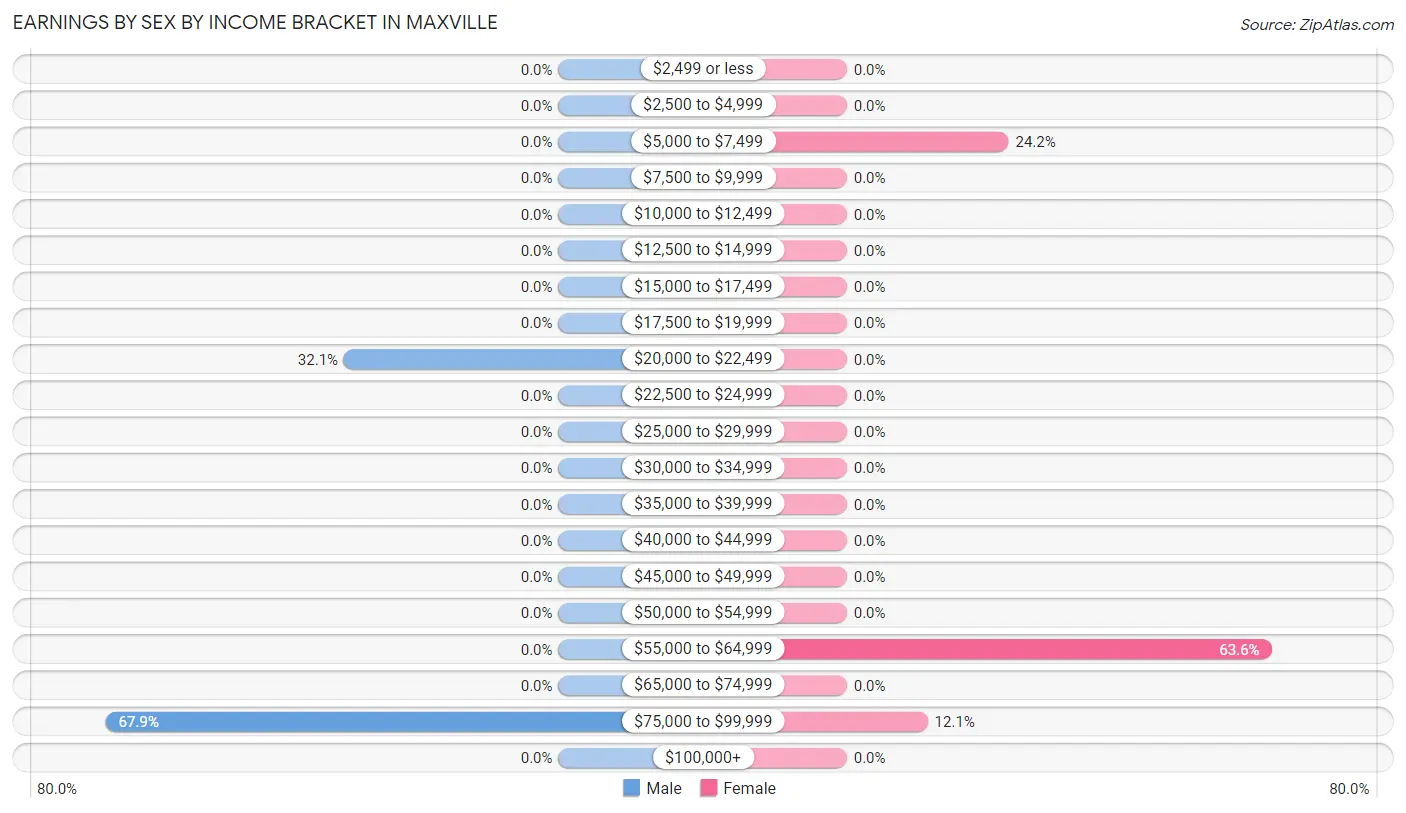
Earnings by Sex by Income Bracket in Maxville
The most common earnings brackets in Maxville are $75,000 to $99,999 for men (19 | 67.9%) and $55,000 to $64,999 for women (21 | 63.6%).
| Income | Male | Female |
| $2,499 or less | 0 (0.0%) | 0 (0.0%) |
| $2,500 to $4,999 | 0 (0.0%) | 0 (0.0%) |
| $5,000 to $7,499 | 0 (0.0%) | 8 (24.2%) |
| $7,500 to $9,999 | 0 (0.0%) | 0 (0.0%) |
| $10,000 to $12,499 | 0 (0.0%) | 0 (0.0%) |
| $12,500 to $14,999 | 0 (0.0%) | 0 (0.0%) |
| $15,000 to $17,499 | 0 (0.0%) | 0 (0.0%) |
| $17,500 to $19,999 | 0 (0.0%) | 0 (0.0%) |
| $20,000 to $22,499 | 9 (32.1%) | 0 (0.0%) |
| $22,500 to $24,999 | 0 (0.0%) | 0 (0.0%) |
| $25,000 to $29,999 | 0 (0.0%) | 0 (0.0%) |
| $30,000 to $34,999 | 0 (0.0%) | 0 (0.0%) |
| $35,000 to $39,999 | 0 (0.0%) | 0 (0.0%) |
| $40,000 to $44,999 | 0 (0.0%) | 0 (0.0%) |
| $45,000 to $49,999 | 0 (0.0%) | 0 (0.0%) |
| $50,000 to $54,999 | 0 (0.0%) | 0 (0.0%) |
| $55,000 to $64,999 | 0 (0.0%) | 21 (63.6%) |
| $65,000 to $74,999 | 0 (0.0%) | 0 (0.0%) |
| $75,000 to $99,999 | 19 (67.9%) | 4 (12.1%) |
| $100,000+ | 0 (0.0%) | 0 (0.0%) |
| Total | 28 (100.0%) | 33 (100.0%) |
Earnings by Sex by Educational Attainment in Maxville
| Educational Attainment | Male Income | Female Income |
| Less than High School | - | - |
| High School Diploma | - | - |
| College or Associate's Degree | - | - |
| Bachelor's Degree | - | - |
| Graduate Degree | - | - |
| Total | - | - |
Family Income in Maxville
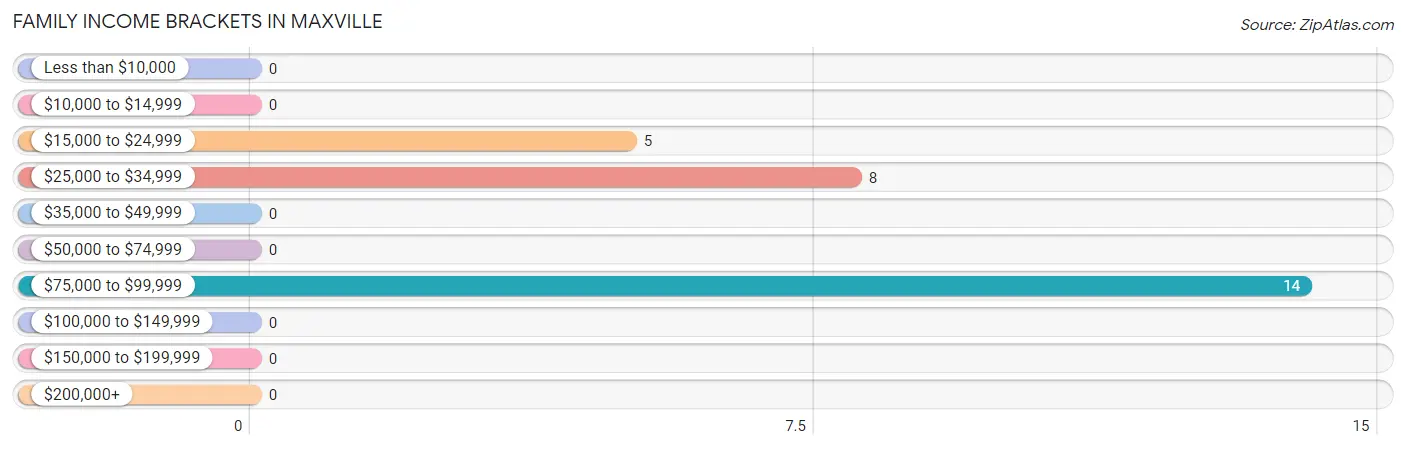
Family Income Brackets in Maxville
According to the Maxville family income data, there are 14 families falling into the $75,000 to $99,999 income range, which is the most common income bracket and makes up 51.8% of all families.
| Income Bracket | # Families | % Families |
| Less than $10,000 | 0 | 0.0% |
| $10,000 to $14,999 | 0 | 0.0% |
| $15,000 to $24,999 | 5 | 18.5% |
| $25,000 to $34,999 | 8 | 29.6% |
| $35,000 to $49,999 | 0 | 0.0% |
| $50,000 to $74,999 | 0 | 0.0% |
| $75,000 to $99,999 | 14 | 51.9% |
| $100,000 to $149,999 | 0 | 0.0% |
| $150,000 to $199,999 | 0 | 0.0% |
| $200,000+ | 0 | 0.0% |
Family Income by Famaliy Size in Maxville
| Income Bracket | # Families | Median Income |
| 2-Person Families | 19 (70.4%) | $0 |
| 3-Person Families | 8 (29.6%) | $0 |
| 4-Person Families | 0 (0.0%) | $0 |
| 5-Person Families | 0 (0.0%) | $0 |
| 6-Person Families | 0 (0.0%) | $0 |
| 7+ Person Families | 0 (0.0%) | $0 |
| Total | 27 (100.0%) | $0 |
Family Income by Number of Earners in Maxville
| Number of Earners | # Families | Median Income |
| No Earners | 5 (18.5%) | $0 |
| 1 Earner | 14 (51.8%) | $0 |
| 2 Earners | 8 (29.6%) | $0 |
| 3+ Earners | 0 (0.0%) | $0 |
| Total | 27 (100.0%) | $0 |
Household Income in Maxville
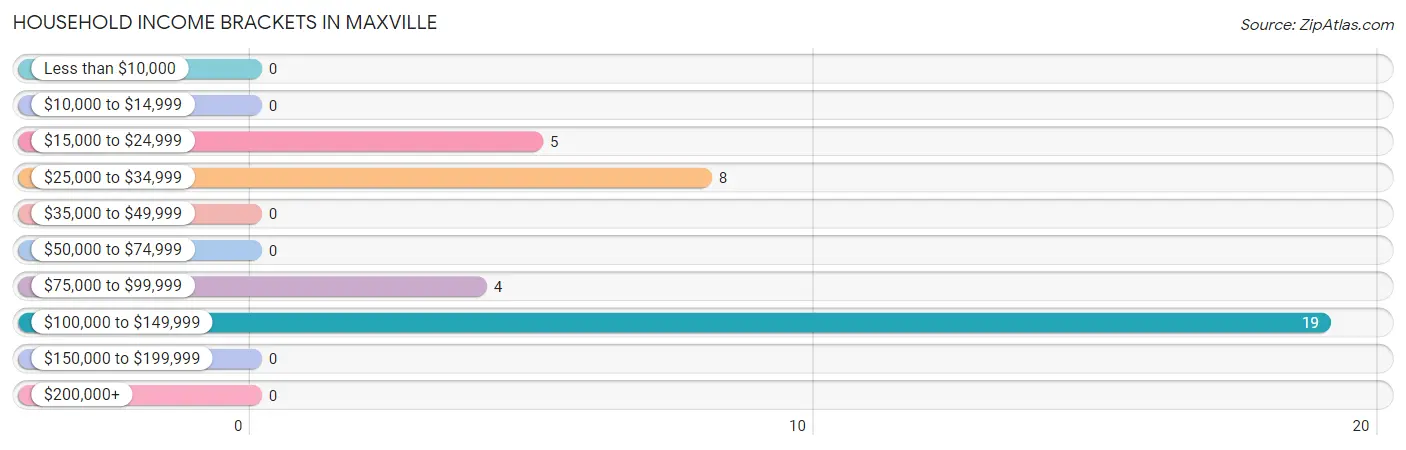
Household Income Brackets in Maxville
With 19 households falling in the category, the $100,000 to $149,999 income range is the most frequent in Maxville, accounting for 52.8% of all households.
| Income Bracket | # Households | % Households |
| Less than $10,000 | 0 | 0.0% |
| $10,000 to $14,999 | 0 | 0.0% |
| $15,000 to $24,999 | 5 | 13.9% |
| $25,000 to $34,999 | 8 | 22.2% |
| $35,000 to $49,999 | 0 | 0.0% |
| $50,000 to $74,999 | 0 | 0.0% |
| $75,000 to $99,999 | 4 | 11.1% |
| $100,000 to $149,999 | 19 | 52.8% |
| $150,000 to $199,999 | 0 | 0.0% |
| $200,000+ | 0 | 0.0% |
Household Income by Householder Age in Maxville
| Income Bracket | # Households | Median Income |
| 15 to 24 Years | 0 (0.0%) | $0 |
| 25 to 44 Years | 13 (36.1%) | $0 |
| 45 to 64 Years | 18 (50.0%) | $0 |
| 65+ Years | 5 (13.9%) | $0 |
| Total | 36 (100.0%) | $105,500 |
Poverty in Maxville
Income Below Poverty by Sex and Age in Maxville
| Age Bracket | Male | Female |
| Under 5 Years | 0 (0.0%) | 0 (0.0%) |
| 5 Years | 0 (0.0%) | 0 (0.0%) |
| 6 to 11 Years | 0 (0.0%) | 0 (0.0%) |
| 12 to 14 Years | 0 (0.0%) | 0 (0.0%) |
| 15 Years | 0 (0.0%) | 0 (0.0%) |
| 16 and 17 Years | 0 (0.0%) | 0 (0.0%) |
| 18 to 24 Years | 0 (0.0%) | 0 (0.0%) |
| 25 to 34 Years | 0 (0.0%) | 0 (0.0%) |
| 35 to 44 Years | 0 (0.0%) | 0 (0.0%) |
| 45 to 54 Years | 0 (0.0%) | 0 (0.0%) |
| 55 to 64 Years | 0 (0.0%) | 0 (0.0%) |
| 65 to 74 Years | 0 (0.0%) | 0 (0.0%) |
| 75 Years and over | 0 (0.0%) | 0 (0.0%) |
| Total | 0 (0.0%) | 0 (0.0%) |
Income Above Poverty by Sex and Age in Maxville
According to the poverty statistics in Maxville, males aged under 5 years and females aged 18 to 24 years are the age groups that are most secure financially, with 100.0% of males and 100.0% of females in these age groups living above the poverty line.
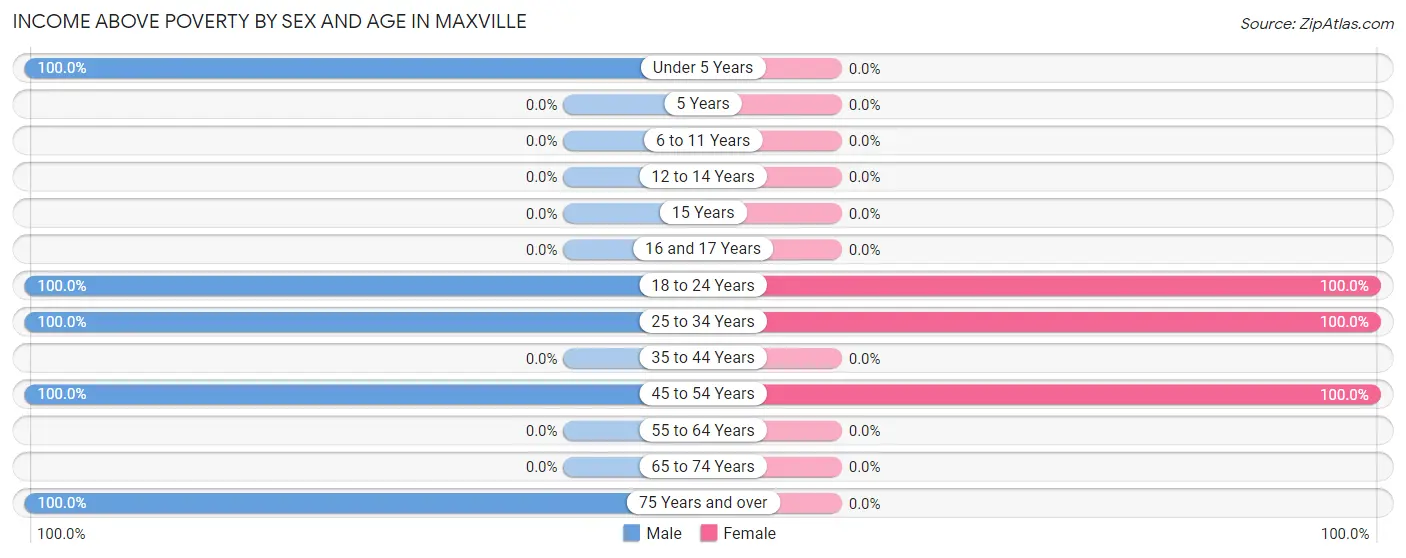
| Age Bracket | Male | Female |
| Under 5 Years | 20 (100.0%) | 0 (0.0%) |
| 5 Years | 0 (0.0%) | 0 (0.0%) |
| 6 to 11 Years | 0 (0.0%) | 0 (0.0%) |
| 12 to 14 Years | 0 (0.0%) | 0 (0.0%) |
| 15 Years | 0 (0.0%) | 0 (0.0%) |
| 16 and 17 Years | 0 (0.0%) | 0 (0.0%) |
| 18 to 24 Years | 9 (100.0%) | 23 (100.0%) |
| 25 to 34 Years | 5 (100.0%) | 8 (100.0%) |
| 35 to 44 Years | 0 (0.0%) | 0 (0.0%) |
| 45 to 54 Years | 14 (100.0%) | 29 (100.0%) |
| 55 to 64 Years | 0 (0.0%) | 0 (0.0%) |
| 65 to 74 Years | 0 (0.0%) | 0 (0.0%) |
| 75 Years and over | 5 (100.0%) | 0 (0.0%) |
| Total | 53 (100.0%) | 60 (100.0%) |
Income Below Poverty Among Married-Couple Families in Maxville
| Children | Above Poverty | Below Poverty |
| No Children | 5 (100.0%) | 0 (0.0%) |
| 1 or 2 Children | 8 (100.0%) | 0 (0.0%) |
| 3 or 4 Children | 0 (0.0%) | 0 (0.0%) |
| 5 or more Children | 0 (0.0%) | 0 (0.0%) |
| Total | 13 (100.0%) | 0 (0.0%) |
Income Below Poverty Among Single-Parent Households in Maxville
| Children | Single Father | Single Mother |
| No Children | 0 (0.0%) | 0 (0.0%) |
| 1 or 2 Children | 0 (0.0%) | 0 (0.0%) |
| 3 or 4 Children | 0 (0.0%) | 0 (0.0%) |
| 5 or more Children | 0 (0.0%) | 0 (0.0%) |
| Total | 0 (0.0%) | 0 (0.0%) |
Income Below Poverty Among Married-Couple vs Single-Parent Households in Maxville
| Children | Married-Couple Families | Single-Parent Households |
| No Children | 0 (0.0%) | 0 (0.0%) |
| 1 or 2 Children | 0 (0.0%) | 0 (0.0%) |
| 3 or 4 Children | 0 (0.0%) | 0 (0.0%) |
| 5 or more Children | 0 (0.0%) | 0 (0.0%) |
| Total | 0 (0.0%) | 0 (0.0%) |
Race in Maxville
The most populous races in Maxville are , and White / Caucasian (113 | 100.0%).
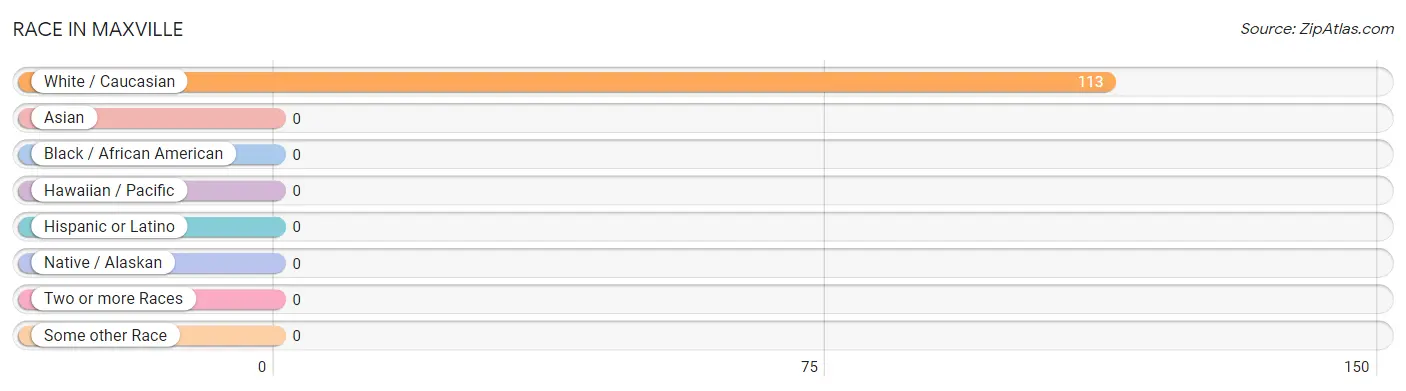
| Race | # Population | % Population |
| Asian | 0 | 0.0% |
| Black / African American | 0 | 0.0% |
| Hawaiian / Pacific | 0 | 0.0% |
| Hispanic or Latino | 0 | 0.0% |
| Native / Alaskan | 0 | 0.0% |
| White / Caucasian | 113 | 100.0% |
| Two or more Races | 0 | 0.0% |
| Some other Race | 0 | 0.0% |
| Total | 113 | 100.0% |
Ancestry in Maxville
The most populous ancestries reported in Maxville are Irish (64 | 56.6%), English (37 | 32.7%), Norwegian (14 | 12.4%), Scottish (12 | 10.6%), and French (9 | 8.0%), together accounting for 120.4% of all Maxville residents.
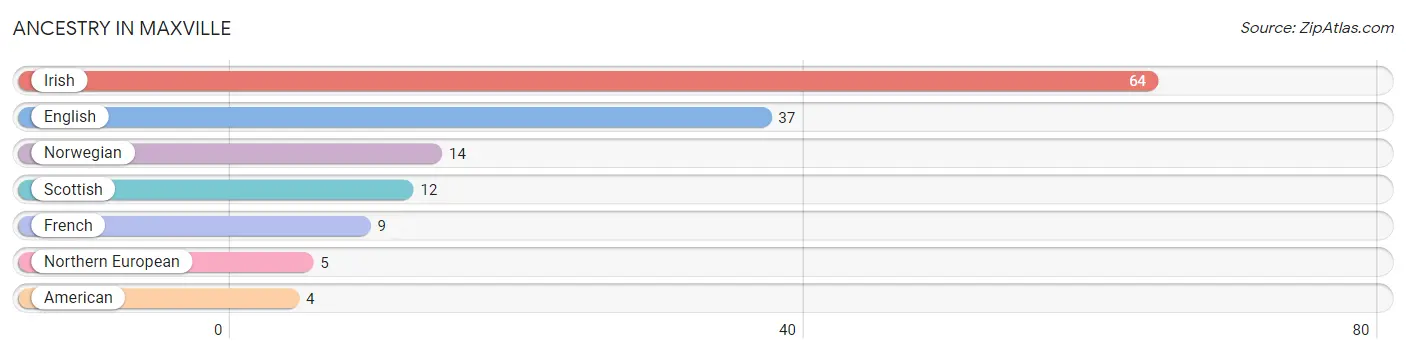
| Ancestry | # Population | % Population |
| American | 4 | 3.5% |
| English | 37 | 32.7% |
| French | 9 | 8.0% |
| Irish | 64 | 56.6% |
| Northern European | 5 | 4.4% |
| Norwegian | 14 | 12.4% |
| Scottish | 12 | 10.6% | View All 7 Rows |
Immigrants in Maxville

| Immigration Origin | # Population | % Population | View All 0 Rows |
Sex and Age in Maxville
Sex and Age in Maxville
The most populous age groups in Maxville are Under 5 Years (20 | 37.7%) for men and 20 to 24 Years (23 | 38.3%) for women.
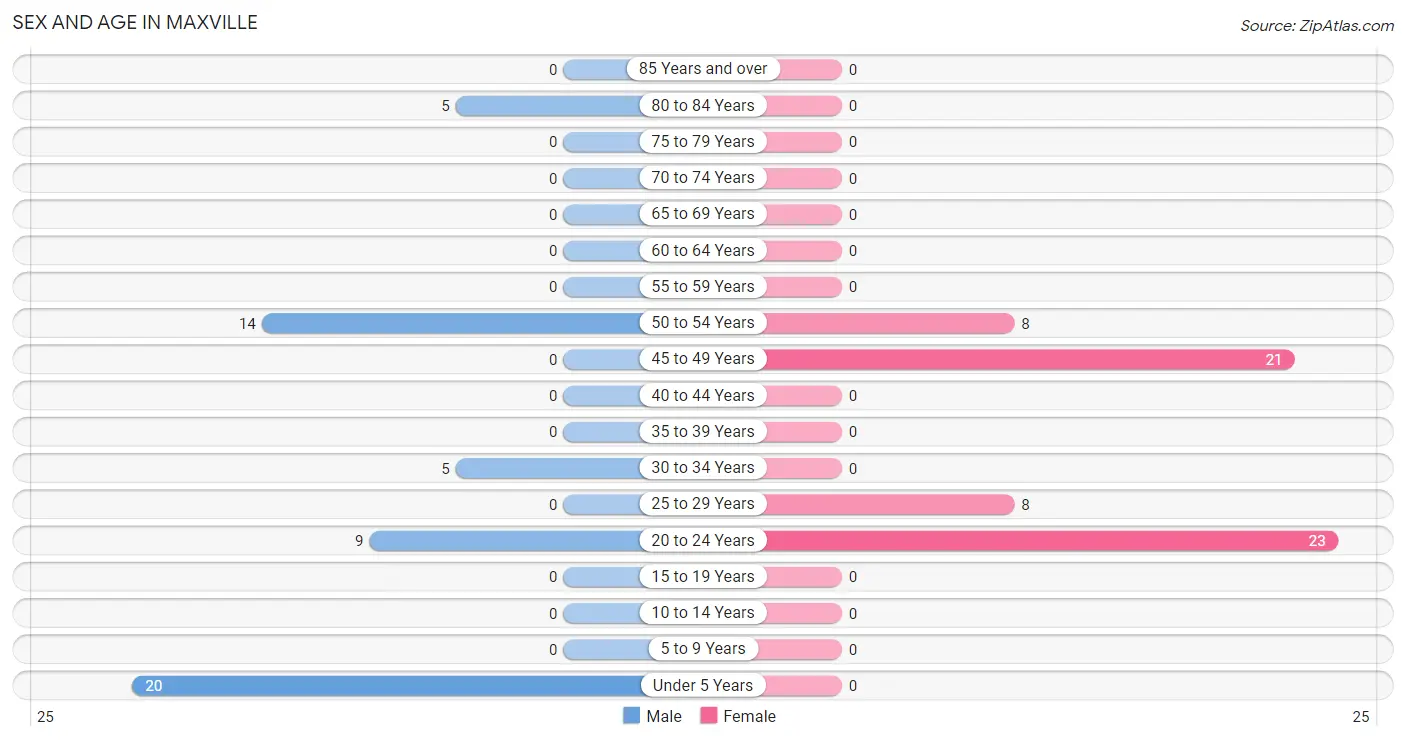
| Age Bracket | Male | Female |
| Under 5 Years | 20 (37.7%) | 0 (0.0%) |
| 5 to 9 Years | 0 (0.0%) | 0 (0.0%) |
| 10 to 14 Years | 0 (0.0%) | 0 (0.0%) |
| 15 to 19 Years | 0 (0.0%) | 0 (0.0%) |
| 20 to 24 Years | 9 (17.0%) | 23 (38.3%) |
| 25 to 29 Years | 0 (0.0%) | 8 (13.3%) |
| 30 to 34 Years | 5 (9.4%) | 0 (0.0%) |
| 35 to 39 Years | 0 (0.0%) | 0 (0.0%) |
| 40 to 44 Years | 0 (0.0%) | 0 (0.0%) |
| 45 to 49 Years | 0 (0.0%) | 21 (35.0%) |
| 50 to 54 Years | 14 (26.4%) | 8 (13.3%) |
| 55 to 59 Years | 0 (0.0%) | 0 (0.0%) |
| 60 to 64 Years | 0 (0.0%) | 0 (0.0%) |
| 65 to 69 Years | 0 (0.0%) | 0 (0.0%) |
| 70 to 74 Years | 0 (0.0%) | 0 (0.0%) |
| 75 to 79 Years | 0 (0.0%) | 0 (0.0%) |
| 80 to 84 Years | 5 (9.4%) | 0 (0.0%) |
| 85 Years and over | 0 (0.0%) | 0 (0.0%) |
| Total | 53 (100.0%) | 60 (100.0%) |
Families and Households in Maxville
Median Family Size in Maxville
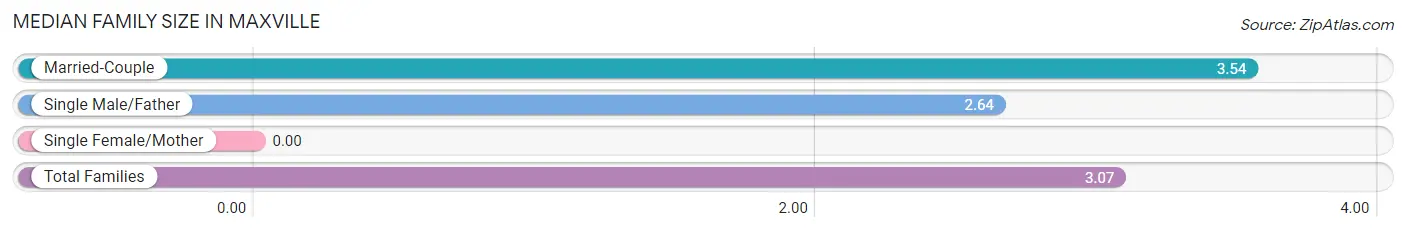
| Family Type | # Families | Family Size |
| Married-Couple | 13 (48.1%) | 3.54 |
| Single Male/Father | 14 (51.8%) | 2.64 |
| Single Female/Mother | 0 (0.0%) | - |
| Total Families | 27 (100.0%) | 3.07 |
Median Household Size in Maxville
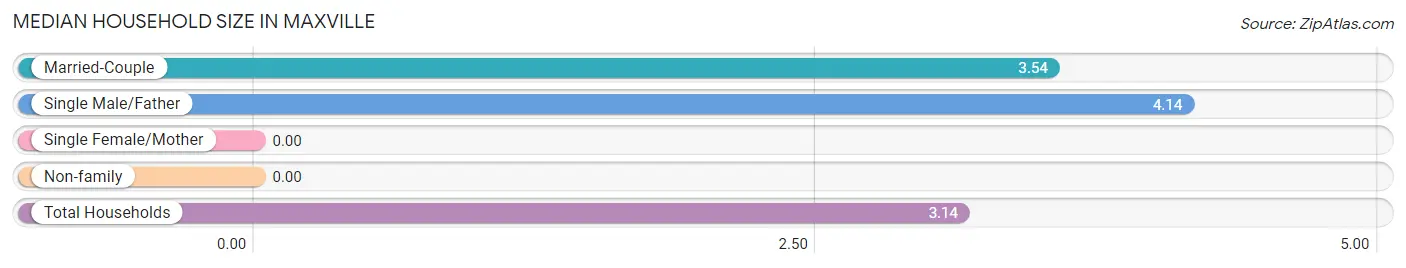
| Household Type | # Households | Household Size |
| Married-Couple | 13 (36.1%) | 3.54 |
| Single Male/Father | 14 (38.9%) | 4.14 |
| Single Female/Mother | 0 (0.0%) | - |
| Non-family | 9 (25.0%) | - |
| Total Households | 36 (100.0%) | 3.14 |
Household Size by Marriage Status in Maxville
Out of a total of 36 households in Maxville, 27 (75.0%) are family households, while 9 (25.0%) are nonfamily households. The most numerous type of family households are 3-person households, comprising 22, and the most common type of nonfamily households are 1-person households, comprising 9.
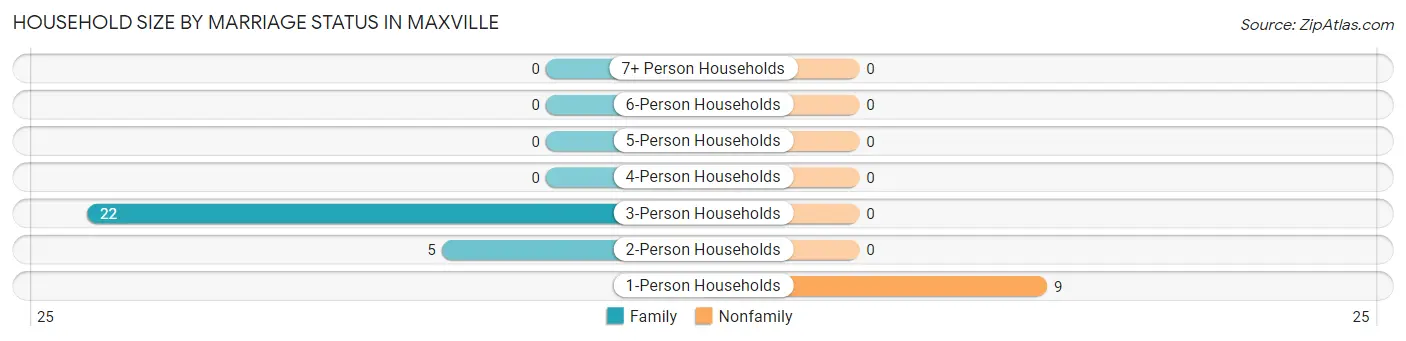
| Household Size | Family Households | Nonfamily Households |
| 1-Person Households | - | 9 (25.0%) |
| 2-Person Households | 5 (13.9%) | 0 (0.0%) |
| 3-Person Households | 22 (61.1%) | 0 (0.0%) |
| 4-Person Households | 0 (0.0%) | 0 (0.0%) |
| 5-Person Households | 0 (0.0%) | 0 (0.0%) |
| 6-Person Households | 0 (0.0%) | 0 (0.0%) |
| 7+ Person Households | 0 (0.0%) | 0 (0.0%) |
| Total | 27 (75.0%) | 9 (25.0%) |
Female Fertility in Maxville
Fertility by Age in Maxville
| Age Bracket | Women with Births | Births / 1,000 Women |
| 15 to 19 years | 0 (0.0%) | 0.0 |
| 20 to 34 years | 0 (0.0%) | 0.0 |
| 35 to 50 years | 0 (0.0%) | 0.0 |
| Total | 0 (0.0%) | 0.0 |
Fertility by Age by Marriage Status in Maxville
| Age Bracket | Married | Unmarried |
| 15 to 19 years | 0 (0.0%) | 0 (0.0%) |
| 20 to 34 years | 0 (0.0%) | 0 (0.0%) |
| 35 to 50 years | 0 (0.0%) | 0 (0.0%) |
| Total | 0 (0.0%) | 0 (0.0%) |
Fertility by Education in Maxville
| Educational Attainment | Women with Births | Births / 1,000 Women |
| Less than High School | 0 (0.0%) | 0.0 |
| High School Diploma | 0 (0.0%) | 0.0 |
| College or Associate's Degree | 0 (0.0%) | 0.0 |
| Bachelor's Degree | 0 (0.0%) | 0.0 |
| Graduate Degree | 0 (0.0%) | 0.0 |
| Total | 0 (0.0%) | 0.0 |
Fertility by Education by Marriage Status in Maxville
| Educational Attainment | Married | Unmarried |
| Less than High School | 0 (0.0%) | 0 (0.0%) |
| High School Diploma | 0 (0.0%) | 0 (0.0%) |
| College or Associate's Degree | 0 (0.0%) | 0 (0.0%) |
| Bachelor's Degree | 0 (0.0%) | 0 (0.0%) |
| Graduate Degree | 0 (0.0%) | 0 (0.0%) |
| Total | 0 (0.0%) | 0 (0.0%) |
Employment Characteristics in Maxville
Employment by Class of Employer in Maxville
Among the 61 employed individuals in Maxville, private company employees (35 | 57.4%), self-employed (incorporated) (14 | 23.0%), and self-employed (not incorporated) (8 | 13.1%) make up the most common classes of employment.
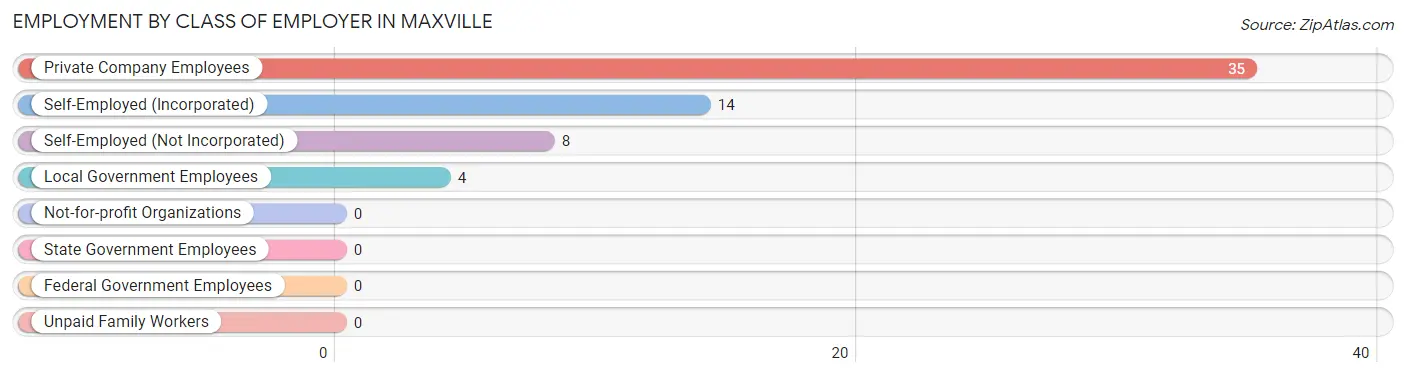
| Employer Class | # Employees | % Employees |
| Private Company Employees | 35 | 57.4% |
| Self-Employed (Incorporated) | 14 | 23.0% |
| Self-Employed (Not Incorporated) | 8 | 13.1% |
| Not-for-profit Organizations | 0 | 0.0% |
| Local Government Employees | 4 | 6.6% |
| State Government Employees | 0 | 0.0% |
| Federal Government Employees | 0 | 0.0% |
| Unpaid Family Workers | 0 | 0.0% |
| Total | 61 | 100.0% |
Employment Status by Age in Maxville
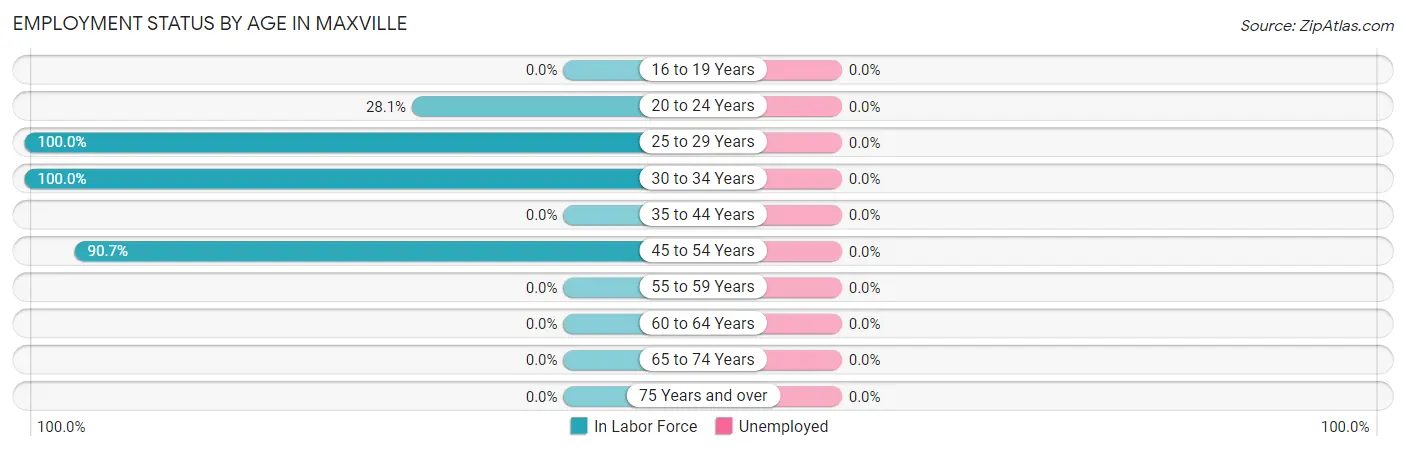
| Age Bracket | In Labor Force | Unemployed |
| 16 to 19 Years | 0 (0.0%) | 0 (0.0%) |
| 20 to 24 Years | 9 (28.1%) | 0 (0.0%) |
| 25 to 29 Years | 8 (100.0%) | 0 (0.0%) |
| 30 to 34 Years | 5 (100.0%) | 0 (0.0%) |
| 35 to 44 Years | 0 (0.0%) | 0 (0.0%) |
| 45 to 54 Years | 39 (90.7%) | 0 (0.0%) |
| 55 to 59 Years | 0 (0.0%) | 0 (0.0%) |
| 60 to 64 Years | 0 (0.0%) | 0 (0.0%) |
| 65 to 74 Years | 0 (0.0%) | 0 (0.0%) |
| 75 Years and over | 0 (0.0%) | 0 (0.0%) |
| Total | 61 (65.6%) | 0 (0.0%) |
Employment Status by Educational Attainment in Maxville
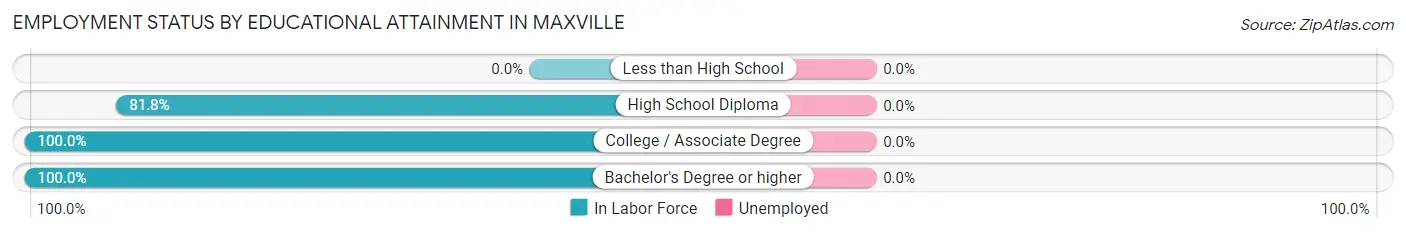
| Educational Attainment | In Labor Force | Unemployed |
| Less than High School | 0 (0.0%) | 0 (0.0%) |
| High School Diploma | 18 (81.8%) | 0 (0.0%) |
| College / Associate Degree | 29 (100.0%) | 0 (0.0%) |
| Bachelor's Degree or higher | 5 (100.0%) | 0 (0.0%) |
| Total | 52 (92.9%) | 0 (0.0%) |
Employment Occupations by Sex in Maxville
Management, Business, Science and Arts Occupations
The most common Management, Business, Science and Arts occupations in Maxville are , and Management (35 | 57.4%).
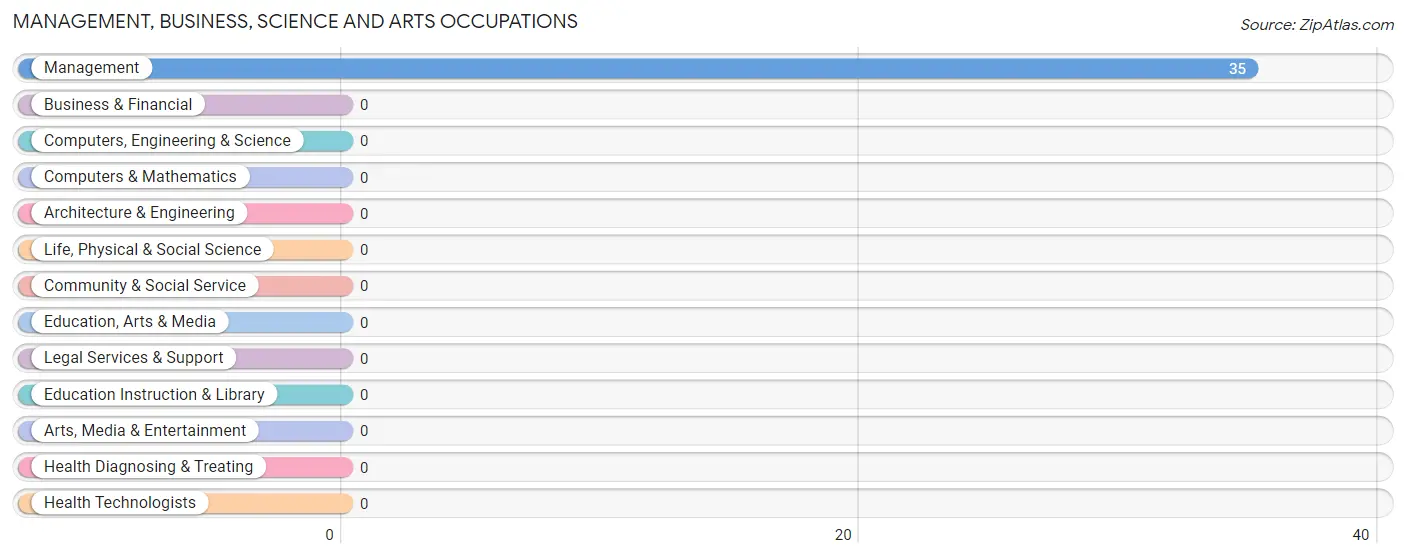
Management, Business, Science and Arts Occupations by Sex
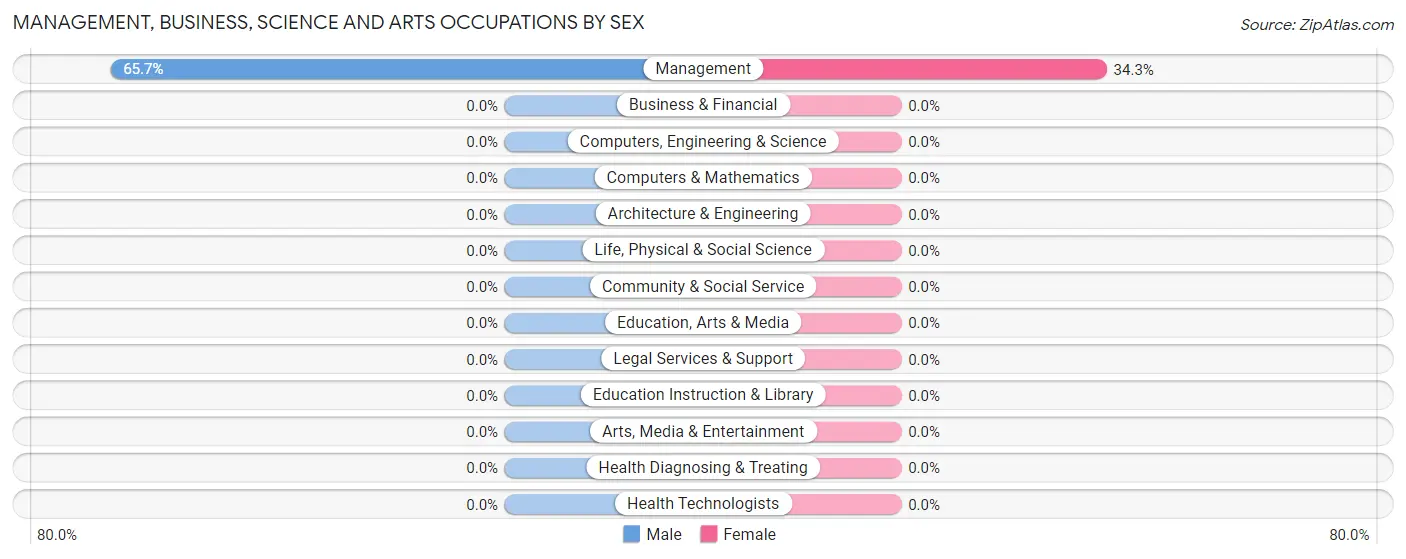
| Occupation | Male | Female |
| Management | 23 (65.7%) | 12 (34.3%) |
| Business & Financial | 0 (0.0%) | 0 (0.0%) |
| Computers, Engineering & Science | 0 (0.0%) | 0 (0.0%) |
| Computers & Mathematics | 0 (0.0%) | 0 (0.0%) |
| Architecture & Engineering | 0 (0.0%) | 0 (0.0%) |
| Life, Physical & Social Science | 0 (0.0%) | 0 (0.0%) |
| Community & Social Service | 0 (0.0%) | 0 (0.0%) |
| Education, Arts & Media | 0 (0.0%) | 0 (0.0%) |
| Legal Services & Support | 0 (0.0%) | 0 (0.0%) |
| Education Instruction & Library | 0 (0.0%) | 0 (0.0%) |
| Arts, Media & Entertainment | 0 (0.0%) | 0 (0.0%) |
| Health Diagnosing & Treating | 0 (0.0%) | 0 (0.0%) |
| Health Technologists | 0 (0.0%) | 0 (0.0%) |
| Total (Category) | 23 (65.7%) | 12 (34.3%) |
| Total (Overall) | 28 (45.9%) | 33 (54.1%) |
Services Occupations
Services Occupations by Sex
| Occupation | Male | Female |
| Healthcare Support | 0 (0.0%) | 0 (0.0%) |
| Security & Protection | 0 (0.0%) | 0 (0.0%) |
| Firefighting & Prevention | 0 (0.0%) | 0 (0.0%) |
| Law Enforcement | 0 (0.0%) | 0 (0.0%) |
| Food Preparation & Serving | 0 (0.0%) | 0 (0.0%) |
| Cleaning & Maintenance | 0 (0.0%) | 0 (0.0%) |
| Personal Care & Service | 0 (0.0%) | 0 (0.0%) |
| Total (Category) | 0 (0.0%) | 0 (0.0%) |
| Total (Overall) | 28 (45.9%) | 33 (54.1%) |
Sales and Office Occupations
The most common Sales and Office occupations in Maxville are , and Office & Administration (21 | 34.4%).

Sales and Office Occupations by Sex

| Occupation | Male | Female |
| Sales & Related | 0 (0.0%) | 0 (0.0%) |
| Office & Administration | 0 (0.0%) | 21 (100.0%) |
| Total (Category) | 0 (0.0%) | 21 (100.0%) |
| Total (Overall) | 28 (45.9%) | 33 (54.1%) |
Natural Resources, Construction and Maintenance Occupations
The most common Natural Resources, Construction and Maintenance occupations in Maxville are , and Construction & Extraction (5 | 8.2%).
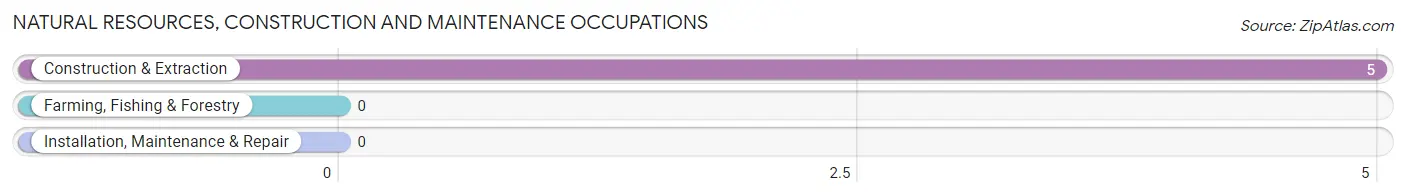
Natural Resources, Construction and Maintenance Occupations by Sex

| Occupation | Male | Female |
| Farming, Fishing & Forestry | 0 (0.0%) | 0 (0.0%) |
| Construction & Extraction | 5 (100.0%) | 0 (0.0%) |
| Installation, Maintenance & Repair | 0 (0.0%) | 0 (0.0%) |
| Total (Category) | 5 (100.0%) | 0 (0.0%) |
| Total (Overall) | 28 (45.9%) | 33 (54.1%) |
Production, Transportation and Moving Occupations
Production, Transportation and Moving Occupations by Sex
| Occupation | Male | Female |
| Production | 0 (0.0%) | 0 (0.0%) |
| Transportation | 0 (0.0%) | 0 (0.0%) |
| Material Moving | 0 (0.0%) | 0 (0.0%) |
| Total (Category) | 0 (0.0%) | 0 (0.0%) |
| Total (Overall) | 28 (45.9%) | 33 (54.1%) |
Employment Industries by Sex in Maxville
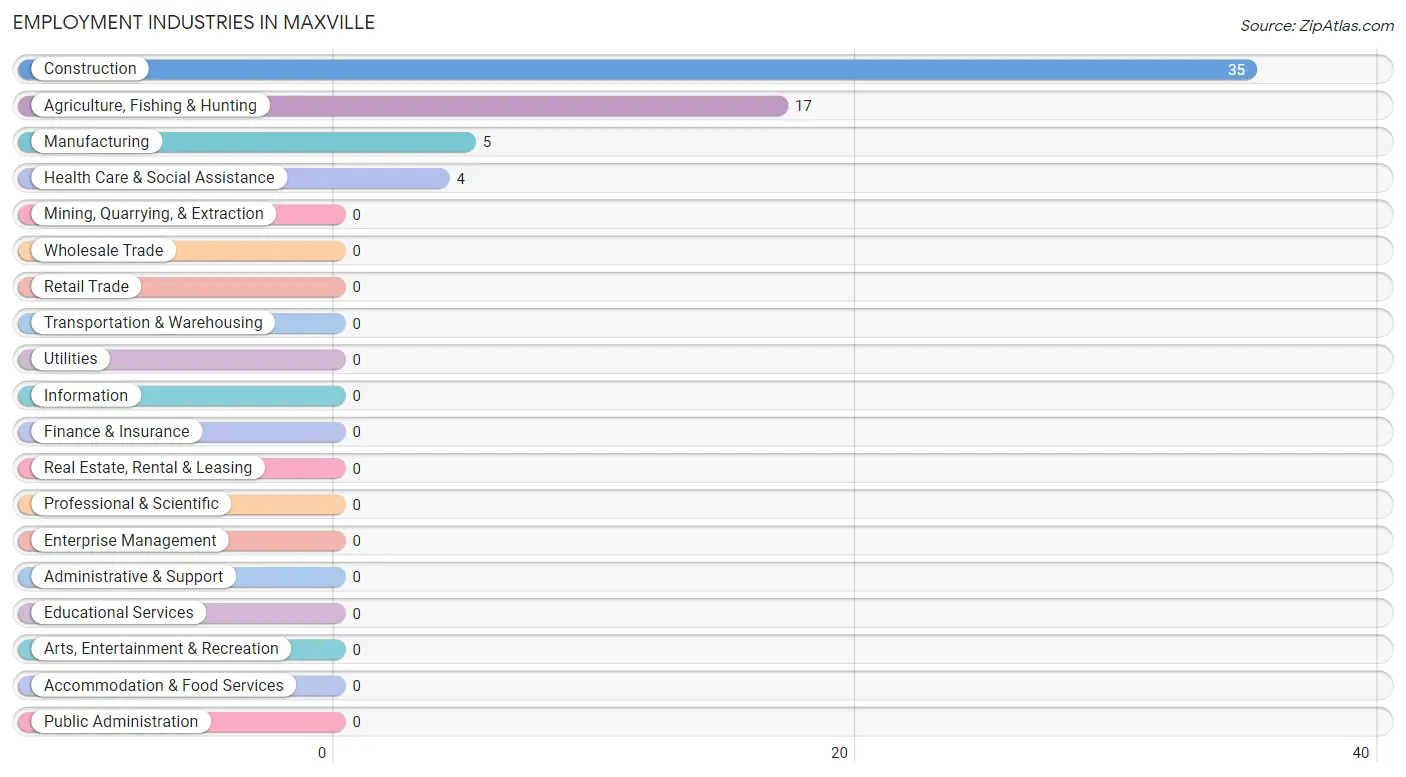
Employment Industries in Maxville
The major employment industries in Maxville include Construction (35 | 57.4%), Agriculture, Fishing & Hunting (17 | 27.9%), Manufacturing (5 | 8.2%), and Health Care & Social Assistance (4 | 6.6%).
Employment Industries by Sex in Maxville
The Maxville industries that see more men than women are Manufacturing (100.0%), Agriculture, Fishing & Hunting (52.9%), and Construction (40.0%), whereas the industries that tend to have a higher number of women are Health Care & Social Assistance (100.0%), Construction (60.0%), and Agriculture, Fishing & Hunting (47.1%).
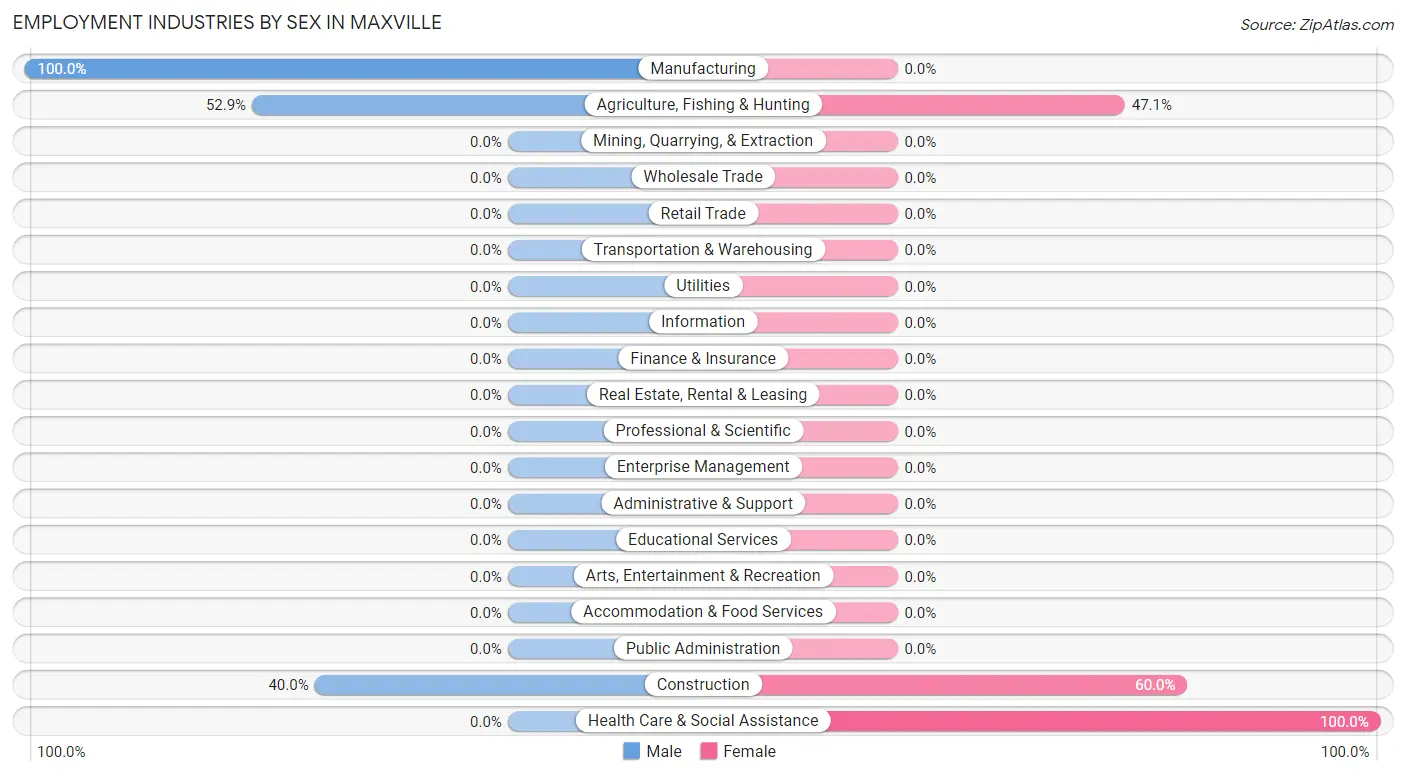
| Industry | Male | Female |
| Agriculture, Fishing & Hunting | 9 (52.9%) | 8 (47.1%) |
| Mining, Quarrying, & Extraction | 0 (0.0%) | 0 (0.0%) |
| Construction | 14 (40.0%) | 21 (60.0%) |
| Manufacturing | 5 (100.0%) | 0 (0.0%) |
| Wholesale Trade | 0 (0.0%) | 0 (0.0%) |
| Retail Trade | 0 (0.0%) | 0 (0.0%) |
| Transportation & Warehousing | 0 (0.0%) | 0 (0.0%) |
| Utilities | 0 (0.0%) | 0 (0.0%) |
| Information | 0 (0.0%) | 0 (0.0%) |
| Finance & Insurance | 0 (0.0%) | 0 (0.0%) |
| Real Estate, Rental & Leasing | 0 (0.0%) | 0 (0.0%) |
| Professional & Scientific | 0 (0.0%) | 0 (0.0%) |
| Enterprise Management | 0 (0.0%) | 0 (0.0%) |
| Administrative & Support | 0 (0.0%) | 0 (0.0%) |
| Educational Services | 0 (0.0%) | 0 (0.0%) |
| Health Care & Social Assistance | 0 (0.0%) | 4 (100.0%) |
| Arts, Entertainment & Recreation | 0 (0.0%) | 0 (0.0%) |
| Accommodation & Food Services | 0 (0.0%) | 0 (0.0%) |
| Public Administration | 0 (0.0%) | 0 (0.0%) |
| Total | 28 (45.9%) | 33 (54.1%) |
Education in Maxville
School Enrollment in Maxville
| School Level | # Students | % Students |
| Nursery / Preschool | 0 | 0.0% |
| Kindergarten | 0 | 0.0% |
| Elementary School | 0 | 0.0% |
| Middle School | 0 | 0.0% |
| High School | 0 | 0.0% |
| College / Undergraduate | 0 | 0.0% |
| Graduate / Professional | 0 | 0.0% |
| Total | 0 | 0.0% |
School Enrollment by Age by Funding Source in Maxville
| Age Bracket | Public School | Private School |
| 3 to 4 Year Olds | 0 (0.0%) | 0 (0.0%) |
| 5 to 9 Year Old | 0 (0.0%) | 0 (0.0%) |
| 10 to 14 Year Olds | 0 (0.0%) | 0 (0.0%) |
| 15 to 17 Year Olds | 0 (0.0%) | 0 (0.0%) |
| 18 to 19 Year Olds | 0 (0.0%) | 0 (0.0%) |
| 20 to 24 Year Olds | 0 (0.0%) | 0 (0.0%) |
| 25 to 34 Year Olds | 0 (0.0%) | 0 (0.0%) |
| 35 Years and over | 0 (0.0%) | 0 (0.0%) |
| Total | 0 (0.0%) | 0 (0.0%) |
Educational Attainment by Field of Study in Maxville
, and bio, nature & agricultural (5 | 100.0%) are the most common fields of study among 5 individuals in Maxville who have obtained a bachelor's degree or higher.
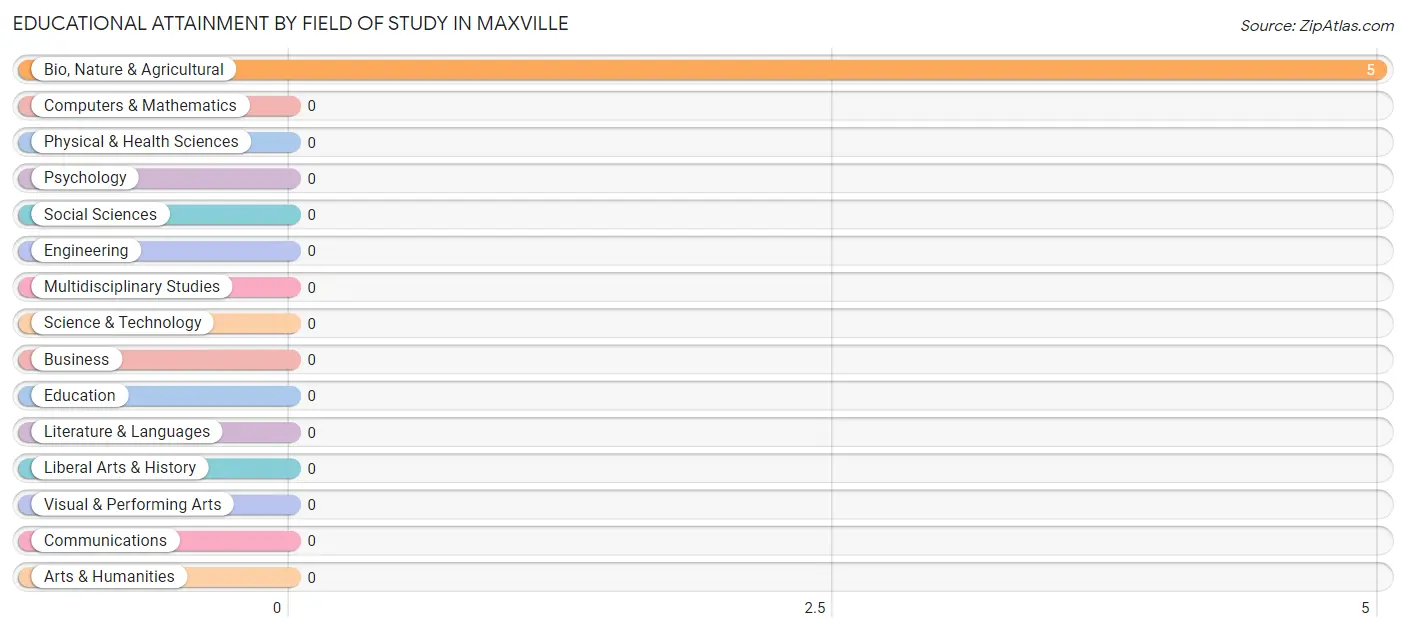
| Field of Study | # Graduates | % Graduates |
| Computers & Mathematics | 0 | 0.0% |
| Bio, Nature & Agricultural | 5 | 100.0% |
| Physical & Health Sciences | 0 | 0.0% |
| Psychology | 0 | 0.0% |
| Social Sciences | 0 | 0.0% |
| Engineering | 0 | 0.0% |
| Multidisciplinary Studies | 0 | 0.0% |
| Science & Technology | 0 | 0.0% |
| Business | 0 | 0.0% |
| Education | 0 | 0.0% |
| Literature & Languages | 0 | 0.0% |
| Liberal Arts & History | 0 | 0.0% |
| Visual & Performing Arts | 0 | 0.0% |
| Communications | 0 | 0.0% |
| Arts & Humanities | 0 | 0.0% |
| Total | 5 | 100.0% |
Transportation & Commute in Maxville
Vehicle Availability by Sex in Maxville
The most prevalent vehicle ownership categories in Maxville are males with 4 vehicles (14, accounting for 50.0%) and females with 4 vehicles (21, making up 42.4%).
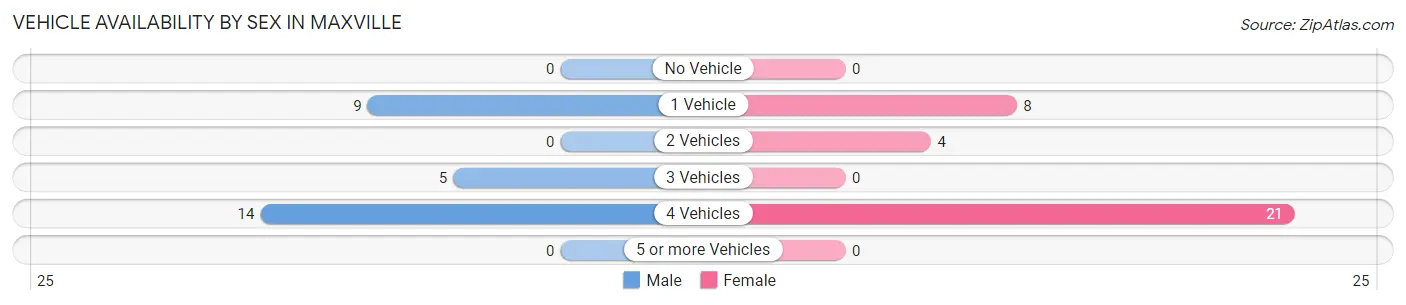
| Vehicles Available | Male | Female |
| No Vehicle | 0 (0.0%) | 0 (0.0%) |
| 1 Vehicle | 9 (32.1%) | 8 (24.2%) |
| 2 Vehicles | 0 (0.0%) | 4 (12.1%) |
| 3 Vehicles | 5 (17.9%) | 0 (0.0%) |
| 4 Vehicles | 14 (50.0%) | 21 (63.6%) |
| 5 or more Vehicles | 0 (0.0%) | 0 (0.0%) |
| Total | 28 (100.0%) | 33 (100.0%) |
Commute Time in Maxville
The most frequently occuring commute durations in Maxville are 15 to 19 minutes (35 commuters, 57.4%), less than 5 minutes (17 commuters, 27.9%), and 40 to 44 minutes (5 commuters, 8.2%).
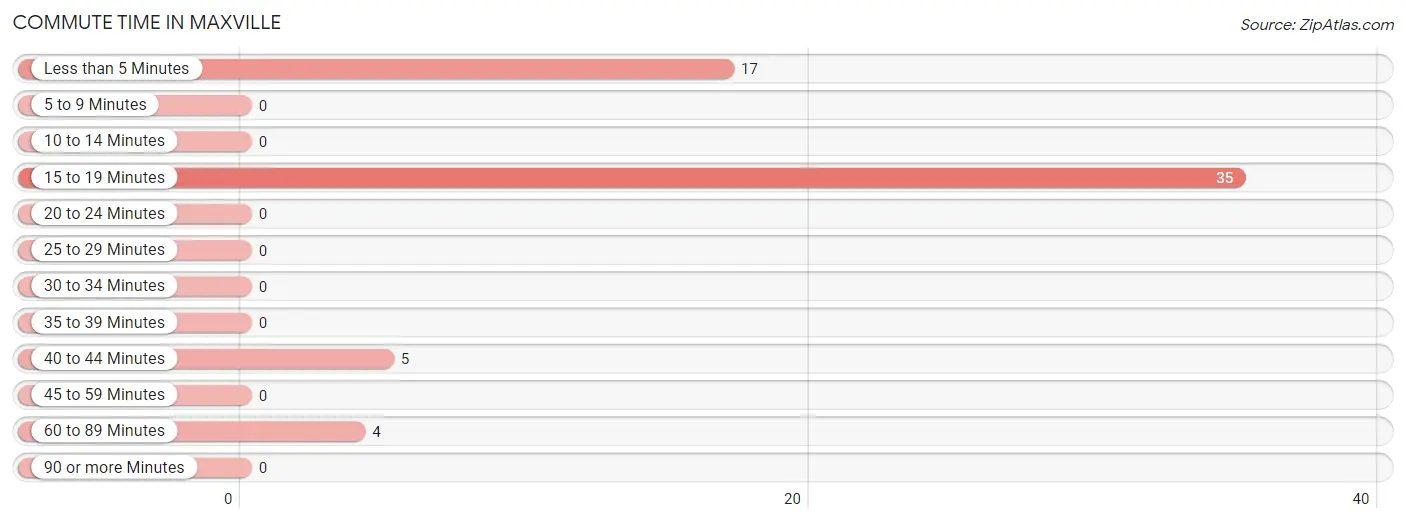
| Commute Time | # Commuters | % Commuters |
| Less than 5 Minutes | 17 | 27.9% |
| 5 to 9 Minutes | 0 | 0.0% |
| 10 to 14 Minutes | 0 | 0.0% |
| 15 to 19 Minutes | 35 | 57.4% |
| 20 to 24 Minutes | 0 | 0.0% |
| 25 to 29 Minutes | 0 | 0.0% |
| 30 to 34 Minutes | 0 | 0.0% |
| 35 to 39 Minutes | 0 | 0.0% |
| 40 to 44 Minutes | 5 | 8.2% |
| 45 to 59 Minutes | 0 | 0.0% |
| 60 to 89 Minutes | 4 | 6.6% |
| 90 or more Minutes | 0 | 0.0% |
Commute Time by Sex in Maxville
The most common commute times in Maxville are 15 to 19 minutes (14 commuters, 50.0%) for males and 15 to 19 minutes (21 commuters, 63.6%) for females.
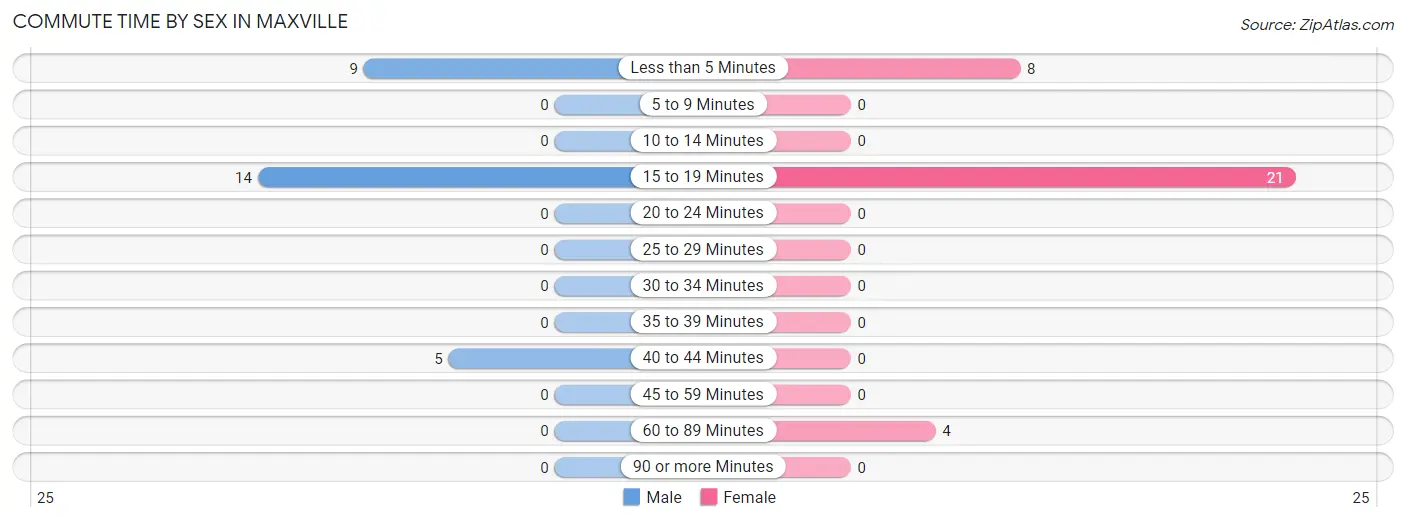
| Commute Time | Male | Female |
| Less than 5 Minutes | 9 (32.1%) | 8 (24.2%) |
| 5 to 9 Minutes | 0 (0.0%) | 0 (0.0%) |
| 10 to 14 Minutes | 0 (0.0%) | 0 (0.0%) |
| 15 to 19 Minutes | 14 (50.0%) | 21 (63.6%) |
| 20 to 24 Minutes | 0 (0.0%) | 0 (0.0%) |
| 25 to 29 Minutes | 0 (0.0%) | 0 (0.0%) |
| 30 to 34 Minutes | 0 (0.0%) | 0 (0.0%) |
| 35 to 39 Minutes | 0 (0.0%) | 0 (0.0%) |
| 40 to 44 Minutes | 5 (17.9%) | 0 (0.0%) |
| 45 to 59 Minutes | 0 (0.0%) | 0 (0.0%) |
| 60 to 89 Minutes | 0 (0.0%) | 4 (12.1%) |
| 90 or more Minutes | 0 (0.0%) | 0 (0.0%) |
Time of Departure to Work by Sex in Maxville
The most frequent times of departure to work in Maxville are 6:30 AM to 6:59 AM (14, 50.0%) for males and 9:00 AM to 9:59 AM (21, 63.6%) for females.
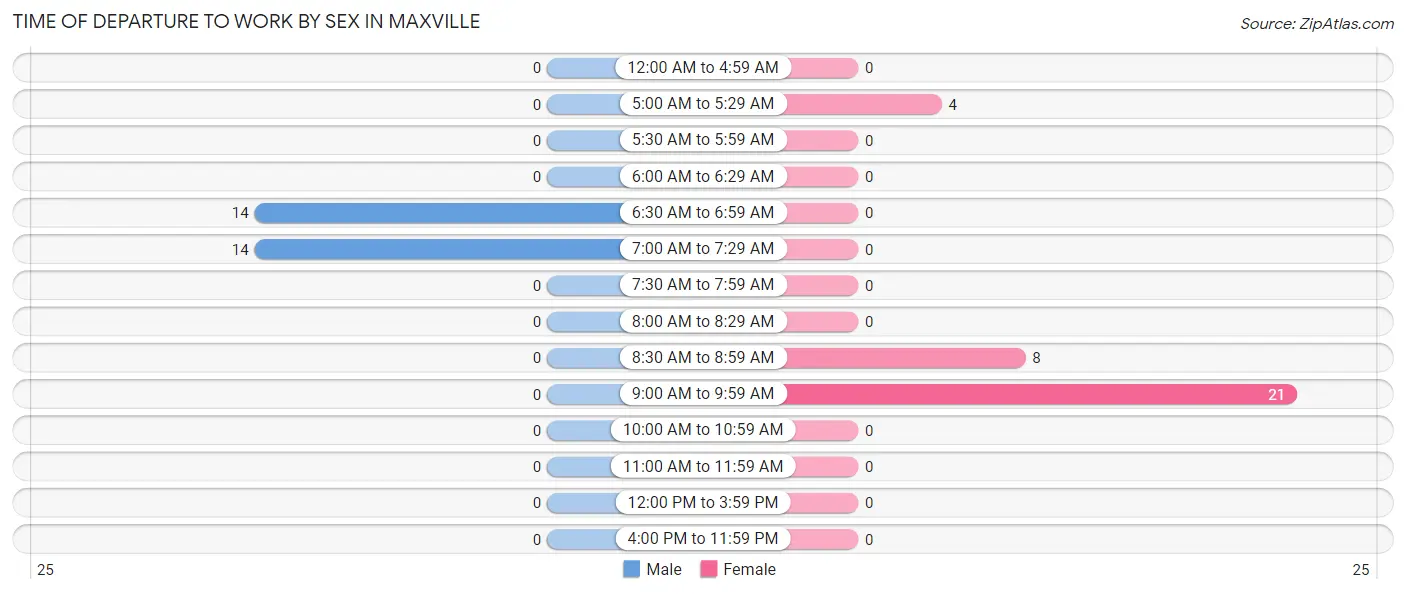
| Time of Departure | Male | Female |
| 12:00 AM to 4:59 AM | 0 (0.0%) | 0 (0.0%) |
| 5:00 AM to 5:29 AM | 0 (0.0%) | 4 (12.1%) |
| 5:30 AM to 5:59 AM | 0 (0.0%) | 0 (0.0%) |
| 6:00 AM to 6:29 AM | 0 (0.0%) | 0 (0.0%) |
| 6:30 AM to 6:59 AM | 14 (50.0%) | 0 (0.0%) |
| 7:00 AM to 7:29 AM | 14 (50.0%) | 0 (0.0%) |
| 7:30 AM to 7:59 AM | 0 (0.0%) | 0 (0.0%) |
| 8:00 AM to 8:29 AM | 0 (0.0%) | 0 (0.0%) |
| 8:30 AM to 8:59 AM | 0 (0.0%) | 8 (24.2%) |
| 9:00 AM to 9:59 AM | 0 (0.0%) | 21 (63.6%) |
| 10:00 AM to 10:59 AM | 0 (0.0%) | 0 (0.0%) |
| 11:00 AM to 11:59 AM | 0 (0.0%) | 0 (0.0%) |
| 12:00 PM to 3:59 PM | 0 (0.0%) | 0 (0.0%) |
| 4:00 PM to 11:59 PM | 0 (0.0%) | 0 (0.0%) |
| Total | 28 (100.0%) | 33 (100.0%) |
Housing Occupancy in Maxville
Occupancy by Ownership in Maxville
Of the total 36 dwellings in Maxville, owner-occupied units account for 24 (66.7%), while renter-occupied units make up 12 (33.3%).
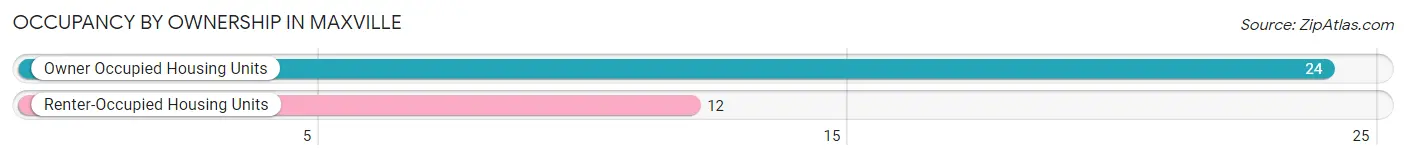
| Occupancy | # Housing Units | % Housing Units |
| Owner Occupied Housing Units | 24 | 66.7% |
| Renter-Occupied Housing Units | 12 | 33.3% |
| Total Occupied Housing Units | 36 | 100.0% |
Occupancy by Household Size in Maxville
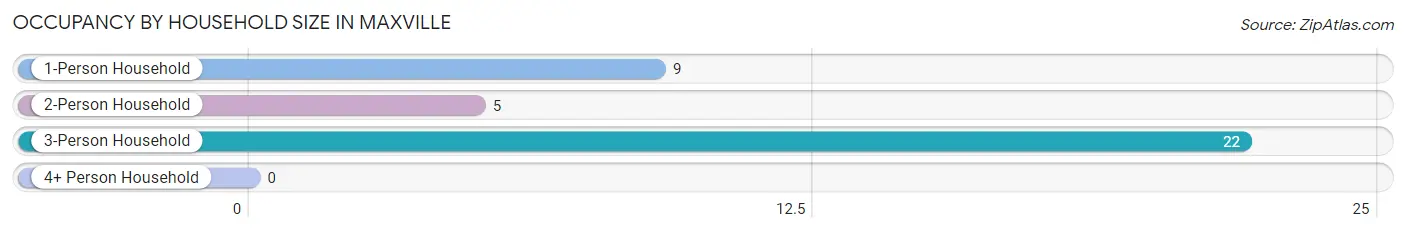
| Household Size | # Housing Units | % Housing Units |
| 1-Person Household | 9 | 25.0% |
| 2-Person Household | 5 | 13.9% |
| 3-Person Household | 22 | 61.1% |
| 4+ Person Household | 0 | 0.0% |
| Total Housing Units | 36 | 100.0% |
Occupancy by Ownership by Household Size in Maxville
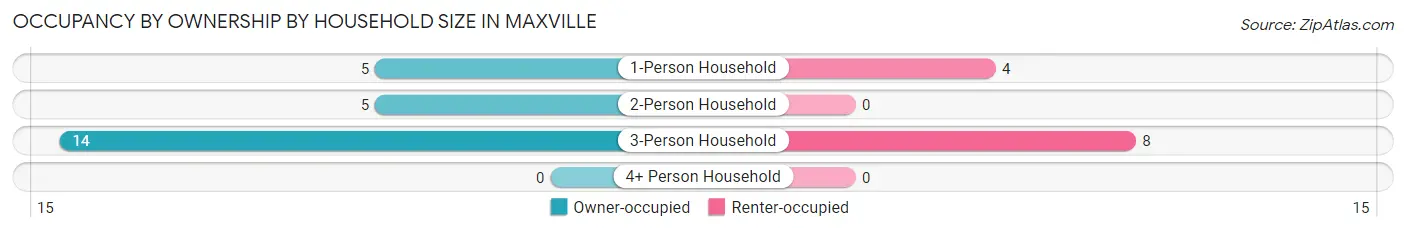
| Household Size | Owner-occupied | Renter-occupied |
| 1-Person Household | 5 (55.6%) | 4 (44.4%) |
| 2-Person Household | 5 (100.0%) | 0 (0.0%) |
| 3-Person Household | 14 (63.6%) | 8 (36.4%) |
| 4+ Person Household | 0 (0.0%) | 0 (0.0%) |
| Total Housing Units | 24 (66.7%) | 12 (33.3%) |
Occupancy by Educational Attainment in Maxville
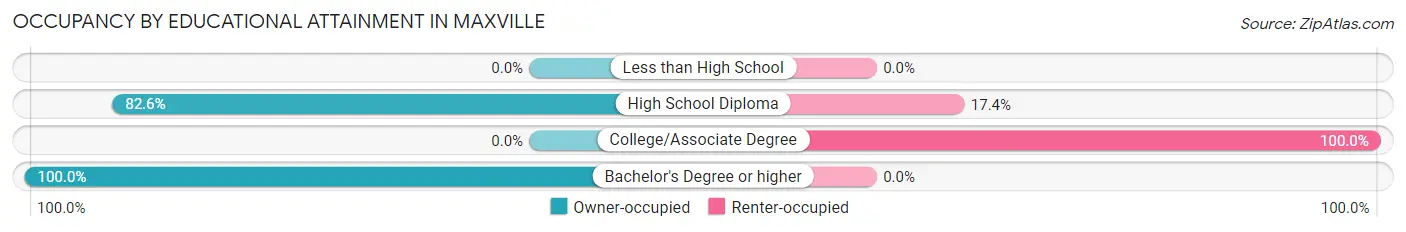
| Household Size | Owner-occupied | Renter-occupied |
| Less than High School | 0 (0.0%) | 0 (0.0%) |
| High School Diploma | 19 (82.6%) | 4 (17.4%) |
| College/Associate Degree | 0 (0.0%) | 8 (100.0%) |
| Bachelor's Degree or higher | 5 (100.0%) | 0 (0.0%) |
Occupancy by Age of Householder in Maxville
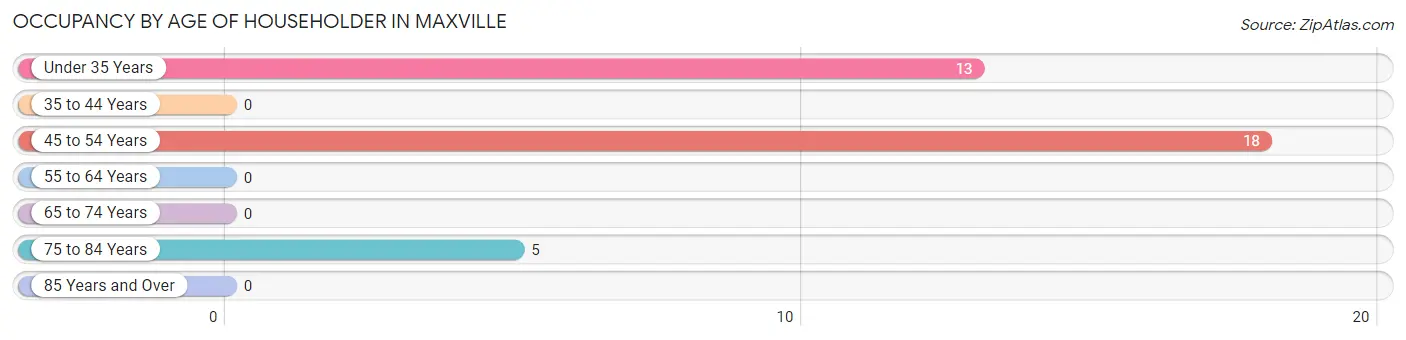
| Age Bracket | # Households | % Households |
| Under 35 Years | 13 | 36.1% |
| 35 to 44 Years | 0 | 0.0% |
| 45 to 54 Years | 18 | 50.0% |
| 55 to 64 Years | 0 | 0.0% |
| 65 to 74 Years | 0 | 0.0% |
| 75 to 84 Years | 5 | 13.9% |
| 85 Years and Over | 0 | 0.0% |
| Total | 36 | 100.0% |
Housing Finances in Maxville
Median Income by Occupancy in Maxville
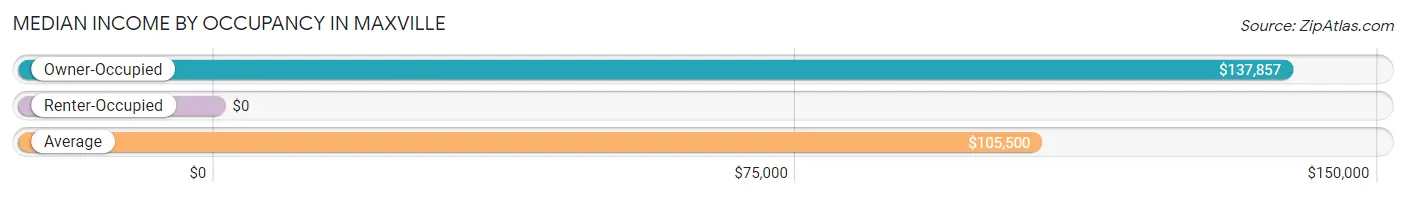
| Occupancy Type | # Households | Median Income |
| Owner-Occupied | 24 (66.7%) | $137,857 |
| Renter-Occupied | 12 (33.3%) | $0 |
| Average | 36 (100.0%) | $105,500 |
Occupancy by Householder Income Bracket in Maxville
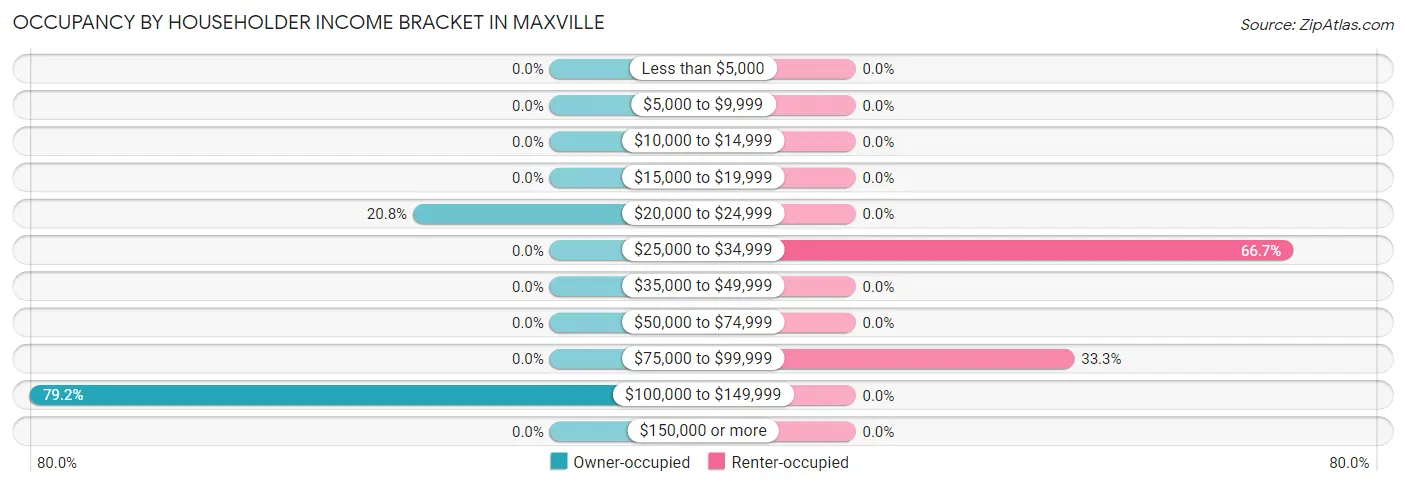
| Income Bracket | Owner-occupied | Renter-occupied |
| Less than $5,000 | 0 (0.0%) | 0 (0.0%) |
| $5,000 to $9,999 | 0 (0.0%) | 0 (0.0%) |
| $10,000 to $14,999 | 0 (0.0%) | 0 (0.0%) |
| $15,000 to $19,999 | 0 (0.0%) | 0 (0.0%) |
| $20,000 to $24,999 | 5 (20.8%) | 0 (0.0%) |
| $25,000 to $34,999 | 0 (0.0%) | 8 (66.7%) |
| $35,000 to $49,999 | 0 (0.0%) | 0 (0.0%) |
| $50,000 to $74,999 | 0 (0.0%) | 0 (0.0%) |
| $75,000 to $99,999 | 0 (0.0%) | 4 (33.3%) |
| $100,000 to $149,999 | 19 (79.2%) | 0 (0.0%) |
| $150,000 or more | 0 (0.0%) | 0 (0.0%) |
| Total | 24 (100.0%) | 12 (100.0%) |
Monthly Housing Cost Tiers in Maxville
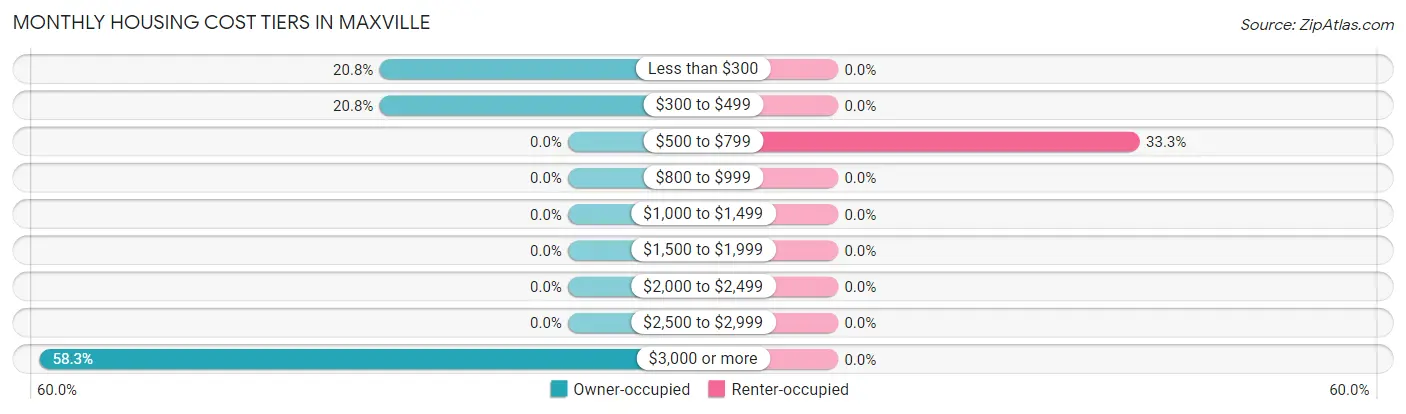
| Monthly Cost | Owner-occupied | Renter-occupied |
| Less than $300 | 5 (20.8%) | 0 (0.0%) |
| $300 to $499 | 5 (20.8%) | 0 (0.0%) |
| $500 to $799 | 0 (0.0%) | 4 (33.3%) |
| $800 to $999 | 0 (0.0%) | 0 (0.0%) |
| $1,000 to $1,499 | 0 (0.0%) | 0 (0.0%) |
| $1,500 to $1,999 | 0 (0.0%) | 0 (0.0%) |
| $2,000 to $2,499 | 0 (0.0%) | 0 (0.0%) |
| $2,500 to $2,999 | 0 (0.0%) | 0 (0.0%) |
| $3,000 or more | 14 (58.3%) | 0 (0.0%) |
| Total | 24 (100.0%) | 12 (100.0%) |
Physical Housing Characteristics in Maxville
Housing Structures in Maxville
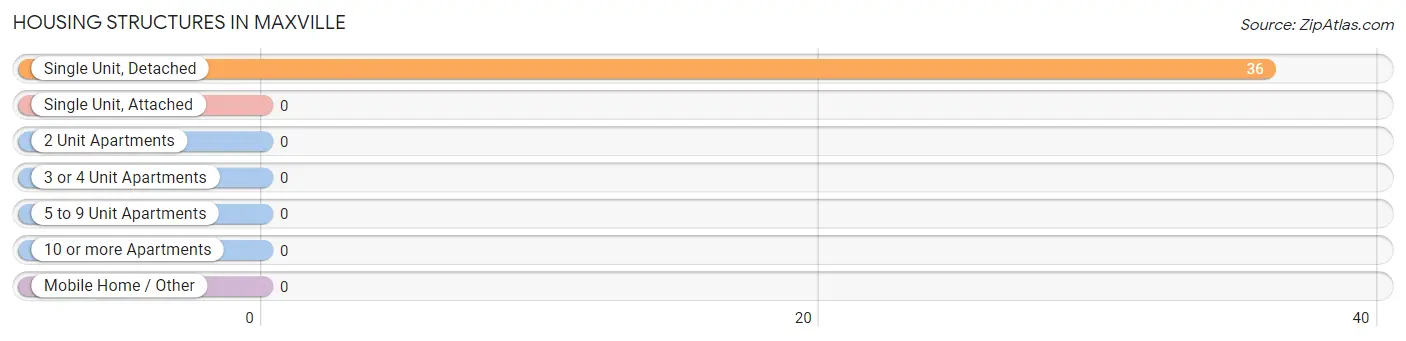
| Structure Type | # Housing Units | % Housing Units |
| Single Unit, Detached | 36 | 100.0% |
| Single Unit, Attached | 0 | 0.0% |
| 2 Unit Apartments | 0 | 0.0% |
| 3 or 4 Unit Apartments | 0 | 0.0% |
| 5 to 9 Unit Apartments | 0 | 0.0% |
| 10 or more Apartments | 0 | 0.0% |
| Mobile Home / Other | 0 | 0.0% |
| Total | 36 | 100.0% |
Housing Structures by Occupancy in Maxville
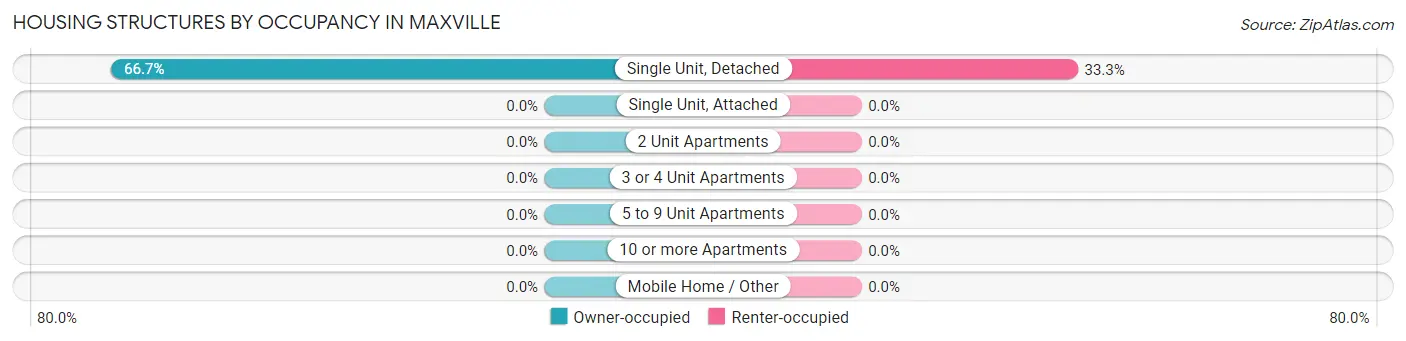
| Structure Type | Owner-occupied | Renter-occupied |
| Single Unit, Detached | 24 (66.7%) | 12 (33.3%) |
| Single Unit, Attached | 0 (0.0%) | 0 (0.0%) |
| 2 Unit Apartments | 0 (0.0%) | 0 (0.0%) |
| 3 or 4 Unit Apartments | 0 (0.0%) | 0 (0.0%) |
| 5 to 9 Unit Apartments | 0 (0.0%) | 0 (0.0%) |
| 10 or more Apartments | 0 (0.0%) | 0 (0.0%) |
| Mobile Home / Other | 0 (0.0%) | 0 (0.0%) |
| Total | 24 (66.7%) | 12 (33.3%) |
Housing Structures by Number of Rooms in Maxville
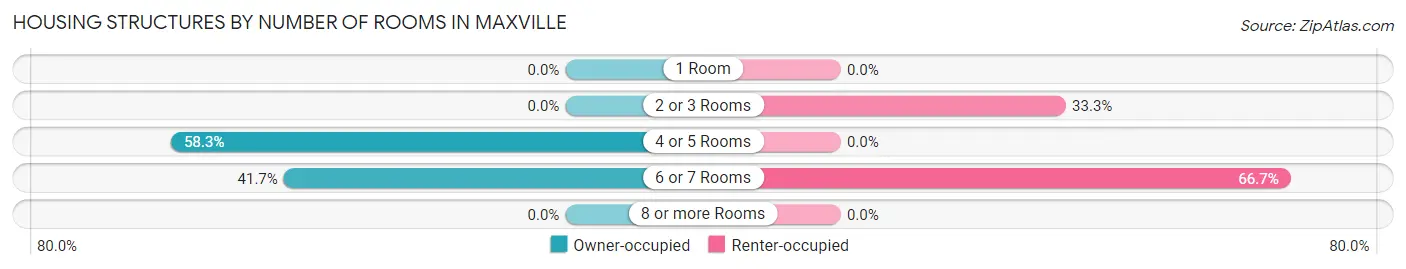
| Number of Rooms | Owner-occupied | Renter-occupied |
| 1 Room | 0 (0.0%) | 0 (0.0%) |
| 2 or 3 Rooms | 0 (0.0%) | 4 (33.3%) |
| 4 or 5 Rooms | 14 (58.3%) | 0 (0.0%) |
| 6 or 7 Rooms | 10 (41.7%) | 8 (66.7%) |
| 8 or more Rooms | 0 (0.0%) | 0 (0.0%) |
| Total | 24 (100.0%) | 12 (100.0%) |
Housing Structure by Heating Type in Maxville
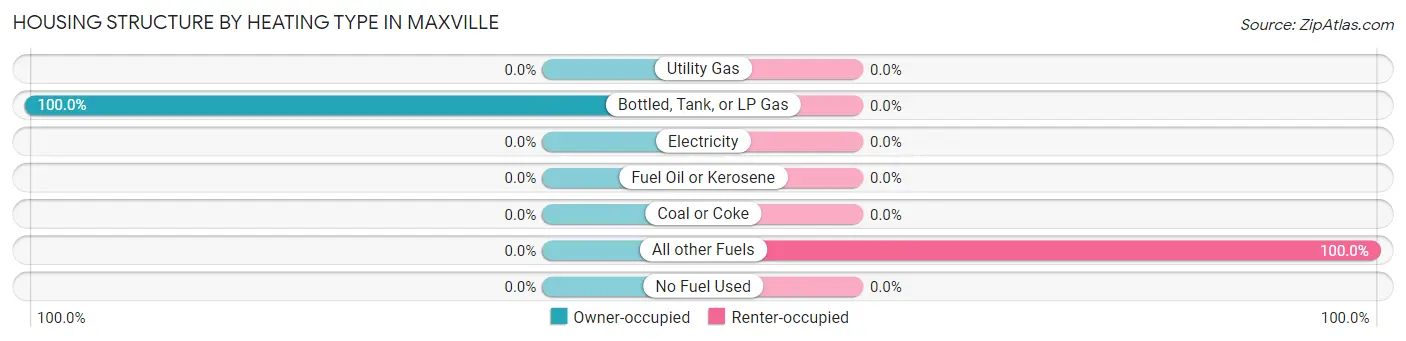
| Heating Type | Owner-occupied | Renter-occupied |
| Utility Gas | 0 (0.0%) | 0 (0.0%) |
| Bottled, Tank, or LP Gas | 24 (100.0%) | 0 (0.0%) |
| Electricity | 0 (0.0%) | 0 (0.0%) |
| Fuel Oil or Kerosene | 0 (0.0%) | 0 (0.0%) |
| Coal or Coke | 0 (0.0%) | 0 (0.0%) |
| All other Fuels | 0 (0.0%) | 12 (100.0%) |
| No Fuel Used | 0 (0.0%) | 0 (0.0%) |
| Total | 24 (100.0%) | 12 (100.0%) |
Household Vehicle Usage in Maxville
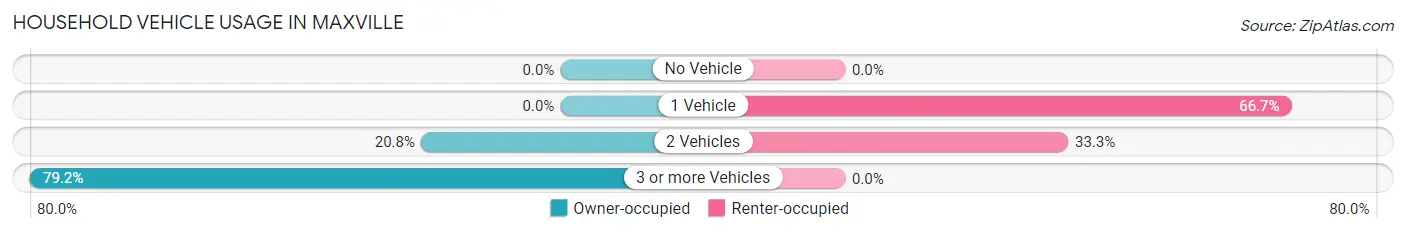
| Vehicles per Household | Owner-occupied | Renter-occupied |
| No Vehicle | 0 (0.0%) | 0 (0.0%) |
| 1 Vehicle | 0 (0.0%) | 8 (66.7%) |
| 2 Vehicles | 5 (20.8%) | 4 (33.3%) |
| 3 or more Vehicles | 19 (79.2%) | 0 (0.0%) |
| Total | 24 (100.0%) | 12 (100.0%) |
Real Estate & Mortgages in Maxville
Real Estate and Mortgage Overview in Maxville
| Characteristic | Without Mortgage | With Mortgage |
| Housing Units | 10 | 14 |
| Median Property Value | - | - |
| Median Household Income | - | - |
| Monthly Housing Costs | - | - |
| Real Estate Taxes | - | - |
Property Value by Mortgage Status in Maxville
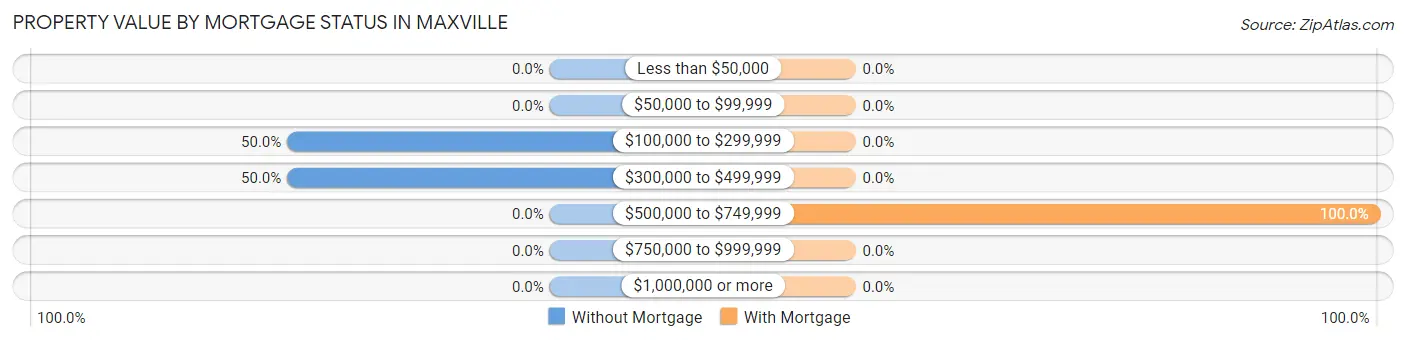
| Property Value | Without Mortgage | With Mortgage |
| Less than $50,000 | 0 (0.0%) | 0 (0.0%) |
| $50,000 to $99,999 | 0 (0.0%) | 0 (0.0%) |
| $100,000 to $299,999 | 5 (50.0%) | 0 (0.0%) |
| $300,000 to $499,999 | 5 (50.0%) | 0 (0.0%) |
| $500,000 to $749,999 | 0 (0.0%) | 14 (100.0%) |
| $750,000 to $999,999 | 0 (0.0%) | 0 (0.0%) |
| $1,000,000 or more | 0 (0.0%) | 0 (0.0%) |
| Total | 10 (100.0%) | 14 (100.0%) |
Household Income by Mortgage Status in Maxville
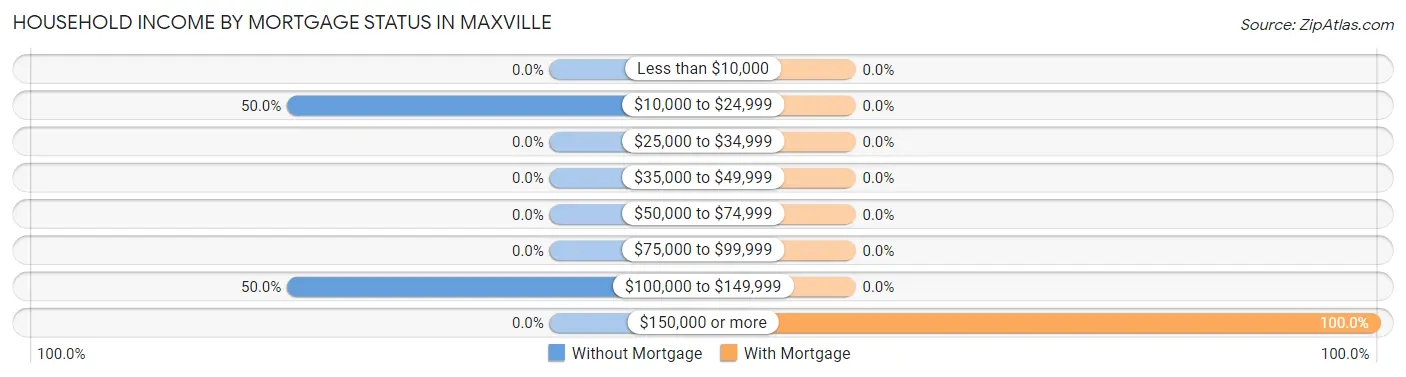
| Household Income | Without Mortgage | With Mortgage |
| Less than $10,000 | 0 (0.0%) | 0 (0.0%) |
| $10,000 to $24,999 | 5 (50.0%) | 0 (0.0%) |
| $25,000 to $34,999 | 0 (0.0%) | 0 (0.0%) |
| $35,000 to $49,999 | 0 (0.0%) | 0 (0.0%) |
| $50,000 to $74,999 | 0 (0.0%) | 0 (0.0%) |
| $75,000 to $99,999 | 0 (0.0%) | 0 (0.0%) |
| $100,000 to $149,999 | 5 (50.0%) | 0 (0.0%) |
| $150,000 or more | 0 (0.0%) | 14 (100.0%) |
| Total | 10 (100.0%) | 14 (100.0%) |
Property Value to Household Income Ratio in Maxville
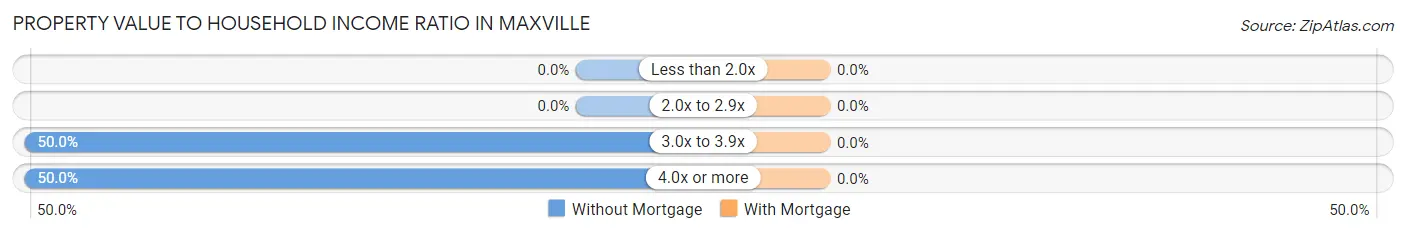
| Value-to-Income Ratio | Without Mortgage | With Mortgage |
| Less than 2.0x | 0 (0.0%) | 0 (0.0%) |
| 2.0x to 2.9x | 0 (0.0%) | 0 (0.0%) |
| 3.0x to 3.9x | 5 (50.0%) | 0 (0.0%) |
| 4.0x or more | 5 (50.0%) | 0 (0.0%) |
| Total | 10 (100.0%) | 14 (100.0%) |
Real Estate Taxes by Mortgage Status in Maxville
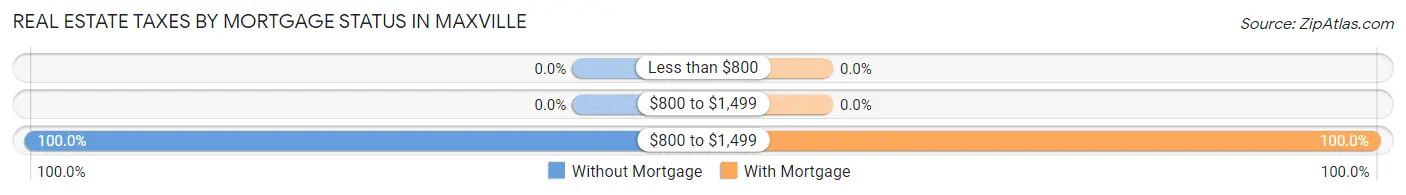
| Property Taxes | Without Mortgage | With Mortgage |
| Less than $800 | 0 (0.0%) | 0 (0.0%) |
| $800 to $1,499 | 0 (0.0%) | 0 (0.0%) |
| $800 to $1,499 | 10 (100.0%) | 14 (100.0%) |
| Total | 10 (100.0%) | 14 (100.0%) |
Health & Disability in Maxville
Health Insurance Coverage by Age in Maxville
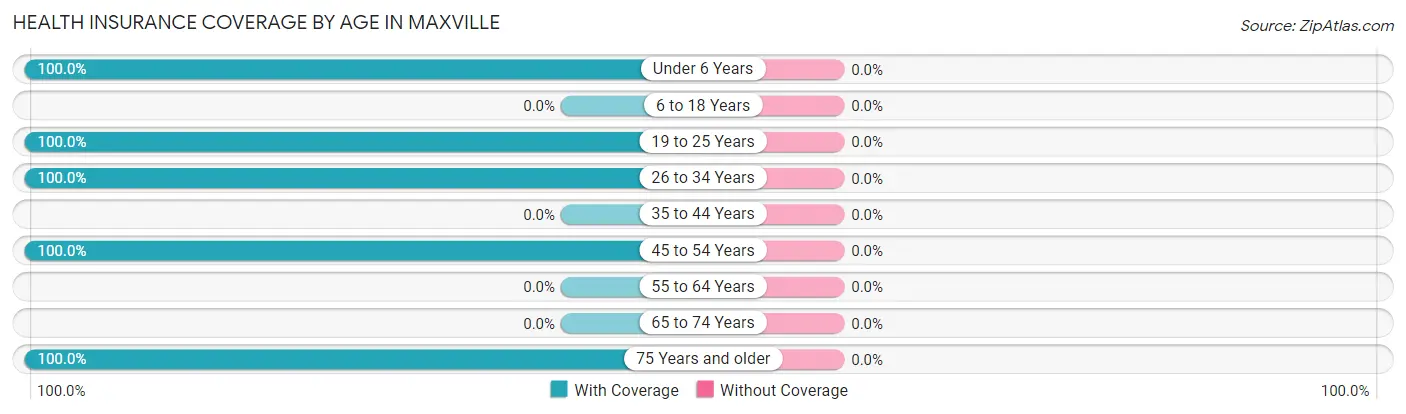
| Age Bracket | With Coverage | Without Coverage |
| Under 6 Years | 20 (100.0%) | 0 (0.0%) |
| 6 to 18 Years | 0 (0.0%) | 0 (0.0%) |
| 19 to 25 Years | 40 (100.0%) | 0 (0.0%) |
| 26 to 34 Years | 5 (100.0%) | 0 (0.0%) |
| 35 to 44 Years | 0 (0.0%) | 0 (0.0%) |
| 45 to 54 Years | 43 (100.0%) | 0 (0.0%) |
| 55 to 64 Years | 0 (0.0%) | 0 (0.0%) |
| 65 to 74 Years | 0 (0.0%) | 0 (0.0%) |
| 75 Years and older | 5 (100.0%) | 0 (0.0%) |
| Total | 113 (100.0%) | 0 (0.0%) |
Health Insurance Coverage by Citizenship Status in Maxville
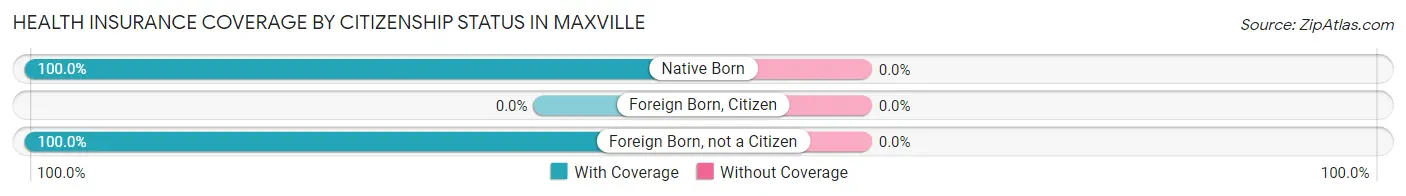
| Citizenship Status | With Coverage | Without Coverage |
| Native Born | 20 (100.0%) | 0 (0.0%) |
| Foreign Born, Citizen | 0 (0.0%) | 0 (0.0%) |
| Foreign Born, not a Citizen | 40 (100.0%) | 0 (0.0%) |
Health Insurance Coverage by Household Income in Maxville
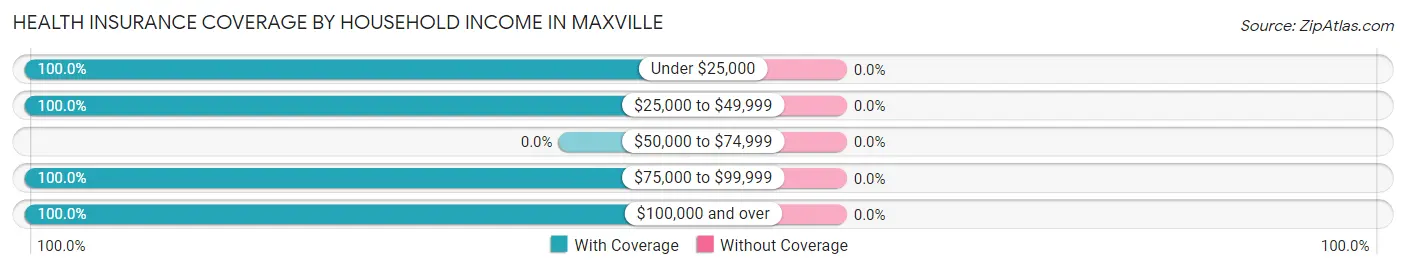
| Household Income | With Coverage | Without Coverage |
| Under $25,000 | 9 (100.0%) | 0 (0.0%) |
| $25,000 to $49,999 | 37 (100.0%) | 0 (0.0%) |
| $50,000 to $74,999 | 0 (0.0%) | 0 (0.0%) |
| $75,000 to $99,999 | 4 (100.0%) | 0 (0.0%) |
| $100,000 and over | 63 (100.0%) | 0 (0.0%) |
Public vs Private Health Insurance Coverage by Age in Maxville
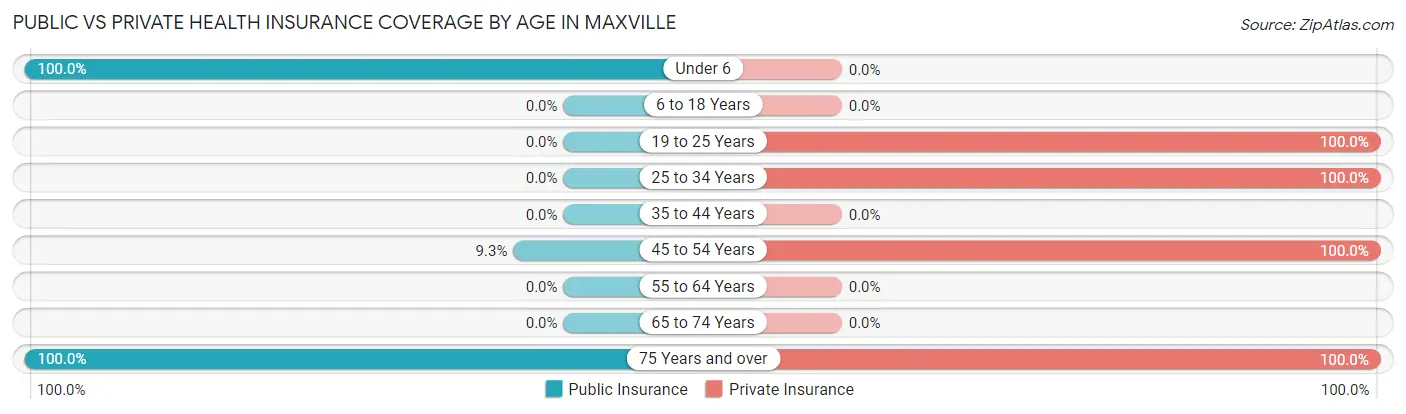
| Age Bracket | Public Insurance | Private Insurance |
| Under 6 | 20 (100.0%) | 0 (0.0%) |
| 6 to 18 Years | 0 (0.0%) | 0 (0.0%) |
| 19 to 25 Years | 0 (0.0%) | 40 (100.0%) |
| 25 to 34 Years | 0 (0.0%) | 5 (100.0%) |
| 35 to 44 Years | 0 (0.0%) | 0 (0.0%) |
| 45 to 54 Years | 4 (9.3%) | 43 (100.0%) |
| 55 to 64 Years | 0 (0.0%) | 0 (0.0%) |
| 65 to 74 Years | 0 (0.0%) | 0 (0.0%) |
| 75 Years and over | 5 (100.0%) | 5 (100.0%) |
| Total | 29 (25.7%) | 93 (82.3%) |
Disability Status by Sex by Age in Maxville
| Age Bracket | Male | Female |
| Under 5 Years | 0 (0.0%) | 0 (0.0%) |
| 5 to 17 Years | 0 (0.0%) | 0 (0.0%) |
| 18 to 34 Years | 0 (0.0%) | 0 (0.0%) |
| 35 to 64 Years | 0 (0.0%) | 0 (0.0%) |
| 65 to 74 Years | 0 (0.0%) | 0 (0.0%) |
| 75 Years and over | 0 (0.0%) | 0 (0.0%) |
Disability Class by Sex by Age in Maxville
Disability Class: Hearing Difficulty
| Age Bracket | Male | Female |
| Under 5 Years | 0 (0.0%) | 0 (0.0%) |
| 5 to 17 Years | 0 (0.0%) | 0 (0.0%) |
| 18 to 34 Years | 0 (0.0%) | 0 (0.0%) |
| 35 to 64 Years | 0 (0.0%) | 0 (0.0%) |
| 65 to 74 Years | 0 (0.0%) | 0 (0.0%) |
| 75 Years and over | 0 (0.0%) | 0 (0.0%) |
Disability Class: Vision Difficulty
| Age Bracket | Male | Female |
| Under 5 Years | 0 (0.0%) | 0 (0.0%) |
| 5 to 17 Years | 0 (0.0%) | 0 (0.0%) |
| 18 to 34 Years | 0 (0.0%) | 0 (0.0%) |
| 35 to 64 Years | 0 (0.0%) | 0 (0.0%) |
| 65 to 74 Years | 0 (0.0%) | 0 (0.0%) |
| 75 Years and over | 0 (0.0%) | 0 (0.0%) |
Disability Class: Cognitive Difficulty
| Age Bracket | Male | Female |
| 5 to 17 Years | 0 (0.0%) | 0 (0.0%) |
| 18 to 34 Years | 0 (0.0%) | 0 (0.0%) |
| 35 to 64 Years | 0 (0.0%) | 0 (0.0%) |
| 65 to 74 Years | 0 (0.0%) | 0 (0.0%) |
| 75 Years and over | 0 (0.0%) | 0 (0.0%) |
Disability Class: Ambulatory Difficulty
| Age Bracket | Male | Female |
| 5 to 17 Years | 0 (0.0%) | 0 (0.0%) |
| 18 to 34 Years | 0 (0.0%) | 0 (0.0%) |
| 35 to 64 Years | 0 (0.0%) | 0 (0.0%) |
| 65 to 74 Years | 0 (0.0%) | 0 (0.0%) |
| 75 Years and over | 0 (0.0%) | 0 (0.0%) |
Disability Class: Self-Care Difficulty
| Age Bracket | Male | Female |
| 5 to 17 Years | 0 (0.0%) | 0 (0.0%) |
| 18 to 34 Years | 0 (0.0%) | 0 (0.0%) |
| 35 to 64 Years | 0 (0.0%) | 0 (0.0%) |
| 65 to 74 Years | 0 (0.0%) | 0 (0.0%) |
| 75 Years and over | 0 (0.0%) | 0 (0.0%) |
Technology Access in Maxville
Computing Device Access in Maxville
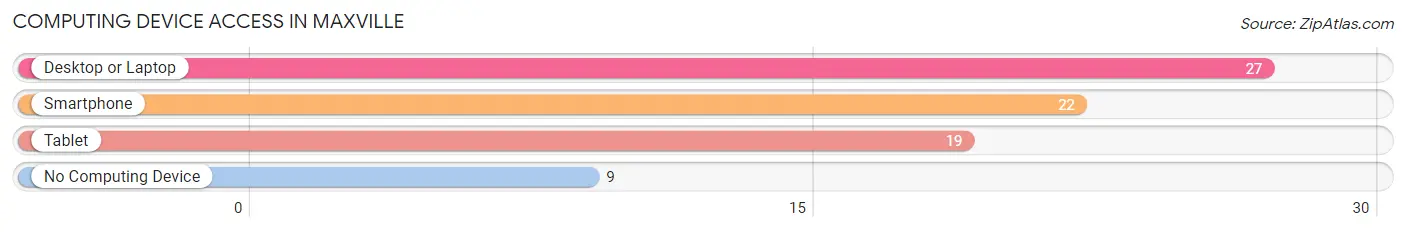
| Device Type | # Households | % Households |
| Desktop or Laptop | 27 | 75.0% |
| Smartphone | 22 | 61.1% |
| Tablet | 19 | 52.8% |
| No Computing Device | 9 | 25.0% |
| Total | 36 | 100.0% |
Internet Access in Maxville
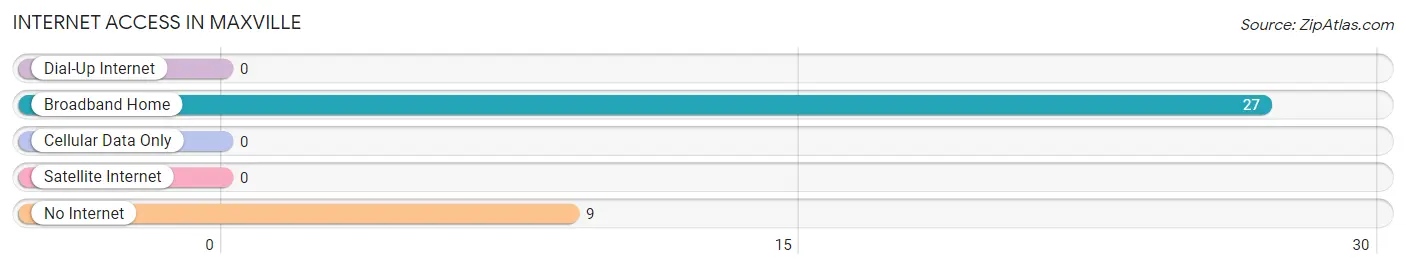
| Internet Type | # Households | % Households |
| Dial-Up Internet | 0 | 0.0% |
| Broadband Home | 27 | 75.0% |
| Cellular Data Only | 0 | 0.0% |
| Satellite Internet | 0 | 0.0% |
| No Internet | 9 | 25.0% |
| Total | 36 | 100.0% |
Maxville Summary
Maxville, Montana is a small town located in the western part of the state, near the Idaho border. It is situated in the Bitterroot Valley, a region of the Rocky Mountains known for its scenic beauty and outdoor recreation opportunities. The town has a population of just over 500 people, and is the county seat of Ravalli County.
Maxville was founded in 1883 by a group of settlers from the Midwest. The town was named after Max Kline, one of the original settlers. The town quickly grew and became a hub for the surrounding area, providing services such as a post office, a general store, and a school.
Geographically, Maxville is located in the Bitterroot Valley, which is part of the Rocky Mountain range. The valley is surrounded by mountains, including the Bitterroot Mountains to the east and the Sapphire Mountains to the west. The valley is known for its scenic beauty, with lush forests, rolling hills, and crystal clear rivers. The area is also home to a variety of wildlife, including elk, deer, and bighorn sheep.
The economy of Maxville is largely based on agriculture and tourism. The town is home to several farms, which produce a variety of crops, including wheat, barley, and hay. The town also has a thriving tourism industry, with visitors coming to enjoy the area’s natural beauty and outdoor recreation opportunities.
Demographically, Maxville is a predominantly white town, with a population of just over 500 people. The median age of the population is 44, and the median household income is $37,000. The town is home to a variety of religious denominations, including Catholic, Lutheran, and Methodist.
Maxville is a small town with a rich history and a vibrant economy. It is a great place to live, work, and play, and is a great example of the beauty and diversity of Montana.
Common Questions
What is Per Capita Income in Maxville?
Per Capita income in Maxville is $31,661.
What is the Median Household income in Maxville?
Median Household Income in Maxville is $105,500.
What is Income or Wage Gap in Maxville?
Income or Wage Gap in Maxville is 22.2%.
Women in Maxville earn 77.8 cents for every dollar earned by a man.
What is Inequality or Gini Index in Maxville?
Inequality or Gini Index in Maxville is 0.31.
What is the Total Population of Maxville?
Total Population of Maxville is 113.
What is the Total Male Population of Maxville?
Total Male Population of Maxville is 53.
What is the Total Female Population of Maxville?
Total Female Population of Maxville is 60.
What is the Ratio of Males per 100 Females in Maxville?
There are 88.33 Males per 100 Females in Maxville.
What is the Ratio of Females per 100 Males in Maxville?
There are 113.21 Females per 100 Males in Maxville.
What is the Median Population Age in Maxville?
Median Population Age in Maxville is 25.6 Years.
What is the Average Family Size in Maxville
Average Family Size in Maxville is 3.1 People.
What is the Average Household Size in Maxville
Average Household Size in Maxville is 3.1 People.
How Large is the Labor Force in Maxville?
There are 61 People in the Labor Forcein in Maxville.
What is the Percentage of People in the Labor Force in Maxville?
65.6% of People are in the Labor Force in Maxville.