Zip Codes with the Highest Percentage of Households with Income Above $100,000 in Montana
RELATED REPORTS & OPTIONS
Household Income | $100k+
Montana
Compare Zip Codes
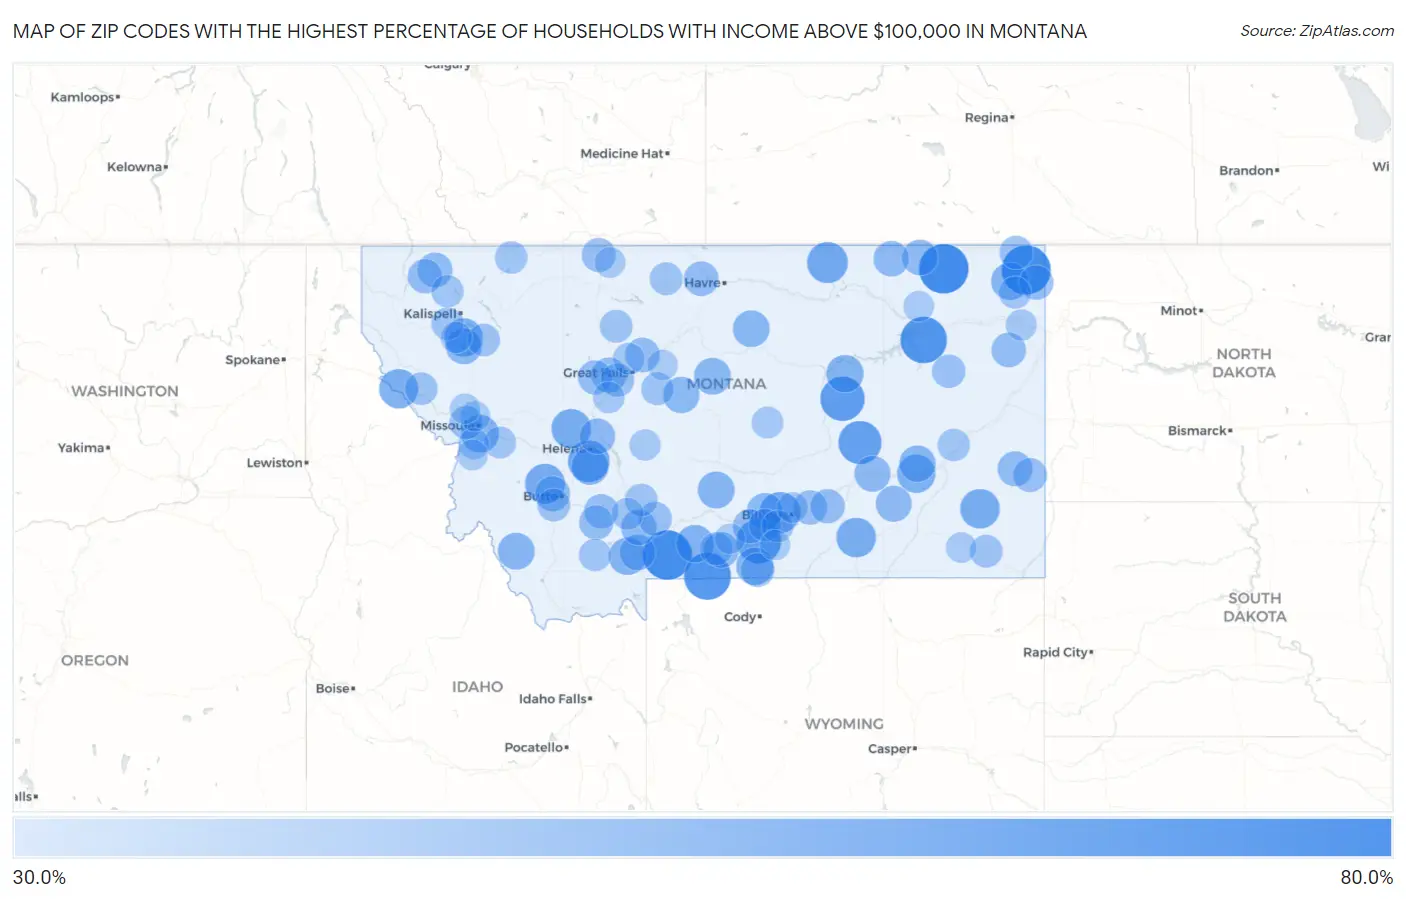
Map of Zip Codes with the Highest Percentage of Households with Income Above $100,000 in Montana
30.0%
80.0%
Zip Codes with the Highest Percentage of Households with Income Above $100,000 in Montana
| Zip Code | Households with Income > $100k | vs State | vs National | |
| 1. | 59253 | 73.4% | 30.1%(+43.3)#1 | 37.3%(+36.1)#680 |
| 2. | 59065 | 73.0% | 30.1%(+42.9)#2 | 37.3%(+35.7)#708 |
| 3. | 59211 | 72.3% | 30.1%(+42.2)#3 | 37.3%(+35.0)#758 |
| 4. | 59081 | 67.9% | 30.1%(+37.8)#4 | 37.3%(+30.6)#1,182 |
| 5. | 59223 | 66.7% | 30.1%(+36.6)#5 | 37.3%(+29.4)#1,323 |
| 6. | 59013 | 62.9% | 30.1%(+32.8)#6 | 37.3%(+25.6)#1,878 |
| 7. | 59077 | 62.5% | 30.1%(+32.4)#7 | 37.3%(+25.2)#1,938 |
| 8. | 59039 | 60.0% | 30.1%(+29.9)#8 | 37.3%(+22.7)#2,377 |
| 9. | 59634 | 56.7% | 30.1%(+26.6)#9 | 37.3%(+19.4)#3,056 |
| 10. | 59106 | 55.4% | 30.1%(+25.3)#10 | 37.3%(+18.1)#3,353 |
| 11. | 59537 | 55.2% | 30.1%(+25.1)#11 | 37.3%(+17.9)#3,414 |
| 12. | 59756 | 53.3% | 30.1%(+23.2)#12 | 37.3%(+16.0)#3,911 |
| 13. | 59633 | 52.5% | 30.1%(+22.4)#13 | 37.3%(+15.2)#4,129 |
| 14. | 59031 | 52.4% | 30.1%(+22.3)#14 | 37.3%(+15.1)#4,148 |
| 15. | 59345 | 52.4% | 30.1%(+22.3)#15 | 37.3%(+15.1)#4,151 |
| 16. | 59842 | 51.8% | 30.1%(+21.7)#16 | 37.3%(+14.5)#4,322 |
| 17. | 59931 | 50.0% | 30.1%(+19.9)#17 | 37.3%(+12.7)#4,843 |
| 18. | 59333 | 50.0% | 30.1%(+19.9)#18 | 37.3%(+12.7)#4,870 |
| 19. | 59803 | 49.1% | 30.1%(+19.0)#19 | 37.3%(+11.8)#5,138 |
| 20. | 59052 | 48.4% | 30.1%(+18.3)#20 | 37.3%(+11.1)#5,371 |
| 21. | 59716 | 48.3% | 30.1%(+18.2)#21 | 37.3%(+11.0)#5,398 |
| 22. | 59258 | 48.1% | 30.1%(+18.0)#22 | 37.3%(+10.8)#5,480 |
| 23. | 59007 | 48.1% | 30.1%(+18.0)#23 | 37.3%(+10.8)#5,482 |
| 24. | 59318 | 48.0% | 30.1%(+17.9)#24 | 37.3%(+10.7)#5,523 |
| 25. | 59638 | 47.3% | 30.1%(+17.2)#25 | 37.3%(+10.00)#5,759 |
| 26. | 59736 | 46.9% | 30.1%(+16.8)#26 | 37.3%(+9.60)#5,890 |
| 27. | 59055 | 46.9% | 30.1%(+16.8)#27 | 37.3%(+9.60)#5,892 |
| 28. | 59430 | 46.8% | 30.1%(+16.7)#28 | 37.3%(+9.50)#5,932 |
| 29. | 59535 | 46.7% | 30.1%(+16.6)#29 | 37.3%(+9.40)#5,966 |
| 30. | 59347 | 46.2% | 30.1%(+16.1)#30 | 37.3%(+8.90)#6,147 |
| 31. | 59057 | 45.7% | 30.1%(+15.6)#31 | 37.3%(+8.40)#6,354 |
| 32. | 59447 | 45.7% | 30.1%(+15.6)#32 | 37.3%(+8.40)#6,357 |
| 33. | 59910 | 45.3% | 30.1%(+15.2)#33 | 37.3%(+8.00)#6,526 |
| 34. | 59323 | 45.1% | 30.1%(+15.0)#34 | 37.3%(+7.80)#6,590 |
| 35. | 59076 | 45.0% | 30.1%(+14.9)#35 | 37.3%(+7.70)#6,649 |
| 36. | 59730 | 44.5% | 30.1%(+14.4)#36 | 37.3%(+7.20)#6,825 |
| 37. | 59240 | 44.4% | 30.1%(+14.3)#37 | 37.3%(+7.10)#6,881 |
| 38. | 59718 | 44.2% | 30.1%(+14.1)#38 | 37.3%(+6.90)#6,916 |
| 39. | 59028 | 44.1% | 30.1%(+14.0)#39 | 37.3%(+6.80)#6,990 |
| 40. | 59602 | 44.0% | 30.1%(+13.9)#40 | 37.3%(+6.70)#7,005 |
| 41. | 59250 | 43.9% | 30.1%(+13.8)#41 | 37.3%(+6.60)#7,074 |
| 42. | 59748 | 43.3% | 30.1%(+13.2)#42 | 37.3%(+6.00)#7,319 |
| 43. | 59344 | 43.1% | 30.1%(+13.0)#43 | 37.3%(+5.80)#7,422 |
| 44. | 59483 | 43.0% | 30.1%(+12.9)#44 | 37.3%(+5.70)#7,466 |
| 45. | 59933 | 42.9% | 30.1%(+12.8)#45 | 37.3%(+5.60)#7,511 |
| 46. | 59440 | 42.4% | 30.1%(+12.3)#46 | 37.3%(+5.10)#7,754 |
| 47. | 59532 | 42.4% | 30.1%(+12.3)#47 | 37.3%(+5.10)#7,756 |
| 48. | 59243 | 42.2% | 30.1%(+12.1)#48 | 37.3%(+4.90)#7,833 |
| 49. | 59219 | 42.0% | 30.1%(+11.9)#49 | 37.3%(+4.70)#7,916 |
| 50. | 59037 | 41.9% | 30.1%(+11.8)#50 | 37.3%(+4.60)#7,959 |
| 51. | 59064 | 41.8% | 30.1%(+11.7)#51 | 37.3%(+4.50)#8,017 |
| 52. | 59934 | 41.7% | 30.1%(+11.6)#52 | 37.3%(+4.40)#8,052 |
| 53. | 59721 | 41.7% | 30.1%(+11.6)#53 | 37.3%(+4.40)#8,060 |
| 54. | 59747 | 41.7% | 30.1%(+11.6)#54 | 37.3%(+4.40)#8,063 |
| 55. | 59477 | 41.6% | 30.1%(+11.5)#55 | 37.3%(+4.30)#8,100 |
| 56. | 59019 | 41.4% | 30.1%(+11.3)#56 | 37.3%(+4.10)#8,179 |
| 57. | 59313 | 41.1% | 30.1%(+11.0)#57 | 37.3%(+3.80)#8,362 |
| 58. | 59482 | 41.1% | 30.1%(+11.0)#58 | 37.3%(+3.80)#8,374 |
| 59. | 59715 | 40.8% | 30.1%(+10.7)#59 | 37.3%(+3.50)#8,506 |
| 60. | 59008 | 40.6% | 30.1%(+10.5)#60 | 37.3%(+3.30)#8,632 |
| 61. | 59485 | 40.0% | 30.1%(+9.90)#61 | 37.3%(+2.70)#8,925 |
| 62. | 59256 | 40.0% | 30.1%(+9.90)#62 | 37.3%(+2.70)#8,932 |
| 63. | 59804 | 39.8% | 30.1%(+9.70)#63 | 37.3%(+2.50)#9,026 |
| 64. | 59215 | 39.7% | 30.1%(+9.60)#64 | 37.3%(+2.40)#9,102 |
| 65. | 59061 | 38.9% | 30.1%(+8.80)#65 | 37.3%(+1.60)#9,503 |
| 66. | 59530 | 38.8% | 30.1%(+8.70)#66 | 37.3%(+1.50)#9,565 |
| 67. | 59750 | 38.7% | 30.1%(+8.60)#67 | 37.3%(+1.40)#9,615 |
| 68. | 59416 | 38.7% | 30.1%(+8.60)#68 | 37.3%(+1.40)#9,616 |
| 69. | 59412 | 38.5% | 30.1%(+8.40)#69 | 37.3%(+1.20)#9,718 |
| 70. | 59316 | 38.5% | 30.1%(+8.40)#70 | 37.3%(+1.20)#9,741 |
| 71. | 59714 | 38.3% | 30.1%(+8.20)#71 | 37.3%(+1.000)#9,813 |
| 72. | 59866 | 38.3% | 30.1%(+8.20)#72 | 37.3%(+1.000)#9,845 |
| 73. | 59911 | 38.2% | 30.1%(+8.10)#73 | 37.3%(+0.900)#9,875 |
| 74. | 59063 | 37.9% | 30.1%(+7.80)#74 | 37.3%(+0.600)#10,072 |
| 75. | 59411 | 37.9% | 30.1%(+7.80)#75 | 37.3%(+0.600)#10,076 |
| 76. | 59920 | 37.8% | 30.1%(+7.70)#76 | 37.3%(+0.500)#10,117 |
| 77. | 59937 | 37.7% | 30.1%(+7.60)#77 | 37.3%(+0.400)#10,145 |
| 78. | 59338 | 37.7% | 30.1%(+7.60)#78 | 37.3%(+0.400)#10,189 |
| 79. | 59755 | 37.5% | 30.1%(+7.40)#79 | 37.3%(+0.200)#10,307 |
| 80. | 59242 | 37.5% | 30.1%(+7.40)#80 | 37.3%(+0.200)#10,309 |
| 81. | 59825 | 37.0% | 30.1%(+6.90)#81 | 37.3%(-0.300)#10,575 |
| 82. | 59044 | 36.8% | 30.1%(+6.70)#82 | 37.3%(-0.500)#10,691 |
| 83. | 59741 | 36.7% | 30.1%(+6.60)#83 | 37.3%(-0.600)#10,762 |
| 84. | 59441 | 36.4% | 30.1%(+6.30)#84 | 37.3%(-0.900)#10,966 |
| 85. | 59404 | 36.3% | 30.1%(+6.20)#85 | 37.3%(-1.00)#10,977 |
| 86. | 59421 | 35.9% | 30.1%(+5.80)#86 | 37.3%(-1.40)#11,221 |
| 87. | 59929 | 35.7% | 30.1%(+5.60)#87 | 37.3%(-1.60)#11,368 |
| 88. | 59645 | 35.5% | 30.1%(+5.40)#88 | 37.3%(-1.80)#11,482 |
| 89. | 59218 | 35.0% | 30.1%(+4.90)#89 | 37.3%(-2.30)#11,795 |
| 90. | 59833 | 34.8% | 30.1%(+4.70)#90 | 37.3%(-2.50)#11,905 |
| 91. | 59870 | 34.5% | 30.1%(+4.40)#91 | 37.3%(-2.80)#12,080 |
| 92. | 59466 | 34.5% | 30.1%(+4.40)#92 | 37.3%(-2.80)#12,131 |
| 93. | 59105 | 34.4% | 30.1%(+4.30)#93 | 37.3%(-2.90)#12,137 |
| 94. | 59317 | 34.2% | 30.1%(+4.10)#94 | 37.3%(-3.10)#12,297 |
| 95. | 59248 | 34.2% | 30.1%(+4.10)#95 | 37.3%(-3.10)#12,299 |
| 96. | 59808 | 34.0% | 30.1%(+3.90)#96 | 37.3%(-3.30)#12,410 |
| 97. | 59450 | 33.9% | 30.1%(+3.80)#97 | 37.3%(-3.40)#12,549 |
| 98. | 59834 | 33.7% | 30.1%(+3.60)#98 | 37.3%(-3.60)#12,670 |
| 99. | 59001 | 33.7% | 30.1%(+3.60)#99 | 37.3%(-3.60)#12,675 |
| 100. | 59029 | 33.7% | 30.1%(+3.60)#100 | 37.3%(-3.60)#12,685 |
Common Questions
What are the Top 10 Zip Codes with the Highest Percentage of Households with Income Above $100,000 in Montana?
Top 10 Zip Codes with the Highest Percentage of Households with Income Above $100,000 in Montana are:
What zip code has the Highest Percentage of Households with Income Above $100,000 in Montana?
59253 has the Highest Percentage of Households with Income Above $100,000 in Montana with 73.4%.
What is the Percentage of Households with Income Above $100,000 in the State of Montana?
Percentage of Households with Income Above $100,000 in Montana is 30.1%.
What is the Percentage of Households with Income Above $100,000 in the United States?
Percentage of Households with Income Above $100,000 in the United States is 37.3%.