Houstonia, MO Map & Demographics
Houstonia Map
Houstonia Overview
$35,860
PER CAPITA INCOME
$42,500
AVG FAMILY INCOME
0.36
INEQUALITY / GINI INDEX
245
TOTAL POPULATION
88
MALE POPULATION
157
FEMALE POPULATION
56.05
MALES / 100 FEMALES
178.41
FEMALES / 100 MALES
61.1
MEDIAN AGE
1.8
AVG FAMILY SIZE
1.6
AVG HOUSEHOLD SIZE
166
LABOR FORCE [ PEOPLE ]
72.2%
PERCENT IN LABOR FORCE
1.3%
UNEMPLOYMENT RATE
Houstonia Zip Codes
Houstonia Area Codes
Income in Houstonia
Income Overview in Houstonia
| Characteristic | Number | Measure |
| Per Capita Income | 245 | $35,860 |
| Median Family Income | 76 | $42,500 |
| Mean Family Income | 76 | $69,776 |
| Median Household Income | 150 | $0 |
| Mean Household Income | 150 | $66,960 |
| Income Deficit | 76 | $0 |
| Wage / Income Gap (%) | 245 | 0.00% |
| Wage / Income Gap ($) | 245 | 100.00¢ per $1 |
| Gini / Inequality Index | 245 | 0.36 |
Earnings by Sex in Houstonia
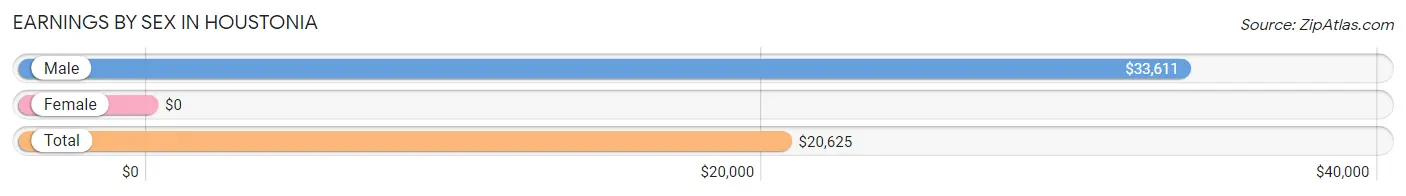
| Sex | Number | Average Earnings |
| Male | 58 (34.3%) | $33,611 |
| Female | 111 (65.7%) | $0 |
| Total | 169 (100.0%) | $20,625 |
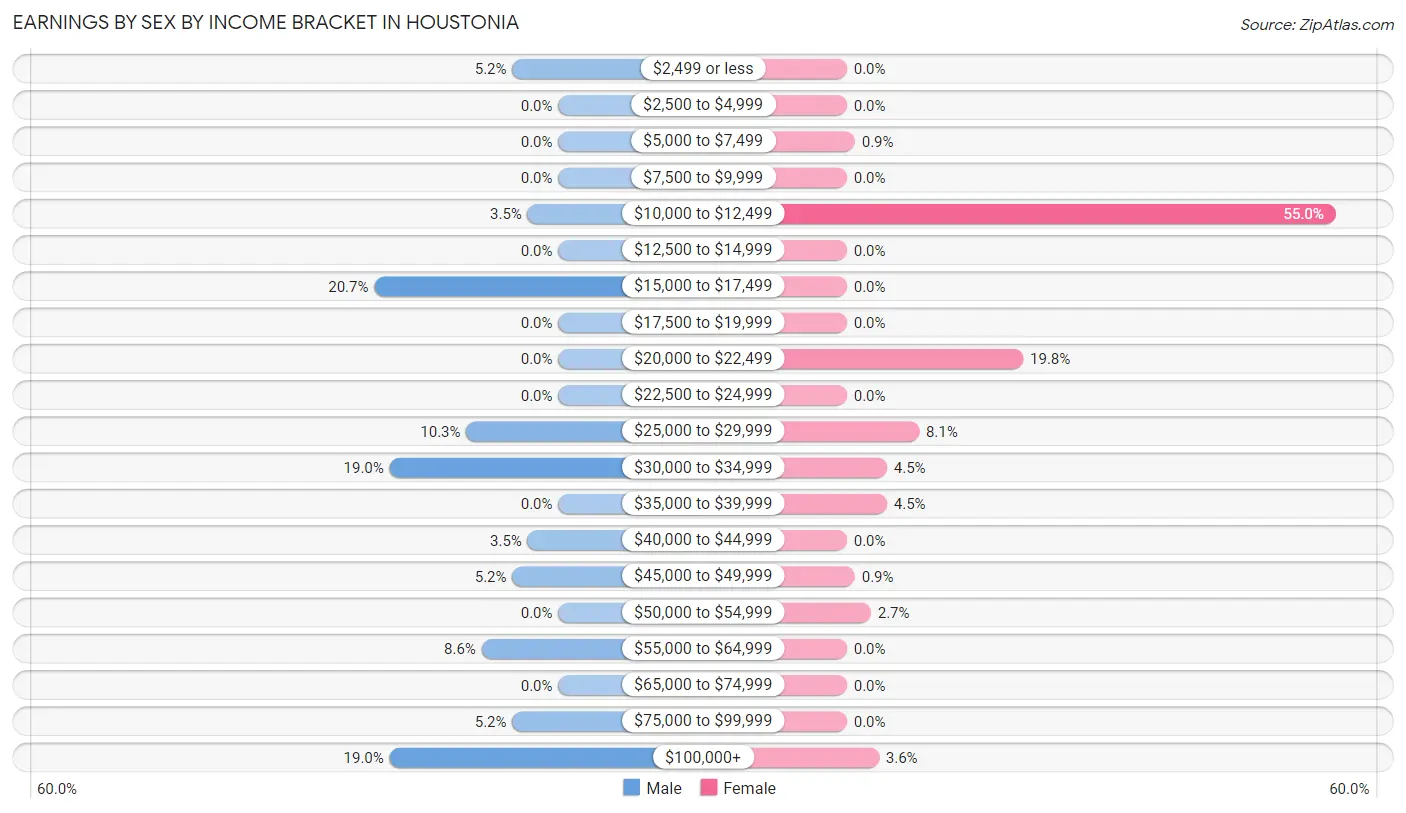
Earnings by Sex by Income Bracket in Houstonia
The most common earnings brackets in Houstonia are $15,000 to $17,499 for men (12 | 20.7%) and $10,000 to $12,499 for women (61 | 54.9%).
| Income | Male | Female |
| $2,499 or less | 3 (5.2%) | 0 (0.0%) |
| $2,500 to $4,999 | 0 (0.0%) | 0 (0.0%) |
| $5,000 to $7,499 | 0 (0.0%) | 1 (0.9%) |
| $7,500 to $9,999 | 0 (0.0%) | 0 (0.0%) |
| $10,000 to $12,499 | 2 (3.5%) | 61 (54.9%) |
| $12,500 to $14,999 | 0 (0.0%) | 0 (0.0%) |
| $15,000 to $17,499 | 12 (20.7%) | 0 (0.0%) |
| $17,500 to $19,999 | 0 (0.0%) | 0 (0.0%) |
| $20,000 to $22,499 | 0 (0.0%) | 22 (19.8%) |
| $22,500 to $24,999 | 0 (0.0%) | 0 (0.0%) |
| $25,000 to $29,999 | 6 (10.3%) | 9 (8.1%) |
| $30,000 to $34,999 | 11 (19.0%) | 5 (4.5%) |
| $35,000 to $39,999 | 0 (0.0%) | 5 (4.5%) |
| $40,000 to $44,999 | 2 (3.5%) | 0 (0.0%) |
| $45,000 to $49,999 | 3 (5.2%) | 1 (0.9%) |
| $50,000 to $54,999 | 0 (0.0%) | 3 (2.7%) |
| $55,000 to $64,999 | 5 (8.6%) | 0 (0.0%) |
| $65,000 to $74,999 | 0 (0.0%) | 0 (0.0%) |
| $75,000 to $99,999 | 3 (5.2%) | 0 (0.0%) |
| $100,000+ | 11 (19.0%) | 4 (3.6%) |
| Total | 58 (100.0%) | 111 (100.0%) |
Earnings by Sex by Educational Attainment in Houstonia
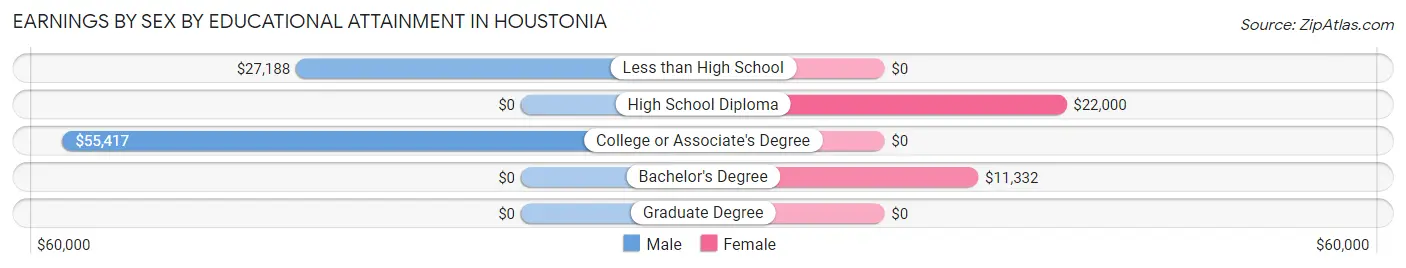
| Educational Attainment | Male Income | Female Income |
| Less than High School | $27,188 | $0 |
| High School Diploma | - | - |
| College or Associate's Degree | $55,417 | $0 |
| Bachelor's Degree | - | - |
| Graduate Degree | - | - |
| Total | $45,000 | $0 |
Family Income in Houstonia
Family Income Brackets in Houstonia
According to the Houstonia family income data, there are 31 families falling into the $35,000 to $49,999 income range, which is the most common income bracket and makes up 40.8% of all families.
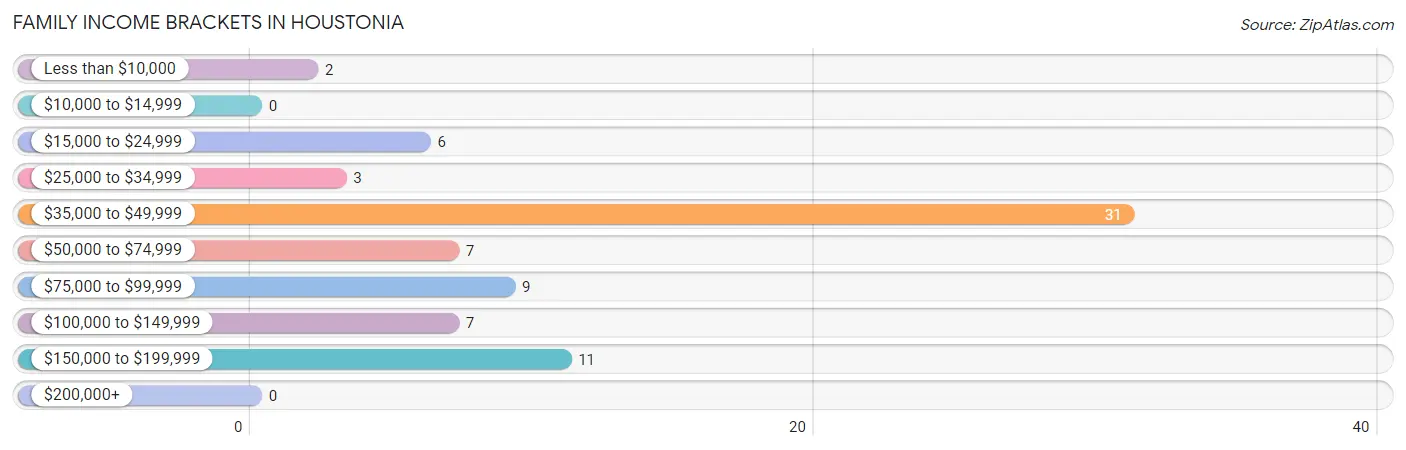
| Income Bracket | # Families | % Families |
| Less than $10,000 | 2 | 2.6% |
| $10,000 to $14,999 | 0 | 0.0% |
| $15,000 to $24,999 | 6 | 7.9% |
| $25,000 to $34,999 | 3 | 3.9% |
| $35,000 to $49,999 | 31 | 40.8% |
| $50,000 to $74,999 | 7 | 9.2% |
| $75,000 to $99,999 | 9 | 11.8% |
| $100,000 to $149,999 | 7 | 9.2% |
| $150,000 to $199,999 | 11 | 14.5% |
| $200,000+ | 0 | 0.0% |
Family Income by Famaliy Size in Houstonia
4-person families (7 | 9.2%) account for the highest median family income in Houstonia with $80,417 per family, while 2-person families (65 | 85.5%) have the highest median income of $21,032 per family member.
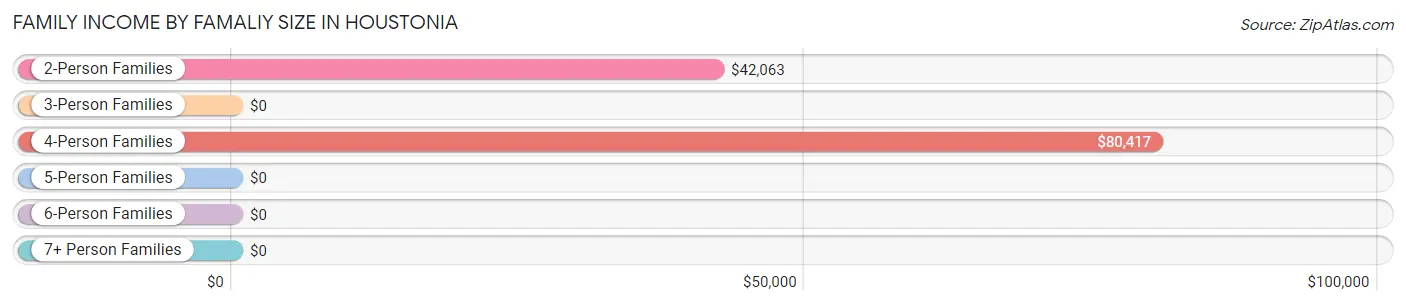
| Income Bracket | # Families | Median Income |
| 2-Person Families | 65 (85.5%) | $42,063 |
| 3-Person Families | 4 (5.3%) | $0 |
| 4-Person Families | 7 (9.2%) | $80,417 |
| 5-Person Families | 0 (0.0%) | $0 |
| 6-Person Families | 0 (0.0%) | $0 |
| 7+ Person Families | 0 (0.0%) | $0 |
| Total | 76 (100.0%) | $42,500 |
Family Income by Number of Earners in Houstonia
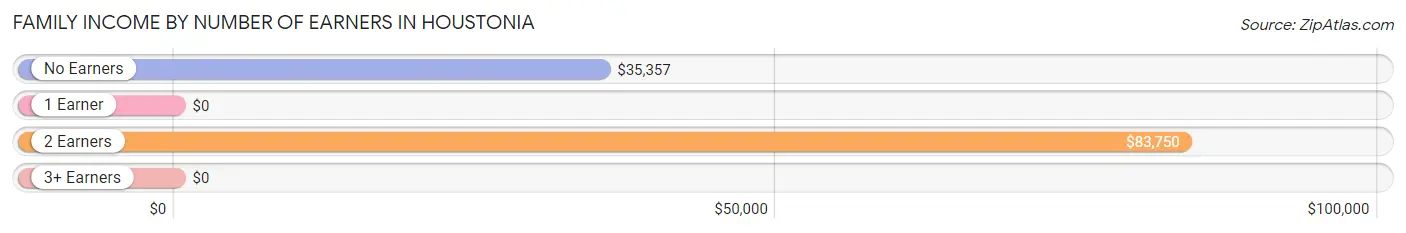
| Number of Earners | # Families | Median Income |
| No Earners | 16 (21.0%) | $35,357 |
| 1 Earner | 47 (61.8%) | $0 |
| 2 Earners | 10 (13.2%) | $83,750 |
| 3+ Earners | 3 (4.0%) | $0 |
| Total | 76 (100.0%) | $42,500 |
Household Income in Houstonia
Household Income Brackets in Houstonia
With 74 households falling in the category, the $35,000 to $49,999 income range is the most frequent in Houstonia, accounting for 49.3% of all households.
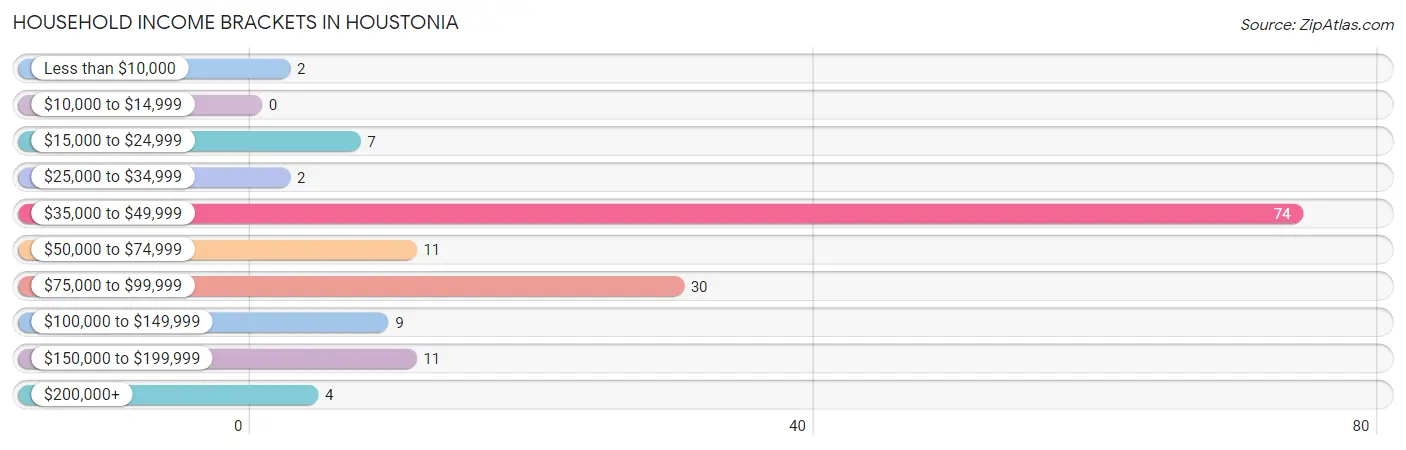
| Income Bracket | # Households | % Households |
| Less than $10,000 | 2 | 1.3% |
| $10,000 to $14,999 | 0 | 0.0% |
| $15,000 to $24,999 | 7 | 4.7% |
| $25,000 to $34,999 | 2 | 1.3% |
| $35,000 to $49,999 | 74 | 49.3% |
| $50,000 to $74,999 | 11 | 7.3% |
| $75,000 to $99,999 | 30 | 20.0% |
| $100,000 to $149,999 | 9 | 6.0% |
| $150,000 to $199,999 | 11 | 7.3% |
| $200,000+ | 4 | 2.7% |
Household Income by Householder Age in Houstonia
The median household income in Houstonia is $0, with the highest median household income of $69,167 found in the 25 to 44 years age bracket for the primary householder. A total of 14 households (9.3%) fall into this category.
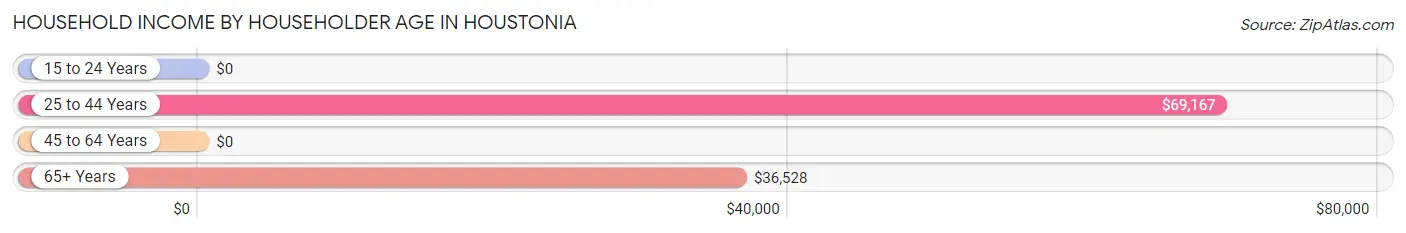
| Income Bracket | # Households | Median Income |
| 15 to 24 Years | 0 (0.0%) | $0 |
| 25 to 44 Years | 14 (9.3%) | $69,167 |
| 45 to 64 Years | 107 (71.3%) | $0 |
| 65+ Years | 29 (19.3%) | $36,528 |
| Total | 150 (100.0%) | $0 |
Poverty in Houstonia
Income Below Poverty by Sex and Age in Houstonia
With 12.5% poverty level for males and 3.8% for females among the residents of Houstonia, under 5 year old males and 35 to 44 year old females are the most vulnerable to poverty, with 2 males (50.0%) and 2 females (40.0%) in their respective age groups living below the poverty level.
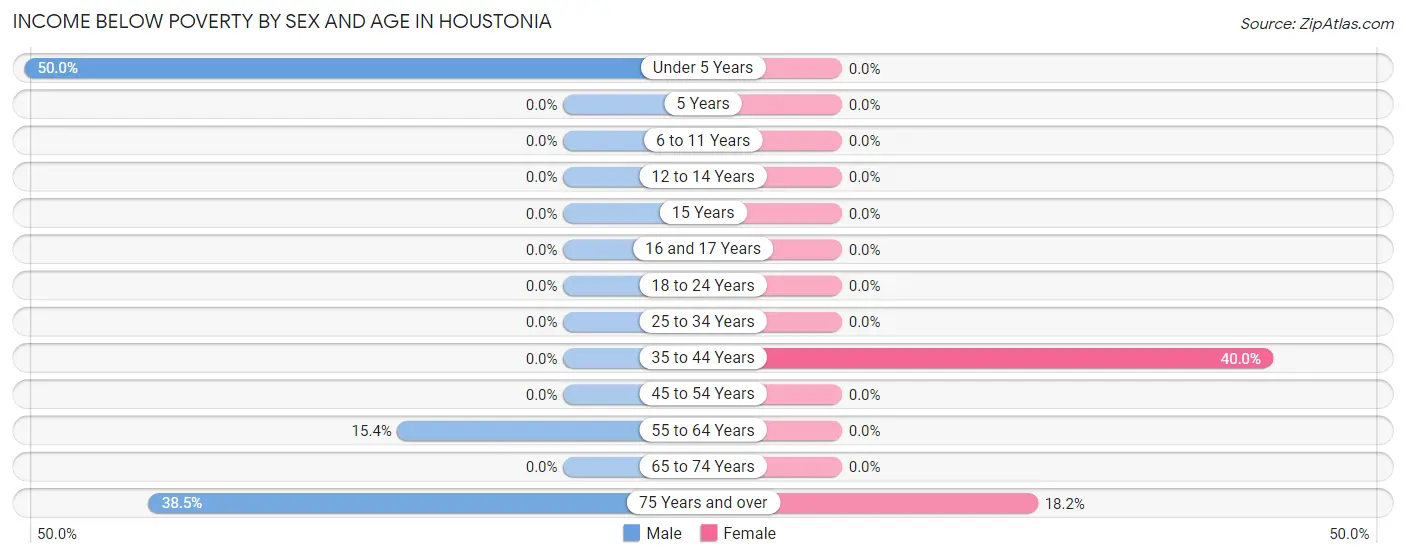
| Age Bracket | Male | Female |
| Under 5 Years | 2 (50.0%) | 0 (0.0%) |
| 5 Years | 0 (0.0%) | 0 (0.0%) |
| 6 to 11 Years | 0 (0.0%) | 0 (0.0%) |
| 12 to 14 Years | 0 (0.0%) | 0 (0.0%) |
| 15 Years | 0 (0.0%) | 0 (0.0%) |
| 16 and 17 Years | 0 (0.0%) | 0 (0.0%) |
| 18 to 24 Years | 0 (0.0%) | 0 (0.0%) |
| 25 to 34 Years | 0 (0.0%) | 0 (0.0%) |
| 35 to 44 Years | 0 (0.0%) | 2 (40.0%) |
| 45 to 54 Years | 0 (0.0%) | 0 (0.0%) |
| 55 to 64 Years | 4 (15.4%) | 0 (0.0%) |
| 65 to 74 Years | 0 (0.0%) | 0 (0.0%) |
| 75 Years and over | 5 (38.5%) | 4 (18.2%) |
| Total | 11 (12.5%) | 6 (3.8%) |
Income Above Poverty by Sex and Age in Houstonia
According to the poverty statistics in Houstonia, males aged 6 to 11 years and females aged under 5 years are the age groups that are most secure financially, with 100.0% of males and 100.0% of females in these age groups living above the poverty line.
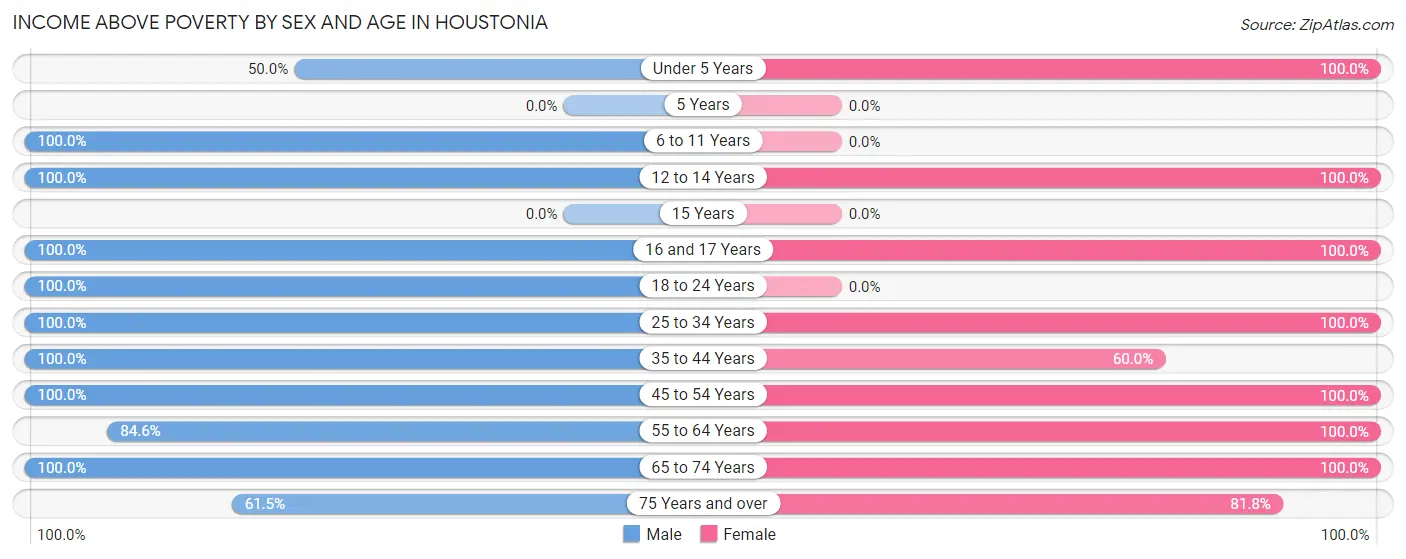
| Age Bracket | Male | Female |
| Under 5 Years | 2 (50.0%) | 4 (100.0%) |
| 5 Years | 0 (0.0%) | 0 (0.0%) |
| 6 to 11 Years | 2 (100.0%) | 0 (0.0%) |
| 12 to 14 Years | 2 (100.0%) | 3 (100.0%) |
| 15 Years | 0 (0.0%) | 0 (0.0%) |
| 16 and 17 Years | 2 (100.0%) | 1 (100.0%) |
| 18 to 24 Years | 12 (100.0%) | 0 (0.0%) |
| 25 to 34 Years | 4 (100.0%) | 10 (100.0%) |
| 35 to 44 Years | 8 (100.0%) | 3 (60.0%) |
| 45 to 54 Years | 13 (100.0%) | 30 (100.0%) |
| 55 to 64 Years | 22 (84.6%) | 74 (100.0%) |
| 65 to 74 Years | 2 (100.0%) | 8 (100.0%) |
| 75 Years and over | 8 (61.5%) | 18 (81.8%) |
| Total | 77 (87.5%) | 151 (96.2%) |
Income Below Poverty Among Married-Couple Families in Houstonia
The poverty statistics for married-couple families in Houstonia show that 11.1% or 5 of the total 45 families live below the poverty line. Families with no children have the highest poverty rate of 13.9%, comprising of 5 families. On the other hand, families with 1 or 2 children have the lowest poverty rate of 0.0%, which includes 0 families.
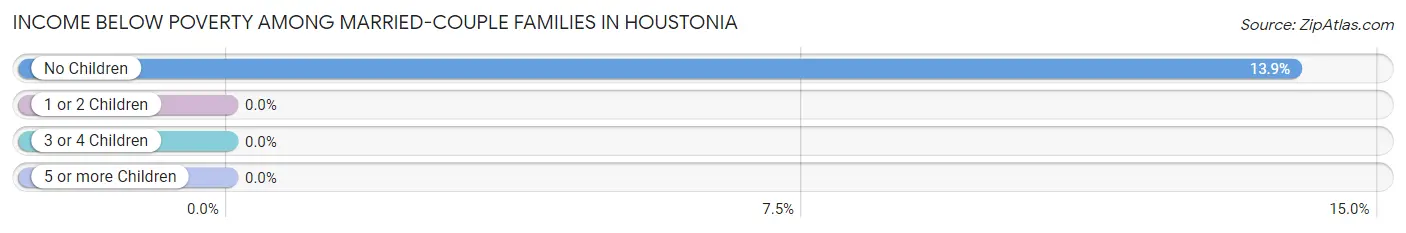
| Children | Above Poverty | Below Poverty |
| No Children | 31 (86.1%) | 5 (13.9%) |
| 1 or 2 Children | 9 (100.0%) | 0 (0.0%) |
| 3 or 4 Children | 0 (0.0%) | 0 (0.0%) |
| 5 or more Children | 0 (0.0%) | 0 (0.0%) |
| Total | 40 (88.9%) | 5 (11.1%) |
Income Below Poverty Among Single-Parent Households in Houstonia
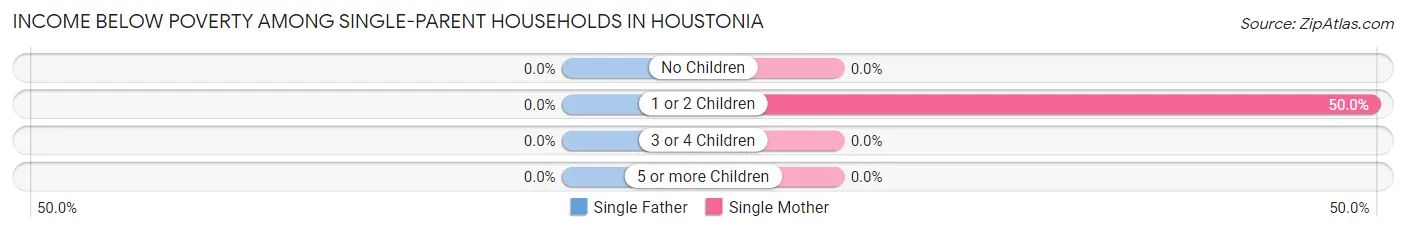
| Children | Single Father | Single Mother |
| No Children | 0 (0.0%) | 0 (0.0%) |
| 1 or 2 Children | 0 (0.0%) | 2 (50.0%) |
| 3 or 4 Children | 0 (0.0%) | 0 (0.0%) |
| 5 or more Children | 0 (0.0%) | 0 (0.0%) |
| Total | 0 (0.0%) | 2 (6.5%) |
Income Below Poverty Among Married-Couple vs Single-Parent Households in Houstonia
The poverty data for Houstonia shows that 5 of the married-couple family households (11.1%) and 2 of the single-parent households (6.5%) are living below the poverty level. Within the married-couple family households, those with no children have the highest poverty rate, with 5 households (13.9%) falling below the poverty line. Among the single-parent households, those with 1 or 2 children have the highest poverty rate, with 2 household (50.0%) living below poverty.
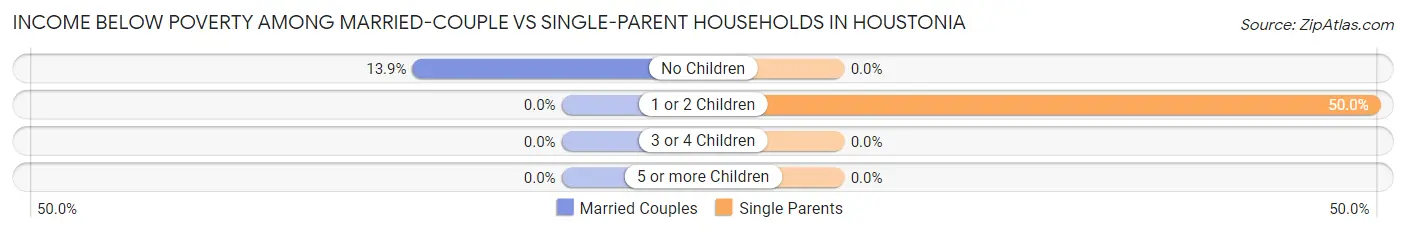
| Children | Married-Couple Families | Single-Parent Households |
| No Children | 5 (13.9%) | 0 (0.0%) |
| 1 or 2 Children | 0 (0.0%) | 2 (50.0%) |
| 3 or 4 Children | 0 (0.0%) | 0 (0.0%) |
| 5 or more Children | 0 (0.0%) | 0 (0.0%) |
| Total | 5 (11.1%) | 2 (6.5%) |
Race in Houstonia
The most populous races in Houstonia are White / Caucasian (241 | 98.4%), and Two or more Races (4 | 1.6%).
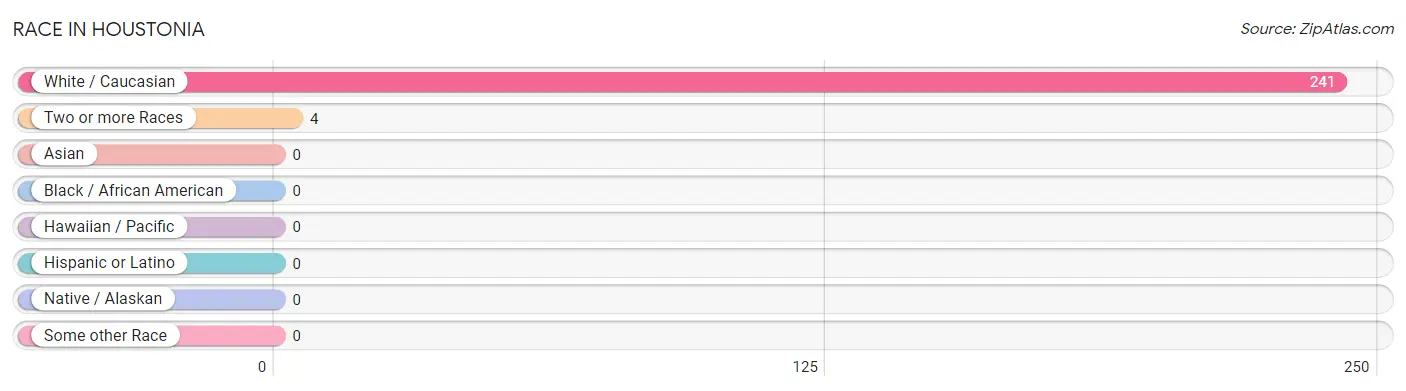
| Race | # Population | % Population |
| Asian | 0 | 0.0% |
| Black / African American | 0 | 0.0% |
| Hawaiian / Pacific | 0 | 0.0% |
| Hispanic or Latino | 0 | 0.0% |
| Native / Alaskan | 0 | 0.0% |
| White / Caucasian | 241 | 98.4% |
| Two or more Races | 4 | 1.6% |
| Some other Race | 0 | 0.0% |
| Total | 245 | 100.0% |
Ancestry in Houstonia
The most populous ancestries reported in Houstonia are German (88 | 35.9%), American (54 | 22.0%), Irish (19 | 7.8%), English (4 | 1.6%), and Dutch (3 | 1.2%), together accounting for 68.6% of all Houstonia residents.
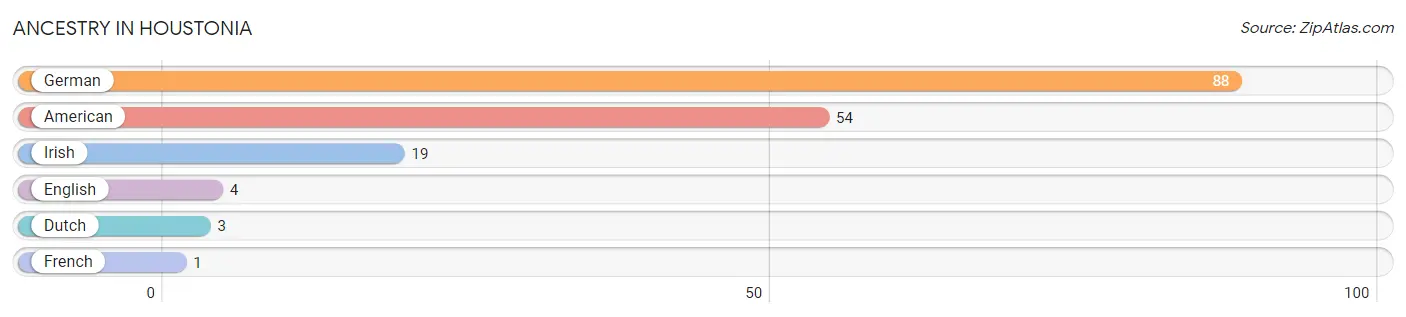
| Ancestry | # Population | % Population |
| American | 54 | 22.0% |
| Dutch | 3 | 1.2% |
| English | 4 | 1.6% |
| French | 1 | 0.4% |
| German | 88 | 35.9% |
| Irish | 19 | 7.8% | View All 6 Rows |
Immigrants in Houstonia

| Immigration Origin | # Population | % Population | View All 0 Rows |
Sex and Age in Houstonia
Sex and Age in Houstonia
The most populous age groups in Houstonia are 60 to 64 Years (18 | 20.4%) for men and 60 to 64 Years (69 | 44.0%) for women.
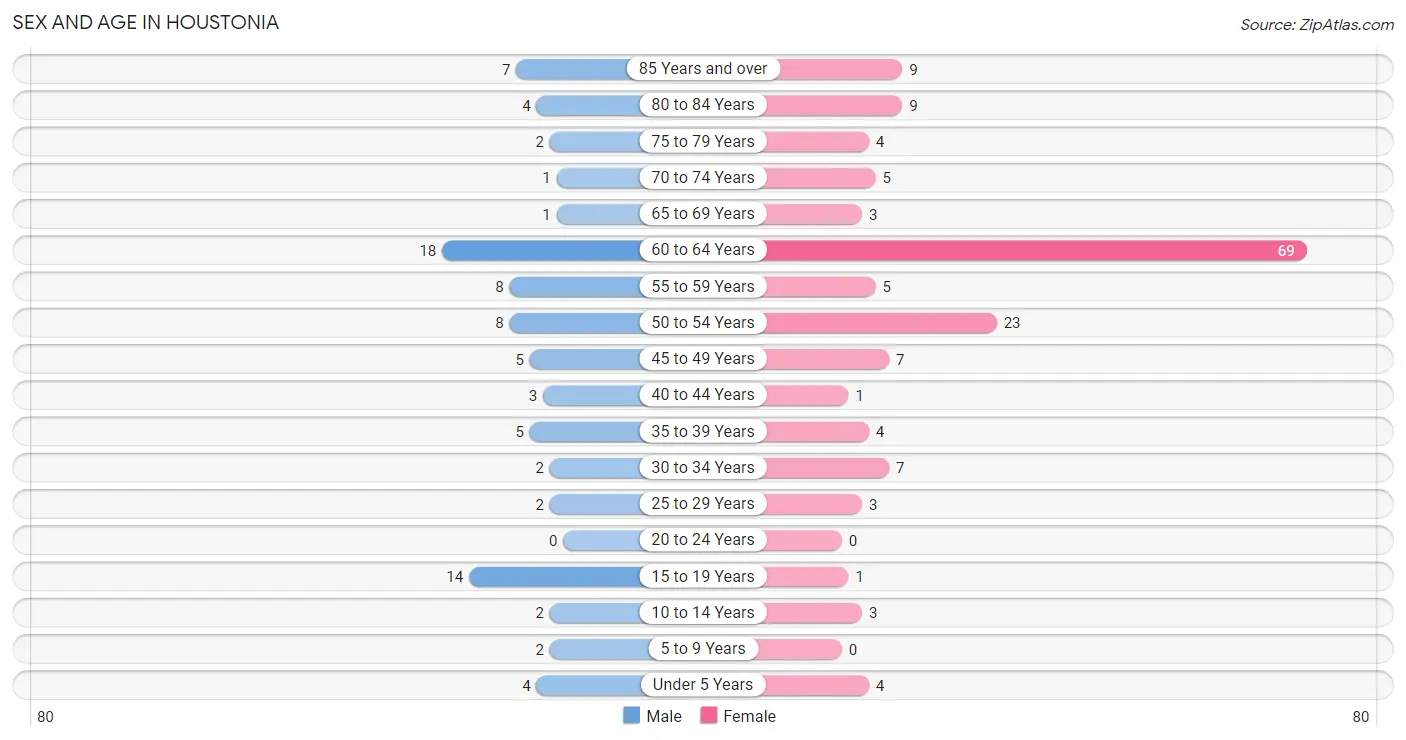
| Age Bracket | Male | Female |
| Under 5 Years | 4 (4.5%) | 4 (2.5%) |
| 5 to 9 Years | 2 (2.3%) | 0 (0.0%) |
| 10 to 14 Years | 2 (2.3%) | 3 (1.9%) |
| 15 to 19 Years | 14 (15.9%) | 1 (0.6%) |
| 20 to 24 Years | 0 (0.0%) | 0 (0.0%) |
| 25 to 29 Years | 2 (2.3%) | 3 (1.9%) |
| 30 to 34 Years | 2 (2.3%) | 7 (4.5%) |
| 35 to 39 Years | 5 (5.7%) | 4 (2.5%) |
| 40 to 44 Years | 3 (3.4%) | 1 (0.6%) |
| 45 to 49 Years | 5 (5.7%) | 7 (4.5%) |
| 50 to 54 Years | 8 (9.1%) | 23 (14.6%) |
| 55 to 59 Years | 8 (9.1%) | 5 (3.2%) |
| 60 to 64 Years | 18 (20.4%) | 69 (44.0%) |
| 65 to 69 Years | 1 (1.1%) | 3 (1.9%) |
| 70 to 74 Years | 1 (1.1%) | 5 (3.2%) |
| 75 to 79 Years | 2 (2.3%) | 4 (2.5%) |
| 80 to 84 Years | 4 (4.5%) | 9 (5.7%) |
| 85 Years and over | 7 (8.0%) | 9 (5.7%) |
| Total | 88 (100.0%) | 157 (100.0%) |
Families and Households in Houstonia
Median Family Size in Houstonia
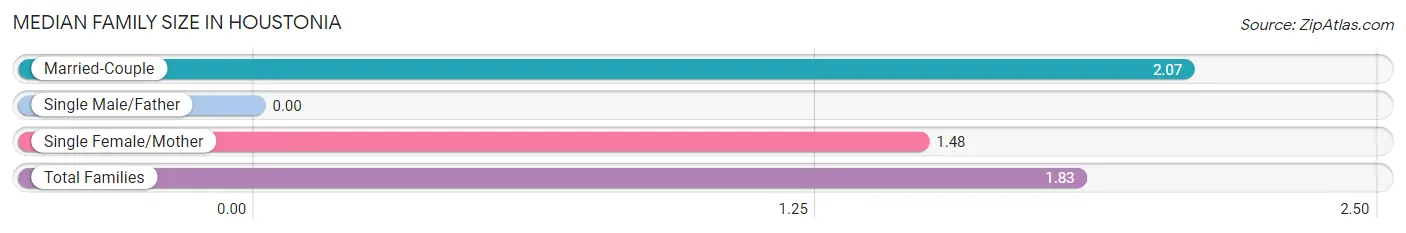
| Family Type | # Families | Family Size |
| Married-Couple | 45 (59.2%) | 2.07 |
| Single Male/Father | 0 (0.0%) | - |
| Single Female/Mother | 31 (40.8%) | 1.48 |
| Total Families | 76 (100.0%) | 1.83 |
Median Household Size in Houstonia
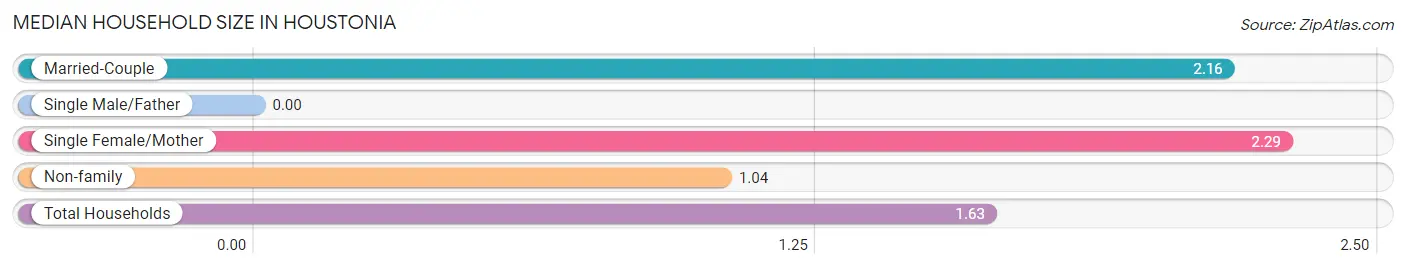
| Household Type | # Households | Household Size |
| Married-Couple | 45 (30.0%) | 2.16 |
| Single Male/Father | 0 (0.0%) | - |
| Single Female/Mother | 31 (20.7%) | 2.29 |
| Non-family | 74 (49.3%) | 1.04 |
| Total Households | 150 (100.0%) | 1.63 |
Household Size by Marriage Status in Houstonia
Out of a total of 150 households in Houstonia, 76 (50.7%) are family households, while 74 (49.3%) are nonfamily households. The most numerous type of family households are 2-person households, comprising 38, and the most common type of nonfamily households are 1-person households, comprising 71.
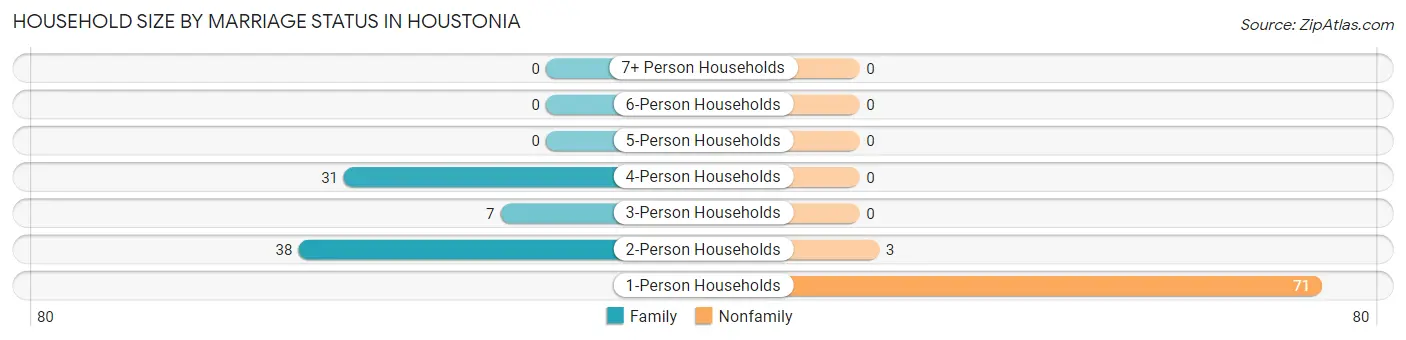
| Household Size | Family Households | Nonfamily Households |
| 1-Person Households | - | 71 (47.3%) |
| 2-Person Households | 38 (25.3%) | 3 (2.0%) |
| 3-Person Households | 7 (4.7%) | 0 (0.0%) |
| 4-Person Households | 31 (20.7%) | 0 (0.0%) |
| 5-Person Households | 0 (0.0%) | 0 (0.0%) |
| 6-Person Households | 0 (0.0%) | 0 (0.0%) |
| 7+ Person Households | 0 (0.0%) | 0 (0.0%) |
| Total | 76 (50.7%) | 74 (49.3%) |
Female Fertility in Houstonia
Fertility by Age in Houstonia
Average fertility rate in Houstonia is 130.0 births per 1,000 women. Women in the age bracket of 20 to 34 years have the highest fertility rate with 300.0 births per 1,000 women. Women in the age bracket of 20 to 34 years acount for 100.0% of all women with births.
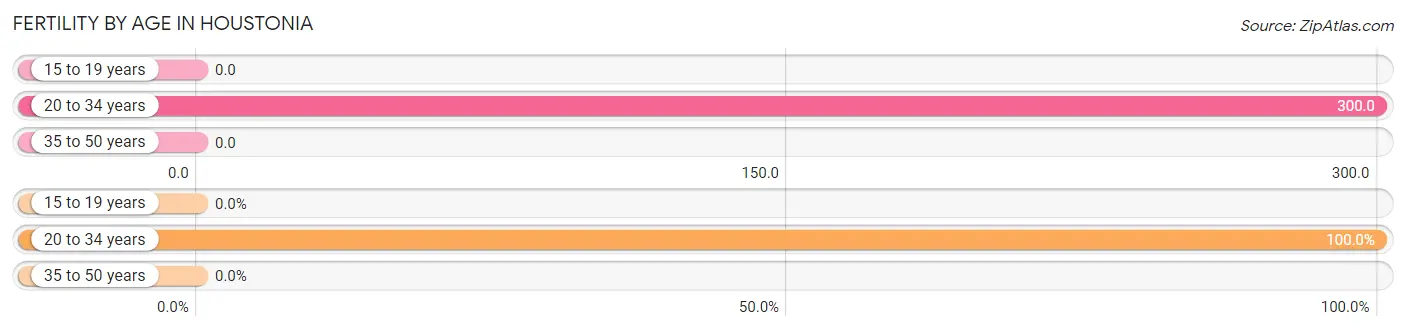
| Age Bracket | Women with Births | Births / 1,000 Women |
| 15 to 19 years | 0 (0.0%) | 0.0 |
| 20 to 34 years | 3 (100.0%) | 300.0 |
| 35 to 50 years | 0 (0.0%) | 0.0 |
| Total | 3 (100.0%) | 130.0 |
Fertility by Age by Marriage Status in Houstonia
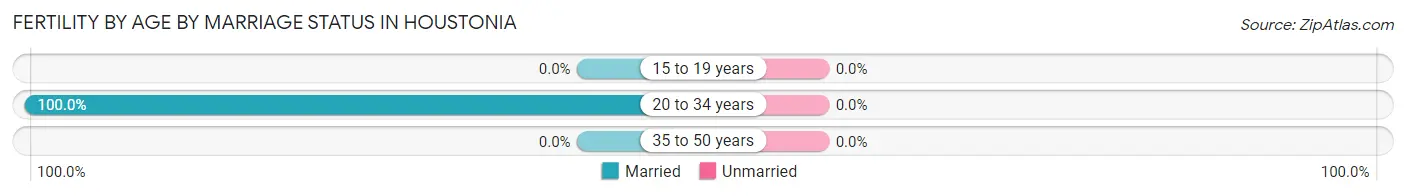
| Age Bracket | Married | Unmarried |
| 15 to 19 years | 0 (0.0%) | 0 (0.0%) |
| 20 to 34 years | 3 (100.0%) | 0 (0.0%) |
| 35 to 50 years | 0 (0.0%) | 0 (0.0%) |
| Total | 3 (100.0%) | 0 (0.0%) |
Fertility by Education in Houstonia
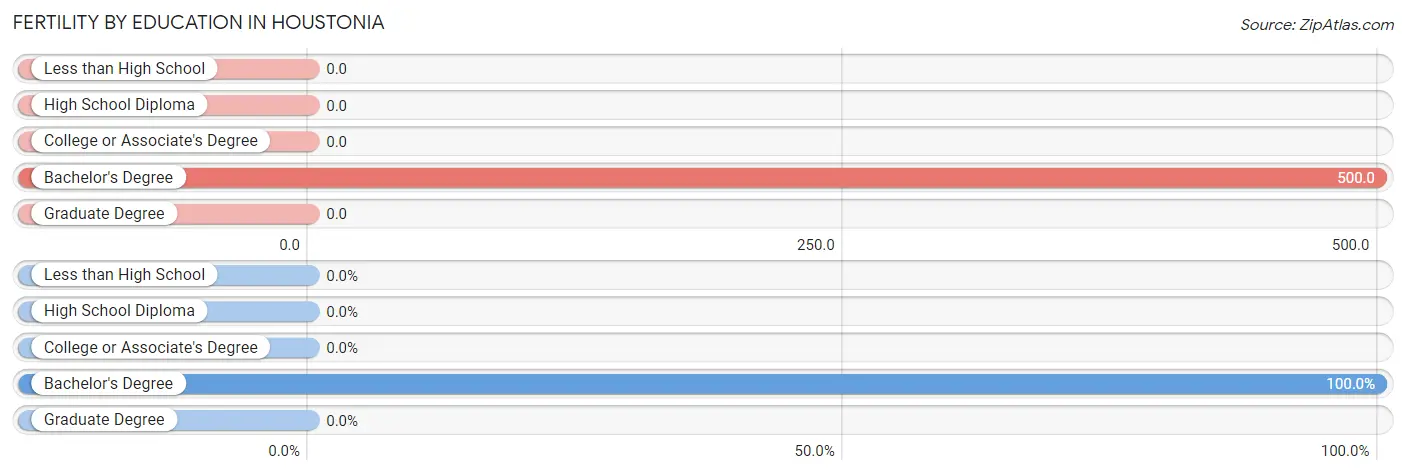
| Educational Attainment | Women with Births | Births / 1,000 Women |
| Less than High School | 0 (0.0%) | 0.0 |
| High School Diploma | 0 (0.0%) | 0.0 |
| College or Associate's Degree | 0 (0.0%) | 0.0 |
| Bachelor's Degree | 3 (100.0%) | 500.0 |
| Graduate Degree | 0 (0.0%) | 0.0 |
| Total | 3 (100.0%) | 130.0 |
Fertility by Education by Marriage Status in Houstonia
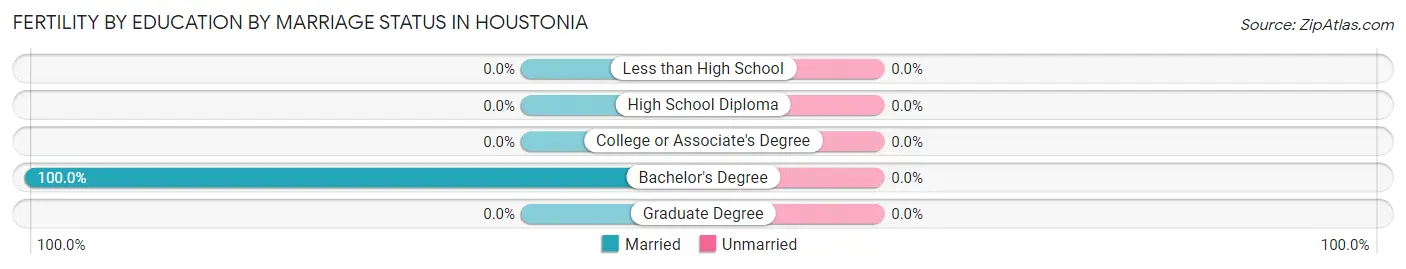
| Educational Attainment | Married | Unmarried |
| Less than High School | 0 (0.0%) | 0 (0.0%) |
| High School Diploma | 0 (0.0%) | 0 (0.0%) |
| College or Associate's Degree | 0 (0.0%) | 0 (0.0%) |
| Bachelor's Degree | 3 (100.0%) | 0 (0.0%) |
| Graduate Degree | 0 (0.0%) | 0 (0.0%) |
| Total | 3 (100.0%) | 0 (0.0%) |
Employment Characteristics in Houstonia
Employment by Class of Employer in Houstonia
Among the 160 employed individuals in Houstonia, private company employees (123 | 76.9%), self-employed (not incorporated) (12 | 7.5%), and local government employees (10 | 6.2%) make up the most common classes of employment.
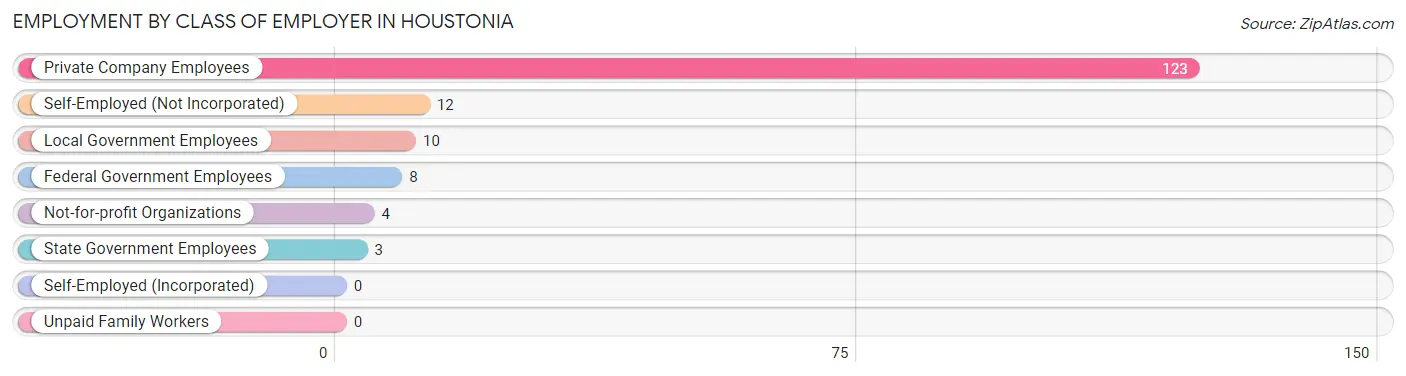
| Employer Class | # Employees | % Employees |
| Private Company Employees | 123 | 76.9% |
| Self-Employed (Incorporated) | 0 | 0.0% |
| Self-Employed (Not Incorporated) | 12 | 7.5% |
| Not-for-profit Organizations | 4 | 2.5% |
| Local Government Employees | 10 | 6.2% |
| State Government Employees | 3 | 1.9% |
| Federal Government Employees | 8 | 5.0% |
| Unpaid Family Workers | 0 | 0.0% |
| Total | 160 | 100.0% |
Employment Status by Age in Houstonia
According to the labor force statistics for Houstonia, out of the total population over 16 years of age (230), 72.2% or 166 individuals are in the labor force, with 1.3% or 2 of them unemployed. The age group with the highest labor force participation rate is 25 to 29 years, with 100.0% or 5 individuals in the labor force. Within the labor force, the 35 to 44 years age range has the highest percentage of unemployed individuals, with 18.2% or 2 of them being unemployed.
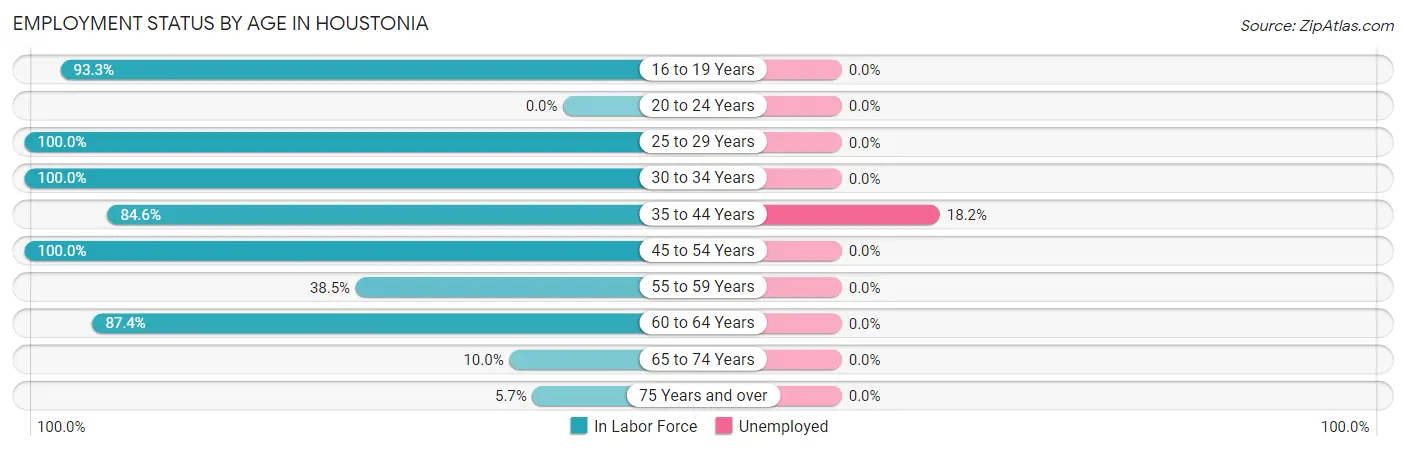
| Age Bracket | In Labor Force | Unemployed |
| 16 to 19 Years | 14 (93.3%) | 0 (0.0%) |
| 20 to 24 Years | 0 (0.0%) | 0 (0.0%) |
| 25 to 29 Years | 5 (100.0%) | 0 (0.0%) |
| 30 to 34 Years | 9 (100.0%) | 0 (0.0%) |
| 35 to 44 Years | 11 (84.6%) | 2 (18.2%) |
| 45 to 54 Years | 43 (100.0%) | 0 (0.0%) |
| 55 to 59 Years | 5 (38.5%) | 0 (0.0%) |
| 60 to 64 Years | 76 (87.4%) | 0 (0.0%) |
| 65 to 74 Years | 1 (10.0%) | 0 (0.0%) |
| 75 Years and over | 2 (5.7%) | 0 (0.0%) |
| Total | 166 (72.2%) | 2 (1.3%) |
Employment Status by Educational Attainment in Houstonia
According to labor force statistics for Houstonia, 87.6% of individuals (149) out of the total population between 25 and 64 years of age (170) are in the labor force, with 1.4% or 2 of them being unemployed. The group with the highest labor force participation rate are those with the educational attainment of less than high school, with 100.0% or 11 individuals in the labor force. Within the labor force, individuals with less than high school education have the highest percentage of unemployment, with 18.2% or 2 of them being unemployed.
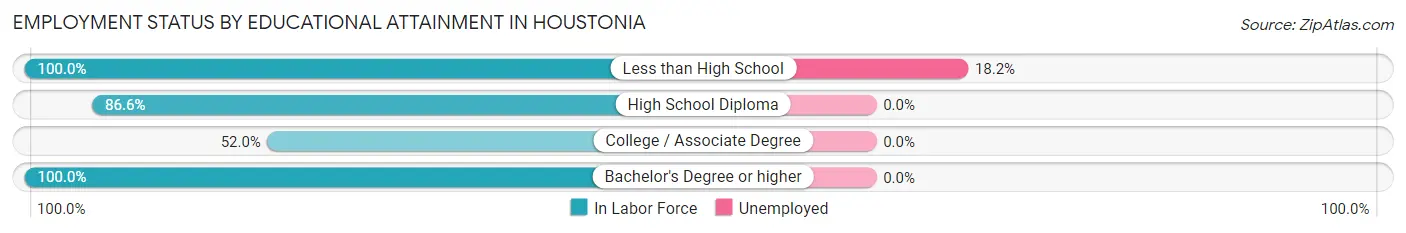
| Educational Attainment | In Labor Force | Unemployed |
| Less than High School | 11 (100.0%) | 2 (18.2%) |
| High School Diploma | 58 (86.6%) | 0 (0.0%) |
| College / Associate Degree | 13 (52.0%) | 0 (0.0%) |
| Bachelor's Degree or higher | 67 (100.0%) | 0 (0.0%) |
| Total | 149 (87.6%) | 2 (1.4%) |
Employment Occupations by Sex in Houstonia
Management, Business, Science and Arts Occupations
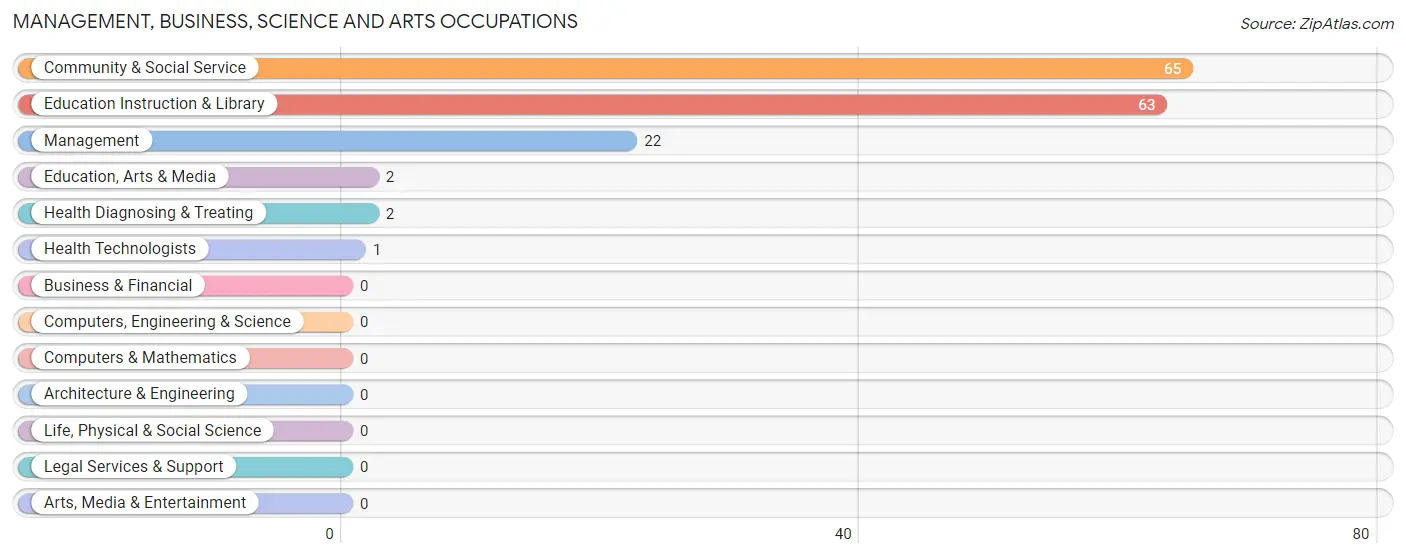
The most common Management, Business, Science and Arts occupations in Houstonia are Community & Social Service (65 | 41.7%), Education Instruction & Library (63 | 40.4%), Management (22 | 14.1%), Education, Arts & Media (2 | 1.3%), and Health Diagnosing & Treating (2 | 1.3%).
Management, Business, Science and Arts Occupations by Sex
Within the Management, Business, Science and Arts occupations in Houstonia, the most male-oriented occupations are Management (86.4%), Education Instruction & Library (3.2%), and Community & Social Service (3.1%), while the most female-oriented occupations are Education, Arts & Media (100.0%), Health Diagnosing & Treating (100.0%), and Health Technologists (100.0%).
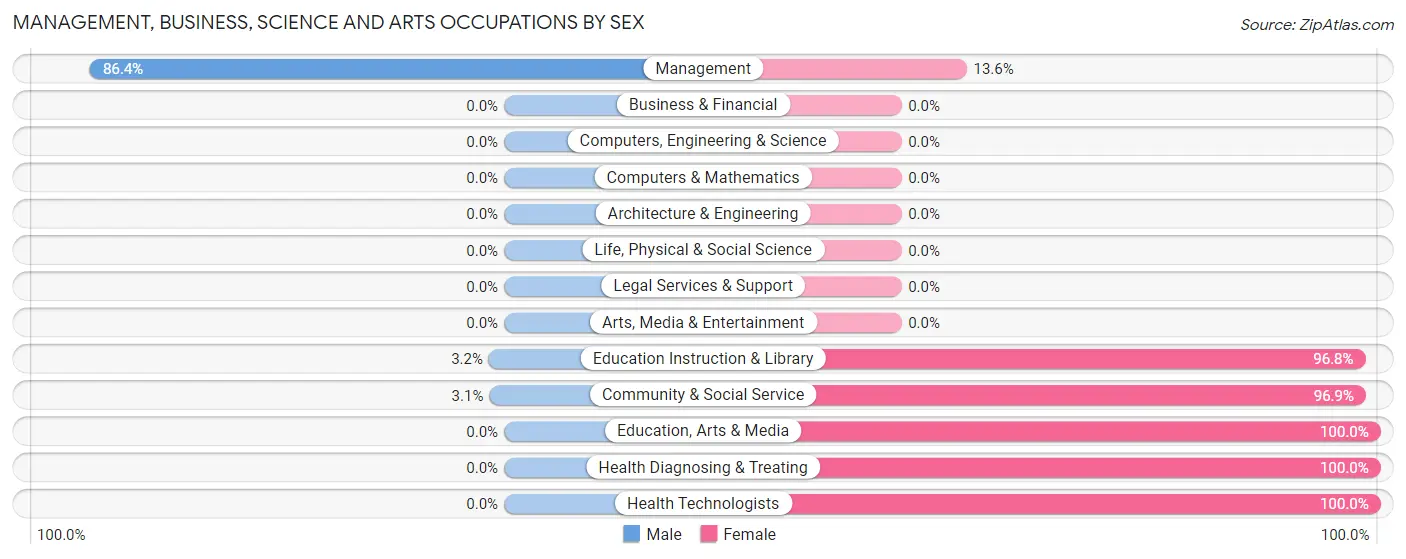
| Occupation | Male | Female |
| Management | 19 (86.4%) | 3 (13.6%) |
| Business & Financial | 0 (0.0%) | 0 (0.0%) |
| Computers, Engineering & Science | 0 (0.0%) | 0 (0.0%) |
| Computers & Mathematics | 0 (0.0%) | 0 (0.0%) |
| Architecture & Engineering | 0 (0.0%) | 0 (0.0%) |
| Life, Physical & Social Science | 0 (0.0%) | 0 (0.0%) |
| Community & Social Service | 2 (3.1%) | 63 (96.9%) |
| Education, Arts & Media | 0 (0.0%) | 2 (100.0%) |
| Legal Services & Support | 0 (0.0%) | 0 (0.0%) |
| Education Instruction & Library | 2 (3.2%) | 61 (96.8%) |
| Arts, Media & Entertainment | 0 (0.0%) | 0 (0.0%) |
| Health Diagnosing & Treating | 0 (0.0%) | 2 (100.0%) |
| Health Technologists | 0 (0.0%) | 1 (100.0%) |
| Total (Category) | 21 (23.6%) | 68 (76.4%) |
| Total (Overall) | 49 (31.4%) | 107 (68.6%) |
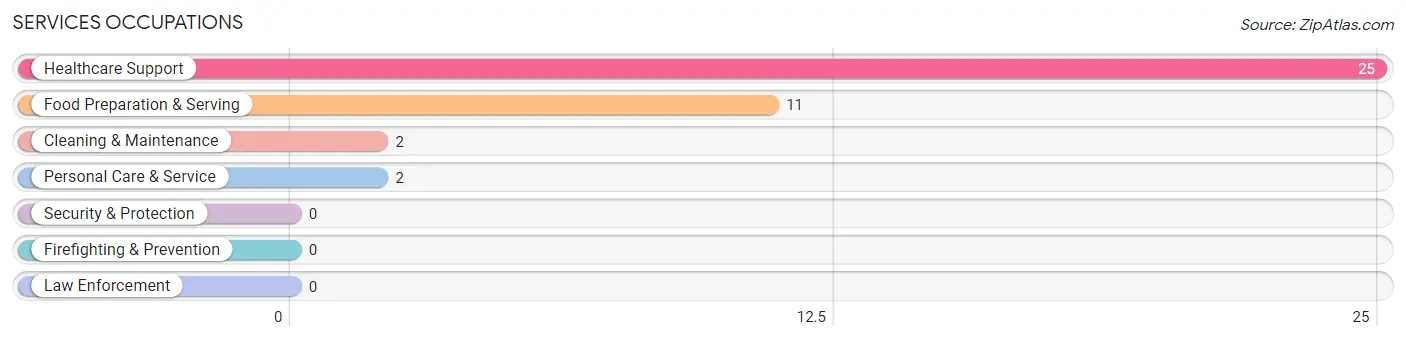
Services Occupations
The most common Services occupations in Houstonia are Healthcare Support (25 | 16.0%), Food Preparation & Serving (11 | 7.0%), Cleaning & Maintenance (2 | 1.3%), and Personal Care & Service (2 | 1.3%).
Services Occupations by Sex
Within the Services occupations in Houstonia, the most male-oriented occupations are Cleaning & Maintenance (100.0%), Personal Care & Service (100.0%), and Food Preparation & Serving (27.3%), while the most female-oriented occupations are Healthcare Support (84.0%), and Food Preparation & Serving (72.7%).
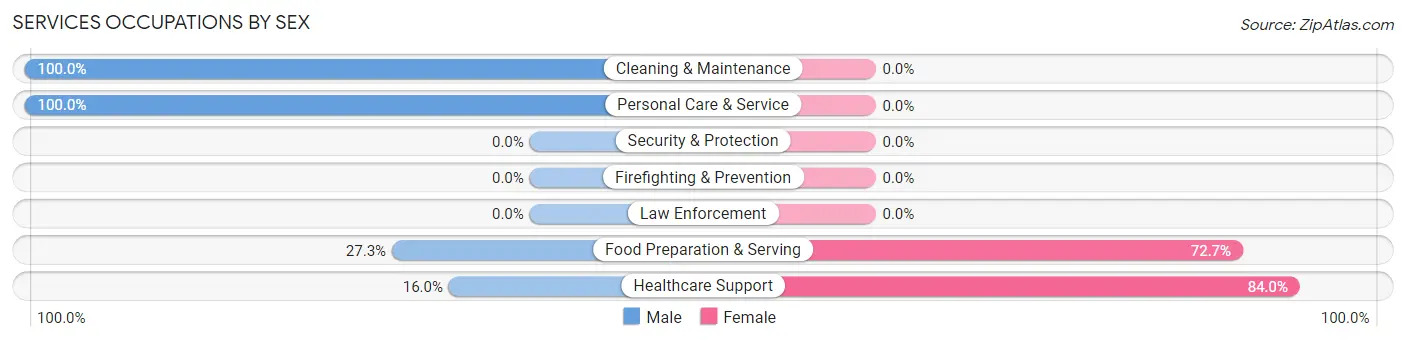
| Occupation | Male | Female |
| Healthcare Support | 4 (16.0%) | 21 (84.0%) |
| Security & Protection | 0 (0.0%) | 0 (0.0%) |
| Firefighting & Prevention | 0 (0.0%) | 0 (0.0%) |
| Law Enforcement | 0 (0.0%) | 0 (0.0%) |
| Food Preparation & Serving | 3 (27.3%) | 8 (72.7%) |
| Cleaning & Maintenance | 2 (100.0%) | 0 (0.0%) |
| Personal Care & Service | 2 (100.0%) | 0 (0.0%) |
| Total (Category) | 11 (27.5%) | 29 (72.5%) |
| Total (Overall) | 49 (31.4%) | 107 (68.6%) |
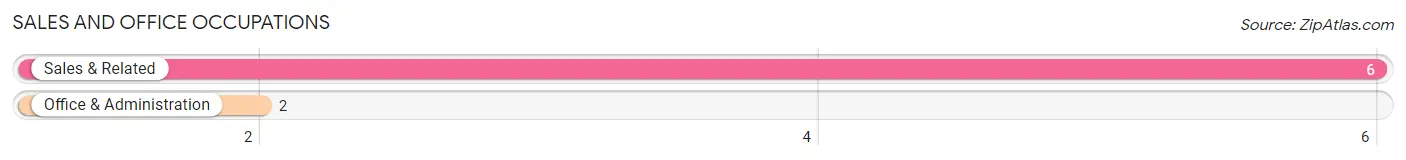
Sales and Office Occupations
The most common Sales and Office occupations in Houstonia are Sales & Related (6 | 3.8%), and Office & Administration (2 | 1.3%).
Sales and Office Occupations by Sex

| Occupation | Male | Female |
| Sales & Related | 2 (33.3%) | 4 (66.7%) |
| Office & Administration | 0 (0.0%) | 2 (100.0%) |
| Total (Category) | 2 (25.0%) | 6 (75.0%) |
| Total (Overall) | 49 (31.4%) | 107 (68.6%) |
Natural Resources, Construction and Maintenance Occupations
The most common Natural Resources, Construction and Maintenance occupations in Houstonia are Farming, Fishing & Forestry (3 | 1.9%), and Installation, Maintenance & Repair (3 | 1.9%).
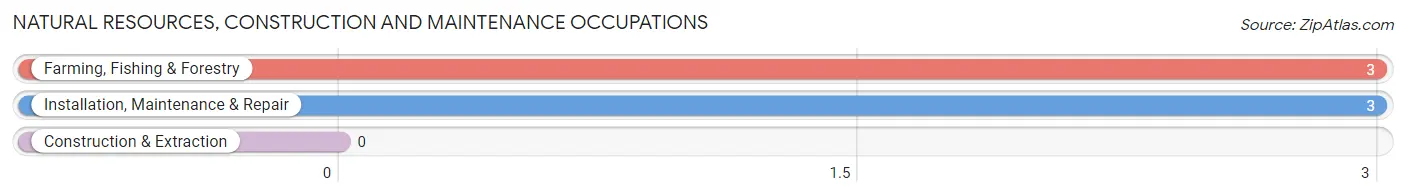
Natural Resources, Construction and Maintenance Occupations by Sex
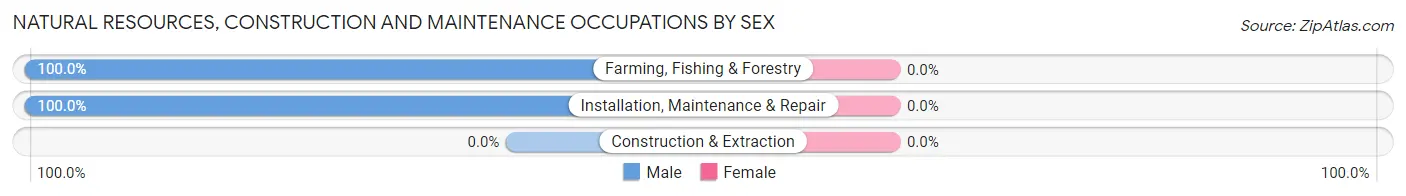
| Occupation | Male | Female |
| Farming, Fishing & Forestry | 3 (100.0%) | 0 (0.0%) |
| Construction & Extraction | 0 (0.0%) | 0 (0.0%) |
| Installation, Maintenance & Repair | 3 (100.0%) | 0 (0.0%) |
| Total (Category) | 6 (100.0%) | 0 (0.0%) |
| Total (Overall) | 49 (31.4%) | 107 (68.6%) |
Production, Transportation and Moving Occupations
The most common Production, Transportation and Moving occupations in Houstonia are Production (10 | 6.4%), and Transportation (3 | 1.9%).
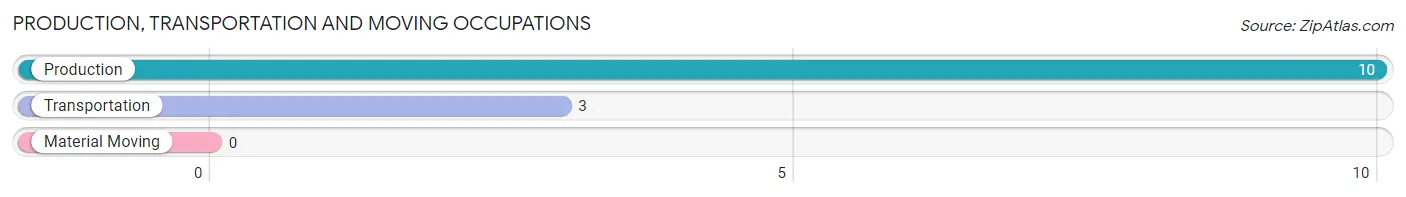
Production, Transportation and Moving Occupations by Sex
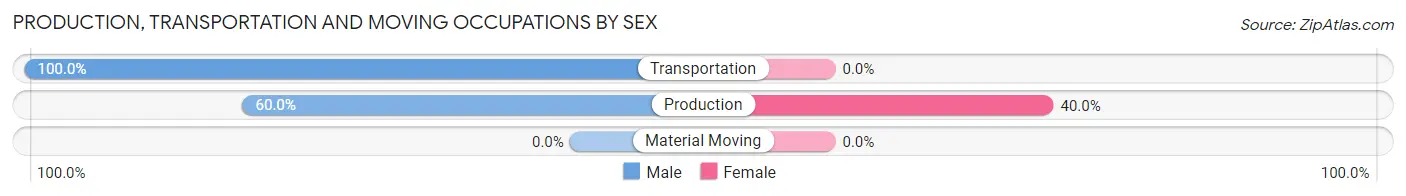
| Occupation | Male | Female |
| Production | 6 (60.0%) | 4 (40.0%) |
| Transportation | 3 (100.0%) | 0 (0.0%) |
| Material Moving | 0 (0.0%) | 0 (0.0%) |
| Total (Category) | 9 (69.2%) | 4 (30.8%) |
| Total (Overall) | 49 (31.4%) | 107 (68.6%) |
Employment Industries by Sex in Houstonia
Employment Industries in Houstonia
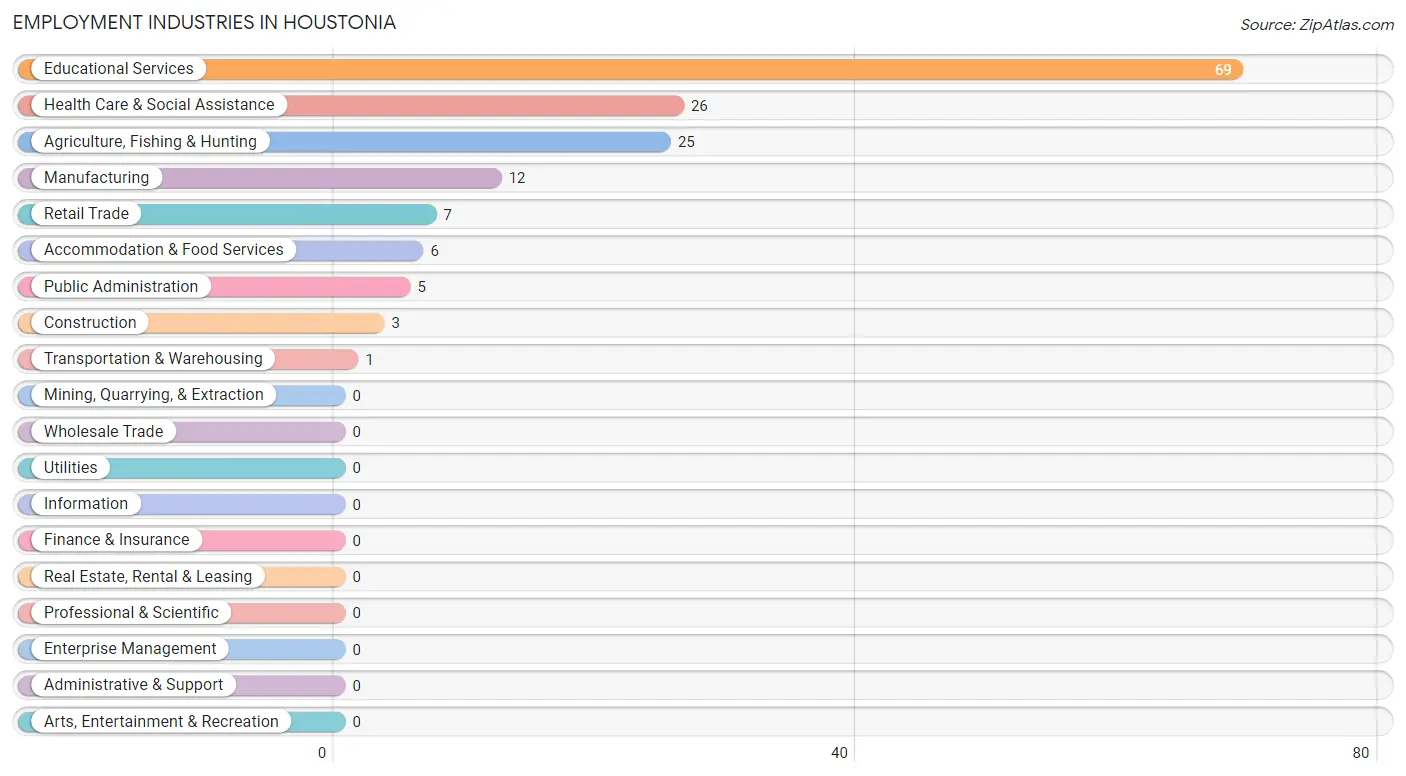
The major employment industries in Houstonia include Educational Services (69 | 44.2%), Health Care & Social Assistance (26 | 16.7%), Agriculture, Fishing & Hunting (25 | 16.0%), Manufacturing (12 | 7.7%), and Retail Trade (7 | 4.5%).
Employment Industries by Sex in Houstonia
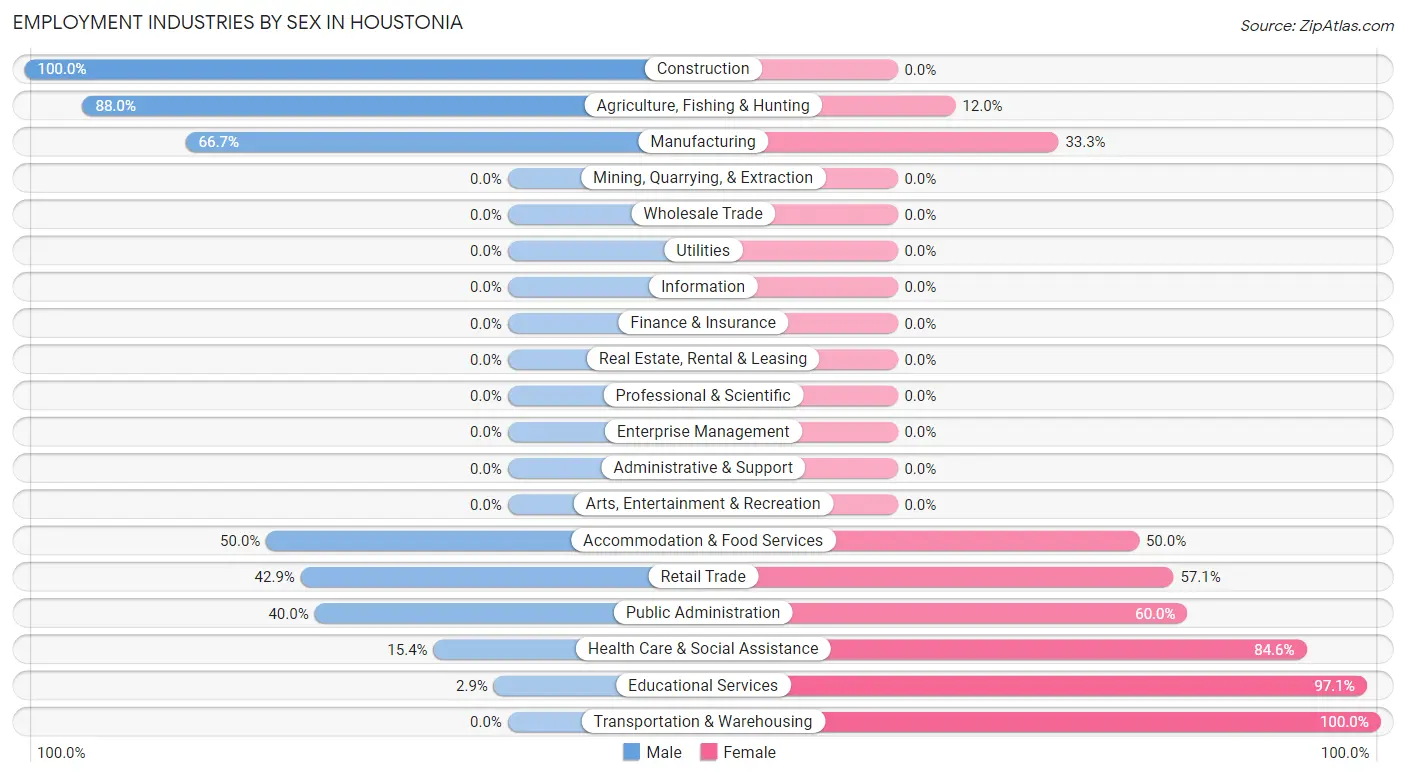
The Houstonia industries that see more men than women are Construction (100.0%), Agriculture, Fishing & Hunting (88.0%), and Manufacturing (66.7%), whereas the industries that tend to have a higher number of women are Transportation & Warehousing (100.0%), Educational Services (97.1%), and Health Care & Social Assistance (84.6%).
| Industry | Male | Female |
| Agriculture, Fishing & Hunting | 22 (88.0%) | 3 (12.0%) |
| Mining, Quarrying, & Extraction | 0 (0.0%) | 0 (0.0%) |
| Construction | 3 (100.0%) | 0 (0.0%) |
| Manufacturing | 8 (66.7%) | 4 (33.3%) |
| Wholesale Trade | 0 (0.0%) | 0 (0.0%) |
| Retail Trade | 3 (42.9%) | 4 (57.1%) |
| Transportation & Warehousing | 0 (0.0%) | 1 (100.0%) |
| Utilities | 0 (0.0%) | 0 (0.0%) |
| Information | 0 (0.0%) | 0 (0.0%) |
| Finance & Insurance | 0 (0.0%) | 0 (0.0%) |
| Real Estate, Rental & Leasing | 0 (0.0%) | 0 (0.0%) |
| Professional & Scientific | 0 (0.0%) | 0 (0.0%) |
| Enterprise Management | 0 (0.0%) | 0 (0.0%) |
| Administrative & Support | 0 (0.0%) | 0 (0.0%) |
| Educational Services | 2 (2.9%) | 67 (97.1%) |
| Health Care & Social Assistance | 4 (15.4%) | 22 (84.6%) |
| Arts, Entertainment & Recreation | 0 (0.0%) | 0 (0.0%) |
| Accommodation & Food Services | 3 (50.0%) | 3 (50.0%) |
| Public Administration | 2 (40.0%) | 3 (60.0%) |
| Total | 49 (31.4%) | 107 (68.6%) |
Education in Houstonia
School Enrollment in Houstonia
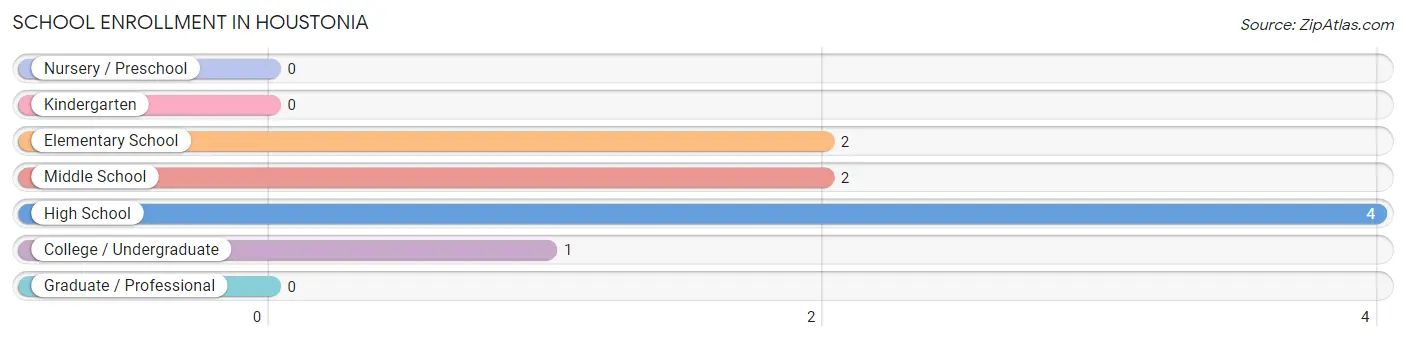
The most common levels of schooling among the 9 students in Houstonia are high school (4 | 44.4%), elementary school (2 | 22.2%), and middle school (2 | 22.2%).
| School Level | # Students | % Students |
| Nursery / Preschool | 0 | 0.0% |
| Kindergarten | 0 | 0.0% |
| Elementary School | 2 | 22.2% |
| Middle School | 2 | 22.2% |
| High School | 4 | 44.4% |
| College / Undergraduate | 1 | 11.1% |
| Graduate / Professional | 0 | 0.0% |
| Total | 9 | 100.0% |
School Enrollment by Age by Funding Source in Houstonia
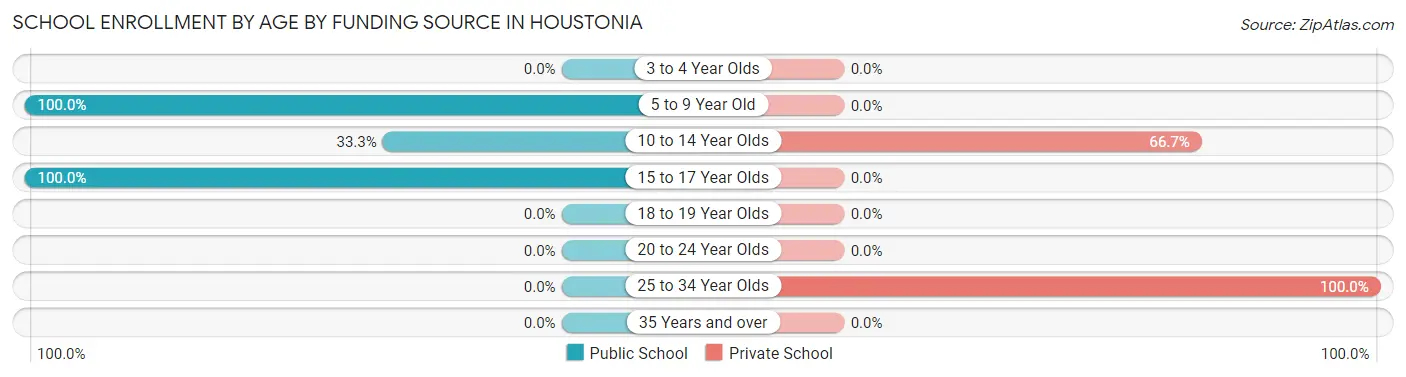
Out of a total of 9 students who are enrolled in schools in Houstonia, 3 (33.3%) attend a private institution, while the remaining 6 (66.7%) are enrolled in public schools. The age group of 25 to 34 year olds has the highest likelihood of being enrolled in private schools, with 1 (100.0% in the age bracket) enrolled. Conversely, the age group of 5 to 9 year old has the lowest likelihood of being enrolled in a private school, with 2 (100.0% in the age bracket) attending a public institution.
| Age Bracket | Public School | Private School |
| 3 to 4 Year Olds | 0 (0.0%) | 0 (0.0%) |
| 5 to 9 Year Old | 2 (100.0%) | 0 (0.0%) |
| 10 to 14 Year Olds | 1 (33.3%) | 2 (66.7%) |
| 15 to 17 Year Olds | 3 (100.0%) | 0 (0.0%) |
| 18 to 19 Year Olds | 0 (0.0%) | 0 (0.0%) |
| 20 to 24 Year Olds | 0 (0.0%) | 0 (0.0%) |
| 25 to 34 Year Olds | 0 (0.0%) | 1 (100.0%) |
| 35 Years and over | 0 (0.0%) | 0 (0.0%) |
| Total | 6 (66.7%) | 3 (33.3%) |
Educational Attainment by Field of Study in Houstonia
Education (65 | 94.2%), engineering (3 | 4.3%), and business (1 | 1.5%) are the most common fields of study among 69 individuals in Houstonia who have obtained a bachelor's degree or higher.
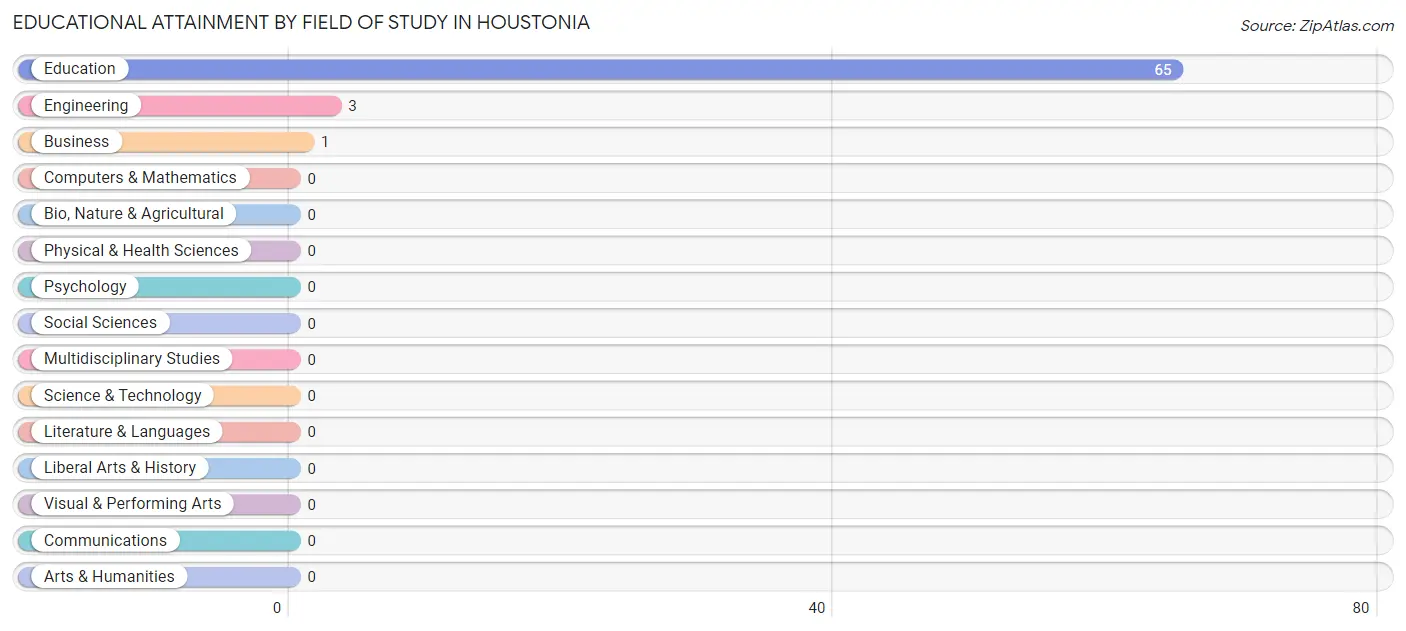
| Field of Study | # Graduates | % Graduates |
| Computers & Mathematics | 0 | 0.0% |
| Bio, Nature & Agricultural | 0 | 0.0% |
| Physical & Health Sciences | 0 | 0.0% |
| Psychology | 0 | 0.0% |
| Social Sciences | 0 | 0.0% |
| Engineering | 3 | 4.3% |
| Multidisciplinary Studies | 0 | 0.0% |
| Science & Technology | 0 | 0.0% |
| Business | 1 | 1.5% |
| Education | 65 | 94.2% |
| Literature & Languages | 0 | 0.0% |
| Liberal Arts & History | 0 | 0.0% |
| Visual & Performing Arts | 0 | 0.0% |
| Communications | 0 | 0.0% |
| Arts & Humanities | 0 | 0.0% |
| Total | 69 | 100.0% |
Transportation & Commute in Houstonia
Vehicle Availability by Sex in Houstonia
The most prevalent vehicle ownership categories in Houstonia are males with 2 vehicles (36, accounting for 70.6%) and females with 2 vehicles (95, making up 33.0%).
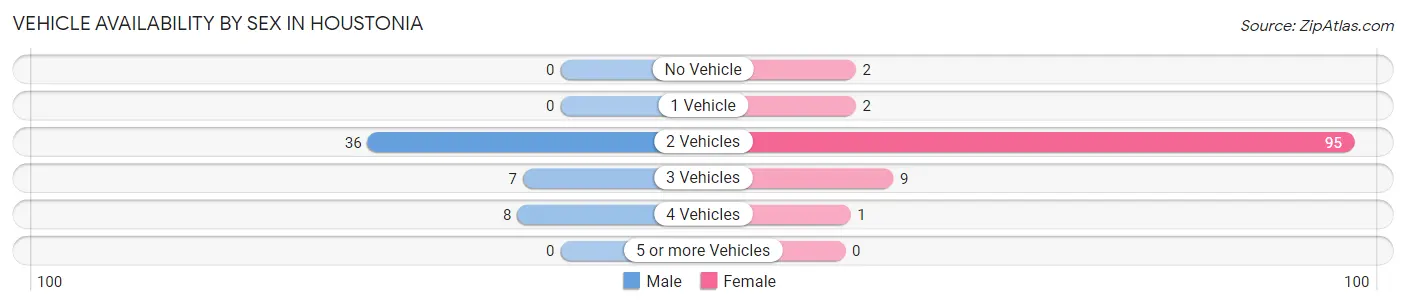
| Vehicles Available | Male | Female |
| No Vehicle | 0 (0.0%) | 2 (1.8%) |
| 1 Vehicle | 0 (0.0%) | 2 (1.8%) |
| 2 Vehicles | 36 (70.6%) | 95 (87.2%) |
| 3 Vehicles | 7 (13.7%) | 9 (8.3%) |
| 4 Vehicles | 8 (15.7%) | 1 (0.9%) |
| 5 or more Vehicles | 0 (0.0%) | 0 (0.0%) |
| Total | 51 (100.0%) | 109 (100.0%) |
Commute Time in Houstonia
The most frequently occuring commute durations in Houstonia are 40 to 44 minutes (59 commuters, 42.1%), 20 to 24 minutes (20 commuters, 14.3%), and 45 to 59 minutes (16 commuters, 11.4%).
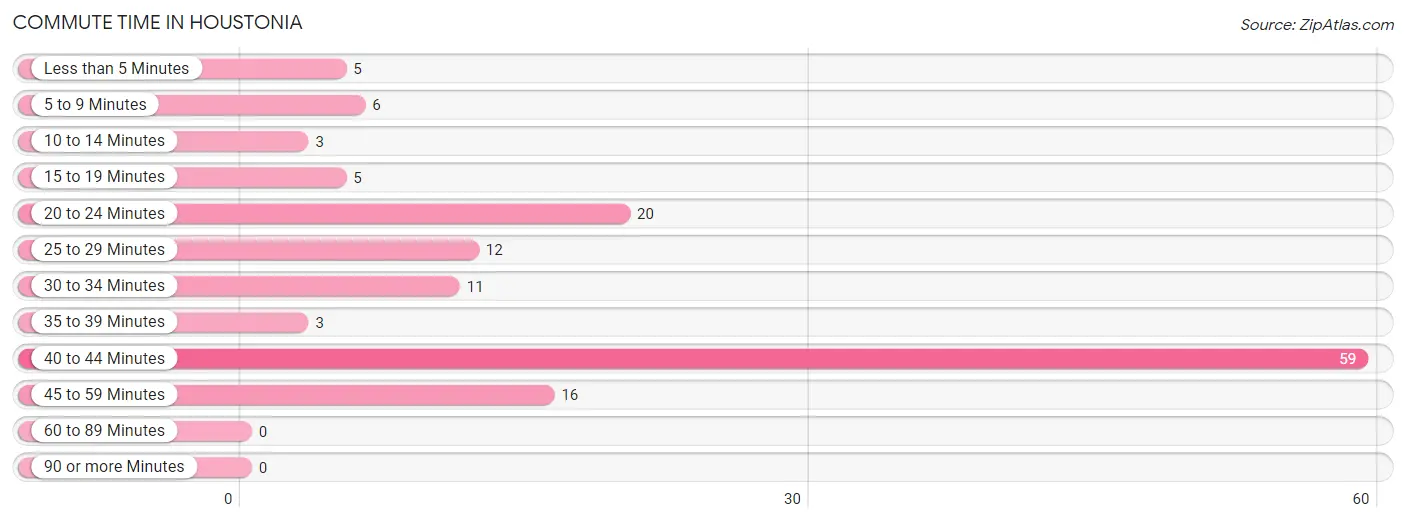
| Commute Time | # Commuters | % Commuters |
| Less than 5 Minutes | 5 | 3.6% |
| 5 to 9 Minutes | 6 | 4.3% |
| 10 to 14 Minutes | 3 | 2.1% |
| 15 to 19 Minutes | 5 | 3.6% |
| 20 to 24 Minutes | 20 | 14.3% |
| 25 to 29 Minutes | 12 | 8.6% |
| 30 to 34 Minutes | 11 | 7.9% |
| 35 to 39 Minutes | 3 | 2.1% |
| 40 to 44 Minutes | 59 | 42.1% |
| 45 to 59 Minutes | 16 | 11.4% |
| 60 to 89 Minutes | 0 | 0.0% |
| 90 or more Minutes | 0 | 0.0% |
Commute Time by Sex in Houstonia
The most common commute times in Houstonia are 20 to 24 minutes (20 commuters, 39.2%) for males and 40 to 44 minutes (59 commuters, 66.3%) for females.
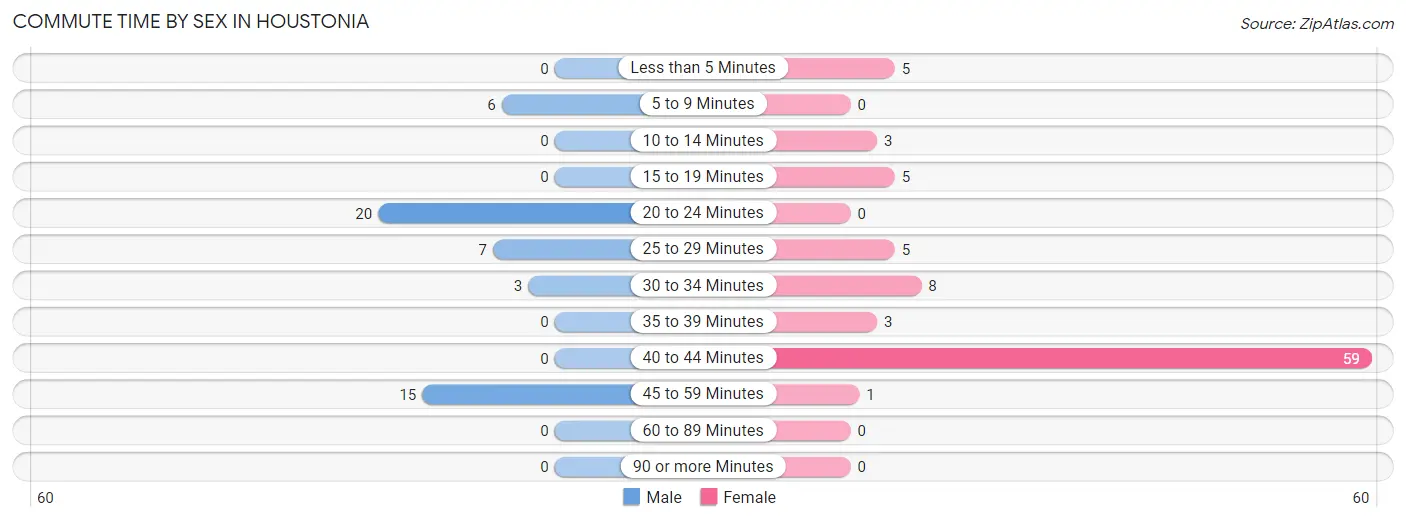
| Commute Time | Male | Female |
| Less than 5 Minutes | 0 (0.0%) | 5 (5.6%) |
| 5 to 9 Minutes | 6 (11.8%) | 0 (0.0%) |
| 10 to 14 Minutes | 0 (0.0%) | 3 (3.4%) |
| 15 to 19 Minutes | 0 (0.0%) | 5 (5.6%) |
| 20 to 24 Minutes | 20 (39.2%) | 0 (0.0%) |
| 25 to 29 Minutes | 7 (13.7%) | 5 (5.6%) |
| 30 to 34 Minutes | 3 (5.9%) | 8 (9.0%) |
| 35 to 39 Minutes | 0 (0.0%) | 3 (3.4%) |
| 40 to 44 Minutes | 0 (0.0%) | 59 (66.3%) |
| 45 to 59 Minutes | 15 (29.4%) | 1 (1.1%) |
| 60 to 89 Minutes | 0 (0.0%) | 0 (0.0%) |
| 90 or more Minutes | 0 (0.0%) | 0 (0.0%) |
Time of Departure to Work by Sex in Houstonia
The most frequent times of departure to work in Houstonia are 8:00 AM to 8:29 AM (12, 23.5%) for males and 12:00 PM to 3:59 PM (59, 66.3%) for females.
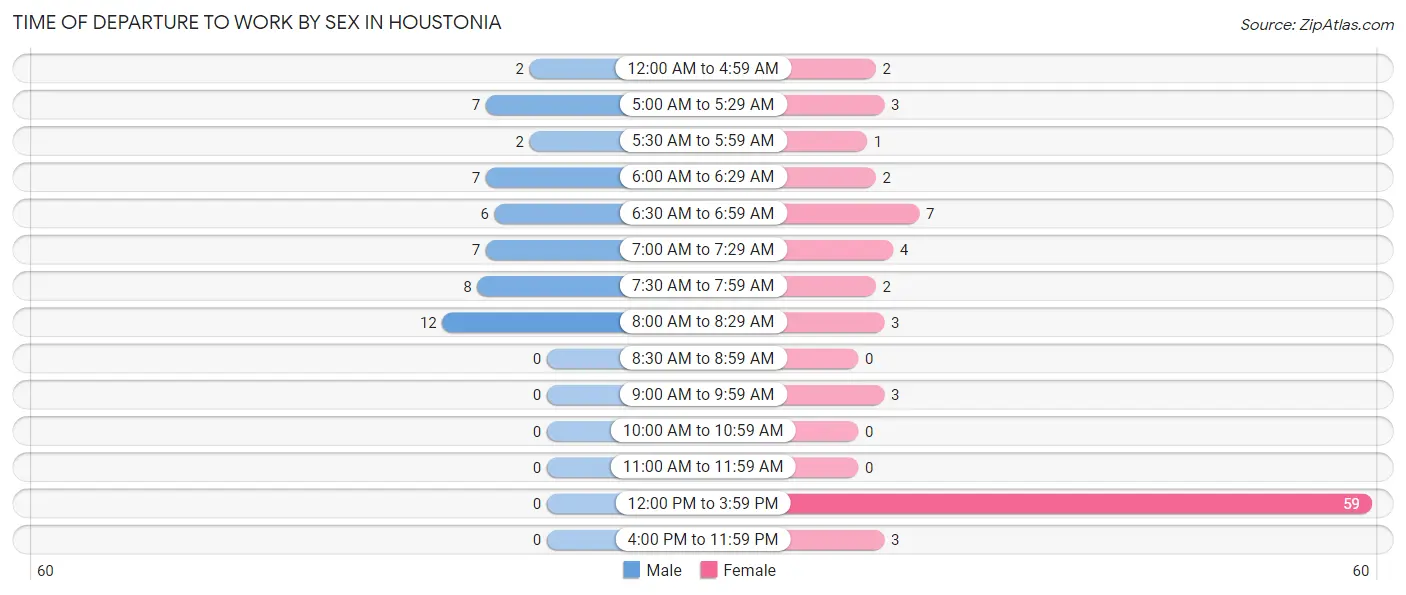
| Time of Departure | Male | Female |
| 12:00 AM to 4:59 AM | 2 (3.9%) | 2 (2.2%) |
| 5:00 AM to 5:29 AM | 7 (13.7%) | 3 (3.4%) |
| 5:30 AM to 5:59 AM | 2 (3.9%) | 1 (1.1%) |
| 6:00 AM to 6:29 AM | 7 (13.7%) | 2 (2.2%) |
| 6:30 AM to 6:59 AM | 6 (11.8%) | 7 (7.9%) |
| 7:00 AM to 7:29 AM | 7 (13.7%) | 4 (4.5%) |
| 7:30 AM to 7:59 AM | 8 (15.7%) | 2 (2.2%) |
| 8:00 AM to 8:29 AM | 12 (23.5%) | 3 (3.4%) |
| 8:30 AM to 8:59 AM | 0 (0.0%) | 0 (0.0%) |
| 9:00 AM to 9:59 AM | 0 (0.0%) | 3 (3.4%) |
| 10:00 AM to 10:59 AM | 0 (0.0%) | 0 (0.0%) |
| 11:00 AM to 11:59 AM | 0 (0.0%) | 0 (0.0%) |
| 12:00 PM to 3:59 PM | 0 (0.0%) | 59 (66.3%) |
| 4:00 PM to 11:59 PM | 0 (0.0%) | 3 (3.4%) |
| Total | 51 (100.0%) | 89 (100.0%) |
Housing Occupancy in Houstonia
Occupancy by Ownership in Houstonia
Of the total 150 dwellings in Houstonia, owner-occupied units account for 142 (94.7%), while renter-occupied units make up 8 (5.3%).
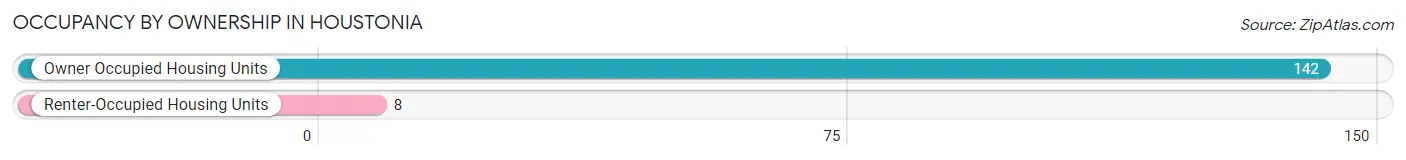
| Occupancy | # Housing Units | % Housing Units |
| Owner Occupied Housing Units | 142 | 94.7% |
| Renter-Occupied Housing Units | 8 | 5.3% |
| Total Occupied Housing Units | 150 | 100.0% |
Occupancy by Household Size in Houstonia
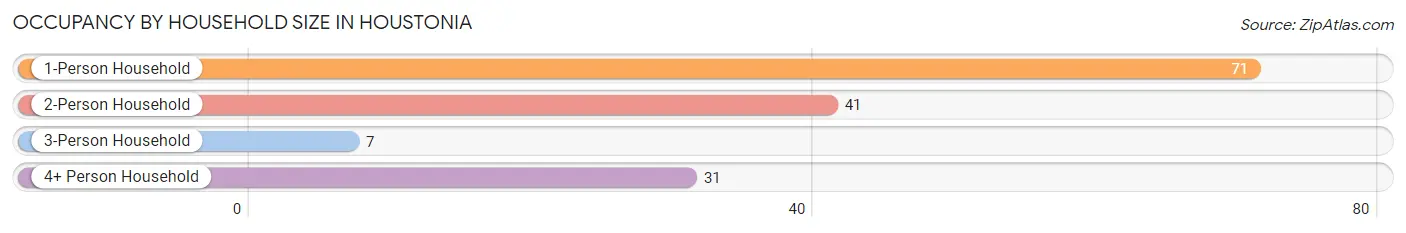
| Household Size | # Housing Units | % Housing Units |
| 1-Person Household | 71 | 47.3% |
| 2-Person Household | 41 | 27.3% |
| 3-Person Household | 7 | 4.7% |
| 4+ Person Household | 31 | 20.7% |
| Total Housing Units | 150 | 100.0% |
Occupancy by Ownership by Household Size in Houstonia
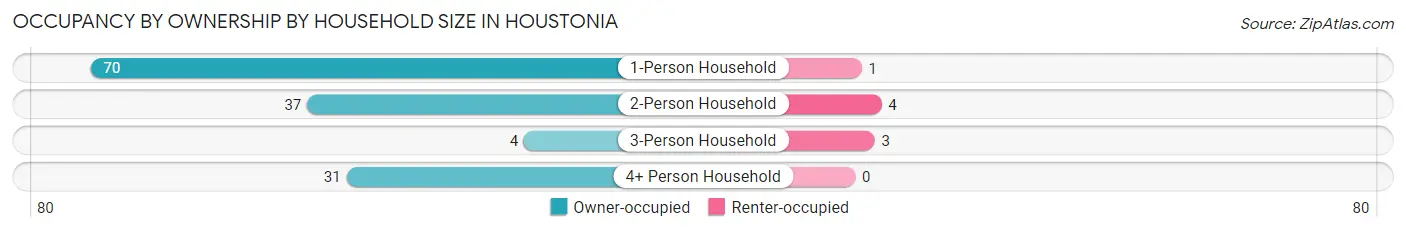
| Household Size | Owner-occupied | Renter-occupied |
| 1-Person Household | 70 (98.6%) | 1 (1.4%) |
| 2-Person Household | 37 (90.2%) | 4 (9.8%) |
| 3-Person Household | 4 (57.1%) | 3 (42.9%) |
| 4+ Person Household | 31 (100.0%) | 0 (0.0%) |
| Total Housing Units | 142 (94.7%) | 8 (5.3%) |
Occupancy by Educational Attainment in Houstonia
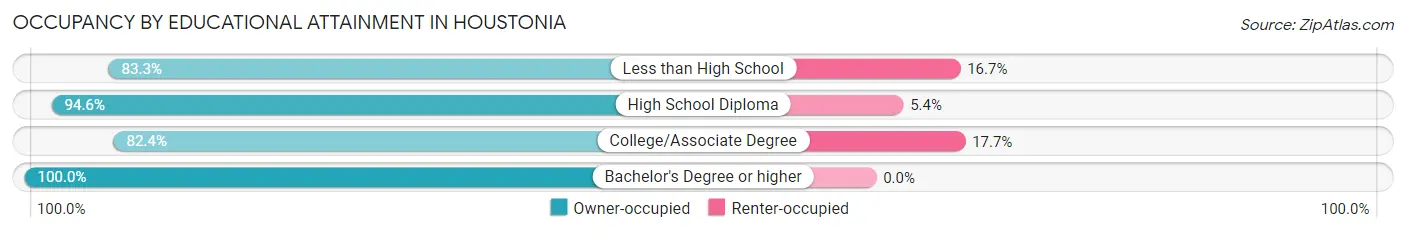
| Household Size | Owner-occupied | Renter-occupied |
| Less than High School | 10 (83.3%) | 2 (16.7%) |
| High School Diploma | 53 (94.6%) | 3 (5.4%) |
| College/Associate Degree | 14 (82.4%) | 3 (17.6%) |
| Bachelor's Degree or higher | 65 (100.0%) | 0 (0.0%) |
Occupancy by Age of Householder in Houstonia
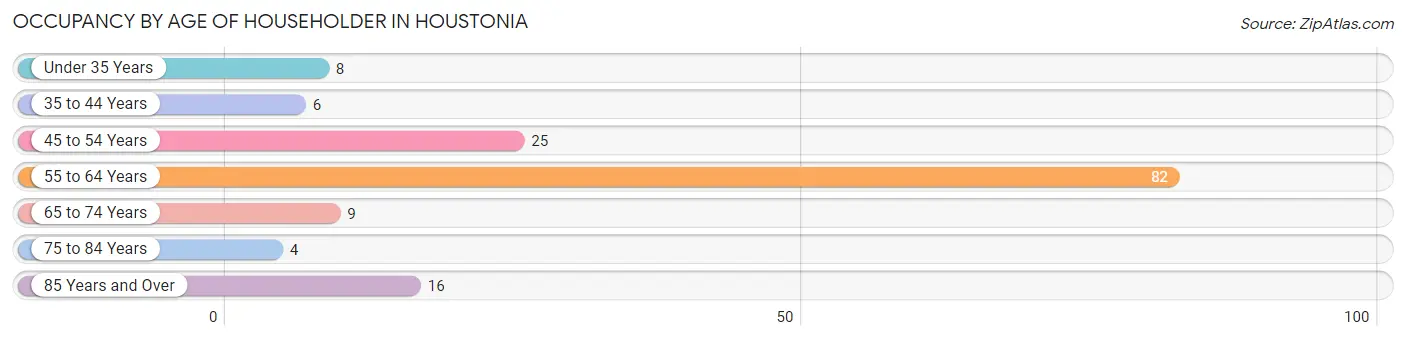
| Age Bracket | # Households | % Households |
| Under 35 Years | 8 | 5.3% |
| 35 to 44 Years | 6 | 4.0% |
| 45 to 54 Years | 25 | 16.7% |
| 55 to 64 Years | 82 | 54.7% |
| 65 to 74 Years | 9 | 6.0% |
| 75 to 84 Years | 4 | 2.7% |
| 85 Years and Over | 16 | 10.7% |
| Total | 150 | 100.0% |
Housing Finances in Houstonia
Median Income by Occupancy in Houstonia
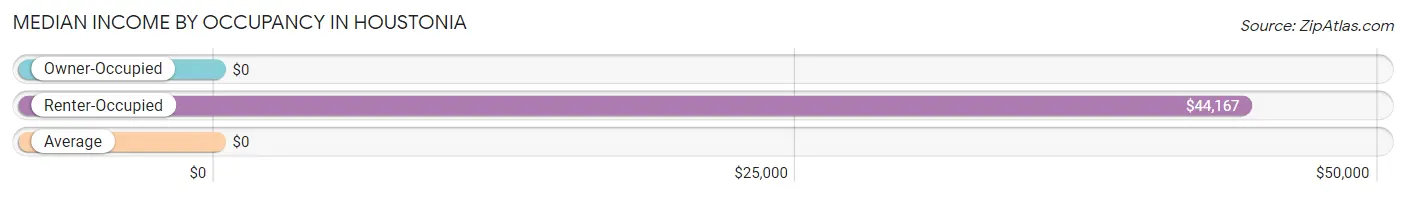
| Occupancy Type | # Households | Median Income |
| Owner-Occupied | 142 (94.7%) | $0 |
| Renter-Occupied | 8 (5.3%) | $44,167 |
| Average | 150 (100.0%) | $0 |
Occupancy by Householder Income Bracket in Houstonia
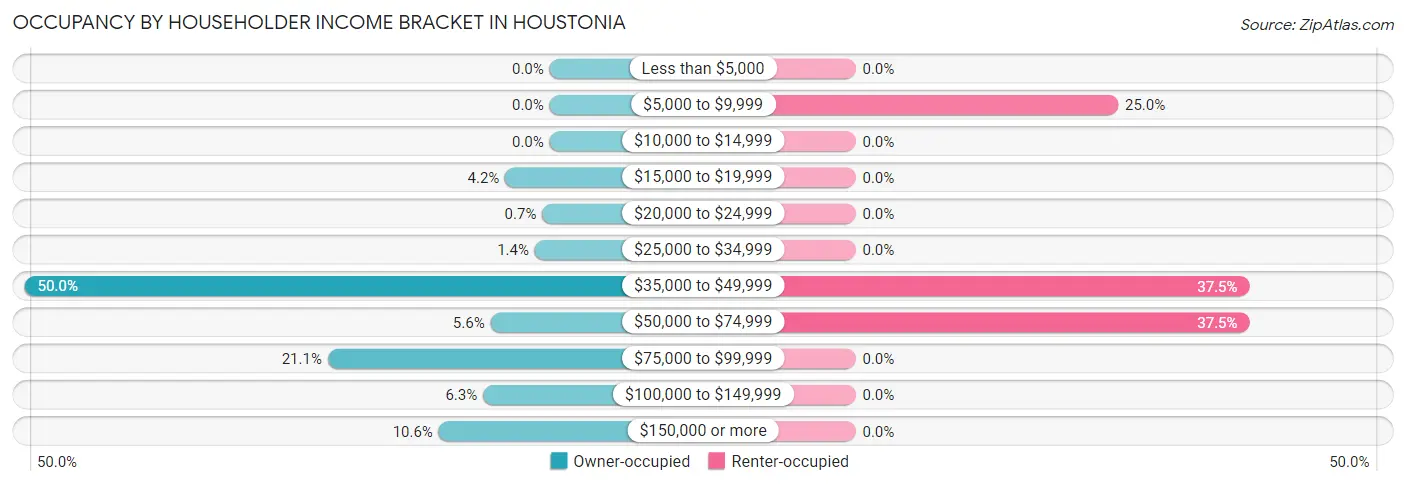
| Income Bracket | Owner-occupied | Renter-occupied |
| Less than $5,000 | 0 (0.0%) | 0 (0.0%) |
| $5,000 to $9,999 | 0 (0.0%) | 2 (25.0%) |
| $10,000 to $14,999 | 0 (0.0%) | 0 (0.0%) |
| $15,000 to $19,999 | 6 (4.2%) | 0 (0.0%) |
| $20,000 to $24,999 | 1 (0.7%) | 0 (0.0%) |
| $25,000 to $34,999 | 2 (1.4%) | 0 (0.0%) |
| $35,000 to $49,999 | 71 (50.0%) | 3 (37.5%) |
| $50,000 to $74,999 | 8 (5.6%) | 3 (37.5%) |
| $75,000 to $99,999 | 30 (21.1%) | 0 (0.0%) |
| $100,000 to $149,999 | 9 (6.3%) | 0 (0.0%) |
| $150,000 or more | 15 (10.6%) | 0 (0.0%) |
| Total | 142 (100.0%) | 8 (100.0%) |
Monthly Housing Cost Tiers in Houstonia
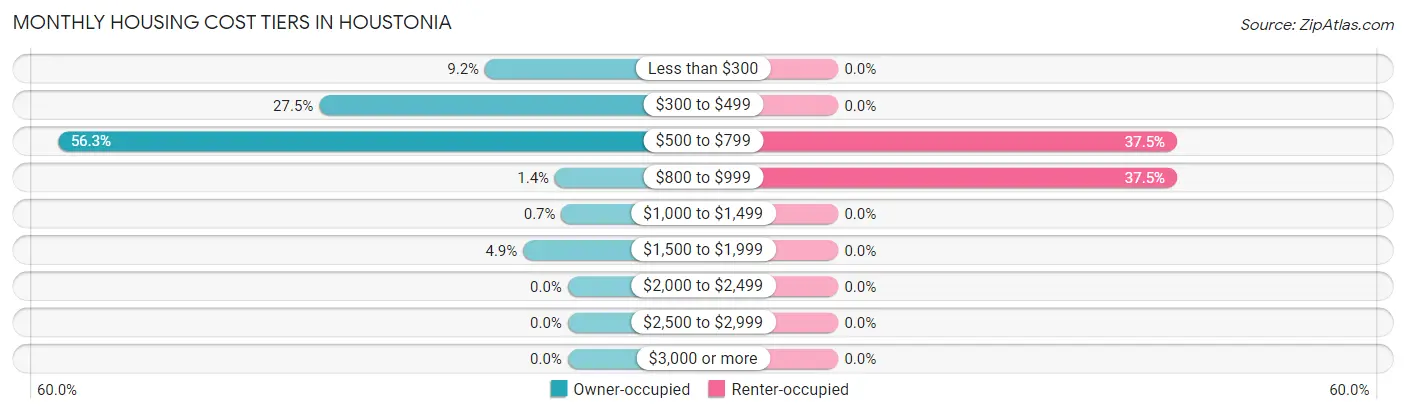
| Monthly Cost | Owner-occupied | Renter-occupied |
| Less than $300 | 13 (9.1%) | 0 (0.0%) |
| $300 to $499 | 39 (27.5%) | 0 (0.0%) |
| $500 to $799 | 80 (56.3%) | 3 (37.5%) |
| $800 to $999 | 2 (1.4%) | 3 (37.5%) |
| $1,000 to $1,499 | 1 (0.7%) | 0 (0.0%) |
| $1,500 to $1,999 | 7 (4.9%) | 0 (0.0%) |
| $2,000 to $2,499 | 0 (0.0%) | 0 (0.0%) |
| $2,500 to $2,999 | 0 (0.0%) | 0 (0.0%) |
| $3,000 or more | 0 (0.0%) | 0 (0.0%) |
| Total | 142 (100.0%) | 8 (100.0%) |
Physical Housing Characteristics in Houstonia
Housing Structures in Houstonia
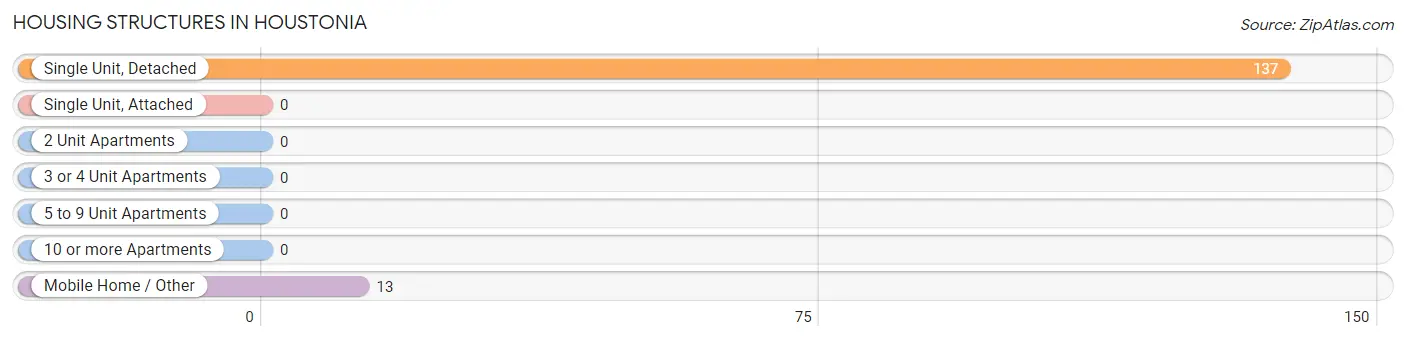
| Structure Type | # Housing Units | % Housing Units |
| Single Unit, Detached | 137 | 91.3% |
| Single Unit, Attached | 0 | 0.0% |
| 2 Unit Apartments | 0 | 0.0% |
| 3 or 4 Unit Apartments | 0 | 0.0% |
| 5 to 9 Unit Apartments | 0 | 0.0% |
| 10 or more Apartments | 0 | 0.0% |
| Mobile Home / Other | 13 | 8.7% |
| Total | 150 | 100.0% |
Housing Structures by Occupancy in Houstonia
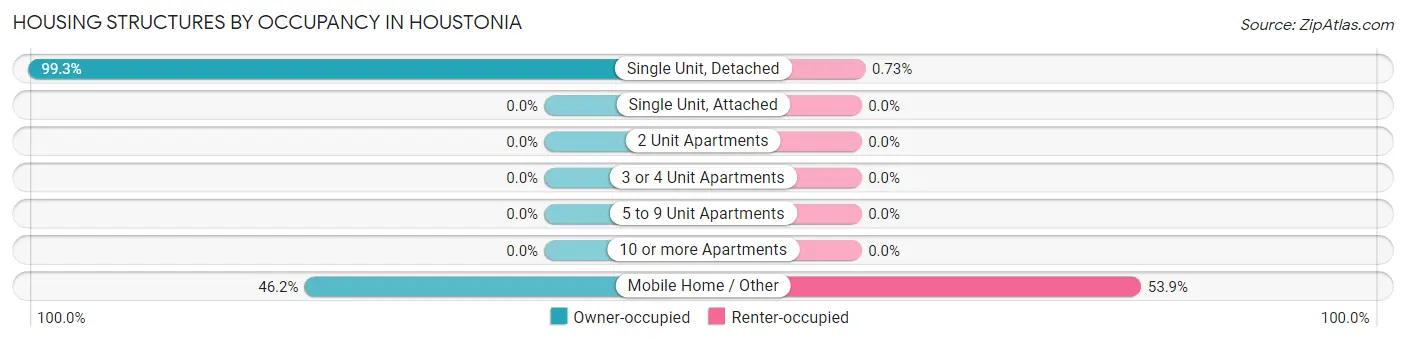
| Structure Type | Owner-occupied | Renter-occupied |
| Single Unit, Detached | 136 (99.3%) | 1 (0.7%) |
| Single Unit, Attached | 0 (0.0%) | 0 (0.0%) |
| 2 Unit Apartments | 0 (0.0%) | 0 (0.0%) |
| 3 or 4 Unit Apartments | 0 (0.0%) | 0 (0.0%) |
| 5 to 9 Unit Apartments | 0 (0.0%) | 0 (0.0%) |
| 10 or more Apartments | 0 (0.0%) | 0 (0.0%) |
| Mobile Home / Other | 6 (46.2%) | 7 (53.8%) |
| Total | 142 (94.7%) | 8 (5.3%) |
Housing Structures by Number of Rooms in Houstonia
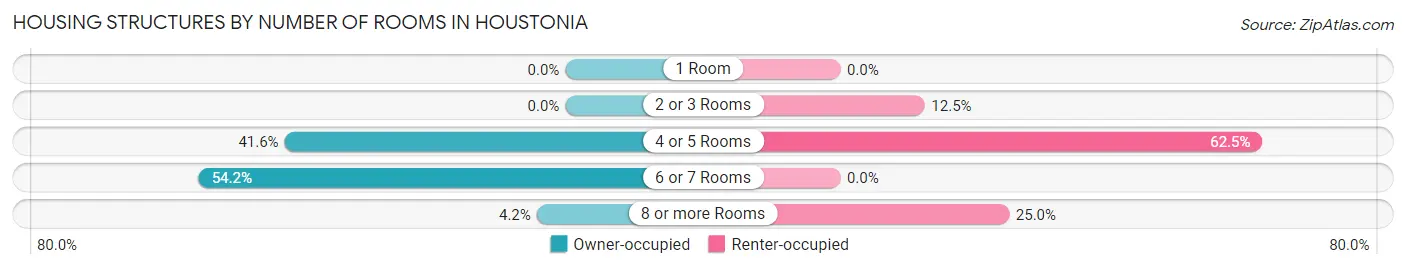
| Number of Rooms | Owner-occupied | Renter-occupied |
| 1 Room | 0 (0.0%) | 0 (0.0%) |
| 2 or 3 Rooms | 0 (0.0%) | 1 (12.5%) |
| 4 or 5 Rooms | 59 (41.5%) | 5 (62.5%) |
| 6 or 7 Rooms | 77 (54.2%) | 0 (0.0%) |
| 8 or more Rooms | 6 (4.2%) | 2 (25.0%) |
| Total | 142 (100.0%) | 8 (100.0%) |
Housing Structure by Heating Type in Houstonia
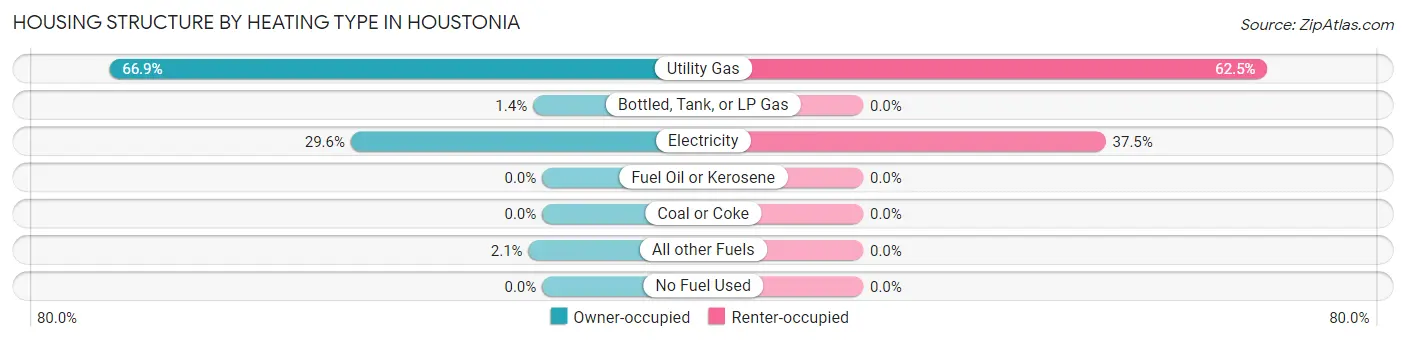
| Heating Type | Owner-occupied | Renter-occupied |
| Utility Gas | 95 (66.9%) | 5 (62.5%) |
| Bottled, Tank, or LP Gas | 2 (1.4%) | 0 (0.0%) |
| Electricity | 42 (29.6%) | 3 (37.5%) |
| Fuel Oil or Kerosene | 0 (0.0%) | 0 (0.0%) |
| Coal or Coke | 0 (0.0%) | 0 (0.0%) |
| All other Fuels | 3 (2.1%) | 0 (0.0%) |
| No Fuel Used | 0 (0.0%) | 0 (0.0%) |
| Total | 142 (100.0%) | 8 (100.0%) |
Household Vehicle Usage in Houstonia
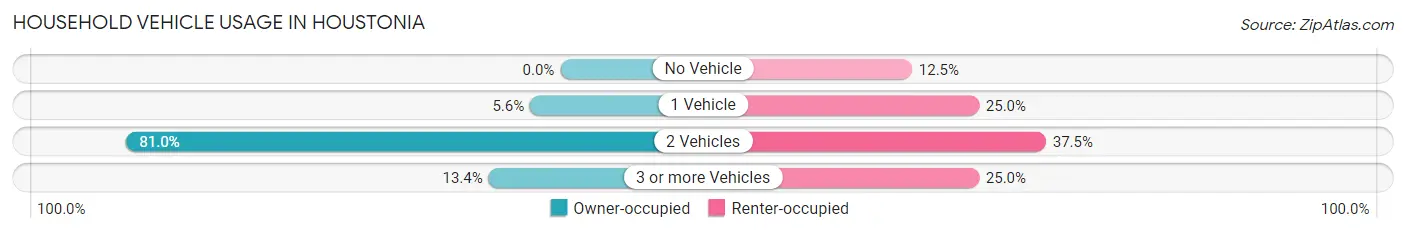
| Vehicles per Household | Owner-occupied | Renter-occupied |
| No Vehicle | 0 (0.0%) | 1 (12.5%) |
| 1 Vehicle | 8 (5.6%) | 2 (25.0%) |
| 2 Vehicles | 115 (81.0%) | 3 (37.5%) |
| 3 or more Vehicles | 19 (13.4%) | 2 (25.0%) |
| Total | 142 (100.0%) | 8 (100.0%) |
Real Estate & Mortgages in Houstonia
Real Estate and Mortgage Overview in Houstonia
| Characteristic | Without Mortgage | With Mortgage |
| Housing Units | 70 | 72 |
| Median Property Value | $72,500 | $46,100 |
| Median Household Income | $88,750 | $7 |
| Monthly Housing Costs | $380 | $0 |
| Real Estate Taxes | $738 | $0 |
Property Value by Mortgage Status in Houstonia
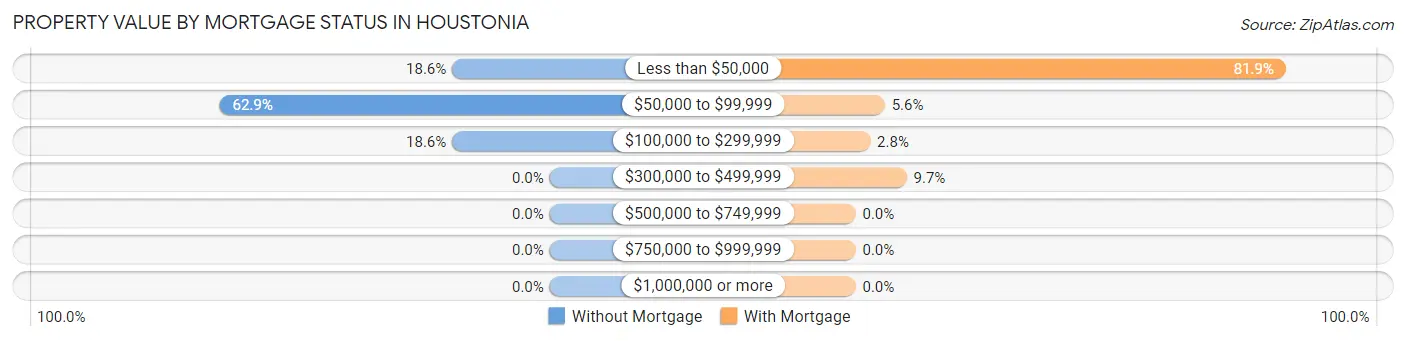
| Property Value | Without Mortgage | With Mortgage |
| Less than $50,000 | 13 (18.6%) | 59 (81.9%) |
| $50,000 to $99,999 | 44 (62.9%) | 4 (5.6%) |
| $100,000 to $299,999 | 13 (18.6%) | 2 (2.8%) |
| $300,000 to $499,999 | 0 (0.0%) | 7 (9.7%) |
| $500,000 to $749,999 | 0 (0.0%) | 0 (0.0%) |
| $750,000 to $999,999 | 0 (0.0%) | 0 (0.0%) |
| $1,000,000 or more | 0 (0.0%) | 0 (0.0%) |
| Total | 70 (100.0%) | 72 (100.0%) |
Household Income by Mortgage Status in Houstonia
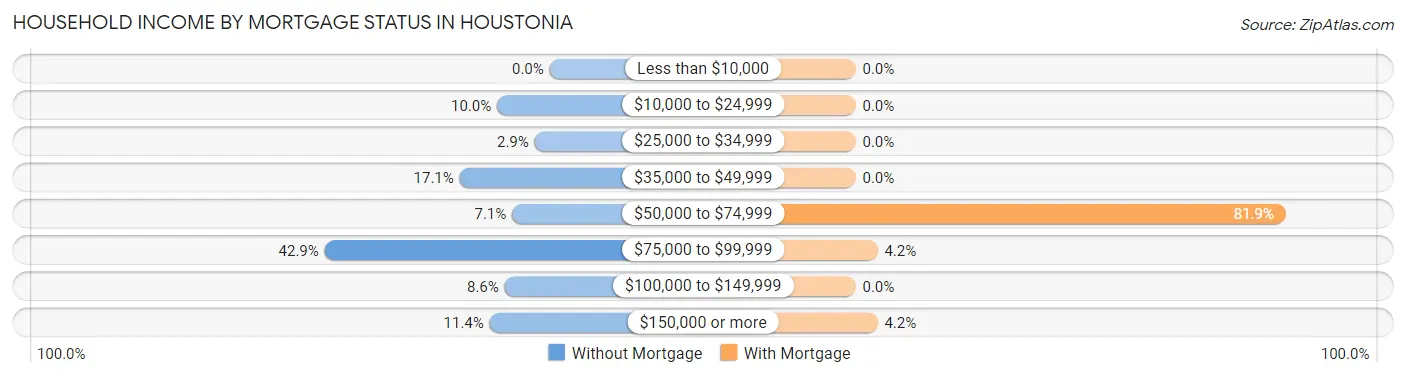
| Household Income | Without Mortgage | With Mortgage |
| Less than $10,000 | 0 (0.0%) | 0 (0.0%) |
| $10,000 to $24,999 | 7 (10.0%) | 0 (0.0%) |
| $25,000 to $34,999 | 2 (2.9%) | 0 (0.0%) |
| $35,000 to $49,999 | 12 (17.1%) | 0 (0.0%) |
| $50,000 to $74,999 | 5 (7.1%) | 59 (81.9%) |
| $75,000 to $99,999 | 30 (42.9%) | 3 (4.2%) |
| $100,000 to $149,999 | 6 (8.6%) | 0 (0.0%) |
| $150,000 or more | 8 (11.4%) | 3 (4.2%) |
| Total | 70 (100.0%) | 72 (100.0%) |
Property Value to Household Income Ratio in Houstonia
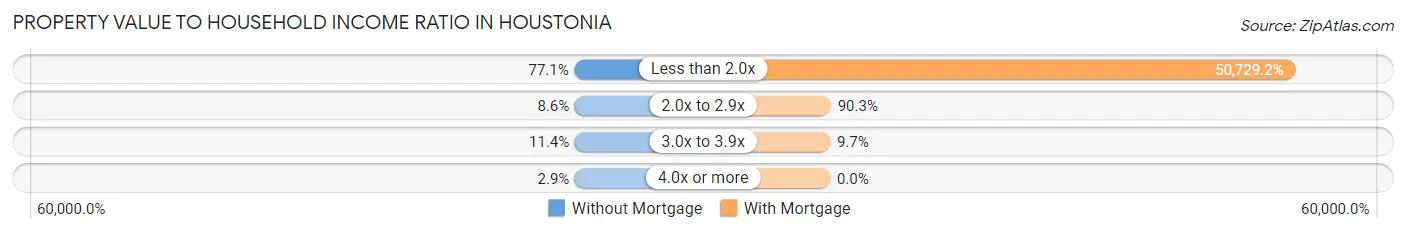
| Value-to-Income Ratio | Without Mortgage | With Mortgage |
| Less than 2.0x | 54 (77.1%) | 36,525 (50,729.2%) |
| 2.0x to 2.9x | 6 (8.6%) | 65 (90.3%) |
| 3.0x to 3.9x | 8 (11.4%) | 7 (9.7%) |
| 4.0x or more | 2 (2.9%) | 0 (0.0%) |
| Total | 70 (100.0%) | 72 (100.0%) |
Real Estate Taxes by Mortgage Status in Houstonia
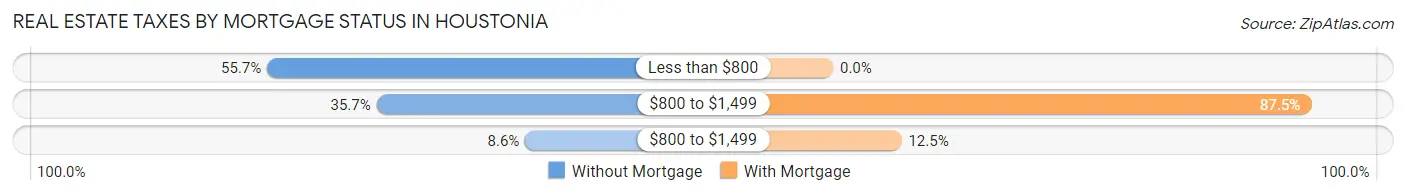
| Property Taxes | Without Mortgage | With Mortgage |
| Less than $800 | 39 (55.7%) | 0 (0.0%) |
| $800 to $1,499 | 25 (35.7%) | 63 (87.5%) |
| $800 to $1,499 | 6 (8.6%) | 9 (12.5%) |
| Total | 70 (100.0%) | 72 (100.0%) |
Health & Disability in Houstonia
Health Insurance Coverage by Age in Houstonia
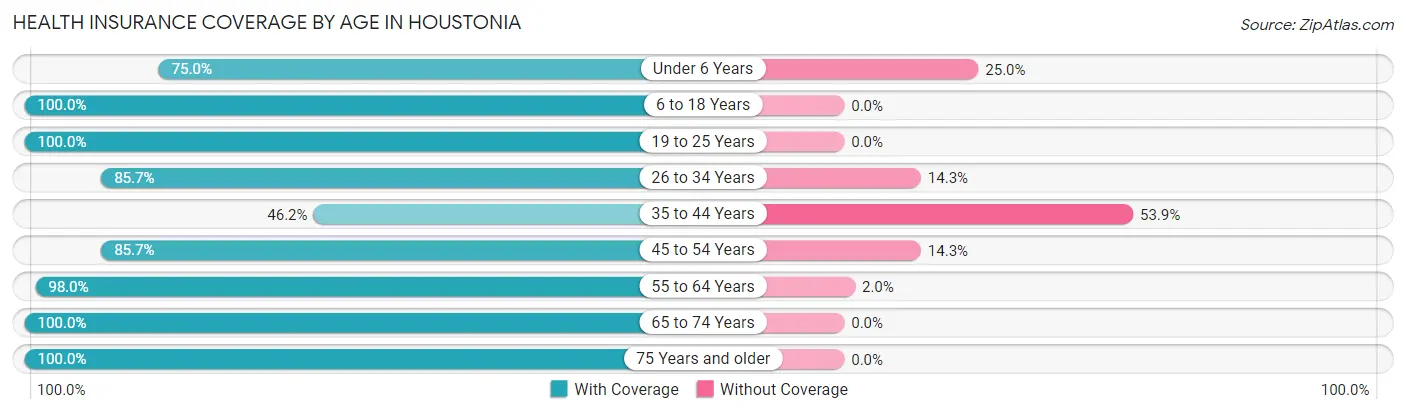
| Age Bracket | With Coverage | Without Coverage |
| Under 6 Years | 6 (75.0%) | 2 (25.0%) |
| 6 to 18 Years | 10 (100.0%) | 0 (0.0%) |
| 19 to 25 Years | 12 (100.0%) | 0 (0.0%) |
| 26 to 34 Years | 12 (85.7%) | 2 (14.3%) |
| 35 to 44 Years | 6 (46.2%) | 7 (53.8%) |
| 45 to 54 Years | 30 (85.7%) | 5 (14.3%) |
| 55 to 64 Years | 98 (98.0%) | 2 (2.0%) |
| 65 to 74 Years | 10 (100.0%) | 0 (0.0%) |
| 75 Years and older | 35 (100.0%) | 0 (0.0%) |
| Total | 219 (92.4%) | 18 (7.6%) |
Health Insurance Coverage by Citizenship Status in Houstonia
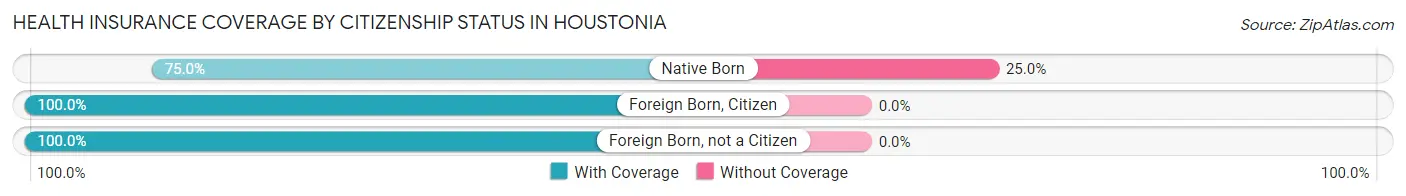
| Citizenship Status | With Coverage | Without Coverage |
| Native Born | 6 (75.0%) | 2 (25.0%) |
| Foreign Born, Citizen | 10 (100.0%) | 0 (0.0%) |
| Foreign Born, not a Citizen | 12 (100.0%) | 0 (0.0%) |
Health Insurance Coverage by Household Income in Houstonia
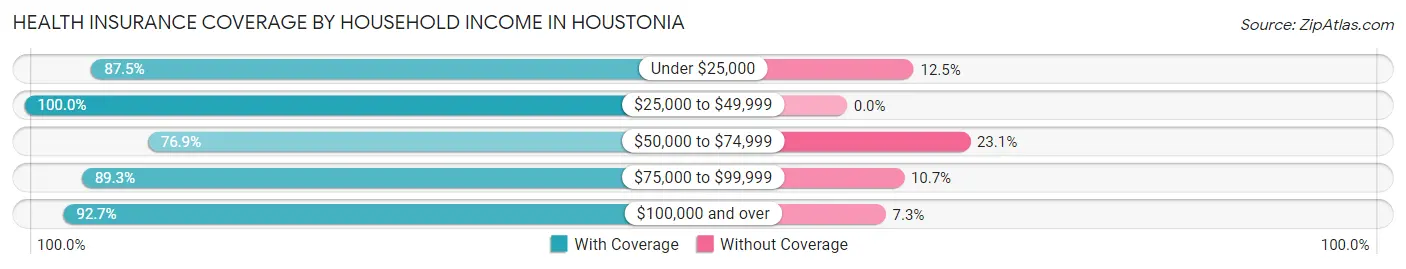
| Household Income | With Coverage | Without Coverage |
| Under $25,000 | 14 (87.5%) | 2 (12.5%) |
| $25,000 to $49,999 | 84 (100.0%) | 0 (0.0%) |
| $50,000 to $74,999 | 20 (76.9%) | 6 (23.1%) |
| $75,000 to $99,999 | 50 (89.3%) | 6 (10.7%) |
| $100,000 and over | 51 (92.7%) | 4 (7.3%) |
Public vs Private Health Insurance Coverage by Age in Houstonia
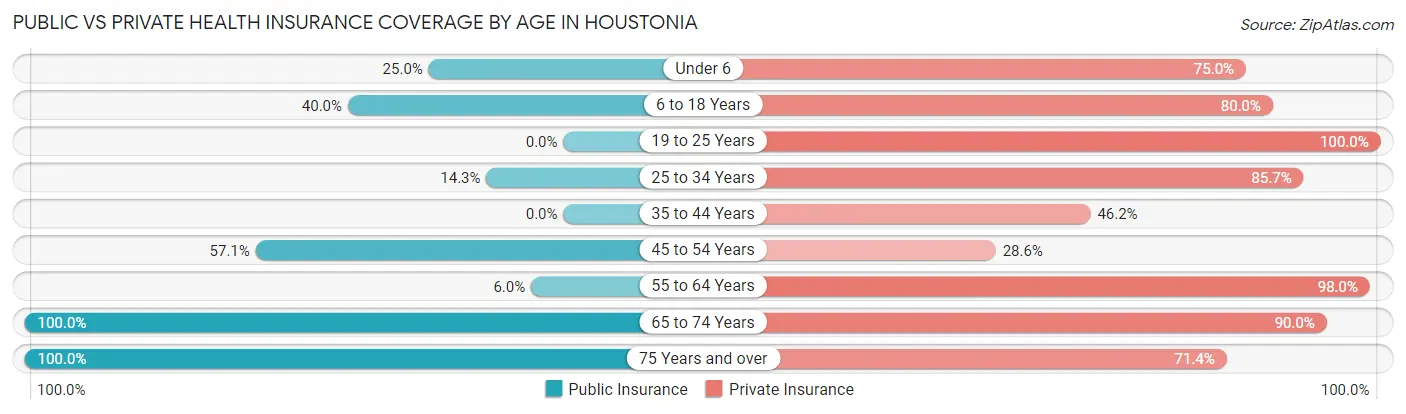
| Age Bracket | Public Insurance | Private Insurance |
| Under 6 | 2 (25.0%) | 6 (75.0%) |
| 6 to 18 Years | 4 (40.0%) | 8 (80.0%) |
| 19 to 25 Years | 0 (0.0%) | 12 (100.0%) |
| 25 to 34 Years | 2 (14.3%) | 12 (85.7%) |
| 35 to 44 Years | 0 (0.0%) | 6 (46.2%) |
| 45 to 54 Years | 20 (57.1%) | 10 (28.6%) |
| 55 to 64 Years | 6 (6.0%) | 98 (98.0%) |
| 65 to 74 Years | 10 (100.0%) | 9 (90.0%) |
| 75 Years and over | 35 (100.0%) | 25 (71.4%) |
| Total | 79 (33.3%) | 186 (78.5%) |
Disability Status by Sex by Age in Houstonia
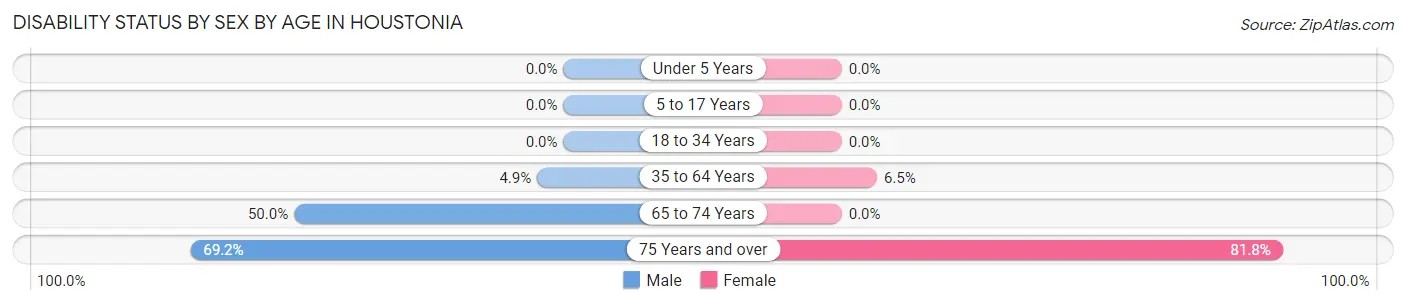
| Age Bracket | Male | Female |
| Under 5 Years | 0 (0.0%) | 0 (0.0%) |
| 5 to 17 Years | 0 (0.0%) | 0 (0.0%) |
| 18 to 34 Years | 0 (0.0%) | 0 (0.0%) |
| 35 to 64 Years | 2 (4.9%) | 7 (6.5%) |
| 65 to 74 Years | 1 (50.0%) | 0 (0.0%) |
| 75 Years and over | 9 (69.2%) | 18 (81.8%) |
Disability Class by Sex by Age in Houstonia
Disability Class: Hearing Difficulty
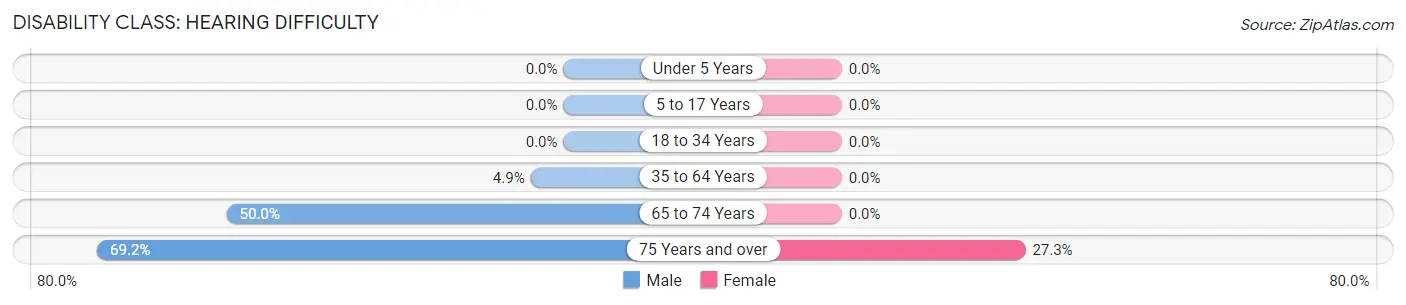
| Age Bracket | Male | Female |
| Under 5 Years | 0 (0.0%) | 0 (0.0%) |
| 5 to 17 Years | 0 (0.0%) | 0 (0.0%) |
| 18 to 34 Years | 0 (0.0%) | 0 (0.0%) |
| 35 to 64 Years | 2 (4.9%) | 0 (0.0%) |
| 65 to 74 Years | 1 (50.0%) | 0 (0.0%) |
| 75 Years and over | 9 (69.2%) | 6 (27.3%) |
Disability Class: Vision Difficulty
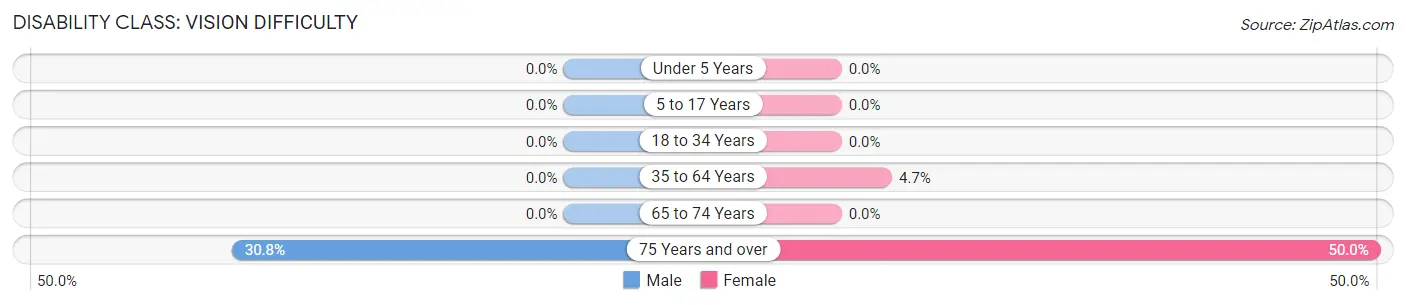
| Age Bracket | Male | Female |
| Under 5 Years | 0 (0.0%) | 0 (0.0%) |
| 5 to 17 Years | 0 (0.0%) | 0 (0.0%) |
| 18 to 34 Years | 0 (0.0%) | 0 (0.0%) |
| 35 to 64 Years | 0 (0.0%) | 5 (4.7%) |
| 65 to 74 Years | 0 (0.0%) | 0 (0.0%) |
| 75 Years and over | 4 (30.8%) | 11 (50.0%) |
Disability Class: Cognitive Difficulty
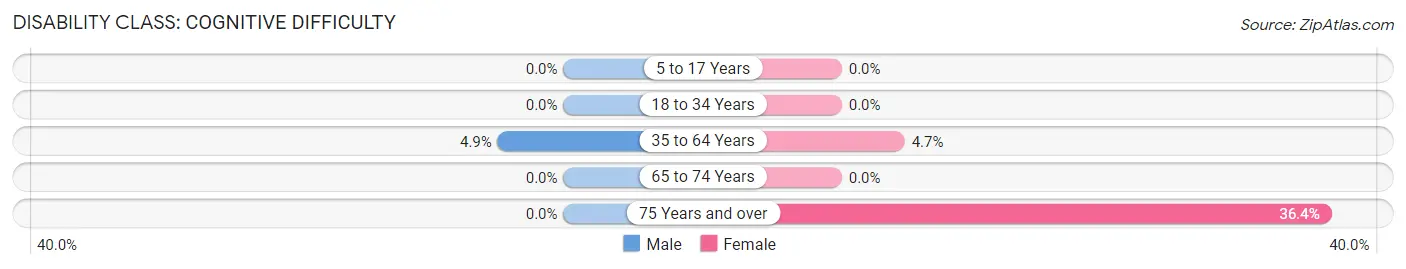
| Age Bracket | Male | Female |
| 5 to 17 Years | 0 (0.0%) | 0 (0.0%) |
| 18 to 34 Years | 0 (0.0%) | 0 (0.0%) |
| 35 to 64 Years | 2 (4.9%) | 5 (4.7%) |
| 65 to 74 Years | 0 (0.0%) | 0 (0.0%) |
| 75 Years and over | 0 (0.0%) | 8 (36.4%) |
Disability Class: Ambulatory Difficulty
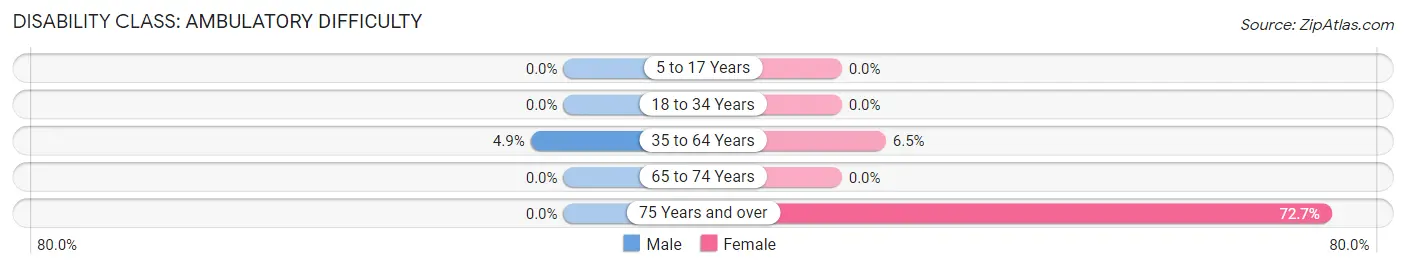
| Age Bracket | Male | Female |
| 5 to 17 Years | 0 (0.0%) | 0 (0.0%) |
| 18 to 34 Years | 0 (0.0%) | 0 (0.0%) |
| 35 to 64 Years | 2 (4.9%) | 7 (6.5%) |
| 65 to 74 Years | 0 (0.0%) | 0 (0.0%) |
| 75 Years and over | 0 (0.0%) | 16 (72.7%) |
Disability Class: Self-Care Difficulty
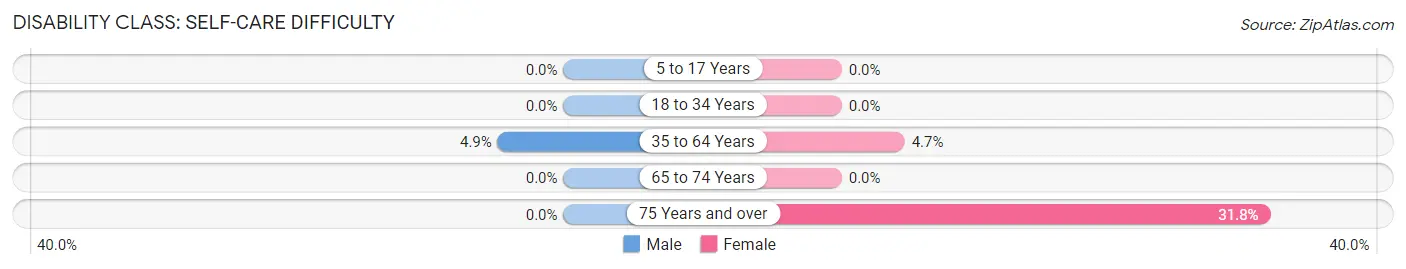
| Age Bracket | Male | Female |
| 5 to 17 Years | 0 (0.0%) | 0 (0.0%) |
| 18 to 34 Years | 0 (0.0%) | 0 (0.0%) |
| 35 to 64 Years | 2 (4.9%) | 5 (4.7%) |
| 65 to 74 Years | 0 (0.0%) | 0 (0.0%) |
| 75 Years and over | 0 (0.0%) | 7 (31.8%) |
Technology Access in Houstonia
Computing Device Access in Houstonia
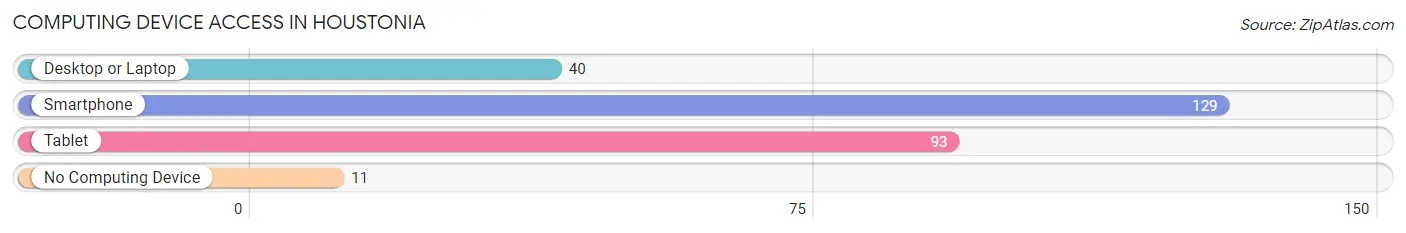
| Device Type | # Households | % Households |
| Desktop or Laptop | 40 | 26.7% |
| Smartphone | 129 | 86.0% |
| Tablet | 93 | 62.0% |
| No Computing Device | 11 | 7.3% |
| Total | 150 | 100.0% |
Internet Access in Houstonia
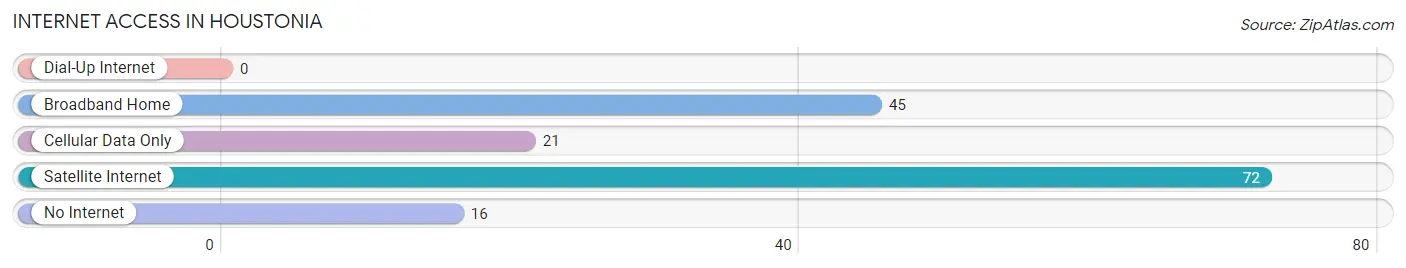
| Internet Type | # Households | % Households |
| Dial-Up Internet | 0 | 0.0% |
| Broadband Home | 45 | 30.0% |
| Cellular Data Only | 21 | 14.0% |
| Satellite Internet | 72 | 48.0% |
| No Internet | 16 | 10.7% |
| Total | 150 | 100.0% |
Houstonia Summary
History
The small town of Washingtonia, Missouri is located in Franklin County, Missouri, and is part of the St. Louis metropolitan area. The town was founded in 1819 by a group of settlers from Washington, D.C. who were looking for a new home. The town was named after the first president of the United States, George Washington.
The town was originally a farming community, and the main crops grown were corn, wheat, and oats. The town also had a few small businesses, such as a general store, a blacksmith, and a post office.
In the late 1800s, the town began to grow and develop. The railroad came to town in 1887, and this allowed for the transportation of goods and people to and from the town. This also allowed for the growth of the town's economy.
In the early 1900s, the town began to experience a population boom. This was due to the influx of immigrants from Europe, as well as the growth of the railroad industry. The town also began to experience a growth in industry, with the opening of several factories.
The town continued to grow and develop throughout the 20th century. In the 1950s, the town experienced a population boom due to the growth of the St. Louis metropolitan area. This growth continued into the 1960s and 1970s, and the town experienced a period of economic prosperity.
Geography
Washingtonia is located in Franklin County, Missouri, and is part of the St. Louis metropolitan area. The town is situated on the banks of the Missouri River, and is surrounded by rolling hills and farmland. The town is located approximately 30 miles west of St. Louis.
The town has a total area of 1.2 square miles, all of which is land. The town has a humid continental climate, with hot summers and cold winters. The average annual temperature is around 50 degrees Fahrenheit.
Economy
The economy of Washingtonia is largely based on agriculture and manufacturing. The town is home to several large farms, which produce corn, wheat, and oats. The town also has several factories, which produce a variety of products, including furniture, clothing, and electronics.
The town also has a thriving tourism industry. The town is home to several historic sites, such as the Washingtonia Museum and the Washingtonia Historical Society. The town also has several parks and recreational areas, such as the Washingtonia State Park.
Demographics
As of the 2010 census, the population of Washingtonia was 1,845. The town has a population density of 1,521 people per square mile. The median age of the population is 39.7 years, and the median household income is $45,945.
The town is predominantly white, with 92.3% of the population identifying as white. The town also has a small Hispanic population, with 4.2% of the population identifying as Hispanic or Latino. The town also has a small African American population, with 1.7% of the population identifying as African American.
Conclusion
Washingtonia, Missouri is a small town located in Franklin County, Missouri. The town was founded in 1819 by a group of settlers from Washington, D.C. The town has a population of 1,845, and has a humid continental climate. The town's economy is largely based on agriculture and manufacturing, and the town also has a thriving tourism industry. The town is predominantly white, with 92.3% of the population identifying as white.
Common Questions
What is Per Capita Income in Houstonia?
Per Capita income in Houstonia is $35,860.
What is the Median Family Income in Houstonia?
Median Family Income in Houstonia is $42,500.
What is Inequality or Gini Index in Houstonia?
Inequality or Gini Index in Houstonia is 0.36.
What is the Total Population of Houstonia?
Total Population of Houstonia is 245.
What is the Total Male Population of Houstonia?
Total Male Population of Houstonia is 88.
What is the Total Female Population of Houstonia?
Total Female Population of Houstonia is 157.
What is the Ratio of Males per 100 Females in Houstonia?
There are 56.05 Males per 100 Females in Houstonia.
What is the Ratio of Females per 100 Males in Houstonia?
There are 178.41 Females per 100 Males in Houstonia.
What is the Median Population Age in Houstonia?
Median Population Age in Houstonia is 61.1 Years.
What is the Average Family Size in Houstonia
Average Family Size in Houstonia is 1.8 People.
What is the Average Household Size in Houstonia
Average Household Size in Houstonia is 1.6 People.
How Large is the Labor Force in Houstonia?
There are 166 People in the Labor Forcein in Houstonia.
What is the Percentage of People in the Labor Force in Houstonia?
72.2% of People are in the Labor Force in Houstonia.
What is the Unemployment Rate in Houstonia?
Unemployment Rate in Houstonia is 1.3%.