Grand Pass, MO Map & Demographics
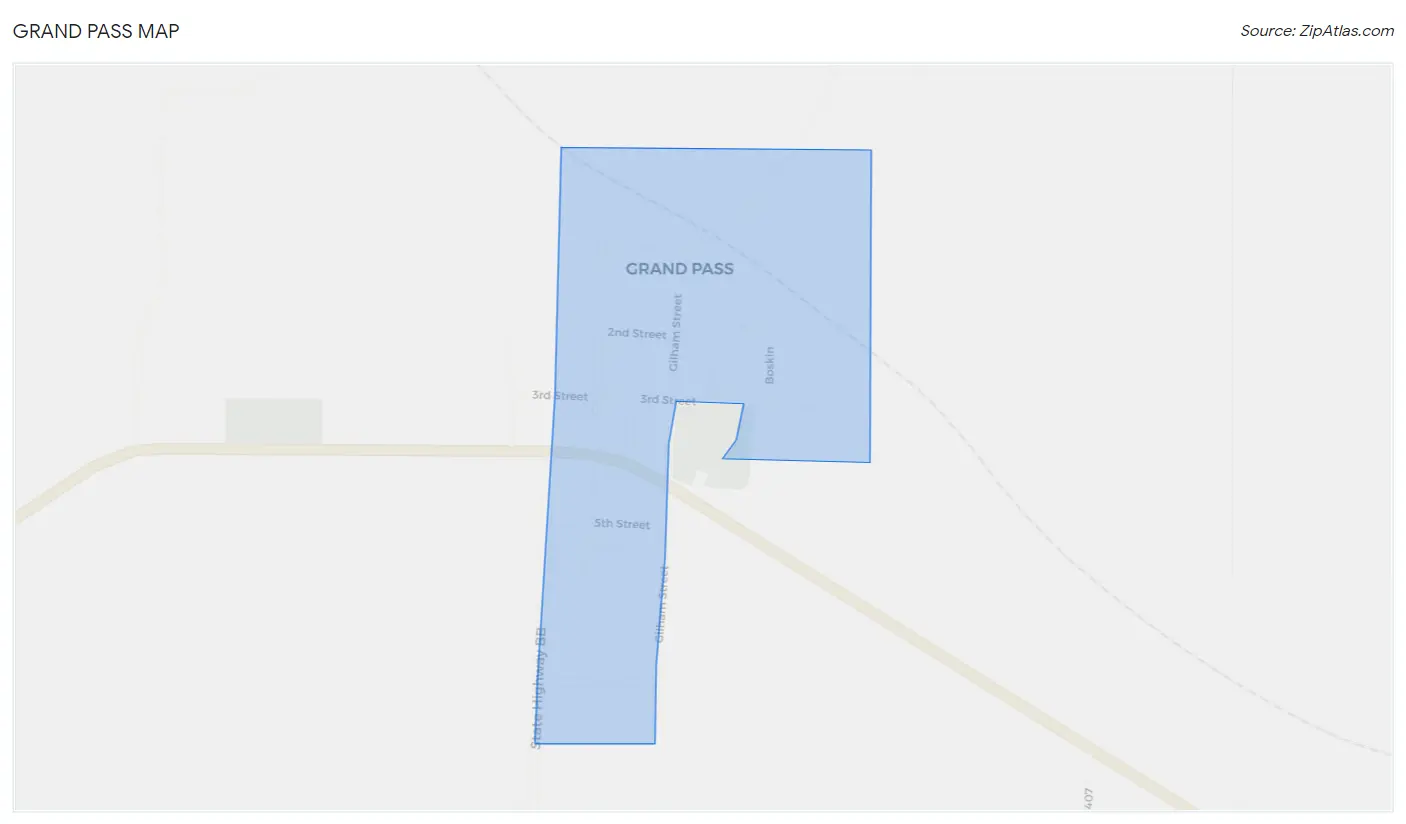
Grand Pass Map
Grand Pass Overview
$16,138
PER CAPITA INCOME
$76,875
AVG FAMILY INCOME
0.39
INEQUALITY / GINI INDEX
29
TOTAL POPULATION
7
MALE POPULATION
22
FEMALE POPULATION
31.82
MALES / 100 FEMALES
314.29
FEMALES / 100 MALES
35.3
MEDIAN AGE
4.8
AVG FAMILY SIZE
2.9
AVG HOUSEHOLD SIZE
8
LABOR FORCE [ PEOPLE ]
40.0%
PERCENT IN LABOR FORCE
25.0%
UNEMPLOYMENT RATE
Grand Pass Area Codes
Income in Grand Pass
Income Overview in Grand Pass
| Characteristic | Number | Measure |
| Per Capita Income | 29 | $16,138 |
| Median Family Income | 5 | $76,875 |
| Mean Family Income | 5 | $66,340 |
| Median Household Income | 10 | $0 |
| Mean Household Income | 10 | $44,430 |
| Income Deficit | 5 | $0 |
| Wage / Income Gap (%) | 29 | 0.00% |
| Wage / Income Gap ($) | 29 | 100.00¢ per $1 |
| Gini / Inequality Index | 29 | 0.39 |
Earnings by Sex in Grand Pass
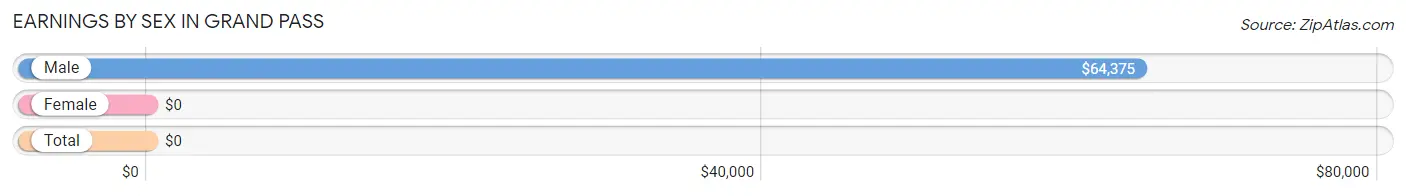
| Sex | Number | Average Earnings |
| Male | 5 (50.0%) | $64,375 |
| Female | 5 (50.0%) | $0 |
| Total | 10 (100.0%) | $0 |
Earnings by Sex by Income Bracket in Grand Pass
The most common earnings brackets in Grand Pass are $55,000 to $64,999 for men (2 | 40.0%) and $2,499 or less for women (2 | 40.0%).
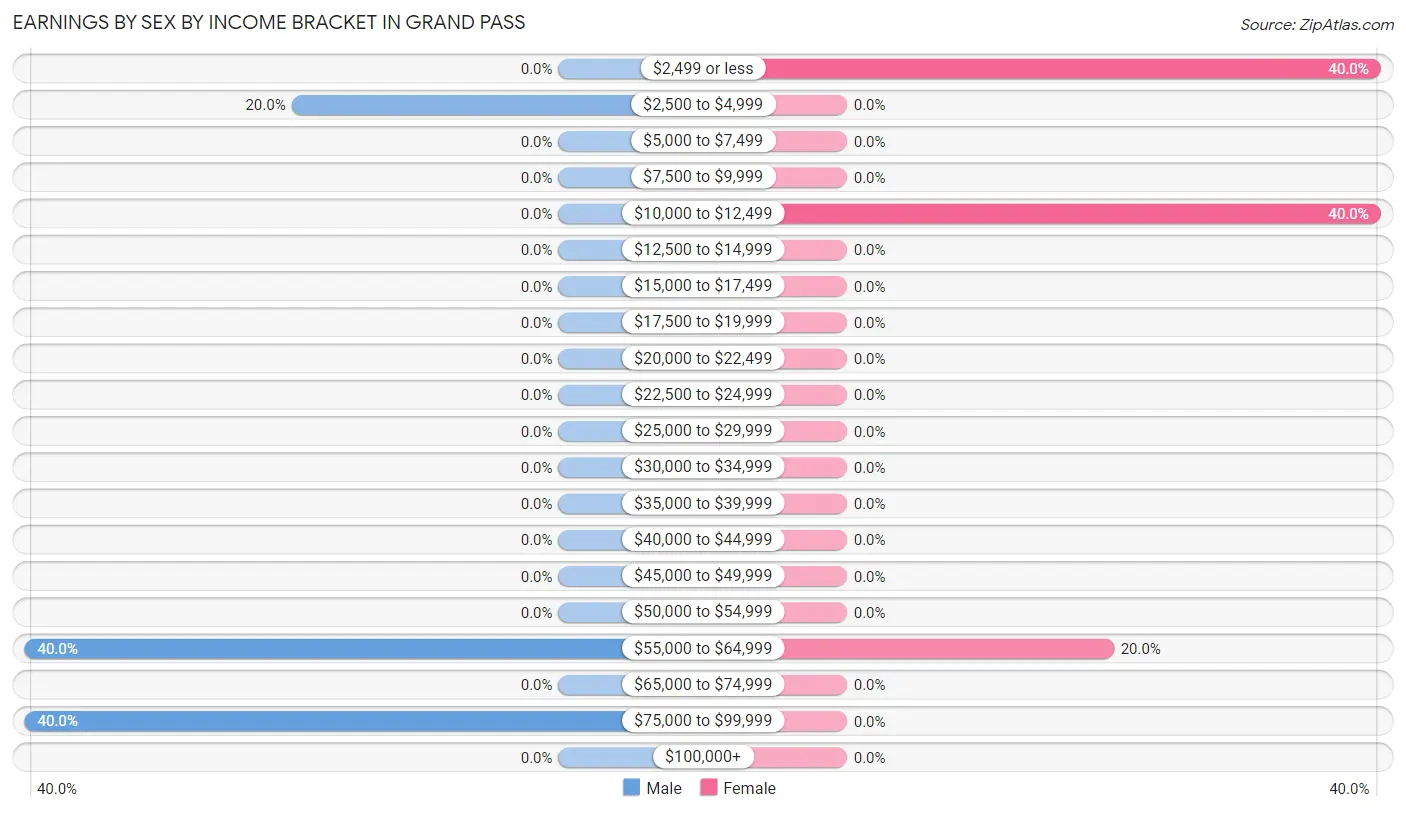
| Income | Male | Female |
| $2,499 or less | 0 (0.0%) | 2 (40.0%) |
| $2,500 to $4,999 | 1 (20.0%) | 0 (0.0%) |
| $5,000 to $7,499 | 0 (0.0%) | 0 (0.0%) |
| $7,500 to $9,999 | 0 (0.0%) | 0 (0.0%) |
| $10,000 to $12,499 | 0 (0.0%) | 2 (40.0%) |
| $12,500 to $14,999 | 0 (0.0%) | 0 (0.0%) |
| $15,000 to $17,499 | 0 (0.0%) | 0 (0.0%) |
| $17,500 to $19,999 | 0 (0.0%) | 0 (0.0%) |
| $20,000 to $22,499 | 0 (0.0%) | 0 (0.0%) |
| $22,500 to $24,999 | 0 (0.0%) | 0 (0.0%) |
| $25,000 to $29,999 | 0 (0.0%) | 0 (0.0%) |
| $30,000 to $34,999 | 0 (0.0%) | 0 (0.0%) |
| $35,000 to $39,999 | 0 (0.0%) | 0 (0.0%) |
| $40,000 to $44,999 | 0 (0.0%) | 0 (0.0%) |
| $45,000 to $49,999 | 0 (0.0%) | 0 (0.0%) |
| $50,000 to $54,999 | 0 (0.0%) | 0 (0.0%) |
| $55,000 to $64,999 | 2 (40.0%) | 1 (20.0%) |
| $65,000 to $74,999 | 0 (0.0%) | 0 (0.0%) |
| $75,000 to $99,999 | 2 (40.0%) | 0 (0.0%) |
| $100,000+ | 0 (0.0%) | 0 (0.0%) |
| Total | 5 (100.0%) | 5 (100.0%) |
Earnings by Sex by Educational Attainment in Grand Pass
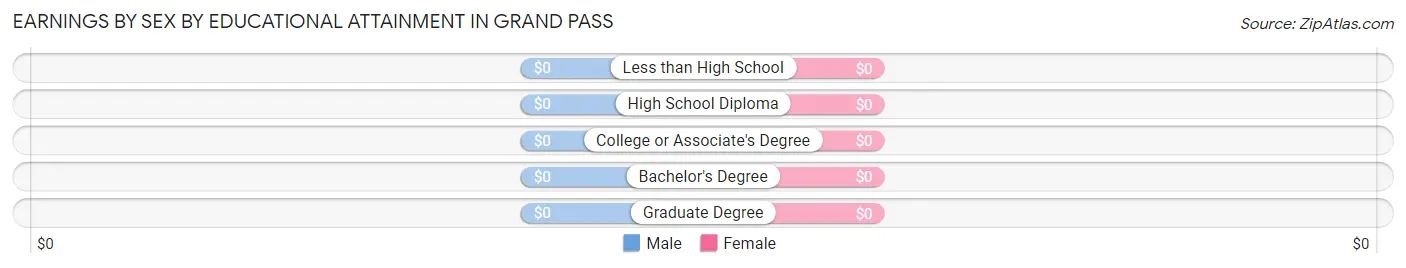
| Educational Attainment | Male Income | Female Income |
| Less than High School | - | - |
| High School Diploma | - | - |
| College or Associate's Degree | - | - |
| Bachelor's Degree | - | - |
| Graduate Degree | - | - |
| Total | $64,375 | $0 |
Family Income in Grand Pass
Family Income Brackets in Grand Pass
According to the Grand Pass family income data, there are 4 families falling into the $75,000 to $99,999 income range, which is the most common income bracket and makes up 80.0% of all families.
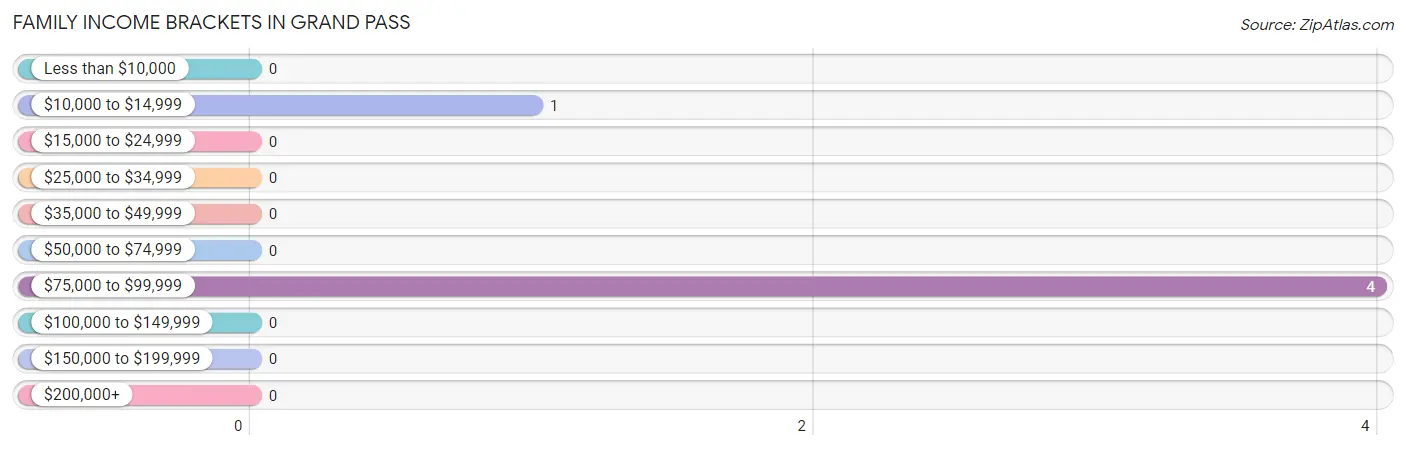
| Income Bracket | # Families | % Families |
| Less than $10,000 | 0 | 0.0% |
| $10,000 to $14,999 | 1 | 20.0% |
| $15,000 to $24,999 | 0 | 0.0% |
| $25,000 to $34,999 | 0 | 0.0% |
| $35,000 to $49,999 | 0 | 0.0% |
| $50,000 to $74,999 | 0 | 0.0% |
| $75,000 to $99,999 | 4 | 80.0% |
| $100,000 to $149,999 | 0 | 0.0% |
| $150,000 to $199,999 | 0 | 0.0% |
| $200,000+ | 0 | 0.0% |
Family Income by Famaliy Size in Grand Pass
| Income Bracket | # Families | Median Income |
| 2-Person Families | 2 (40.0%) | $0 |
| 3-Person Families | 0 (0.0%) | $0 |
| 4-Person Families | 1 (20.0%) | $0 |
| 5-Person Families | 0 (0.0%) | $0 |
| 6-Person Families | 2 (40.0%) | $0 |
| 7+ Person Families | 0 (0.0%) | $0 |
| Total | 5 (100.0%) | $76,875 |
Family Income by Number of Earners in Grand Pass
| Number of Earners | # Families | Median Income |
| No Earners | 0 (0.0%) | $0 |
| 1 Earner | 1 (20.0%) | $0 |
| 2 Earners | 4 (80.0%) | $0 |
| 3+ Earners | 0 (0.0%) | $0 |
| Total | 5 (100.0%) | $76,875 |
Household Income in Grand Pass
Household Income Brackets in Grand Pass
With 4 households falling in the category, the $10,000 to $14,999 income range is the most frequent in Grand Pass, accounting for 40.0% of all households.
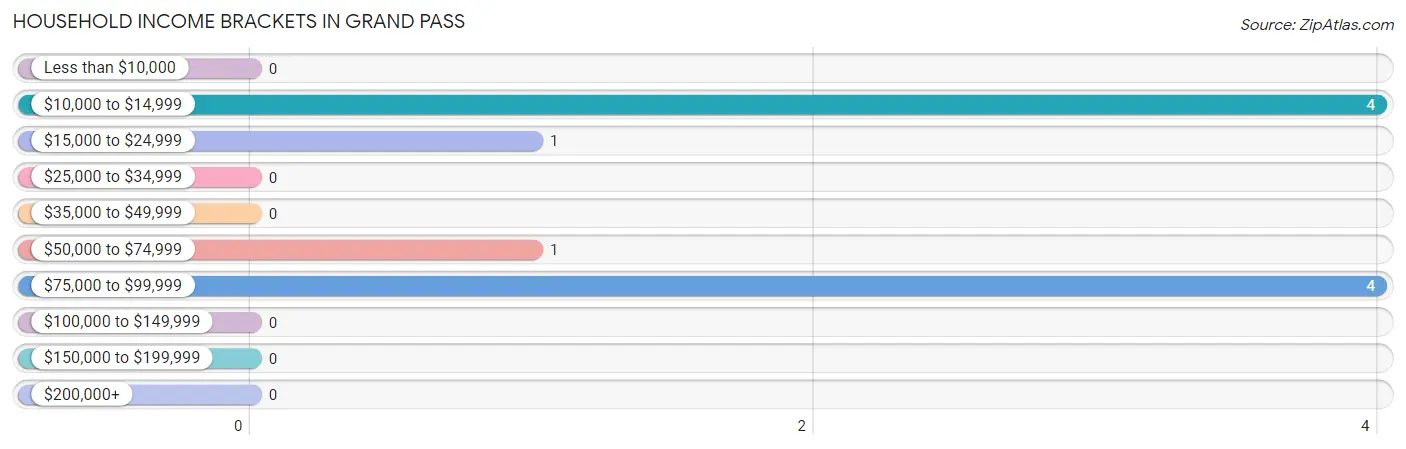
| Income Bracket | # Households | % Households |
| Less than $10,000 | 0 | 0.0% |
| $10,000 to $14,999 | 4 | 40.0% |
| $15,000 to $24,999 | 1 | 10.0% |
| $25,000 to $34,999 | 0 | 0.0% |
| $35,000 to $49,999 | 0 | 0.0% |
| $50,000 to $74,999 | 1 | 10.0% |
| $75,000 to $99,999 | 4 | 40.0% |
| $100,000 to $149,999 | 0 | 0.0% |
| $150,000 to $199,999 | 0 | 0.0% |
| $200,000+ | 0 | 0.0% |
Household Income by Householder Age in Grand Pass
The median household income in Grand Pass is $0, with the highest median household income of $56,250 found in the 45 to 64 years age bracket for the primary householder. A total of 5 households (50.0%) fall into this category.
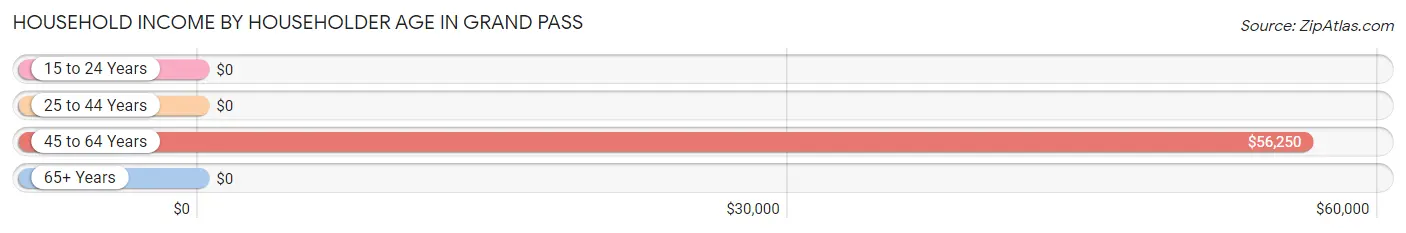
| Income Bracket | # Households | Median Income |
| 15 to 24 Years | 0 (0.0%) | $0 |
| 25 to 44 Years | 3 (30.0%) | $0 |
| 45 to 64 Years | 5 (50.0%) | $56,250 |
| 65+ Years | 2 (20.0%) | $0 |
| Total | 10 (100.0%) | $0 |
Poverty in Grand Pass
Income Below Poverty by Sex and Age in Grand Pass
With 14.3% poverty level for males and 40.9% for females among the residents of Grand Pass, 35 to 44 year old males and 16 and 17 year old females are the most vulnerable to poverty, with 1 males (33.3%) and 1 females (100.0%) in their respective age groups living below the poverty level.
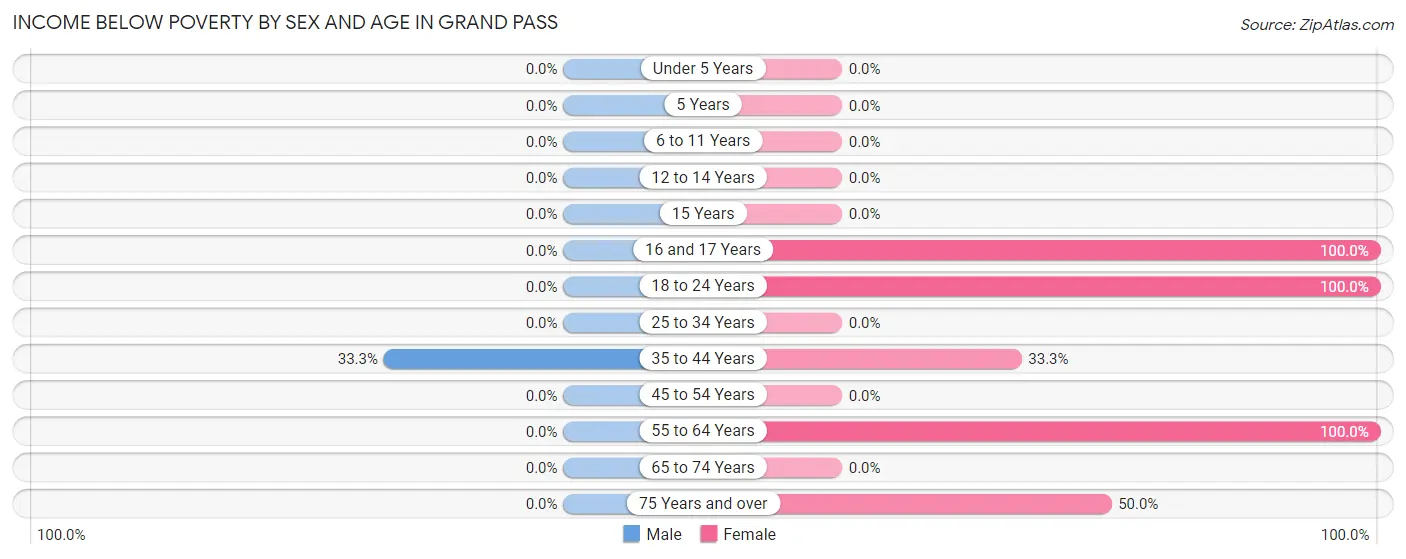
| Age Bracket | Male | Female |
| Under 5 Years | 0 (0.0%) | 0 (0.0%) |
| 5 Years | 0 (0.0%) | 0 (0.0%) |
| 6 to 11 Years | 0 (0.0%) | 0 (0.0%) |
| 12 to 14 Years | 0 (0.0%) | 0 (0.0%) |
| 15 Years | 0 (0.0%) | 0 (0.0%) |
| 16 and 17 Years | 0 (0.0%) | 1 (100.0%) |
| 18 to 24 Years | 0 (0.0%) | 4 (100.0%) |
| 25 to 34 Years | 0 (0.0%) | 0 (0.0%) |
| 35 to 44 Years | 1 (33.3%) | 1 (33.3%) |
| 45 to 54 Years | 0 (0.0%) | 0 (0.0%) |
| 55 to 64 Years | 0 (0.0%) | 2 (100.0%) |
| 65 to 74 Years | 0 (0.0%) | 0 (0.0%) |
| 75 Years and over | 0 (0.0%) | 1 (50.0%) |
| Total | 1 (14.3%) | 9 (40.9%) |
Income Above Poverty by Sex and Age in Grand Pass
According to the poverty statistics in Grand Pass, males aged 12 to 14 years and females aged 6 to 11 years are the age groups that are most secure financially, with 100.0% of males and 100.0% of females in these age groups living above the poverty line.
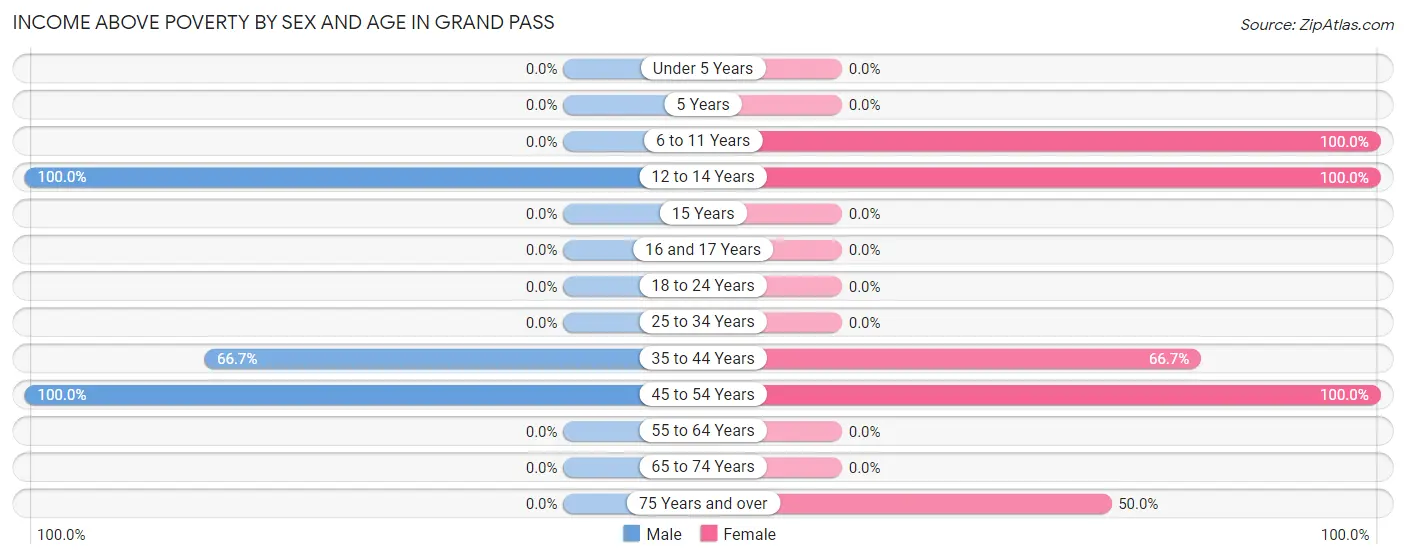
| Age Bracket | Male | Female |
| Under 5 Years | 0 (0.0%) | 0 (0.0%) |
| 5 Years | 0 (0.0%) | 0 (0.0%) |
| 6 to 11 Years | 0 (0.0%) | 5 (100.0%) |
| 12 to 14 Years | 2 (100.0%) | 2 (100.0%) |
| 15 Years | 0 (0.0%) | 0 (0.0%) |
| 16 and 17 Years | 0 (0.0%) | 0 (0.0%) |
| 18 to 24 Years | 0 (0.0%) | 0 (0.0%) |
| 25 to 34 Years | 0 (0.0%) | 0 (0.0%) |
| 35 to 44 Years | 2 (66.7%) | 2 (66.7%) |
| 45 to 54 Years | 2 (100.0%) | 3 (100.0%) |
| 55 to 64 Years | 0 (0.0%) | 0 (0.0%) |
| 65 to 74 Years | 0 (0.0%) | 0 (0.0%) |
| 75 Years and over | 0 (0.0%) | 1 (50.0%) |
| Total | 6 (85.7%) | 13 (59.1%) |
Income Below Poverty Among Married-Couple Families in Grand Pass
The poverty statistics for married-couple families in Grand Pass show that 20.0% or 1 of the total 5 families live below the poverty line. Families with 1 or 2 children have the highest poverty rate of 100.0%, comprising of 1 families. On the other hand, families with no children have the lowest poverty rate of 0.0%, which includes 0 families.
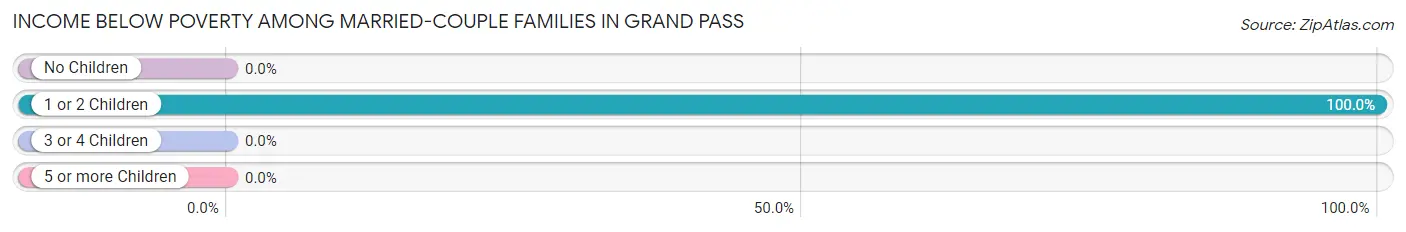
| Children | Above Poverty | Below Poverty |
| No Children | 2 (100.0%) | 0 (0.0%) |
| 1 or 2 Children | 0 (0.0%) | 1 (100.0%) |
| 3 or 4 Children | 2 (100.0%) | 0 (0.0%) |
| 5 or more Children | 0 (0.0%) | 0 (0.0%) |
| Total | 4 (80.0%) | 1 (20.0%) |
Income Below Poverty Among Single-Parent Households in Grand Pass
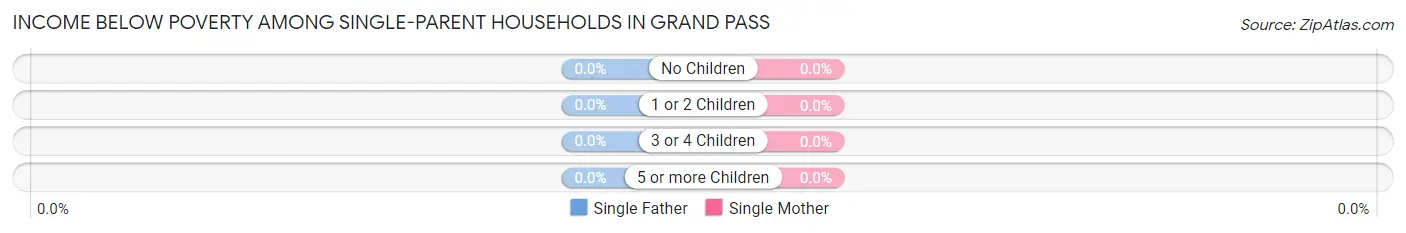
| Children | Single Father | Single Mother |
| No Children | 0 (0.0%) | 0 (0.0%) |
| 1 or 2 Children | 0 (0.0%) | 0 (0.0%) |
| 3 or 4 Children | 0 (0.0%) | 0 (0.0%) |
| 5 or more Children | 0 (0.0%) | 0 (0.0%) |
| Total | 0 (0.0%) | 0 (0.0%) |
Income Below Poverty Among Married-Couple vs Single-Parent Households in Grand Pass
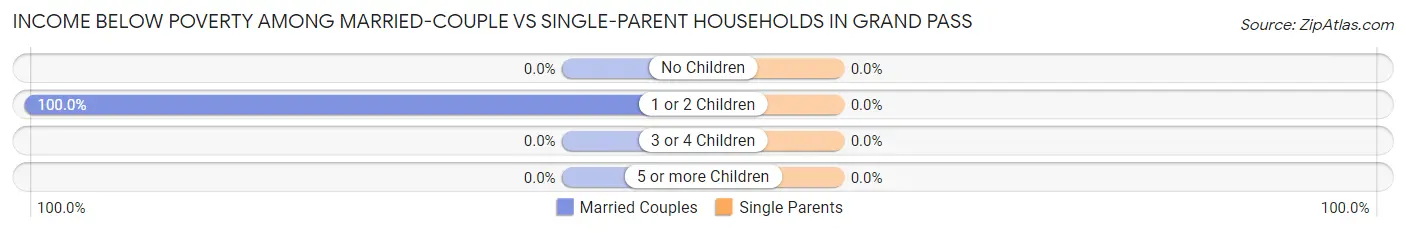
| Children | Married-Couple Families | Single-Parent Households |
| No Children | 0 (0.0%) | 0 (0.0%) |
| 1 or 2 Children | 1 (100.0%) | 0 (0.0%) |
| 3 or 4 Children | 0 (0.0%) | 0 (0.0%) |
| 5 or more Children | 0 (0.0%) | 0 (0.0%) |
| Total | 1 (20.0%) | 0 (0.0%) |
Race in Grand Pass
The most populous races in Grand Pass are White / Caucasian (28 | 96.6%), and Two or more Races (1 | 3.5%).
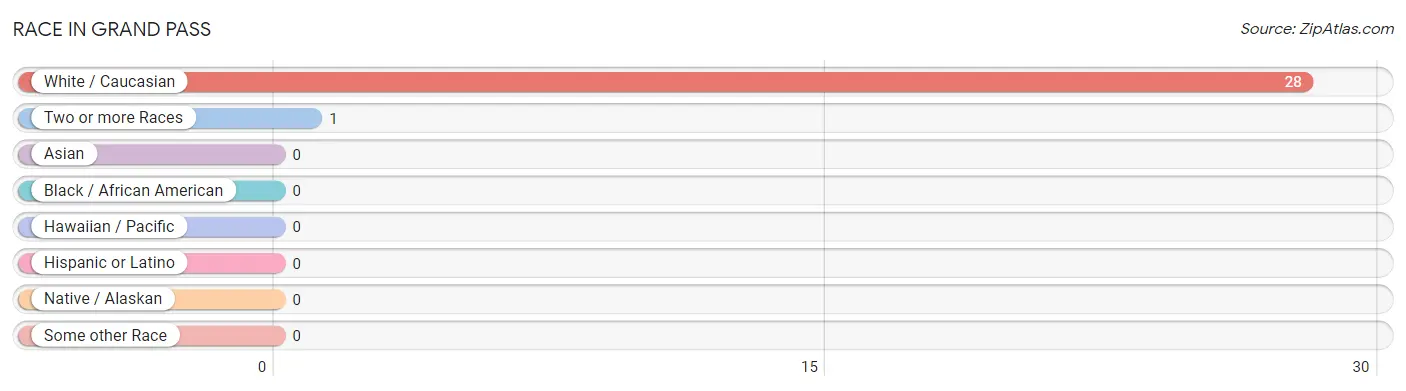
| Race | # Population | % Population |
| Asian | 0 | 0.0% |
| Black / African American | 0 | 0.0% |
| Hawaiian / Pacific | 0 | 0.0% |
| Hispanic or Latino | 0 | 0.0% |
| Native / Alaskan | 0 | 0.0% |
| White / Caucasian | 28 | 96.6% |
| Two or more Races | 1 | 3.5% |
| Some other Race | 0 | 0.0% |
| Total | 29 | 100.0% |
Ancestry in Grand Pass
The most populous ancestries reported in Grand Pass are German (6 | 20.7%), Welsh (2 | 6.9%), Irish (1 | 3.5%), Norwegian (1 | 3.5%), and Swedish (1 | 3.5%), together accounting for 37.9% of all Grand Pass residents.
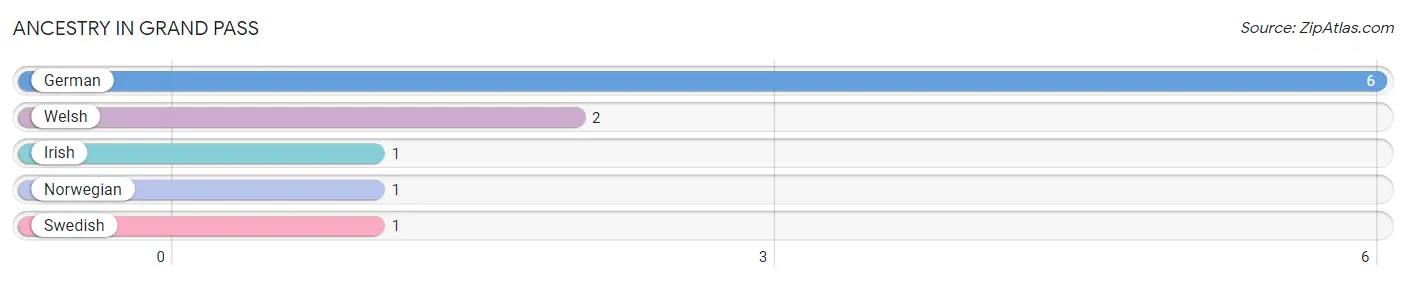
| Ancestry | # Population | % Population |
| German | 6 | 20.7% |
| Irish | 1 | 3.5% |
| Norwegian | 1 | 3.5% |
| Swedish | 1 | 3.5% |
| Welsh | 2 | 6.9% | View All 5 Rows |
Immigrants in Grand Pass

| Immigration Origin | # Population | % Population | View All 0 Rows |
Sex and Age in Grand Pass
Sex and Age in Grand Pass
The most populous age groups in Grand Pass are 35 to 39 Years (3 | 42.9%) for men and 10 to 14 Years (4 | 18.2%) for women.
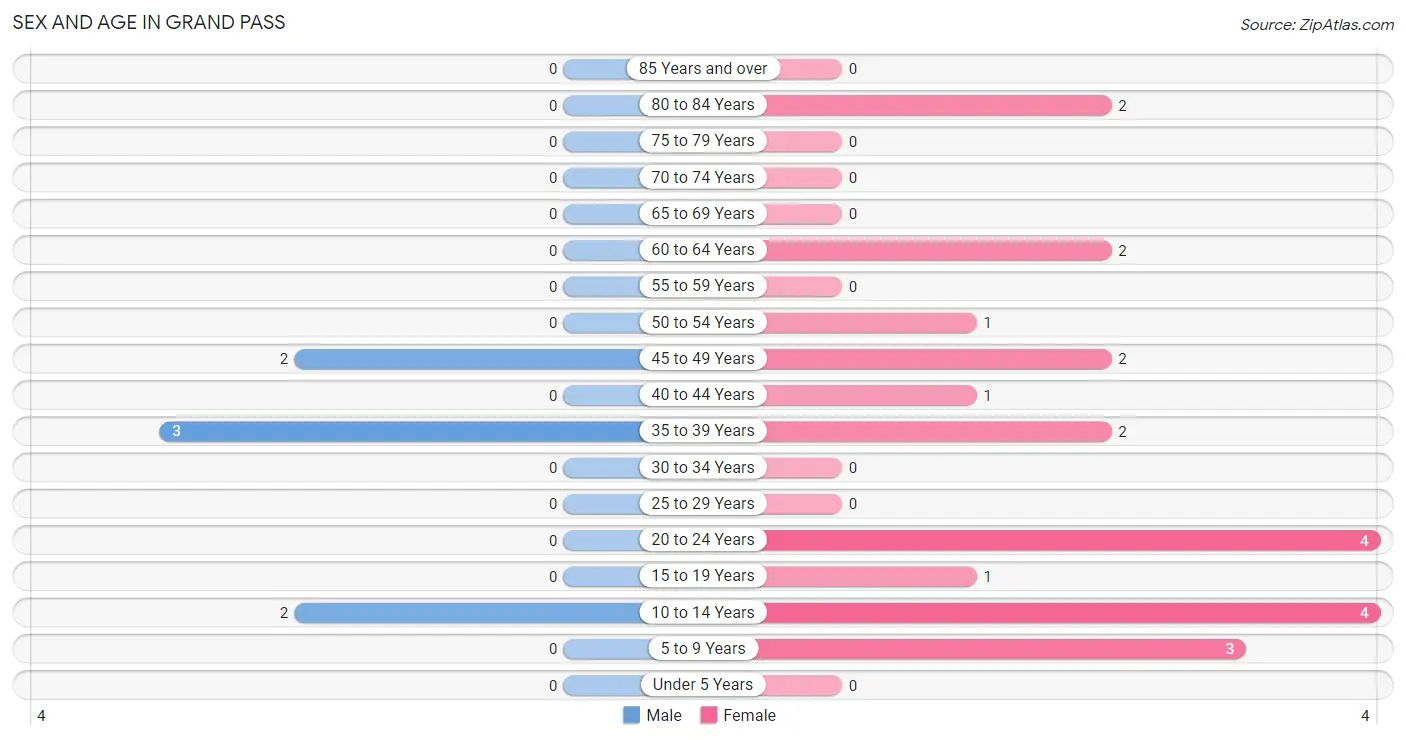
| Age Bracket | Male | Female |
| Under 5 Years | 0 (0.0%) | 0 (0.0%) |
| 5 to 9 Years | 0 (0.0%) | 3 (13.6%) |
| 10 to 14 Years | 2 (28.6%) | 4 (18.2%) |
| 15 to 19 Years | 0 (0.0%) | 1 (4.5%) |
| 20 to 24 Years | 0 (0.0%) | 4 (18.2%) |
| 25 to 29 Years | 0 (0.0%) | 0 (0.0%) |
| 30 to 34 Years | 0 (0.0%) | 0 (0.0%) |
| 35 to 39 Years | 3 (42.9%) | 2 (9.1%) |
| 40 to 44 Years | 0 (0.0%) | 1 (4.5%) |
| 45 to 49 Years | 2 (28.6%) | 2 (9.1%) |
| 50 to 54 Years | 0 (0.0%) | 1 (4.5%) |
| 55 to 59 Years | 0 (0.0%) | 0 (0.0%) |
| 60 to 64 Years | 0 (0.0%) | 2 (9.1%) |
| 65 to 69 Years | 0 (0.0%) | 0 (0.0%) |
| 70 to 74 Years | 0 (0.0%) | 0 (0.0%) |
| 75 to 79 Years | 0 (0.0%) | 0 (0.0%) |
| 80 to 84 Years | 0 (0.0%) | 2 (9.1%) |
| 85 Years and over | 0 (0.0%) | 0 (0.0%) |
| Total | 7 (100.0%) | 22 (100.0%) |
Families and Households in Grand Pass
Median Family Size in Grand Pass
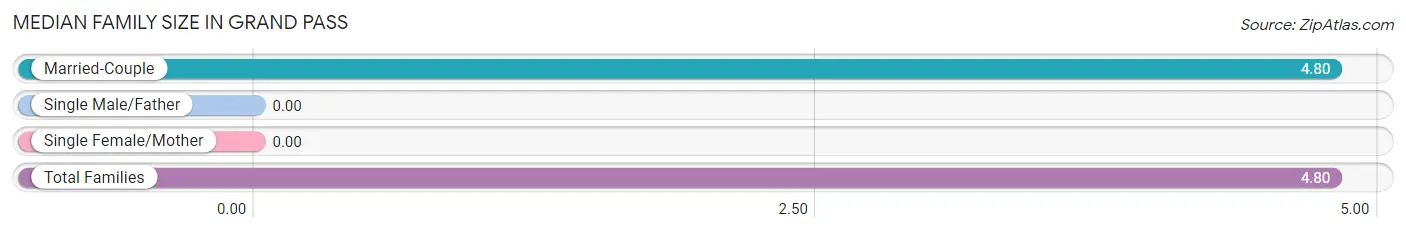
| Family Type | # Families | Family Size |
| Married-Couple | 5 (100.0%) | 4.80 |
| Single Male/Father | 0 (0.0%) | - |
| Single Female/Mother | 0 (0.0%) | - |
| Total Families | 5 (100.0%) | 4.80 |
Median Household Size in Grand Pass
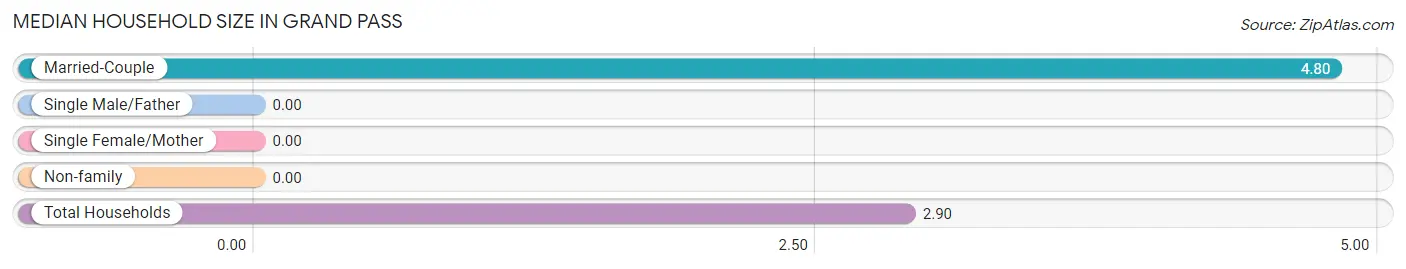
| Household Type | # Households | Household Size |
| Married-Couple | 5 (50.0%) | 4.80 |
| Single Male/Father | 0 (0.0%) | - |
| Single Female/Mother | 0 (0.0%) | - |
| Non-family | 5 (50.0%) | - |
| Total Households | 10 (100.0%) | 2.90 |
Household Size by Marriage Status in Grand Pass
Out of a total of 10 households in Grand Pass, 5 (50.0%) are family households, while 5 (50.0%) are nonfamily households. The most numerous type of family households are 2-person households, comprising 2, and the most common type of nonfamily households are 1-person households, comprising 5.
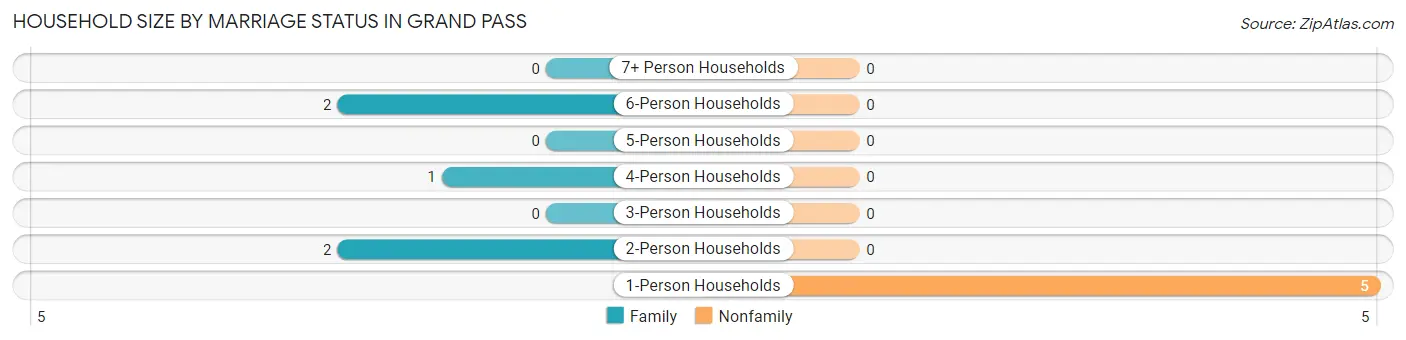
| Household Size | Family Households | Nonfamily Households |
| 1-Person Households | - | 5 (50.0%) |
| 2-Person Households | 2 (20.0%) | 0 (0.0%) |
| 3-Person Households | 0 (0.0%) | 0 (0.0%) |
| 4-Person Households | 1 (10.0%) | 0 (0.0%) |
| 5-Person Households | 0 (0.0%) | 0 (0.0%) |
| 6-Person Households | 2 (20.0%) | 0 (0.0%) |
| 7+ Person Households | 0 (0.0%) | 0 (0.0%) |
| Total | 5 (50.0%) | 5 (50.0%) |
Female Fertility in Grand Pass
Fertility by Age in Grand Pass
| Age Bracket | Women with Births | Births / 1,000 Women |
| 15 to 19 years | 0 (0.0%) | 0.0 |
| 20 to 34 years | 0 (0.0%) | 0.0 |
| 35 to 50 years | 0 (0.0%) | 0.0 |
| Total | 0 (0.0%) | 0.0 |
Fertility by Age by Marriage Status in Grand Pass
| Age Bracket | Married | Unmarried |
| 15 to 19 years | 0 (0.0%) | 0 (0.0%) |
| 20 to 34 years | 0 (0.0%) | 0 (0.0%) |
| 35 to 50 years | 0 (0.0%) | 0 (0.0%) |
| Total | 0 (0.0%) | 0 (0.0%) |
Fertility by Education in Grand Pass
| Educational Attainment | Women with Births | Births / 1,000 Women |
| Less than High School | 0 (0.0%) | 0.0 |
| High School Diploma | 0 (0.0%) | 0.0 |
| College or Associate's Degree | 0 (0.0%) | 0.0 |
| Bachelor's Degree | 0 (0.0%) | 0.0 |
| Graduate Degree | 0 (0.0%) | 0.0 |
| Total | 0 (0.0%) | 0.0 |
Fertility by Education by Marriage Status in Grand Pass
| Educational Attainment | Married | Unmarried |
| Less than High School | 0 (0.0%) | 0 (0.0%) |
| High School Diploma | 0 (0.0%) | 0 (0.0%) |
| College or Associate's Degree | 0 (0.0%) | 0 (0.0%) |
| Bachelor's Degree | 0 (0.0%) | 0 (0.0%) |
| Graduate Degree | 0 (0.0%) | 0 (0.0%) |
| Total | 0 (0.0%) | 0 (0.0%) |
Employment Characteristics in Grand Pass
Employment by Class of Employer in Grand Pass
Among the 6 employed individuals in Grand Pass, , and private company employees (6 | 100.0%) make up the most common classes of employment.
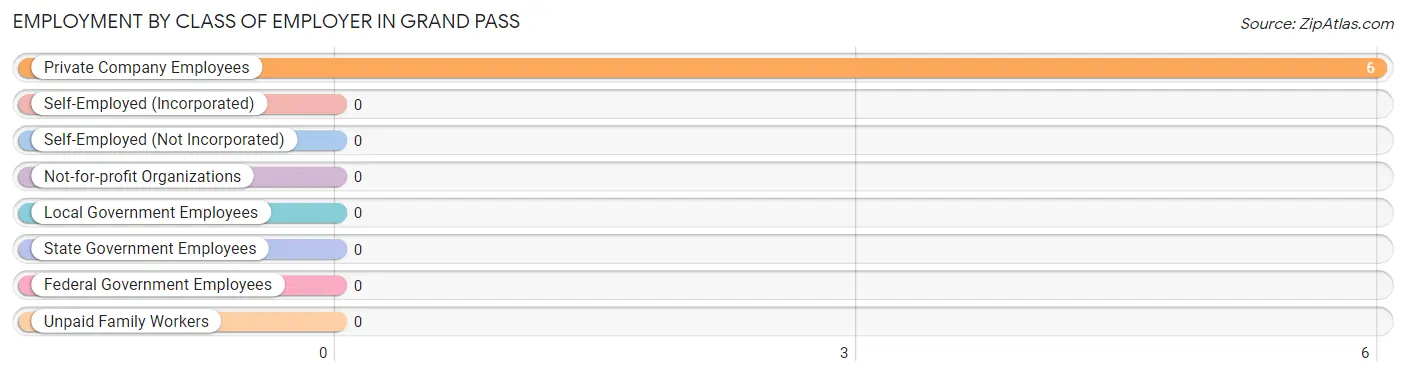
| Employer Class | # Employees | % Employees |
| Private Company Employees | 6 | 100.0% |
| Self-Employed (Incorporated) | 0 | 0.0% |
| Self-Employed (Not Incorporated) | 0 | 0.0% |
| Not-for-profit Organizations | 0 | 0.0% |
| Local Government Employees | 0 | 0.0% |
| State Government Employees | 0 | 0.0% |
| Federal Government Employees | 0 | 0.0% |
| Unpaid Family Workers | 0 | 0.0% |
| Total | 6 | 100.0% |
Employment Status by Age in Grand Pass
According to the labor force statistics for Grand Pass, out of the total population over 16 years of age (20), 40.0% or 8 individuals are in the labor force, with 25.0% or 2 of them unemployed. The age group with the highest labor force participation rate is 45 to 54 years, with 100.0% or 5 individuals in the labor force. Within the labor force, the 45 to 54 years age range has the highest percentage of unemployed individuals, with 40.0% or 2 of them being unemployed.
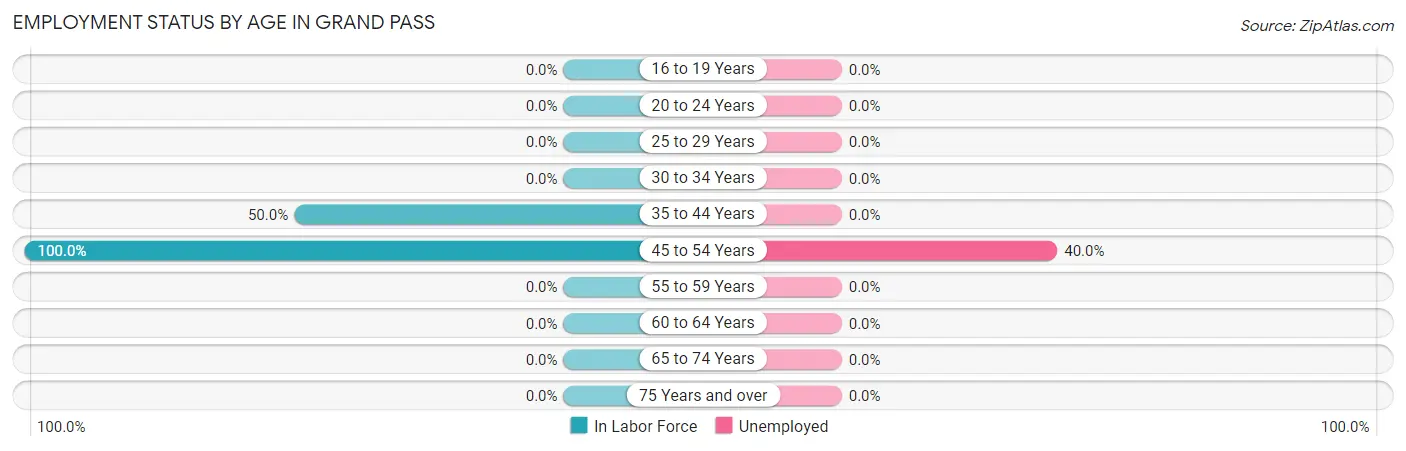
| Age Bracket | In Labor Force | Unemployed |
| 16 to 19 Years | 0 (0.0%) | 0 (0.0%) |
| 20 to 24 Years | 0 (0.0%) | 0 (0.0%) |
| 25 to 29 Years | 0 (0.0%) | 0 (0.0%) |
| 30 to 34 Years | 0 (0.0%) | 0 (0.0%) |
| 35 to 44 Years | 3 (50.0%) | 0 (0.0%) |
| 45 to 54 Years | 5 (100.0%) | 2 (40.0%) |
| 55 to 59 Years | 0 (0.0%) | 0 (0.0%) |
| 60 to 64 Years | 0 (0.0%) | 0 (0.0%) |
| 65 to 74 Years | 0 (0.0%) | 0 (0.0%) |
| 75 Years and over | 0 (0.0%) | 0 (0.0%) |
| Total | 8 (40.0%) | 2 (25.0%) |
Employment Status by Educational Attainment in Grand Pass
According to labor force statistics for Grand Pass, 61.5% of individuals (8) out of the total population between 25 and 64 years of age (13) are in the labor force, with 25.0% or 2 of them being unemployed. The group with the highest labor force participation rate are those with the educational attainment of less than high school, with 100.0% or 2 individuals in the labor force. Within the labor force, individuals with college / associate degree education have the highest percentage of unemployment, with 66.7% or 2 of them being unemployed.
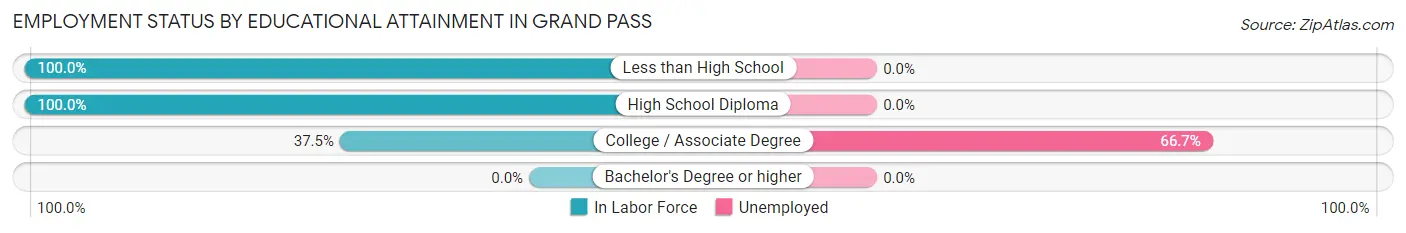
| Educational Attainment | In Labor Force | Unemployed |
| Less than High School | 2 (100.0%) | 0 (0.0%) |
| High School Diploma | 3 (100.0%) | 0 (0.0%) |
| College / Associate Degree | 3 (37.5%) | 5 (66.7%) |
| Bachelor's Degree or higher | 0 (0.0%) | 0 (0.0%) |
| Total | 8 (61.5%) | 3 (25.0%) |
Employment Occupations by Sex in Grand Pass
Management, Business, Science and Arts Occupations
The most common Management, Business, Science and Arts occupations in Grand Pass are , and Health Diagnosing & Treating (1 | 16.7%).
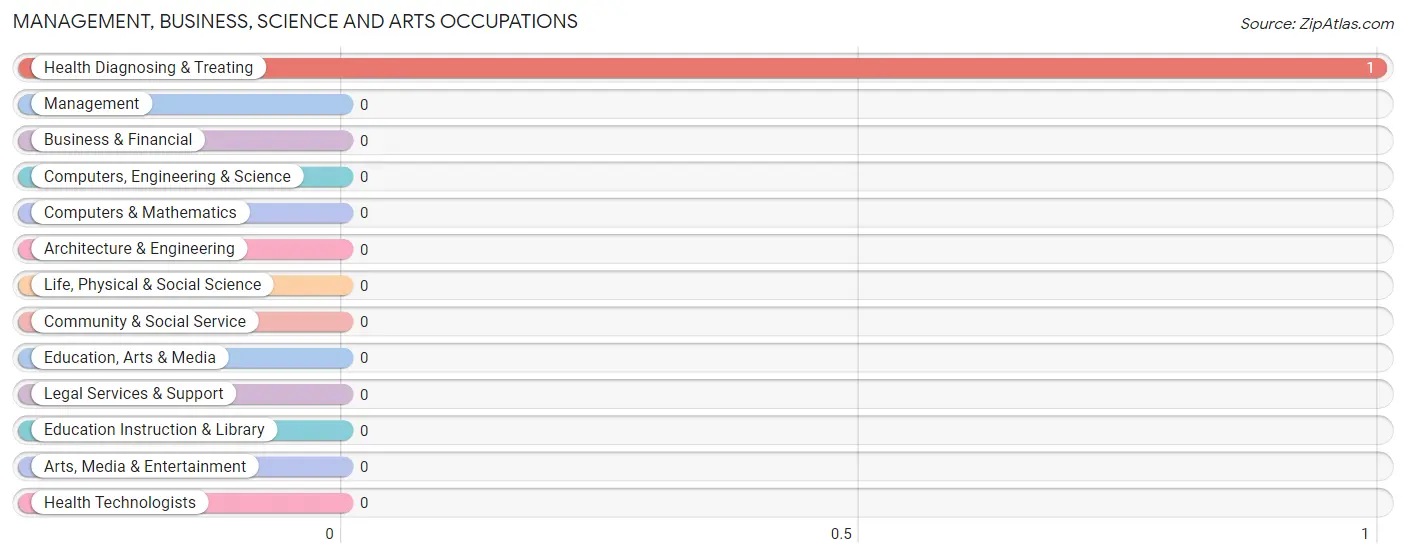
Management, Business, Science and Arts Occupations by Sex
| Occupation | Male | Female |
| Management | 0 (0.0%) | 0 (0.0%) |
| Business & Financial | 0 (0.0%) | 0 (0.0%) |
| Computers, Engineering & Science | 0 (0.0%) | 0 (0.0%) |
| Computers & Mathematics | 0 (0.0%) | 0 (0.0%) |
| Architecture & Engineering | 0 (0.0%) | 0 (0.0%) |
| Life, Physical & Social Science | 0 (0.0%) | 0 (0.0%) |
| Community & Social Service | 0 (0.0%) | 0 (0.0%) |
| Education, Arts & Media | 0 (0.0%) | 0 (0.0%) |
| Legal Services & Support | 0 (0.0%) | 0 (0.0%) |
| Education Instruction & Library | 0 (0.0%) | 0 (0.0%) |
| Arts, Media & Entertainment | 0 (0.0%) | 0 (0.0%) |
| Health Diagnosing & Treating | 0 (0.0%) | 1 (100.0%) |
| Health Technologists | 0 (0.0%) | 0 (0.0%) |
| Total (Category) | 0 (0.0%) | 1 (100.0%) |
| Total (Overall) | 5 (83.3%) | 1 (16.7%) |
Services Occupations
Services Occupations by Sex
| Occupation | Male | Female |
| Healthcare Support | 0 (0.0%) | 0 (0.0%) |
| Security & Protection | 0 (0.0%) | 0 (0.0%) |
| Firefighting & Prevention | 0 (0.0%) | 0 (0.0%) |
| Law Enforcement | 0 (0.0%) | 0 (0.0%) |
| Food Preparation & Serving | 0 (0.0%) | 0 (0.0%) |
| Cleaning & Maintenance | 0 (0.0%) | 0 (0.0%) |
| Personal Care & Service | 0 (0.0%) | 0 (0.0%) |
| Total (Category) | 0 (0.0%) | 0 (0.0%) |
| Total (Overall) | 5 (83.3%) | 1 (16.7%) |
Sales and Office Occupations
Sales and Office Occupations by Sex
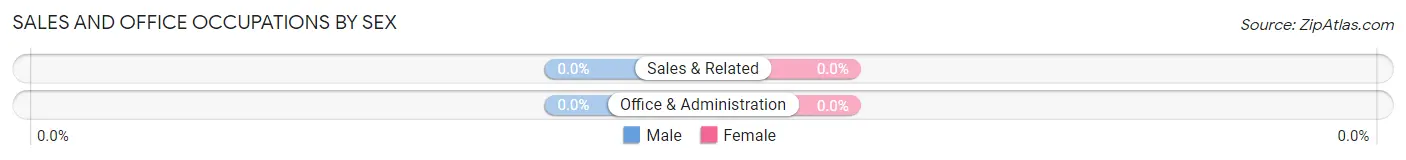
| Occupation | Male | Female |
| Sales & Related | 0 (0.0%) | 0 (0.0%) |
| Office & Administration | 0 (0.0%) | 0 (0.0%) |
| Total (Category) | 0 (0.0%) | 0 (0.0%) |
| Total (Overall) | 5 (83.3%) | 1 (16.7%) |
Natural Resources, Construction and Maintenance Occupations
The most common Natural Resources, Construction and Maintenance occupations in Grand Pass are Farming, Fishing & Forestry (2 | 33.3%), and Construction & Extraction (2 | 33.3%).
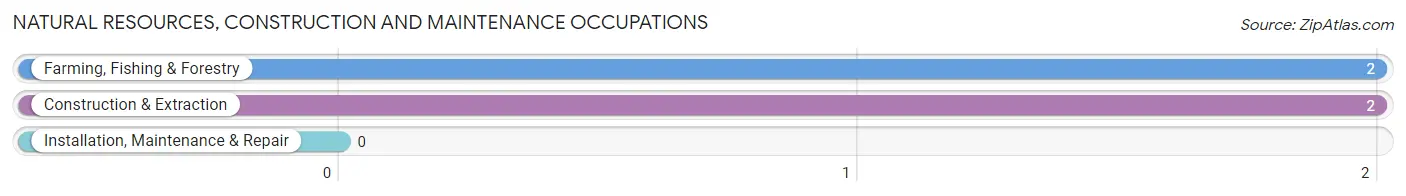
Natural Resources, Construction and Maintenance Occupations by Sex
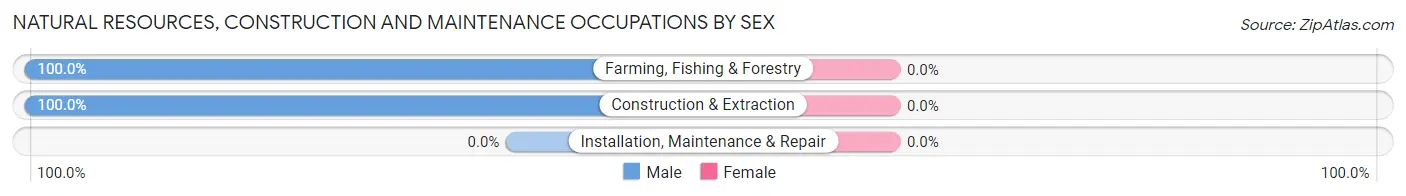
| Occupation | Male | Female |
| Farming, Fishing & Forestry | 2 (100.0%) | 0 (0.0%) |
| Construction & Extraction | 2 (100.0%) | 0 (0.0%) |
| Installation, Maintenance & Repair | 0 (0.0%) | 0 (0.0%) |
| Total (Category) | 4 (100.0%) | 0 (0.0%) |
| Total (Overall) | 5 (83.3%) | 1 (16.7%) |
Production, Transportation and Moving Occupations
The most common Production, Transportation and Moving occupations in Grand Pass are , and Production (1 | 16.7%).
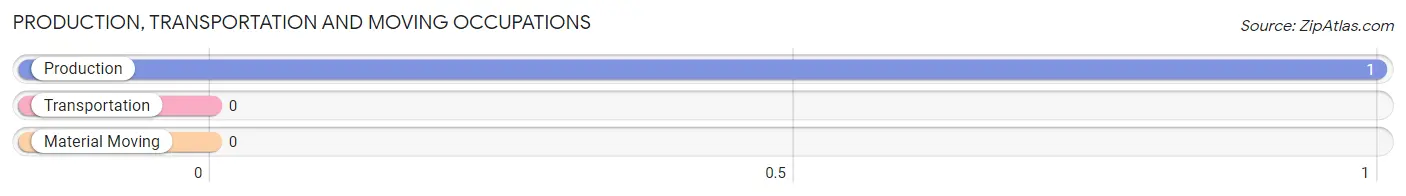
Production, Transportation and Moving Occupations by Sex
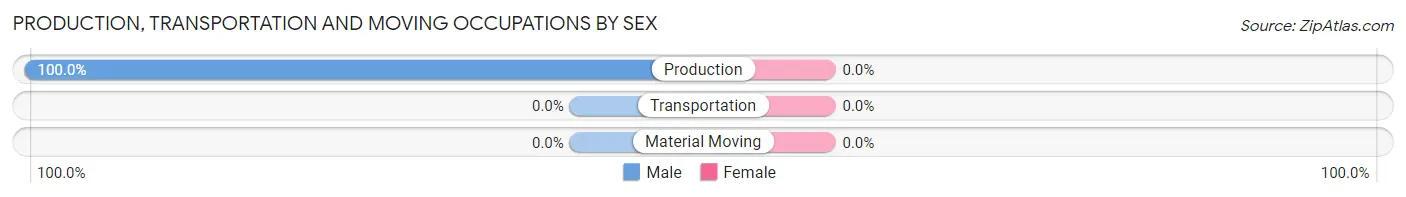
| Occupation | Male | Female |
| Production | 1 (100.0%) | 0 (0.0%) |
| Transportation | 0 (0.0%) | 0 (0.0%) |
| Material Moving | 0 (0.0%) | 0 (0.0%) |
| Total (Category) | 1 (100.0%) | 0 (0.0%) |
| Total (Overall) | 5 (83.3%) | 1 (16.7%) |
Employment Industries by Sex in Grand Pass
Employment Industries in Grand Pass
The major employment industries in Grand Pass include Agriculture, Fishing & Hunting (2 | 33.3%), Construction (2 | 33.3%), Manufacturing (1 | 16.7%), and Health Care & Social Assistance (1 | 16.7%).
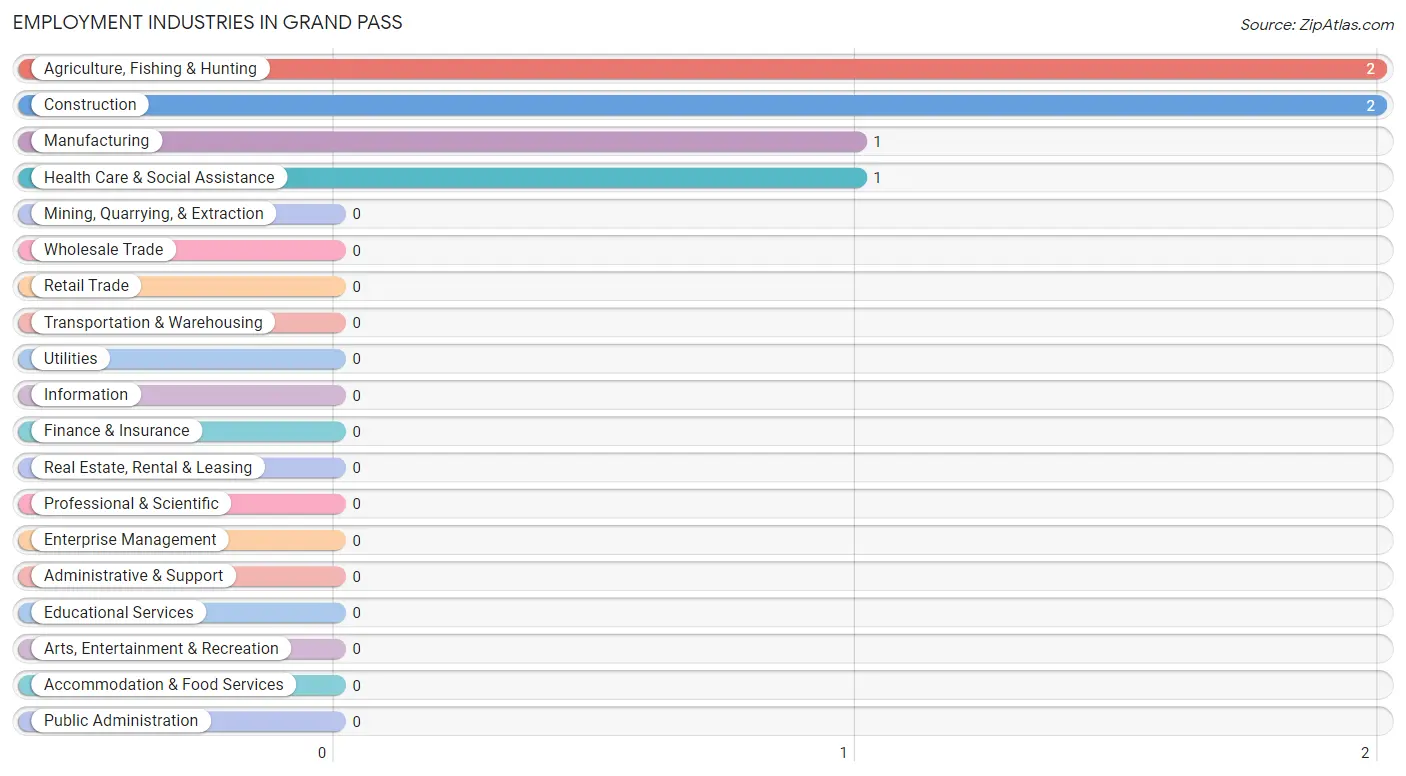
Employment Industries by Sex in Grand Pass
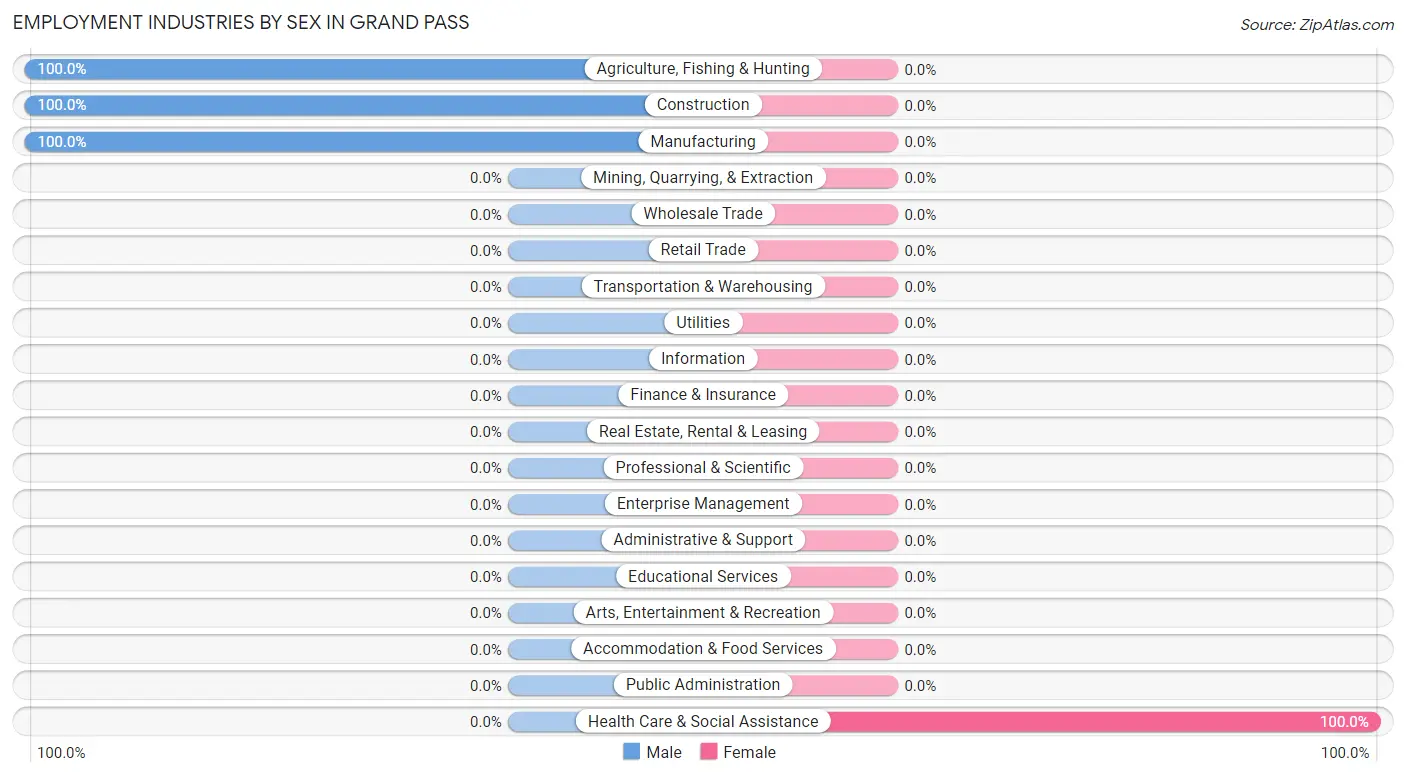
| Industry | Male | Female |
| Agriculture, Fishing & Hunting | 2 (100.0%) | 0 (0.0%) |
| Mining, Quarrying, & Extraction | 0 (0.0%) | 0 (0.0%) |
| Construction | 2 (100.0%) | 0 (0.0%) |
| Manufacturing | 1 (100.0%) | 0 (0.0%) |
| Wholesale Trade | 0 (0.0%) | 0 (0.0%) |
| Retail Trade | 0 (0.0%) | 0 (0.0%) |
| Transportation & Warehousing | 0 (0.0%) | 0 (0.0%) |
| Utilities | 0 (0.0%) | 0 (0.0%) |
| Information | 0 (0.0%) | 0 (0.0%) |
| Finance & Insurance | 0 (0.0%) | 0 (0.0%) |
| Real Estate, Rental & Leasing | 0 (0.0%) | 0 (0.0%) |
| Professional & Scientific | 0 (0.0%) | 0 (0.0%) |
| Enterprise Management | 0 (0.0%) | 0 (0.0%) |
| Administrative & Support | 0 (0.0%) | 0 (0.0%) |
| Educational Services | 0 (0.0%) | 0 (0.0%) |
| Health Care & Social Assistance | 0 (0.0%) | 1 (100.0%) |
| Arts, Entertainment & Recreation | 0 (0.0%) | 0 (0.0%) |
| Accommodation & Food Services | 0 (0.0%) | 0 (0.0%) |
| Public Administration | 0 (0.0%) | 0 (0.0%) |
| Total | 5 (83.3%) | 1 (16.7%) |
Education in Grand Pass
School Enrollment in Grand Pass
The most common levels of schooling among the 14 students in Grand Pass are elementary school (5 | 35.7%), high school (5 | 35.7%), and middle school (4 | 28.6%).
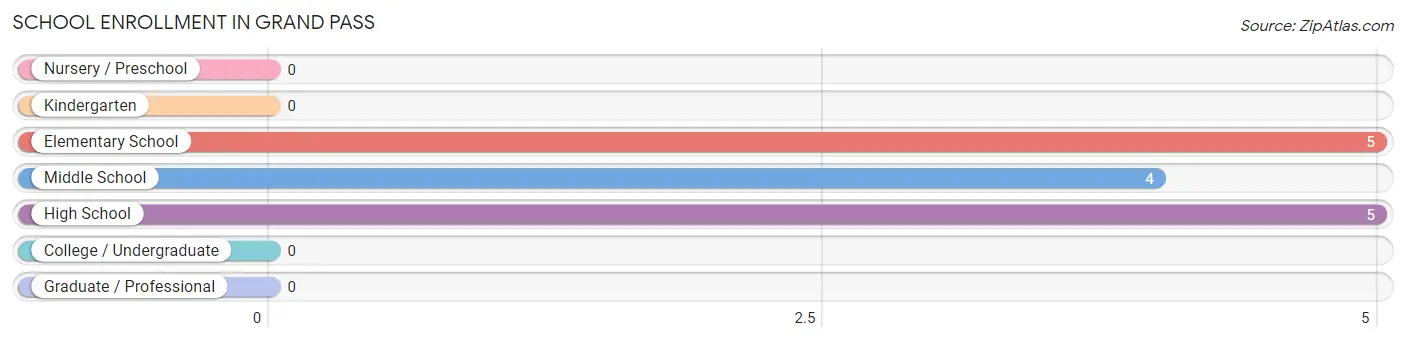
| School Level | # Students | % Students |
| Nursery / Preschool | 0 | 0.0% |
| Kindergarten | 0 | 0.0% |
| Elementary School | 5 | 35.7% |
| Middle School | 4 | 28.6% |
| High School | 5 | 35.7% |
| College / Undergraduate | 0 | 0.0% |
| Graduate / Professional | 0 | 0.0% |
| Total | 14 | 100.0% |
School Enrollment by Age by Funding Source in Grand Pass
Out of a total of 14 students who are enrolled in schools in Grand Pass, 1 (7.1%) attend a private institution, while the remaining 13 (92.9%) are enrolled in public schools. The age group of 15 to 17 year olds has the highest likelihood of being enrolled in private schools, with 1 (100.0% in the age bracket) enrolled. Conversely, the age group of 5 to 9 year old has the lowest likelihood of being enrolled in a private school, with 3 (100.0% in the age bracket) attending a public institution.
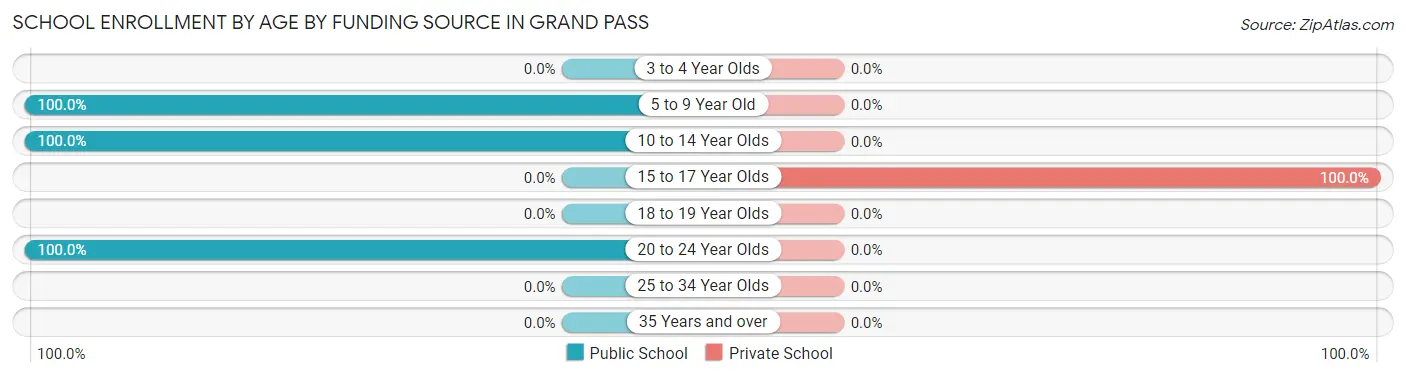
| Age Bracket | Public School | Private School |
| 3 to 4 Year Olds | 0 (0.0%) | 0 (0.0%) |
| 5 to 9 Year Old | 3 (100.0%) | 0 (0.0%) |
| 10 to 14 Year Olds | 6 (100.0%) | 0 (0.0%) |
| 15 to 17 Year Olds | 0 (0.0%) | 1 (100.0%) |
| 18 to 19 Year Olds | 0 (0.0%) | 0 (0.0%) |
| 20 to 24 Year Olds | 4 (100.0%) | 0 (0.0%) |
| 25 to 34 Year Olds | 0 (0.0%) | 0 (0.0%) |
| 35 Years and over | 0 (0.0%) | 0 (0.0%) |
| Total | 13 (92.9%) | 1 (7.1%) |
Educational Attainment by Field of Study in Grand Pass
| Field of Study | # Graduates | % Graduates |
| Computers & Mathematics | 0 | 0.0% |
| Bio, Nature & Agricultural | 0 | 0.0% |
| Physical & Health Sciences | 0 | 0.0% |
| Psychology | 0 | 0.0% |
| Social Sciences | 0 | 0.0% |
| Engineering | 0 | 0.0% |
| Multidisciplinary Studies | 0 | 0.0% |
| Science & Technology | 0 | 0.0% |
| Business | 0 | 0.0% |
| Education | 0 | 0.0% |
| Literature & Languages | 0 | 0.0% |
| Liberal Arts & History | 0 | 0.0% |
| Visual & Performing Arts | 0 | 0.0% |
| Communications | 0 | 0.0% |
| Arts & Humanities | 0 | 0.0% |
| Total | 0 | 0.0% |
Transportation & Commute in Grand Pass
Vehicle Availability by Sex in Grand Pass
The most prevalent vehicle ownership categories in Grand Pass are males with 2 vehicles (3, accounting for 60.0%) and females with 2 vehicles (0, making up 300.0%).
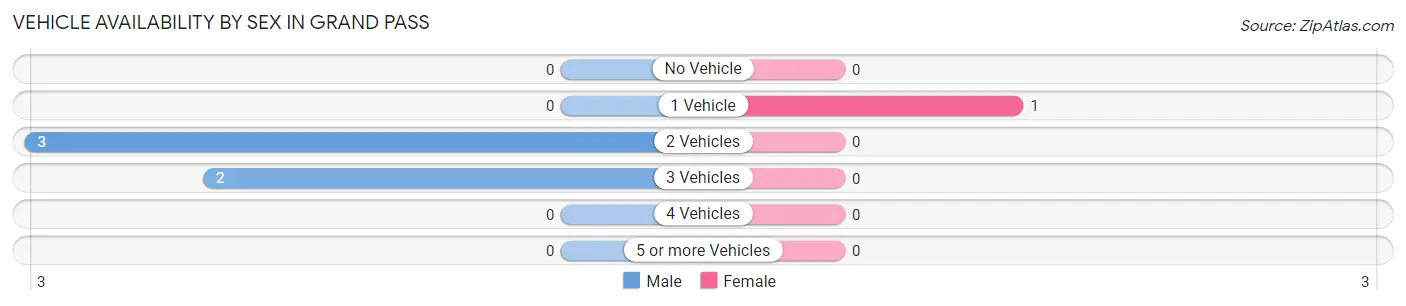
| Vehicles Available | Male | Female |
| No Vehicle | 0 (0.0%) | 0 (0.0%) |
| 1 Vehicle | 0 (0.0%) | 1 (100.0%) |
| 2 Vehicles | 3 (60.0%) | 0 (0.0%) |
| 3 Vehicles | 2 (40.0%) | 0 (0.0%) |
| 4 Vehicles | 0 (0.0%) | 0 (0.0%) |
| 5 or more Vehicles | 0 (0.0%) | 0 (0.0%) |
| Total | 5 (100.0%) | 1 (100.0%) |
Commute Time in Grand Pass
The most frequently occuring commute durations in Grand Pass are 5 to 9 minutes (2 commuters, 33.3%), 60 to 89 minutes (2 commuters, 33.3%), and 20 to 24 minutes (1 commuters, 16.7%).
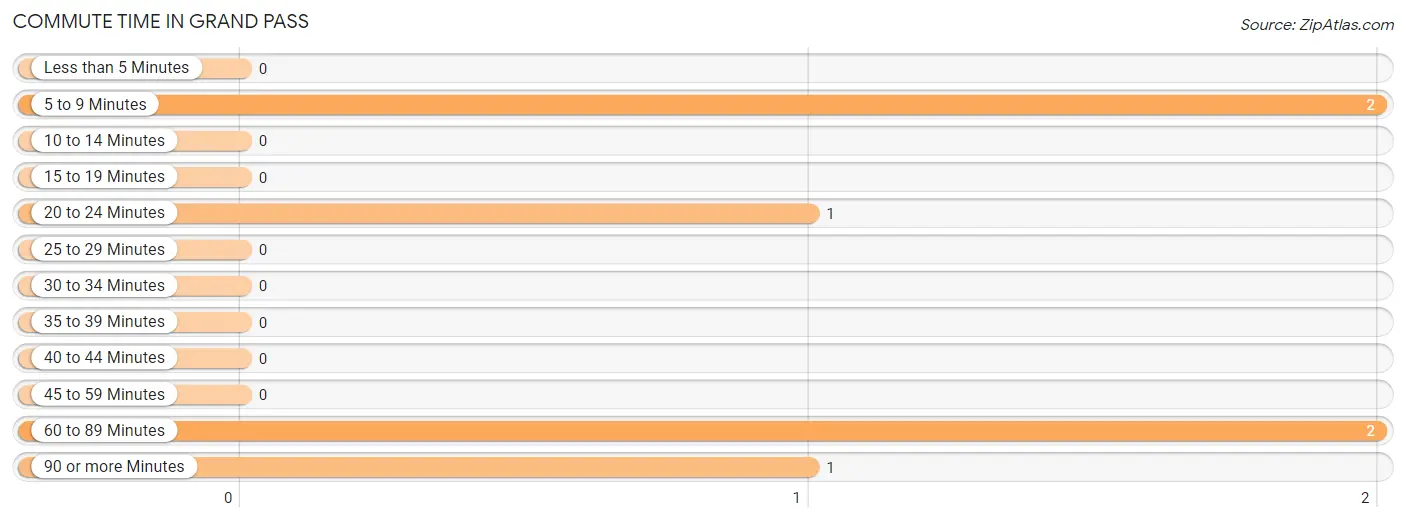
| Commute Time | # Commuters | % Commuters |
| Less than 5 Minutes | 0 | 0.0% |
| 5 to 9 Minutes | 2 | 33.3% |
| 10 to 14 Minutes | 0 | 0.0% |
| 15 to 19 Minutes | 0 | 0.0% |
| 20 to 24 Minutes | 1 | 16.7% |
| 25 to 29 Minutes | 0 | 0.0% |
| 30 to 34 Minutes | 0 | 0.0% |
| 35 to 39 Minutes | 0 | 0.0% |
| 40 to 44 Minutes | 0 | 0.0% |
| 45 to 59 Minutes | 0 | 0.0% |
| 60 to 89 Minutes | 2 | 33.3% |
| 90 or more Minutes | 1 | 16.7% |
Commute Time by Sex in Grand Pass
The most common commute times in Grand Pass are 5 to 9 minutes (2 commuters, 40.0%) for males and 90 or more minutes (1 commuters, 100.0%) for females.
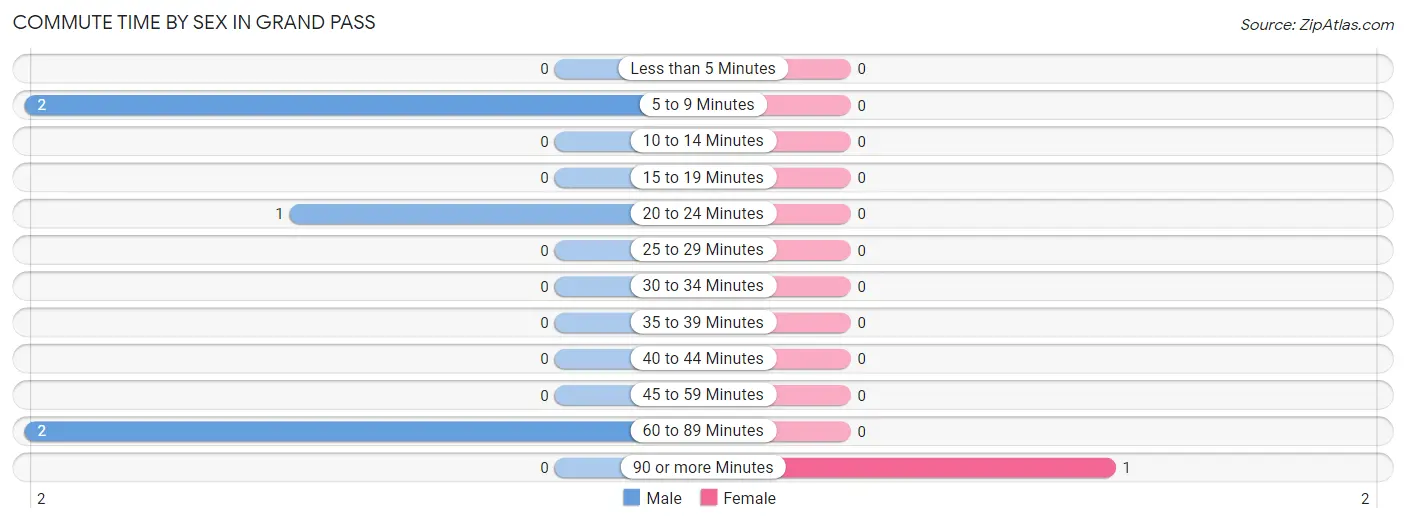
| Commute Time | Male | Female |
| Less than 5 Minutes | 0 (0.0%) | 0 (0.0%) |
| 5 to 9 Minutes | 2 (40.0%) | 0 (0.0%) |
| 10 to 14 Minutes | 0 (0.0%) | 0 (0.0%) |
| 15 to 19 Minutes | 0 (0.0%) | 0 (0.0%) |
| 20 to 24 Minutes | 1 (20.0%) | 0 (0.0%) |
| 25 to 29 Minutes | 0 (0.0%) | 0 (0.0%) |
| 30 to 34 Minutes | 0 (0.0%) | 0 (0.0%) |
| 35 to 39 Minutes | 0 (0.0%) | 0 (0.0%) |
| 40 to 44 Minutes | 0 (0.0%) | 0 (0.0%) |
| 45 to 59 Minutes | 0 (0.0%) | 0 (0.0%) |
| 60 to 89 Minutes | 2 (40.0%) | 0 (0.0%) |
| 90 or more Minutes | 0 (0.0%) | 1 (100.0%) |
Time of Departure to Work by Sex in Grand Pass
The most frequent times of departure to work in Grand Pass are 7:30 AM to 7:59 AM (4, 80.0%) for males and 4:00 PM to 11:59 PM (1, 100.0%) for females.
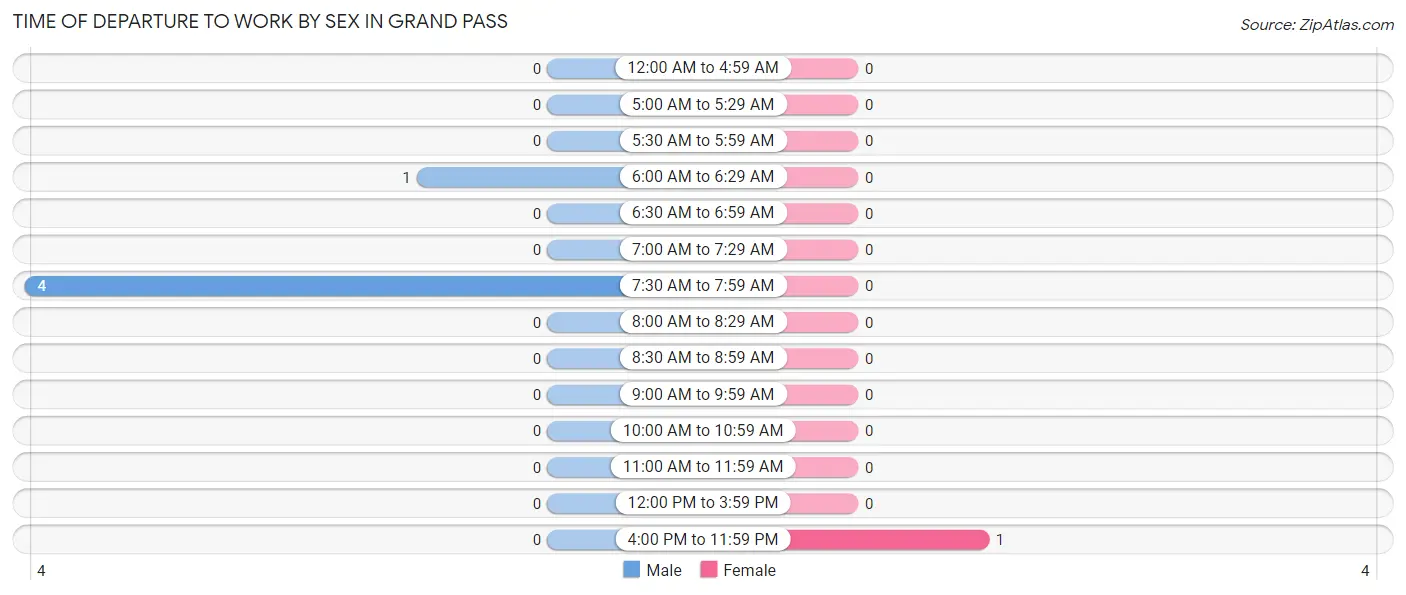
| Time of Departure | Male | Female |
| 12:00 AM to 4:59 AM | 0 (0.0%) | 0 (0.0%) |
| 5:00 AM to 5:29 AM | 0 (0.0%) | 0 (0.0%) |
| 5:30 AM to 5:59 AM | 0 (0.0%) | 0 (0.0%) |
| 6:00 AM to 6:29 AM | 1 (20.0%) | 0 (0.0%) |
| 6:30 AM to 6:59 AM | 0 (0.0%) | 0 (0.0%) |
| 7:00 AM to 7:29 AM | 0 (0.0%) | 0 (0.0%) |
| 7:30 AM to 7:59 AM | 4 (80.0%) | 0 (0.0%) |
| 8:00 AM to 8:29 AM | 0 (0.0%) | 0 (0.0%) |
| 8:30 AM to 8:59 AM | 0 (0.0%) | 0 (0.0%) |
| 9:00 AM to 9:59 AM | 0 (0.0%) | 0 (0.0%) |
| 10:00 AM to 10:59 AM | 0 (0.0%) | 0 (0.0%) |
| 11:00 AM to 11:59 AM | 0 (0.0%) | 0 (0.0%) |
| 12:00 PM to 3:59 PM | 0 (0.0%) | 0 (0.0%) |
| 4:00 PM to 11:59 PM | 0 (0.0%) | 1 (100.0%) |
| Total | 5 (100.0%) | 1 (100.0%) |
Housing Occupancy in Grand Pass
Occupancy by Ownership in Grand Pass
Of the total 10 dwellings in Grand Pass, owner-occupied units account for 7 (70.0%), while renter-occupied units make up 3 (30.0%).
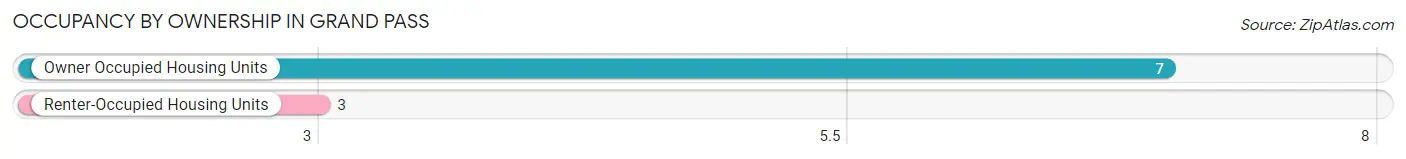
| Occupancy | # Housing Units | % Housing Units |
| Owner Occupied Housing Units | 7 | 70.0% |
| Renter-Occupied Housing Units | 3 | 30.0% |
| Total Occupied Housing Units | 10 | 100.0% |
Occupancy by Household Size in Grand Pass
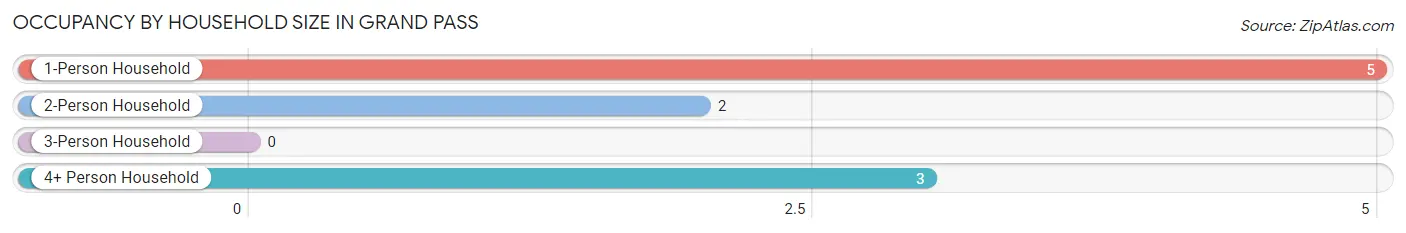
| Household Size | # Housing Units | % Housing Units |
| 1-Person Household | 5 | 50.0% |
| 2-Person Household | 2 | 20.0% |
| 3-Person Household | 0 | 0.0% |
| 4+ Person Household | 3 | 30.0% |
| Total Housing Units | 10 | 100.0% |
Occupancy by Ownership by Household Size in Grand Pass
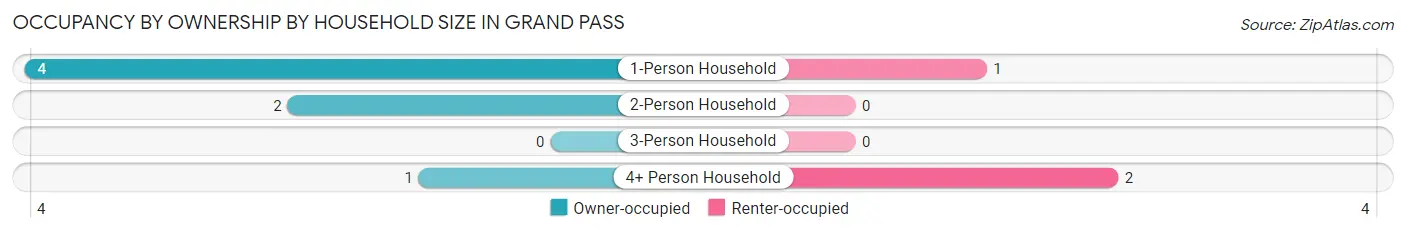
| Household Size | Owner-occupied | Renter-occupied |
| 1-Person Household | 4 (80.0%) | 1 (20.0%) |
| 2-Person Household | 2 (100.0%) | 0 (0.0%) |
| 3-Person Household | 0 (0.0%) | 0 (0.0%) |
| 4+ Person Household | 1 (33.3%) | 2 (66.7%) |
| Total Housing Units | 7 (70.0%) | 3 (30.0%) |
Occupancy by Educational Attainment in Grand Pass
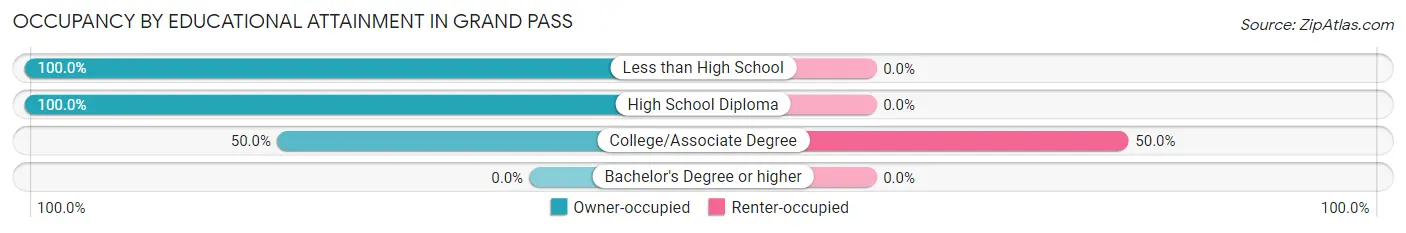
| Household Size | Owner-occupied | Renter-occupied |
| Less than High School | 2 (100.0%) | 0 (0.0%) |
| High School Diploma | 2 (100.0%) | 0 (0.0%) |
| College/Associate Degree | 3 (50.0%) | 3 (50.0%) |
| Bachelor's Degree or higher | 0 (0.0%) | 0 (0.0%) |
Occupancy by Age of Householder in Grand Pass
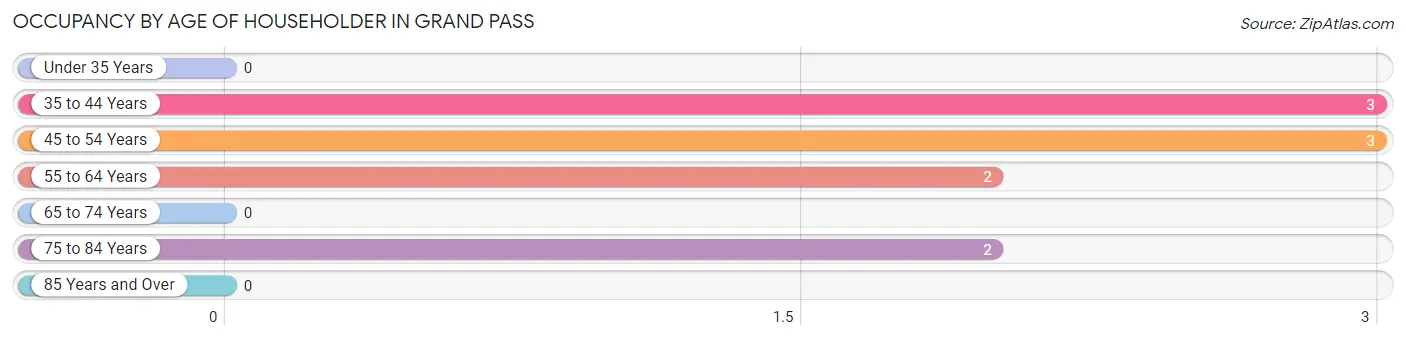
| Age Bracket | # Households | % Households |
| Under 35 Years | 0 | 0.0% |
| 35 to 44 Years | 3 | 30.0% |
| 45 to 54 Years | 3 | 30.0% |
| 55 to 64 Years | 2 | 20.0% |
| 65 to 74 Years | 0 | 0.0% |
| 75 to 84 Years | 2 | 20.0% |
| 85 Years and Over | 0 | 0.0% |
| Total | 10 | 100.0% |
Housing Finances in Grand Pass
Median Income by Occupancy in Grand Pass
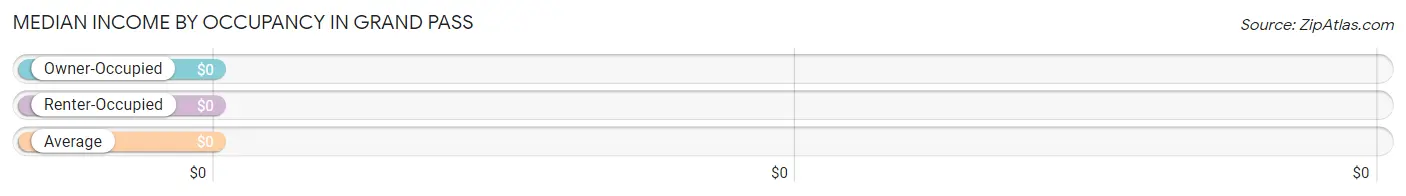
| Occupancy Type | # Households | Median Income |
| Owner-Occupied | 7 (70.0%) | $0 |
| Renter-Occupied | 3 (30.0%) | $0 |
| Average | 10 (100.0%) | $0 |
Occupancy by Householder Income Bracket in Grand Pass
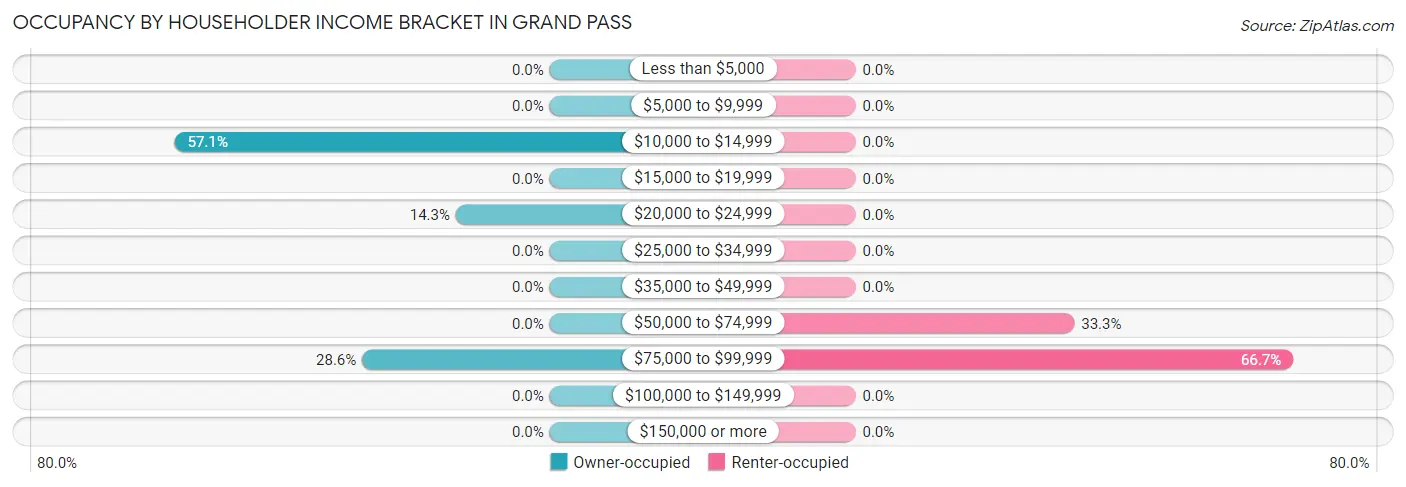
| Income Bracket | Owner-occupied | Renter-occupied |
| Less than $5,000 | 0 (0.0%) | 0 (0.0%) |
| $5,000 to $9,999 | 0 (0.0%) | 0 (0.0%) |
| $10,000 to $14,999 | 4 (57.1%) | 0 (0.0%) |
| $15,000 to $19,999 | 0 (0.0%) | 0 (0.0%) |
| $20,000 to $24,999 | 1 (14.3%) | 0 (0.0%) |
| $25,000 to $34,999 | 0 (0.0%) | 0 (0.0%) |
| $35,000 to $49,999 | 0 (0.0%) | 0 (0.0%) |
| $50,000 to $74,999 | 0 (0.0%) | 1 (33.3%) |
| $75,000 to $99,999 | 2 (28.6%) | 2 (66.7%) |
| $100,000 to $149,999 | 0 (0.0%) | 0 (0.0%) |
| $150,000 or more | 0 (0.0%) | 0 (0.0%) |
| Total | 7 (100.0%) | 3 (100.0%) |
Monthly Housing Cost Tiers in Grand Pass
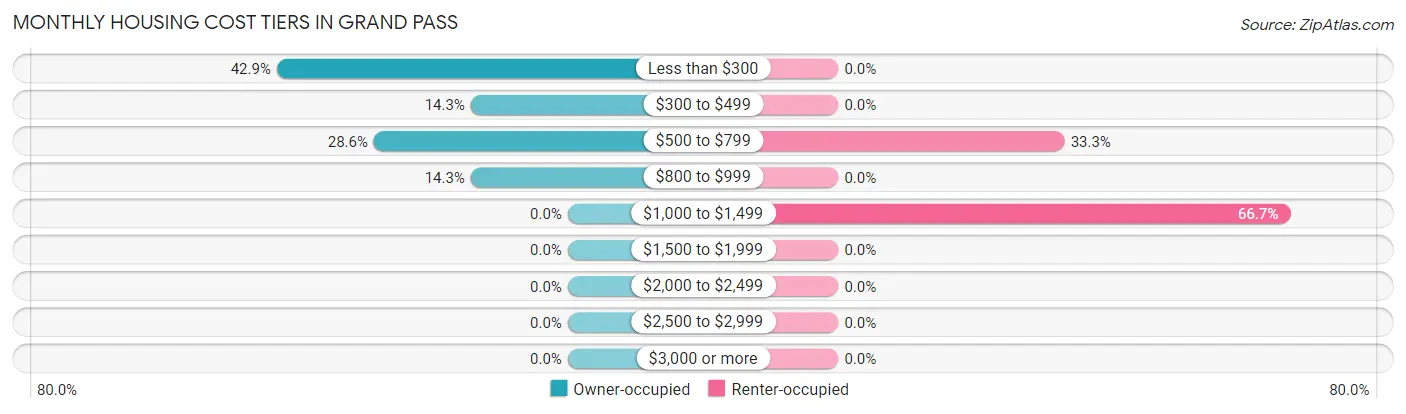
| Monthly Cost | Owner-occupied | Renter-occupied |
| Less than $300 | 3 (42.9%) | 0 (0.0%) |
| $300 to $499 | 1 (14.3%) | 0 (0.0%) |
| $500 to $799 | 2 (28.6%) | 1 (33.3%) |
| $800 to $999 | 1 (14.3%) | 0 (0.0%) |
| $1,000 to $1,499 | 0 (0.0%) | 2 (66.7%) |
| $1,500 to $1,999 | 0 (0.0%) | 0 (0.0%) |
| $2,000 to $2,499 | 0 (0.0%) | 0 (0.0%) |
| $2,500 to $2,999 | 0 (0.0%) | 0 (0.0%) |
| $3,000 or more | 0 (0.0%) | 0 (0.0%) |
| Total | 7 (100.0%) | 3 (100.0%) |
Physical Housing Characteristics in Grand Pass
Housing Structures in Grand Pass
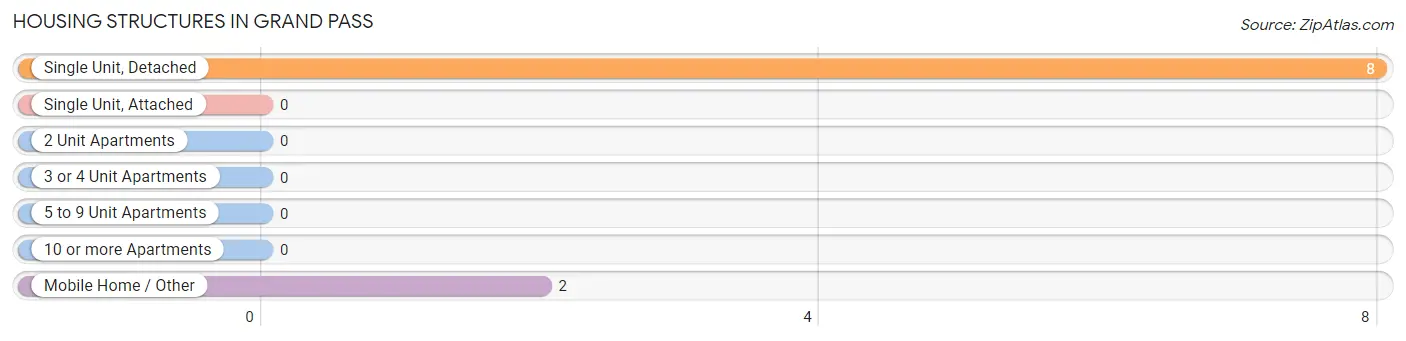
| Structure Type | # Housing Units | % Housing Units |
| Single Unit, Detached | 8 | 80.0% |
| Single Unit, Attached | 0 | 0.0% |
| 2 Unit Apartments | 0 | 0.0% |
| 3 or 4 Unit Apartments | 0 | 0.0% |
| 5 to 9 Unit Apartments | 0 | 0.0% |
| 10 or more Apartments | 0 | 0.0% |
| Mobile Home / Other | 2 | 20.0% |
| Total | 10 | 100.0% |
Housing Structures by Occupancy in Grand Pass
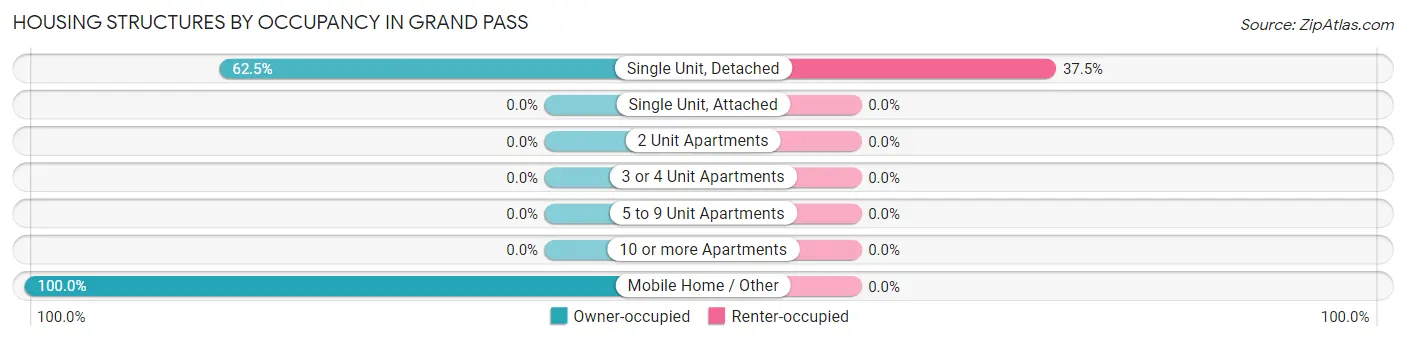
| Structure Type | Owner-occupied | Renter-occupied |
| Single Unit, Detached | 5 (62.5%) | 3 (37.5%) |
| Single Unit, Attached | 0 (0.0%) | 0 (0.0%) |
| 2 Unit Apartments | 0 (0.0%) | 0 (0.0%) |
| 3 or 4 Unit Apartments | 0 (0.0%) | 0 (0.0%) |
| 5 to 9 Unit Apartments | 0 (0.0%) | 0 (0.0%) |
| 10 or more Apartments | 0 (0.0%) | 0 (0.0%) |
| Mobile Home / Other | 2 (100.0%) | 0 (0.0%) |
| Total | 7 (70.0%) | 3 (30.0%) |
Housing Structures by Number of Rooms in Grand Pass
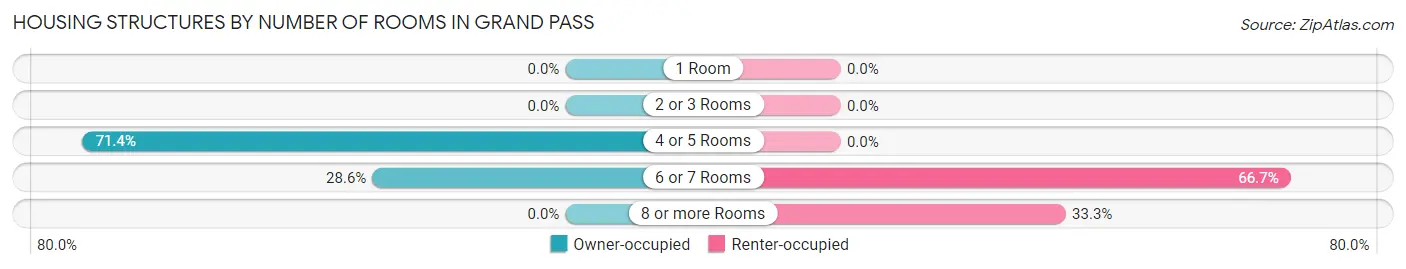
| Number of Rooms | Owner-occupied | Renter-occupied |
| 1 Room | 0 (0.0%) | 0 (0.0%) |
| 2 or 3 Rooms | 0 (0.0%) | 0 (0.0%) |
| 4 or 5 Rooms | 5 (71.4%) | 0 (0.0%) |
| 6 or 7 Rooms | 2 (28.6%) | 2 (66.7%) |
| 8 or more Rooms | 0 (0.0%) | 1 (33.3%) |
| Total | 7 (100.0%) | 3 (100.0%) |
Housing Structure by Heating Type in Grand Pass
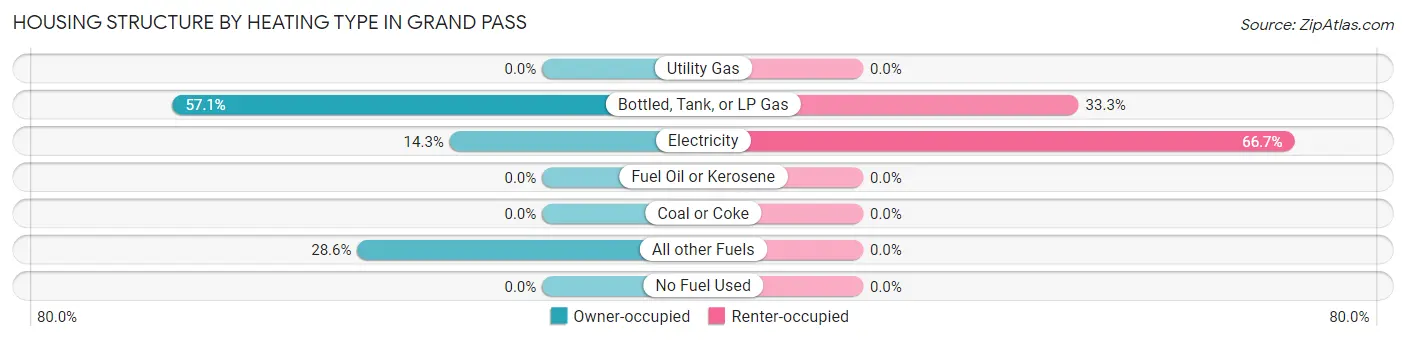
| Heating Type | Owner-occupied | Renter-occupied |
| Utility Gas | 0 (0.0%) | 0 (0.0%) |
| Bottled, Tank, or LP Gas | 4 (57.1%) | 1 (33.3%) |
| Electricity | 1 (14.3%) | 2 (66.7%) |
| Fuel Oil or Kerosene | 0 (0.0%) | 0 (0.0%) |
| Coal or Coke | 0 (0.0%) | 0 (0.0%) |
| All other Fuels | 2 (28.6%) | 0 (0.0%) |
| No Fuel Used | 0 (0.0%) | 0 (0.0%) |
| Total | 7 (100.0%) | 3 (100.0%) |
Household Vehicle Usage in Grand Pass
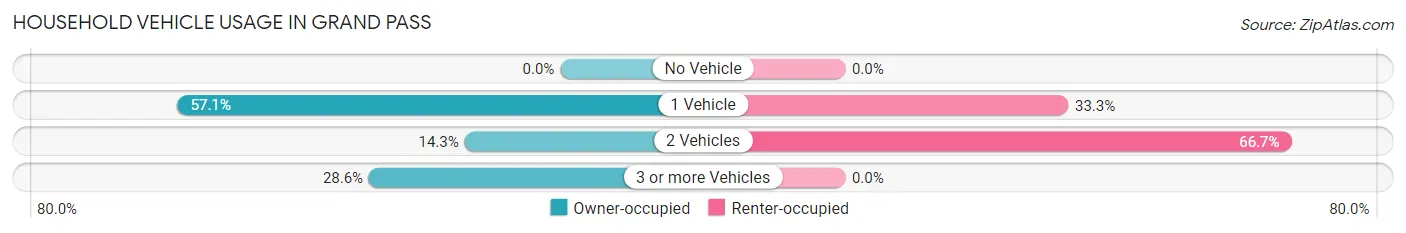
| Vehicles per Household | Owner-occupied | Renter-occupied |
| No Vehicle | 0 (0.0%) | 0 (0.0%) |
| 1 Vehicle | 4 (57.1%) | 1 (33.3%) |
| 2 Vehicles | 1 (14.3%) | 2 (66.7%) |
| 3 or more Vehicles | 2 (28.6%) | 0 (0.0%) |
| Total | 7 (100.0%) | 3 (100.0%) |
Real Estate & Mortgages in Grand Pass
Real Estate and Mortgage Overview in Grand Pass
| Characteristic | Without Mortgage | With Mortgage |
| Housing Units | 6 | 1 |
| Median Property Value | - | - |
| Median Household Income | - | - |
| Monthly Housing Costs | - | - |
| Real Estate Taxes | $450 | $0 |
Property Value by Mortgage Status in Grand Pass
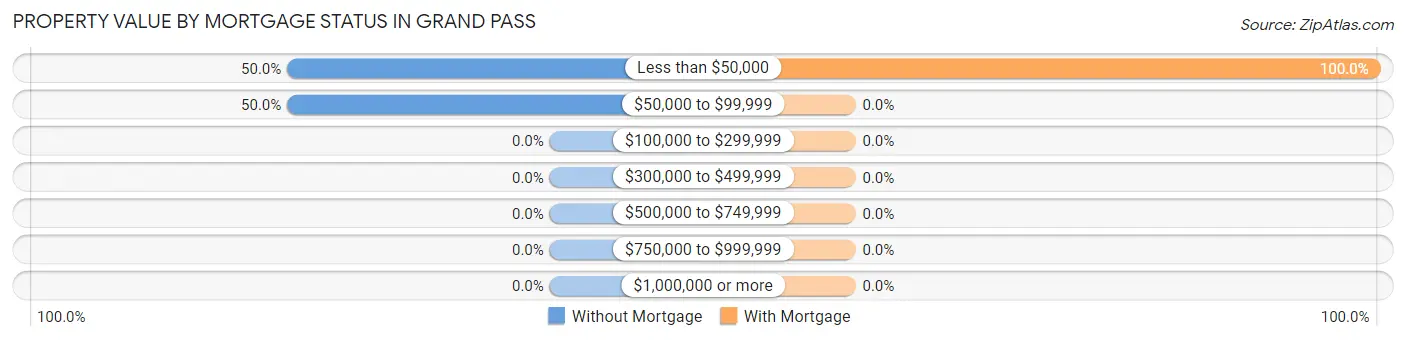
| Property Value | Without Mortgage | With Mortgage |
| Less than $50,000 | 3 (50.0%) | 1 (100.0%) |
| $50,000 to $99,999 | 3 (50.0%) | 0 (0.0%) |
| $100,000 to $299,999 | 0 (0.0%) | 0 (0.0%) |
| $300,000 to $499,999 | 0 (0.0%) | 0 (0.0%) |
| $500,000 to $749,999 | 0 (0.0%) | 0 (0.0%) |
| $750,000 to $999,999 | 0 (0.0%) | 0 (0.0%) |
| $1,000,000 or more | 0 (0.0%) | 0 (0.0%) |
| Total | 6 (100.0%) | 1 (100.0%) |
Household Income by Mortgage Status in Grand Pass
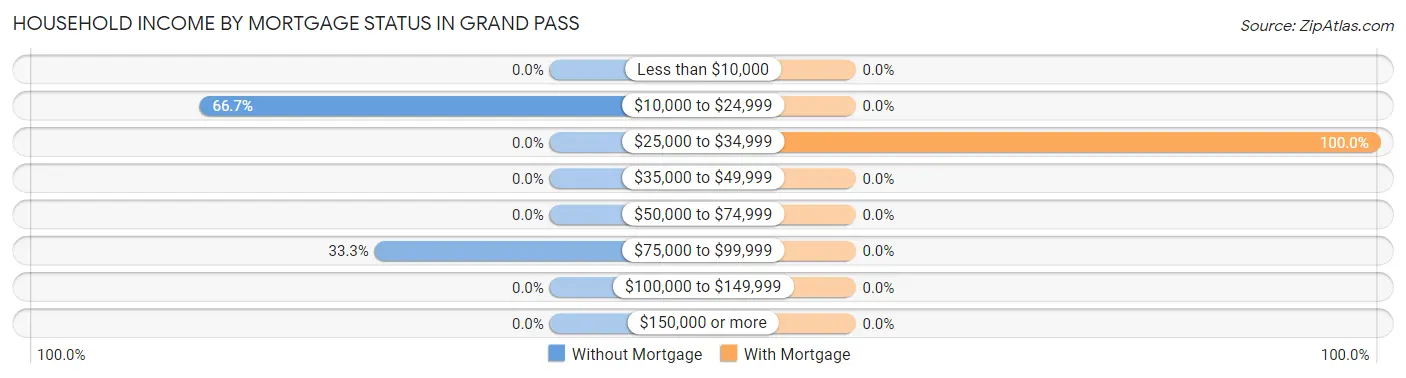
| Household Income | Without Mortgage | With Mortgage |
| Less than $10,000 | 0 (0.0%) | 0 (0.0%) |
| $10,000 to $24,999 | 4 (66.7%) | 0 (0.0%) |
| $25,000 to $34,999 | 0 (0.0%) | 1 (100.0%) |
| $35,000 to $49,999 | 0 (0.0%) | 0 (0.0%) |
| $50,000 to $74,999 | 0 (0.0%) | 0 (0.0%) |
| $75,000 to $99,999 | 2 (33.3%) | 0 (0.0%) |
| $100,000 to $149,999 | 0 (0.0%) | 0 (0.0%) |
| $150,000 or more | 0 (0.0%) | 0 (0.0%) |
| Total | 6 (100.0%) | 1 (100.0%) |
Property Value to Household Income Ratio in Grand Pass
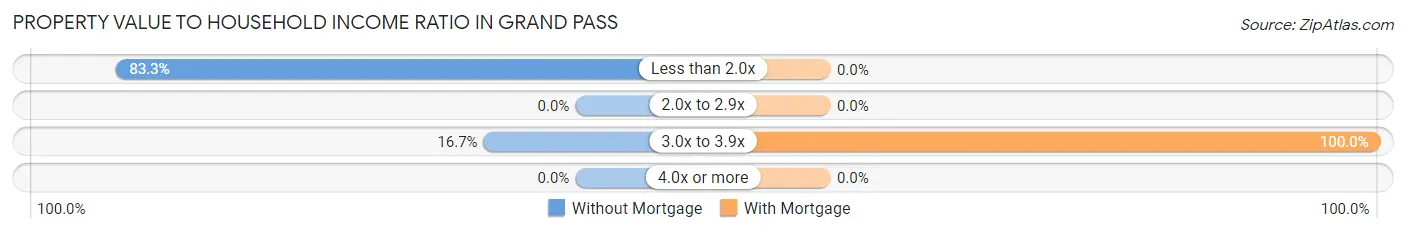
| Value-to-Income Ratio | Without Mortgage | With Mortgage |
| Less than 2.0x | 5 (83.3%) | 0 (0.0%) |
| 2.0x to 2.9x | 0 (0.0%) | 0 (0.0%) |
| 3.0x to 3.9x | 1 (16.7%) | 1 (100.0%) |
| 4.0x or more | 0 (0.0%) | 0 (0.0%) |
| Total | 6 (100.0%) | 1 (100.0%) |
Real Estate Taxes by Mortgage Status in Grand Pass
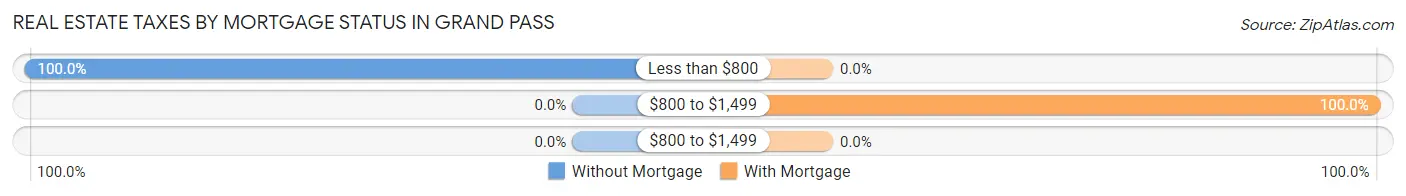
| Property Taxes | Without Mortgage | With Mortgage |
| Less than $800 | 6 (100.0%) | 0 (0.0%) |
| $800 to $1,499 | 0 (0.0%) | 1 (100.0%) |
| $800 to $1,499 | 0 (0.0%) | 0 (0.0%) |
| Total | 6 (100.0%) | 1 (100.0%) |
Health & Disability in Grand Pass
Health Insurance Coverage by Age in Grand Pass
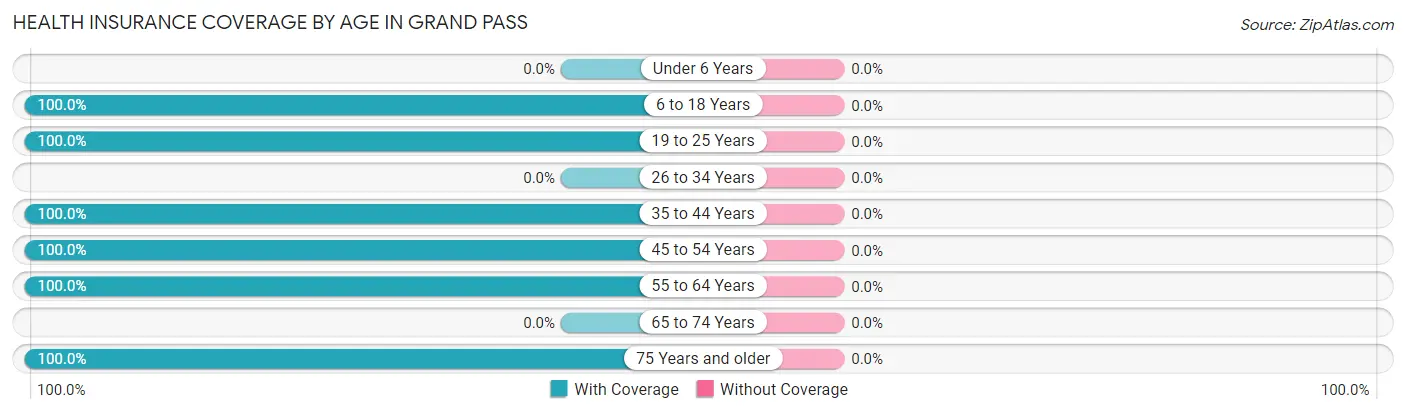
| Age Bracket | With Coverage | Without Coverage |
| Under 6 Years | 0 (0.0%) | 0 (0.0%) |
| 6 to 18 Years | 10 (100.0%) | 0 (0.0%) |
| 19 to 25 Years | 4 (100.0%) | 0 (0.0%) |
| 26 to 34 Years | 0 (0.0%) | 0 (0.0%) |
| 35 to 44 Years | 6 (100.0%) | 0 (0.0%) |
| 45 to 54 Years | 5 (100.0%) | 0 (0.0%) |
| 55 to 64 Years | 2 (100.0%) | 0 (0.0%) |
| 65 to 74 Years | 0 (0.0%) | 0 (0.0%) |
| 75 Years and older | 2 (100.0%) | 0 (0.0%) |
| Total | 29 (100.0%) | 0 (0.0%) |
Health Insurance Coverage by Citizenship Status in Grand Pass
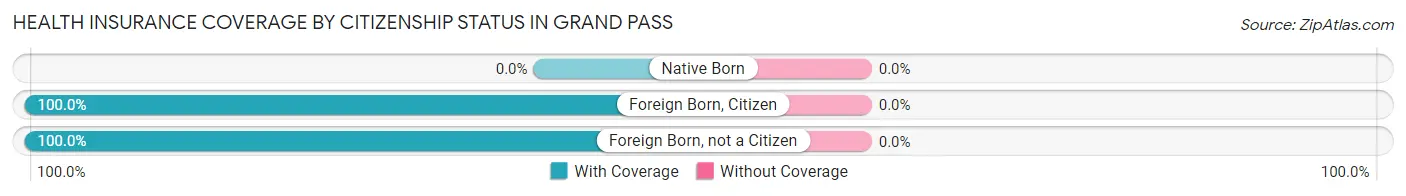
| Citizenship Status | With Coverage | Without Coverage |
| Native Born | 0 (0.0%) | 0 (0.0%) |
| Foreign Born, Citizen | 10 (100.0%) | 0 (0.0%) |
| Foreign Born, not a Citizen | 4 (100.0%) | 0 (0.0%) |
Health Insurance Coverage by Household Income in Grand Pass
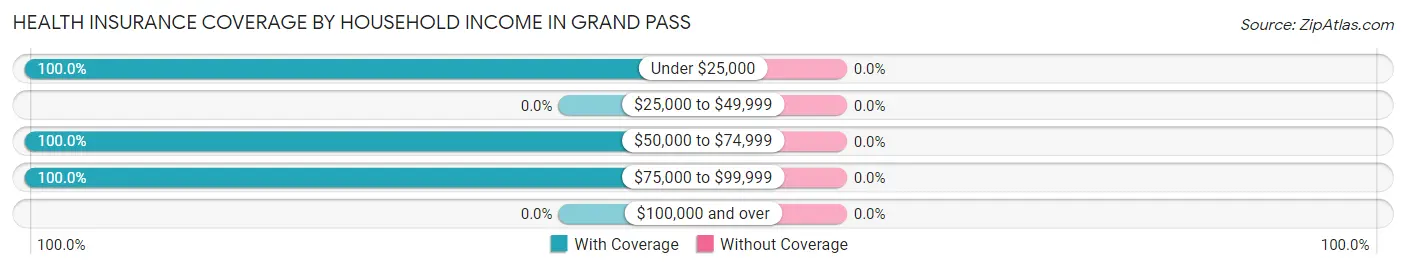
| Household Income | With Coverage | Without Coverage |
| Under $25,000 | 11 (100.0%) | 0 (0.0%) |
| $25,000 to $49,999 | 0 (0.0%) | 0 (0.0%) |
| $50,000 to $74,999 | 1 (100.0%) | 0 (0.0%) |
| $75,000 to $99,999 | 17 (100.0%) | 0 (0.0%) |
| $100,000 and over | 0 (0.0%) | 0 (0.0%) |
Public vs Private Health Insurance Coverage by Age in Grand Pass
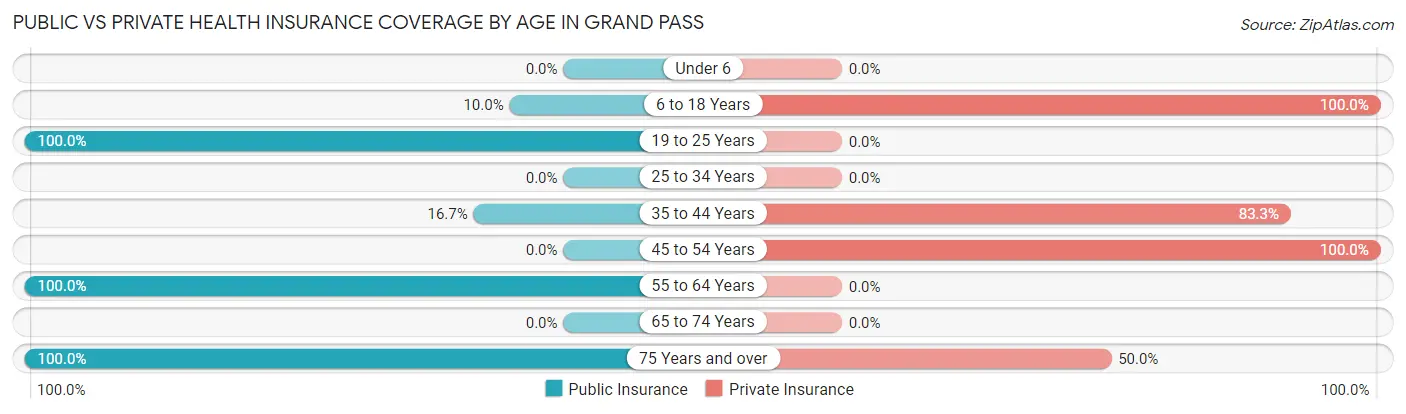
| Age Bracket | Public Insurance | Private Insurance |
| Under 6 | 0 (0.0%) | 0 (0.0%) |
| 6 to 18 Years | 1 (10.0%) | 10 (100.0%) |
| 19 to 25 Years | 4 (100.0%) | 0 (0.0%) |
| 25 to 34 Years | 0 (0.0%) | 0 (0.0%) |
| 35 to 44 Years | 1 (16.7%) | 5 (83.3%) |
| 45 to 54 Years | 0 (0.0%) | 5 (100.0%) |
| 55 to 64 Years | 2 (100.0%) | 0 (0.0%) |
| 65 to 74 Years | 0 (0.0%) | 0 (0.0%) |
| 75 Years and over | 2 (100.0%) | 1 (50.0%) |
| Total | 10 (34.5%) | 21 (72.4%) |
Disability Status by Sex by Age in Grand Pass
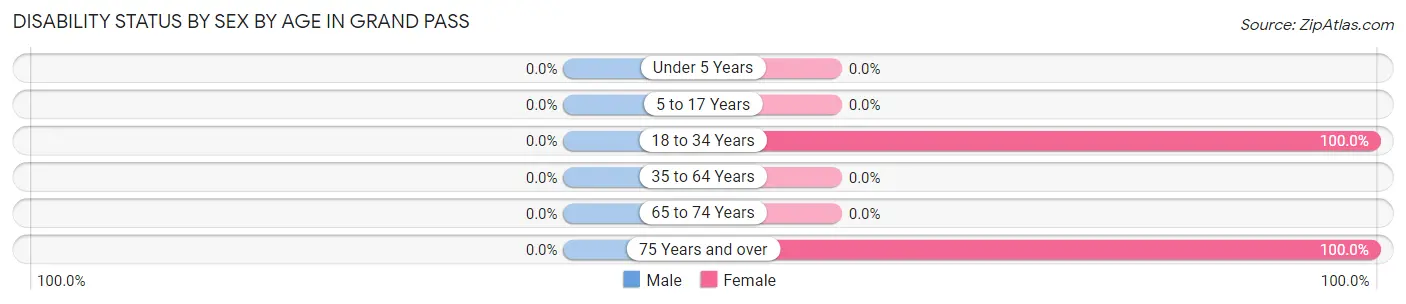
| Age Bracket | Male | Female |
| Under 5 Years | 0 (0.0%) | 0 (0.0%) |
| 5 to 17 Years | 0 (0.0%) | 0 (0.0%) |
| 18 to 34 Years | 0 (0.0%) | 4 (100.0%) |
| 35 to 64 Years | 0 (0.0%) | 0 (0.0%) |
| 65 to 74 Years | 0 (0.0%) | 0 (0.0%) |
| 75 Years and over | 0 (0.0%) | 2 (100.0%) |
Disability Class by Sex by Age in Grand Pass
Disability Class: Hearing Difficulty
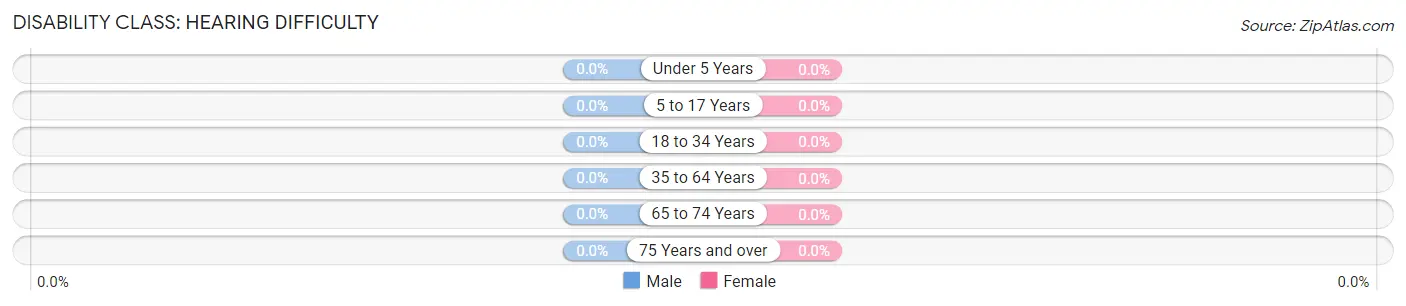
| Age Bracket | Male | Female |
| Under 5 Years | 0 (0.0%) | 0 (0.0%) |
| 5 to 17 Years | 0 (0.0%) | 0 (0.0%) |
| 18 to 34 Years | 0 (0.0%) | 0 (0.0%) |
| 35 to 64 Years | 0 (0.0%) | 0 (0.0%) |
| 65 to 74 Years | 0 (0.0%) | 0 (0.0%) |
| 75 Years and over | 0 (0.0%) | 0 (0.0%) |
Disability Class: Vision Difficulty
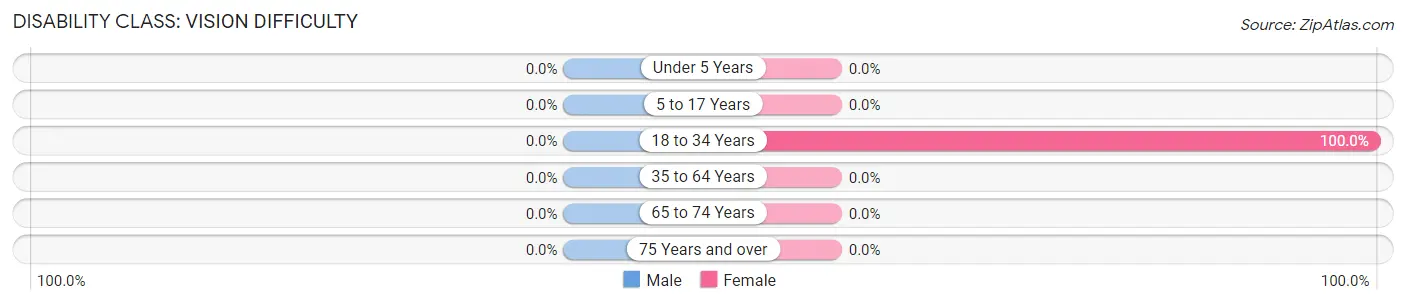
| Age Bracket | Male | Female |
| Under 5 Years | 0 (0.0%) | 0 (0.0%) |
| 5 to 17 Years | 0 (0.0%) | 0 (0.0%) |
| 18 to 34 Years | 0 (0.0%) | 4 (100.0%) |
| 35 to 64 Years | 0 (0.0%) | 0 (0.0%) |
| 65 to 74 Years | 0 (0.0%) | 0 (0.0%) |
| 75 Years and over | 0 (0.0%) | 0 (0.0%) |
Disability Class: Cognitive Difficulty
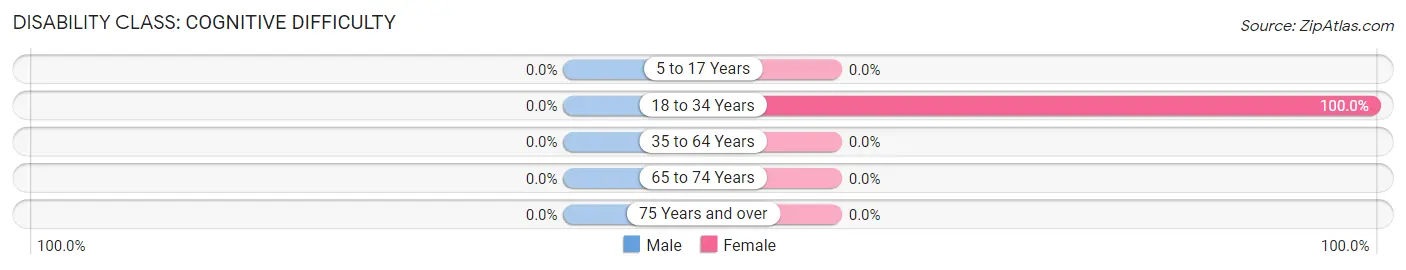
| Age Bracket | Male | Female |
| 5 to 17 Years | 0 (0.0%) | 0 (0.0%) |
| 18 to 34 Years | 0 (0.0%) | 4 (100.0%) |
| 35 to 64 Years | 0 (0.0%) | 0 (0.0%) |
| 65 to 74 Years | 0 (0.0%) | 0 (0.0%) |
| 75 Years and over | 0 (0.0%) | 0 (0.0%) |
Disability Class: Ambulatory Difficulty
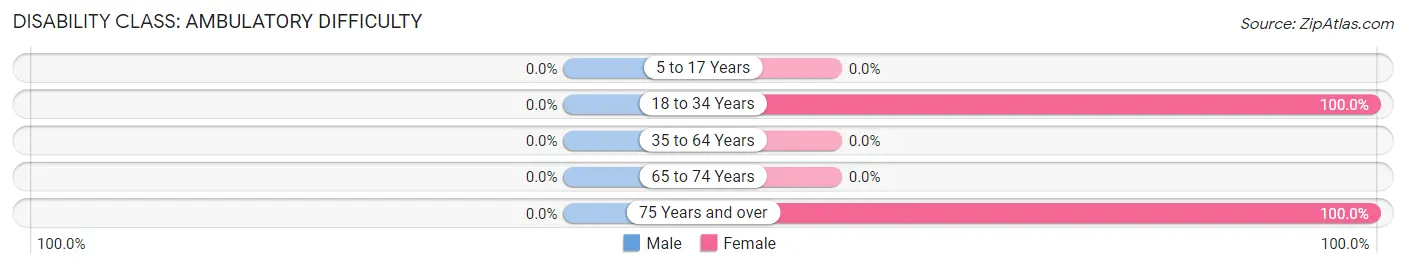
| Age Bracket | Male | Female |
| 5 to 17 Years | 0 (0.0%) | 0 (0.0%) |
| 18 to 34 Years | 0 (0.0%) | 4 (100.0%) |
| 35 to 64 Years | 0 (0.0%) | 0 (0.0%) |
| 65 to 74 Years | 0 (0.0%) | 0 (0.0%) |
| 75 Years and over | 0 (0.0%) | 2 (100.0%) |
Disability Class: Self-Care Difficulty
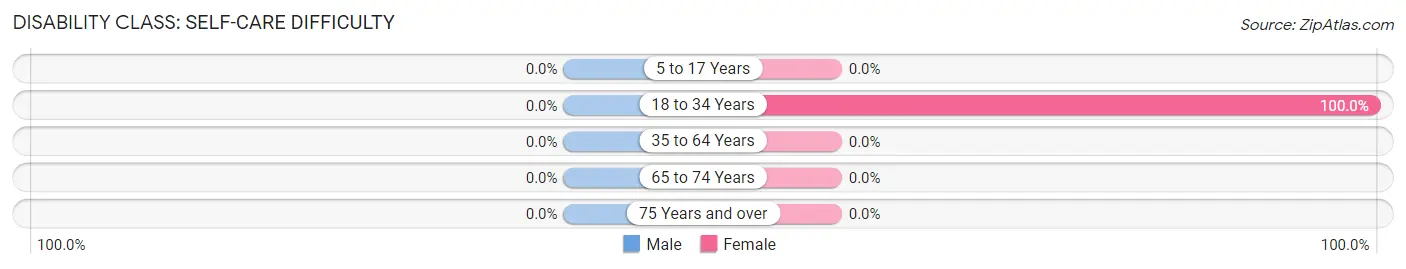
| Age Bracket | Male | Female |
| 5 to 17 Years | 0 (0.0%) | 0 (0.0%) |
| 18 to 34 Years | 0 (0.0%) | 4 (100.0%) |
| 35 to 64 Years | 0 (0.0%) | 0 (0.0%) |
| 65 to 74 Years | 0 (0.0%) | 0 (0.0%) |
| 75 Years and over | 0 (0.0%) | 0 (0.0%) |
Technology Access in Grand Pass
Computing Device Access in Grand Pass
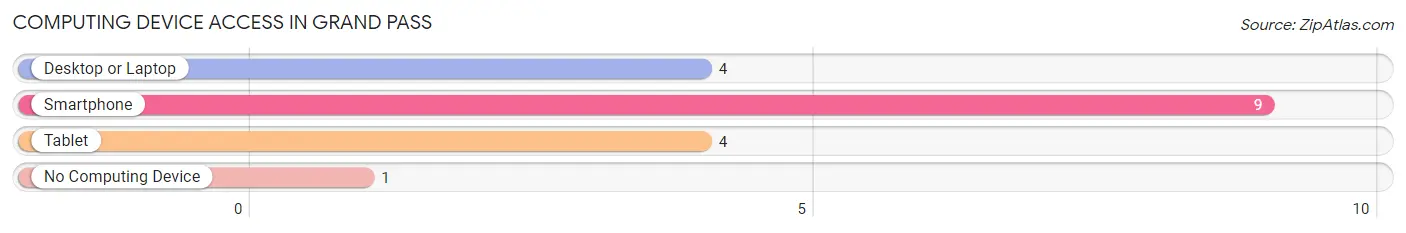
| Device Type | # Households | % Households |
| Desktop or Laptop | 4 | 40.0% |
| Smartphone | 9 | 90.0% |
| Tablet | 4 | 40.0% |
| No Computing Device | 1 | 10.0% |
| Total | 10 | 100.0% |
Internet Access in Grand Pass
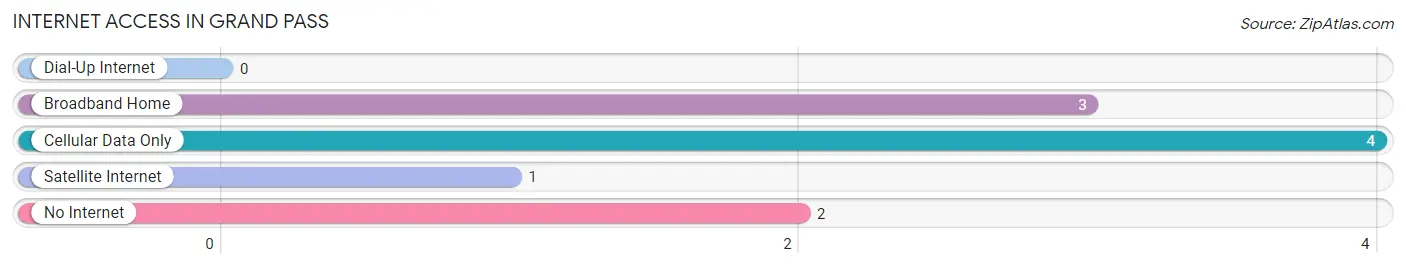
| Internet Type | # Households | % Households |
| Dial-Up Internet | 0 | 0.0% |
| Broadband Home | 3 | 30.0% |
| Cellular Data Only | 4 | 40.0% |
| Satellite Internet | 1 | 10.0% |
| No Internet | 2 | 20.0% |
| Total | 10 | 100.0% |
Grand Pass Summary
History
Grand Pass is a small town located in Saline County, Missouri. It is situated on the banks of the Grand River, and is home to a population of just over 200 people. The town was founded in 1837 by a group of settlers from Kentucky, and was originally known as Grand Pass Landing. The name was changed to Grand Pass in 1845, and the town was incorporated in 1871.
Grand Pass has a rich history, and has been home to many notable figures throughout its existence. The town was the birthplace of the famous outlaw Jesse James, who was born in 1847. James and his brother Frank were members of the James-Younger gang, and were responsible for a number of robberies and other criminal activities in the area.
The town was also home to the Grand Pass Academy, which was founded in 1854. The school was a private institution that offered a variety of educational opportunities to students from the surrounding area. The school closed in 1877, but the building still stands today and is listed on the National Register of Historic Places.
Geography
Grand Pass is located in the northern part of Saline County, Missouri. It is situated on the banks of the Grand River, and is surrounded by rolling hills and farmland. The town is located approximately 25 miles south of the city of Marshall, and is about an hour and a half drive from the state capital of Jefferson City.
The climate in Grand Pass is typical of the Midwest, with hot summers and cold winters. The average temperature in the summer months is around 80 degrees Fahrenheit, while the average temperature in the winter months is around 30 degrees Fahrenheit. The town receives an average of 40 inches of precipitation each year, with most of it falling in the spring and summer months.
Economy
The economy of Grand Pass is largely based on agriculture. The town is home to several farms, which produce a variety of crops such as corn, soybeans, and wheat. The town also has a few small businesses, including a grocery store, a hardware store, and a few restaurants.
The town is also home to a number of manufacturing companies, which produce a variety of products such as furniture, clothing, and automotive parts. The town is also home to a number of small businesses, such as a gas station, a barber shop, and a few other retail stores.
Demographics
As of the 2010 census, the population of Grand Pass was 203 people. The racial makeup of the town was 97.5% White, 0.5% African American, 0.5% Native American, 0.5% Asian, and 1% from other races. The median household income in the town was $37,500, and the median age was 44 years.
The town is served by the Grand Pass School District, which consists of one elementary school and one high school. The town is also home to a number of churches, including the Grand Pass United Methodist Church, the Grand Pass Baptist Church, and the Grand Pass Presbyterian Church.
Conclusion
Grand Pass is a small town located in Saline County, Missouri. It is situated on the banks of the Grand River, and is home to a population of just over 200 people. The town has a rich history, and has been home to many notable figures throughout its existence. The economy of Grand Pass is largely based on agriculture, and the town is also home to a number of manufacturing companies and small businesses. The town is served by the Grand Pass School District, and is home to a number of churches.
Common Questions
What is Per Capita Income in Grand Pass?
Per Capita income in Grand Pass is $16,138.
What is the Median Family Income in Grand Pass?
Median Family Income in Grand Pass is $76,875.
What is Inequality or Gini Index in Grand Pass?
Inequality or Gini Index in Grand Pass is 0.39.
What is the Total Population of Grand Pass?
Total Population of Grand Pass is 29.
What is the Total Male Population of Grand Pass?
Total Male Population of Grand Pass is 7.
What is the Total Female Population of Grand Pass?
Total Female Population of Grand Pass is 22.
What is the Ratio of Males per 100 Females in Grand Pass?
There are 31.82 Males per 100 Females in Grand Pass.
What is the Ratio of Females per 100 Males in Grand Pass?
There are 314.29 Females per 100 Males in Grand Pass.
What is the Median Population Age in Grand Pass?
Median Population Age in Grand Pass is 35.3 Years.
What is the Average Family Size in Grand Pass
Average Family Size in Grand Pass is 4.8 People.
What is the Average Household Size in Grand Pass
Average Household Size in Grand Pass is 2.9 People.
How Large is the Labor Force in Grand Pass?
There are 8 People in the Labor Forcein in Grand Pass.
What is the Percentage of People in the Labor Force in Grand Pass?
40.0% of People are in the Labor Force in Grand Pass.
What is the Unemployment Rate in Grand Pass?
Unemployment Rate in Grand Pass is 25.0%.