Dover, MO Map & Demographics
Dover Map
Dover Overview
$26,913
PER CAPITA INCOME
$50,833
AVG HOUSEHOLD INCOME
0.40
INEQUALITY / GINI INDEX
126
TOTAL POPULATION
48
MALE POPULATION
78
FEMALE POPULATION
61.54
MALES / 100 FEMALES
162.50
FEMALES / 100 MALES
33.8
MEDIAN AGE
4.2
AVG FAMILY SIZE
3.0
AVG HOUSEHOLD SIZE
37
LABOR FORCE [ PEOPLE ]
46.8%
PERCENT IN LABOR FORCE
2.7%
UNEMPLOYMENT RATE
Dover Zip Codes
Income in Dover
Income Overview in Dover
| Characteristic | Number | Measure |
| Per Capita Income | 126 | $26,913 |
| Median Family Income | 25 | $0 |
| Mean Family Income | 25 | $90,792 |
| Median Household Income | 42 | $50,833 |
| Mean Household Income | 42 | $67,714 |
| Income Deficit | 25 | $0 |
| Wage / Income Gap (%) | 126 | 0.00% |
| Wage / Income Gap ($) | 126 | 100.00¢ per $1 |
| Gini / Inequality Index | 126 | 0.40 |
Earnings by Sex in Dover
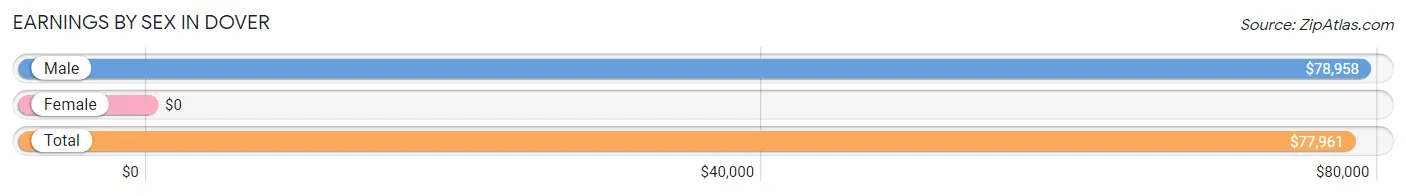
| Sex | Number | Average Earnings |
| Male | 15 (36.6%) | $78,958 |
| Female | 26 (63.4%) | $0 |
| Total | 41 (100.0%) | $77,961 |
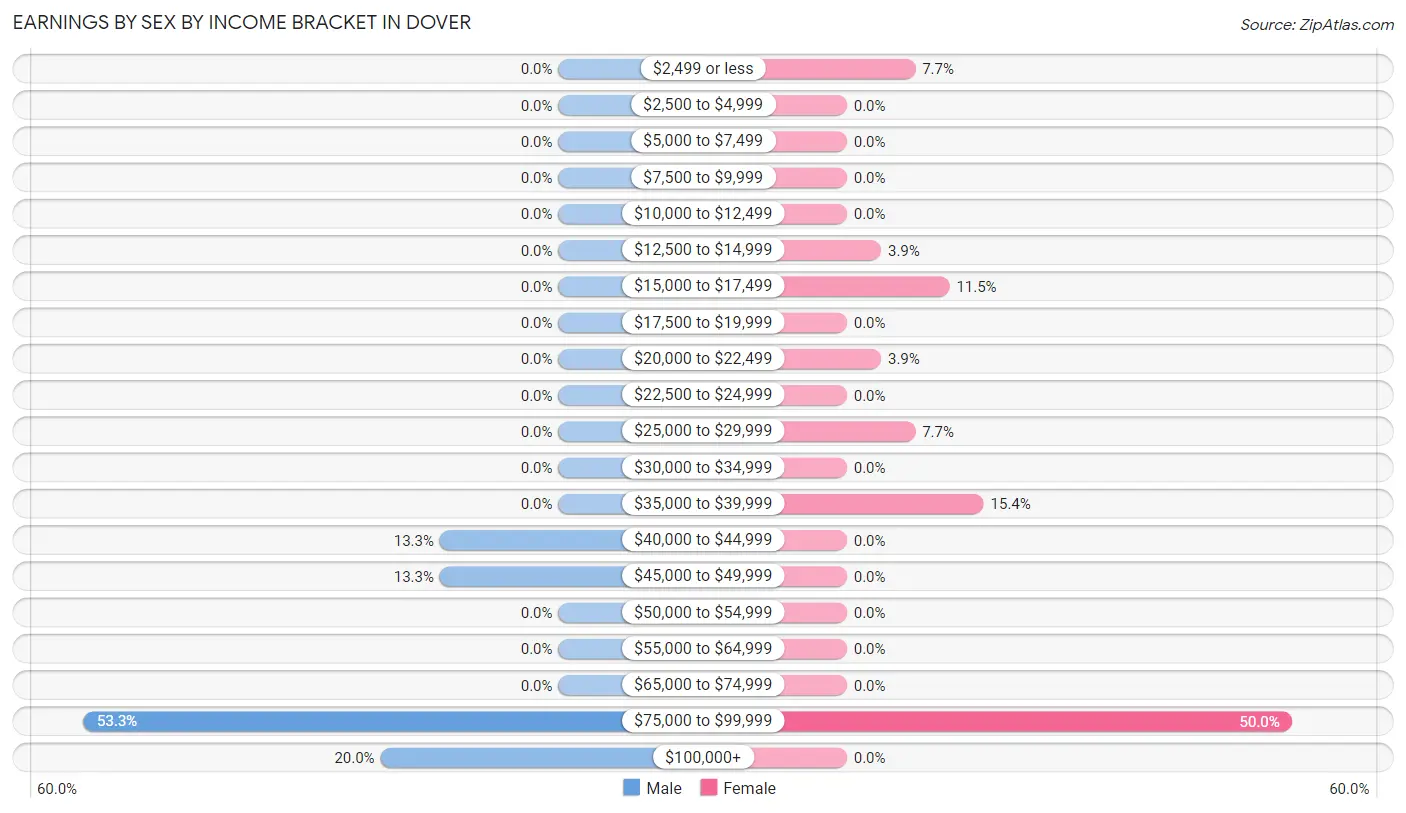
Earnings by Sex by Income Bracket in Dover
The most common earnings brackets in Dover are $75,000 to $99,999 for men (8 | 53.3%) and $75,000 to $99,999 for women (13 | 50.0%).
| Income | Male | Female |
| $2,499 or less | 0 (0.0%) | 2 (7.7%) |
| $2,500 to $4,999 | 0 (0.0%) | 0 (0.0%) |
| $5,000 to $7,499 | 0 (0.0%) | 0 (0.0%) |
| $7,500 to $9,999 | 0 (0.0%) | 0 (0.0%) |
| $10,000 to $12,499 | 0 (0.0%) | 0 (0.0%) |
| $12,500 to $14,999 | 0 (0.0%) | 1 (3.8%) |
| $15,000 to $17,499 | 0 (0.0%) | 3 (11.5%) |
| $17,500 to $19,999 | 0 (0.0%) | 0 (0.0%) |
| $20,000 to $22,499 | 0 (0.0%) | 1 (3.8%) |
| $22,500 to $24,999 | 0 (0.0%) | 0 (0.0%) |
| $25,000 to $29,999 | 0 (0.0%) | 2 (7.7%) |
| $30,000 to $34,999 | 0 (0.0%) | 0 (0.0%) |
| $35,000 to $39,999 | 0 (0.0%) | 4 (15.4%) |
| $40,000 to $44,999 | 2 (13.3%) | 0 (0.0%) |
| $45,000 to $49,999 | 2 (13.3%) | 0 (0.0%) |
| $50,000 to $54,999 | 0 (0.0%) | 0 (0.0%) |
| $55,000 to $64,999 | 0 (0.0%) | 0 (0.0%) |
| $65,000 to $74,999 | 0 (0.0%) | 0 (0.0%) |
| $75,000 to $99,999 | 8 (53.3%) | 13 (50.0%) |
| $100,000+ | 3 (20.0%) | 0 (0.0%) |
| Total | 15 (100.0%) | 26 (100.0%) |
Earnings by Sex by Educational Attainment in Dover
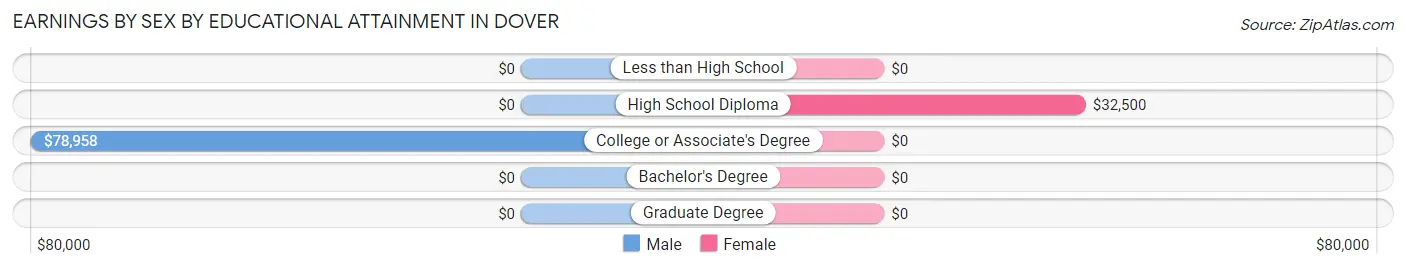
| Educational Attainment | Male Income | Female Income |
| Less than High School | - | - |
| High School Diploma | - | - |
| College or Associate's Degree | $78,958 | $0 |
| Bachelor's Degree | - | - |
| Graduate Degree | - | - |
| Total | $78,958 | $0 |
Family Income in Dover
Family Income Brackets in Dover
According to the Dover family income data, there are 8 families falling into the $150,000 to $199,999 income range, which is the most common income bracket and makes up 32.0% of all families.
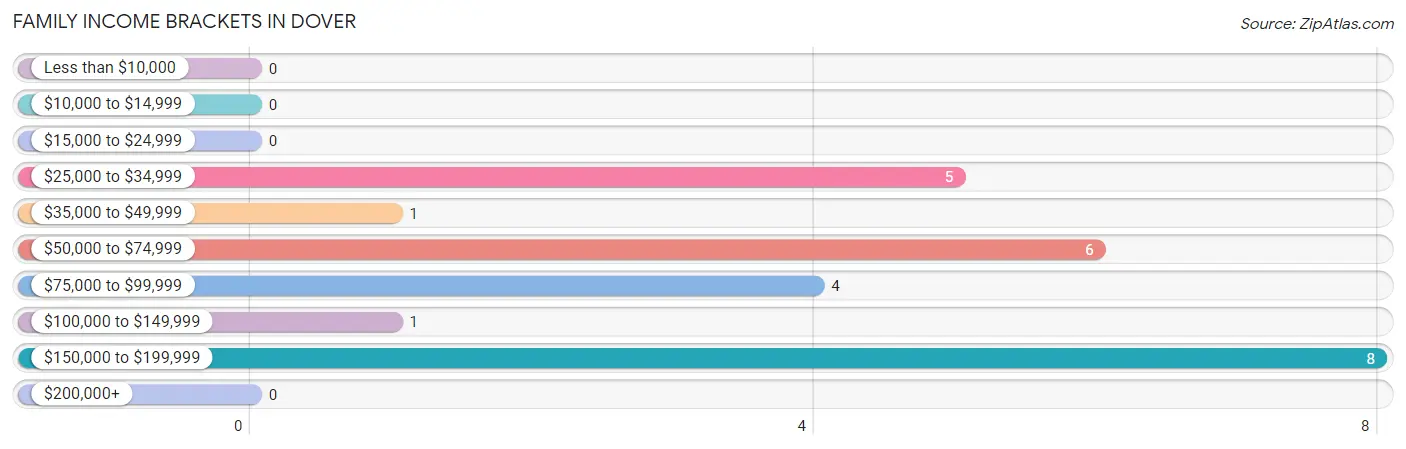
| Income Bracket | # Families | % Families |
| Less than $10,000 | 0 | 0.0% |
| $10,000 to $14,999 | 0 | 0.0% |
| $15,000 to $24,999 | 0 | 0.0% |
| $25,000 to $34,999 | 5 | 20.0% |
| $35,000 to $49,999 | 1 | 4.0% |
| $50,000 to $74,999 | 6 | 24.0% |
| $75,000 to $99,999 | 4 | 16.0% |
| $100,000 to $149,999 | 1 | 4.0% |
| $150,000 to $199,999 | 8 | 32.0% |
| $200,000+ | 0 | 0.0% |
Family Income by Famaliy Size in Dover
2-person families (16 | 64.0%) account for the highest median family income in Dover with $53,750 per family, while 2-person families (16 | 64.0%) have the highest median income of $26,875 per family member.
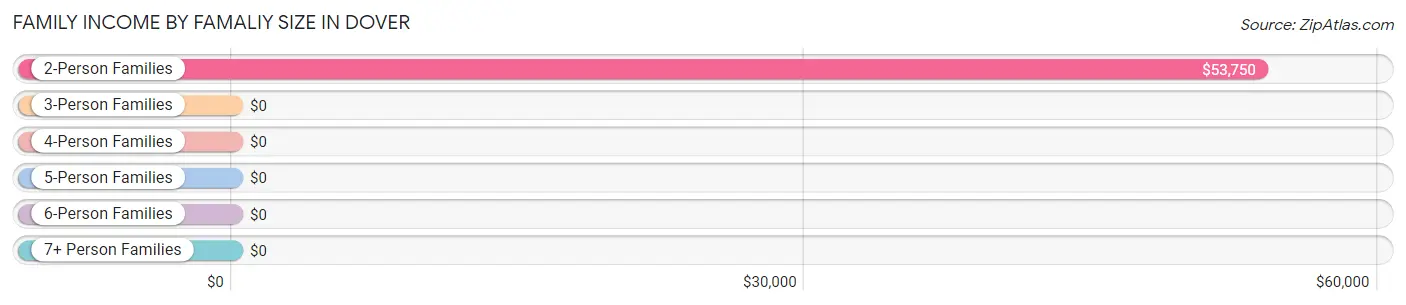
| Income Bracket | # Families | Median Income |
| 2-Person Families | 16 (64.0%) | $53,750 |
| 3-Person Families | 1 (4.0%) | $0 |
| 4-Person Families | 6 (24.0%) | $0 |
| 5-Person Families | 0 (0.0%) | $0 |
| 6-Person Families | 2 (8.0%) | $0 |
| 7+ Person Families | 0 (0.0%) | $0 |
| Total | 25 (100.0%) | $0 |
Family Income by Number of Earners in Dover
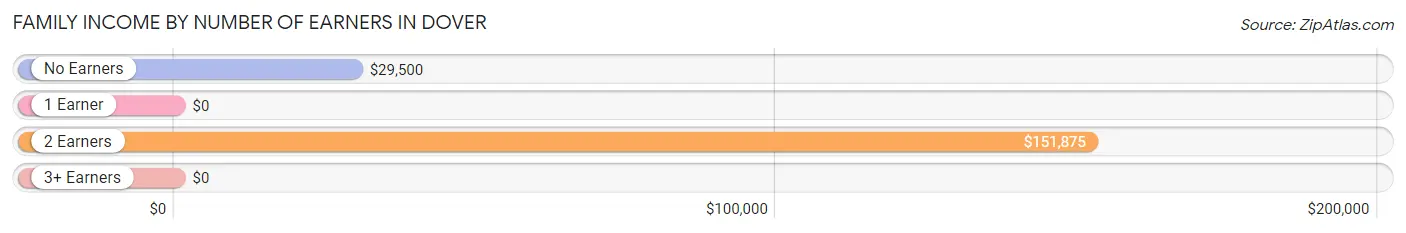
| Number of Earners | # Families | Median Income |
| No Earners | 8 (32.0%) | $29,500 |
| 1 Earner | 4 (16.0%) | $0 |
| 2 Earners | 13 (52.0%) | $151,875 |
| 3+ Earners | 0 (0.0%) | $0 |
| Total | 25 (100.0%) | $0 |
Household Income in Dover
Household Income Brackets in Dover
With 11 households falling in the category, the $25,000 to $34,999 income range is the most frequent in Dover, accounting for 26.2% of all households.
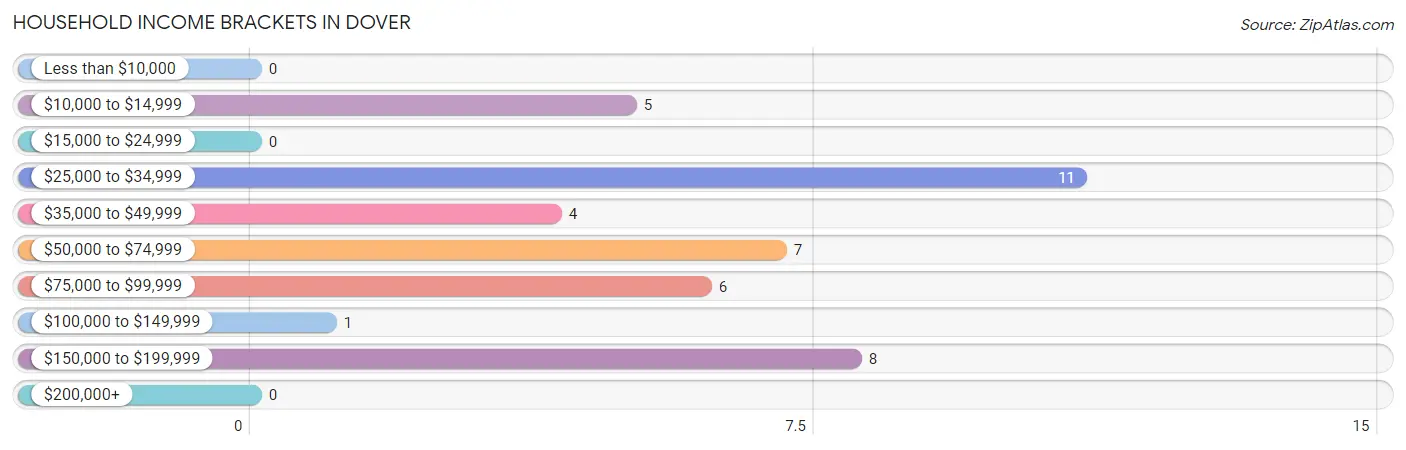
| Income Bracket | # Households | % Households |
| Less than $10,000 | 0 | 0.0% |
| $10,000 to $14,999 | 5 | 11.9% |
| $15,000 to $24,999 | 0 | 0.0% |
| $25,000 to $34,999 | 11 | 26.2% |
| $35,000 to $49,999 | 4 | 9.5% |
| $50,000 to $74,999 | 7 | 16.7% |
| $75,000 to $99,999 | 6 | 14.3% |
| $100,000 to $149,999 | 1 | 2.4% |
| $150,000 to $199,999 | 8 | 19.0% |
| $200,000+ | 0 | 0.0% |
Household Income by Householder Age in Dover
The median household income in Dover is $50,833, with the highest median household income of $158,125 found in the 25 to 44 years age bracket for the primary householder. A total of 9 households (21.4%) fall into this category.
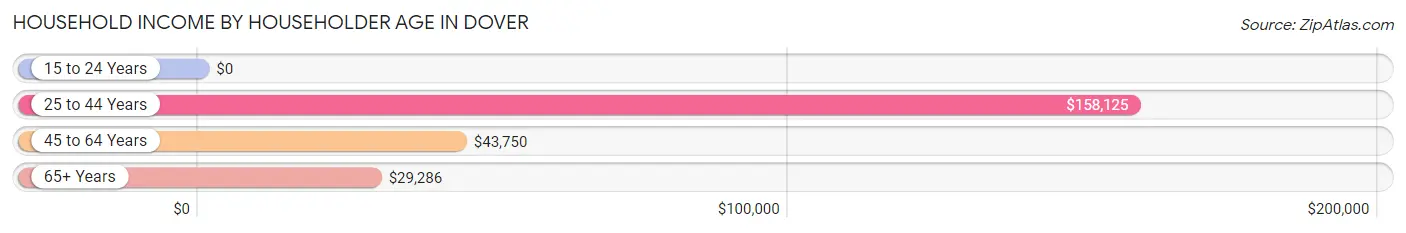
| Income Bracket | # Households | Median Income |
| 15 to 24 Years | 0 (0.0%) | $0 |
| 25 to 44 Years | 9 (21.4%) | $158,125 |
| 45 to 64 Years | 19 (45.2%) | $43,750 |
| 65+ Years | 14 (33.3%) | $29,286 |
| Total | 42 (100.0%) | $50,833 |
Poverty in Dover
Income Below Poverty by Sex and Age in Dover
With 8.3% poverty level for males and 6.4% for females among the residents of Dover, 25 to 34 year old males and 55 to 64 year old females are the most vulnerable to poverty, with 2 males (50.0%) and 5 females (45.5%) in their respective age groups living below the poverty level.
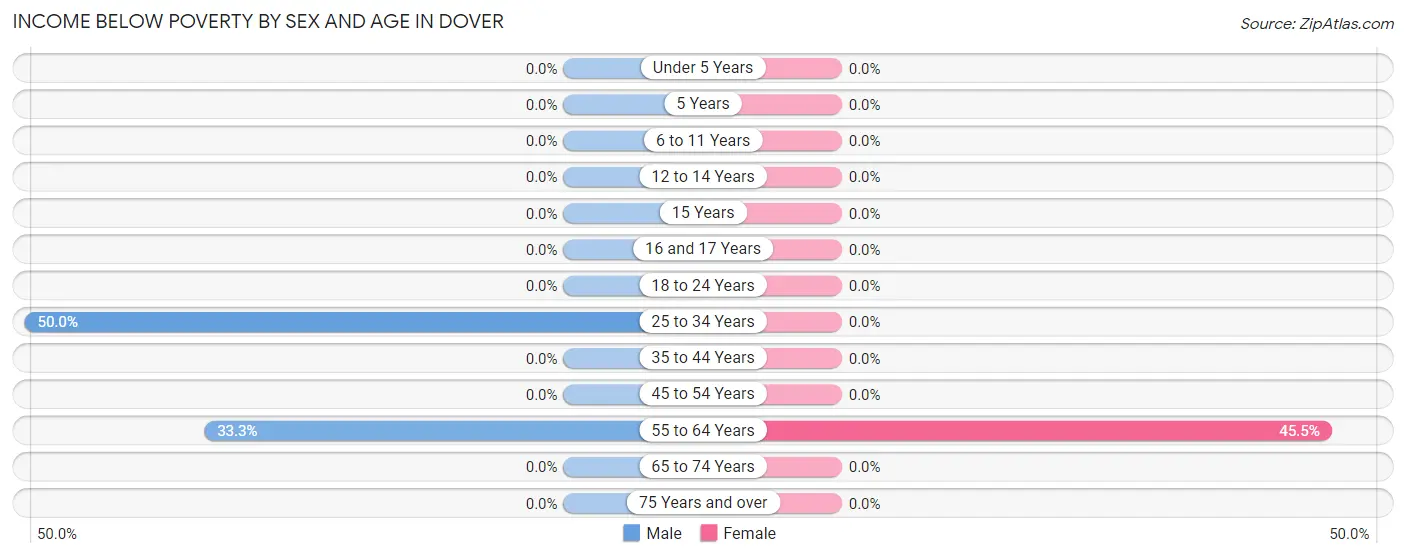
| Age Bracket | Male | Female |
| Under 5 Years | 0 (0.0%) | 0 (0.0%) |
| 5 Years | 0 (0.0%) | 0 (0.0%) |
| 6 to 11 Years | 0 (0.0%) | 0 (0.0%) |
| 12 to 14 Years | 0 (0.0%) | 0 (0.0%) |
| 15 Years | 0 (0.0%) | 0 (0.0%) |
| 16 and 17 Years | 0 (0.0%) | 0 (0.0%) |
| 18 to 24 Years | 0 (0.0%) | 0 (0.0%) |
| 25 to 34 Years | 2 (50.0%) | 0 (0.0%) |
| 35 to 44 Years | 0 (0.0%) | 0 (0.0%) |
| 45 to 54 Years | 0 (0.0%) | 0 (0.0%) |
| 55 to 64 Years | 2 (33.3%) | 5 (45.5%) |
| 65 to 74 Years | 0 (0.0%) | 0 (0.0%) |
| 75 Years and over | 0 (0.0%) | 0 (0.0%) |
| Total | 4 (8.3%) | 5 (6.4%) |
Income Above Poverty by Sex and Age in Dover
According to the poverty statistics in Dover, males aged under 5 years and females aged 6 to 11 years are the age groups that are most secure financially, with 100.0% of males and 100.0% of females in these age groups living above the poverty line.
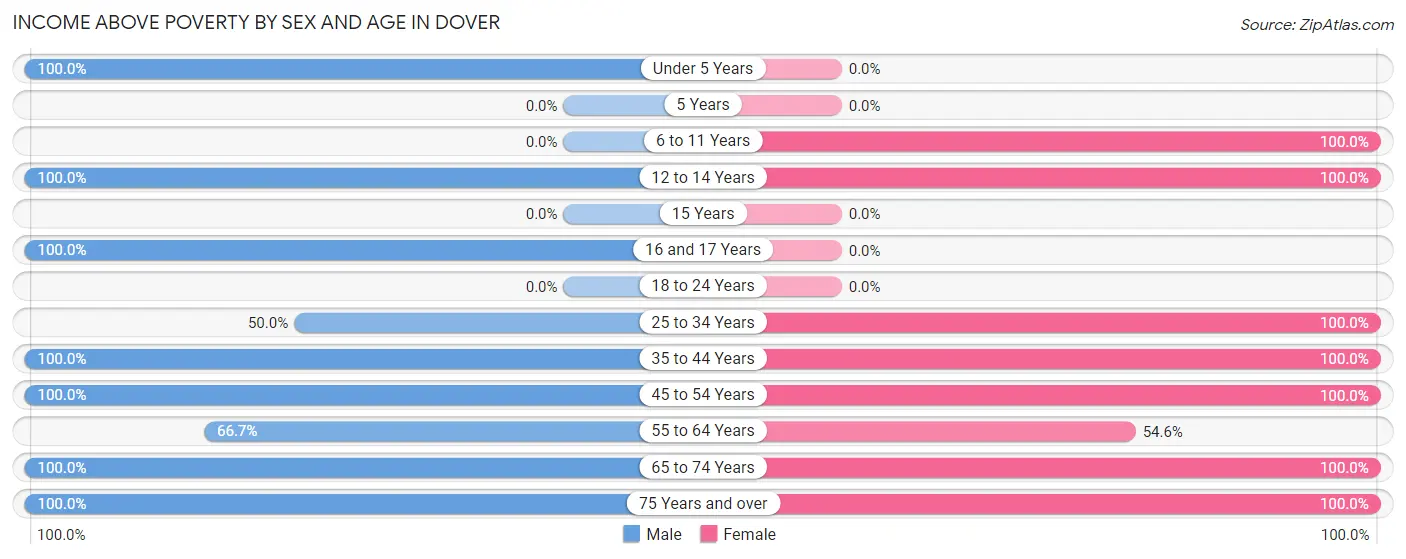
| Age Bracket | Male | Female |
| Under 5 Years | 12 (100.0%) | 0 (0.0%) |
| 5 Years | 0 (0.0%) | 0 (0.0%) |
| 6 to 11 Years | 0 (0.0%) | 4 (100.0%) |
| 12 to 14 Years | 2 (100.0%) | 29 (100.0%) |
| 15 Years | 0 (0.0%) | 0 (0.0%) |
| 16 and 17 Years | 1 (100.0%) | 0 (0.0%) |
| 18 to 24 Years | 0 (0.0%) | 0 (0.0%) |
| 25 to 34 Years | 2 (50.0%) | 14 (100.0%) |
| 35 to 44 Years | 8 (100.0%) | 2 (100.0%) |
| 45 to 54 Years | 3 (100.0%) | 6 (100.0%) |
| 55 to 64 Years | 4 (66.7%) | 6 (54.5%) |
| 65 to 74 Years | 2 (100.0%) | 7 (100.0%) |
| 75 Years and over | 10 (100.0%) | 5 (100.0%) |
| Total | 44 (91.7%) | 73 (93.6%) |
Income Below Poverty Among Married-Couple Families in Dover
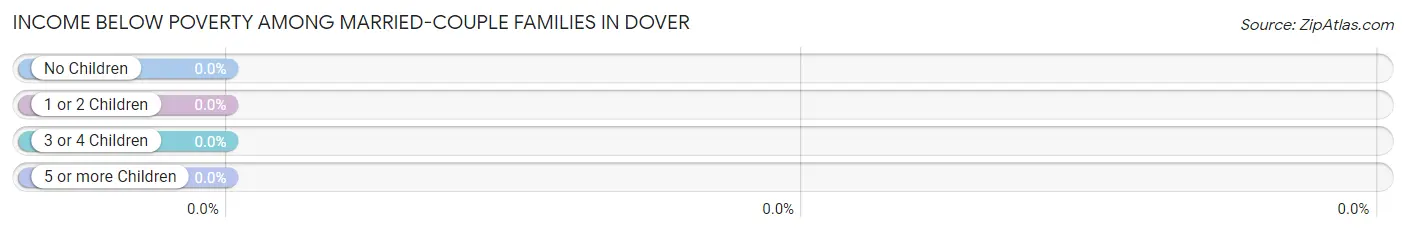
| Children | Above Poverty | Below Poverty |
| No Children | 16 (100.0%) | 0 (0.0%) |
| 1 or 2 Children | 7 (100.0%) | 0 (0.0%) |
| 3 or 4 Children | 2 (100.0%) | 0 (0.0%) |
| 5 or more Children | 0 (0.0%) | 0 (0.0%) |
| Total | 25 (100.0%) | 0 (0.0%) |
Income Below Poverty Among Single-Parent Households in Dover
| Children | Single Father | Single Mother |
| No Children | 0 (0.0%) | 0 (0.0%) |
| 1 or 2 Children | 0 (0.0%) | 0 (0.0%) |
| 3 or 4 Children | 0 (0.0%) | 0 (0.0%) |
| 5 or more Children | 0 (0.0%) | 0 (0.0%) |
| Total | 0 (0.0%) | 0 (0.0%) |
Income Below Poverty Among Married-Couple vs Single-Parent Households in Dover
| Children | Married-Couple Families | Single-Parent Households |
| No Children | 0 (0.0%) | 0 (0.0%) |
| 1 or 2 Children | 0 (0.0%) | 0 (0.0%) |
| 3 or 4 Children | 0 (0.0%) | 0 (0.0%) |
| 5 or more Children | 0 (0.0%) | 0 (0.0%) |
| Total | 0 (0.0%) | 0 (0.0%) |
Race in Dover
The most populous races in Dover are , and White / Caucasian (126 | 100.0%).
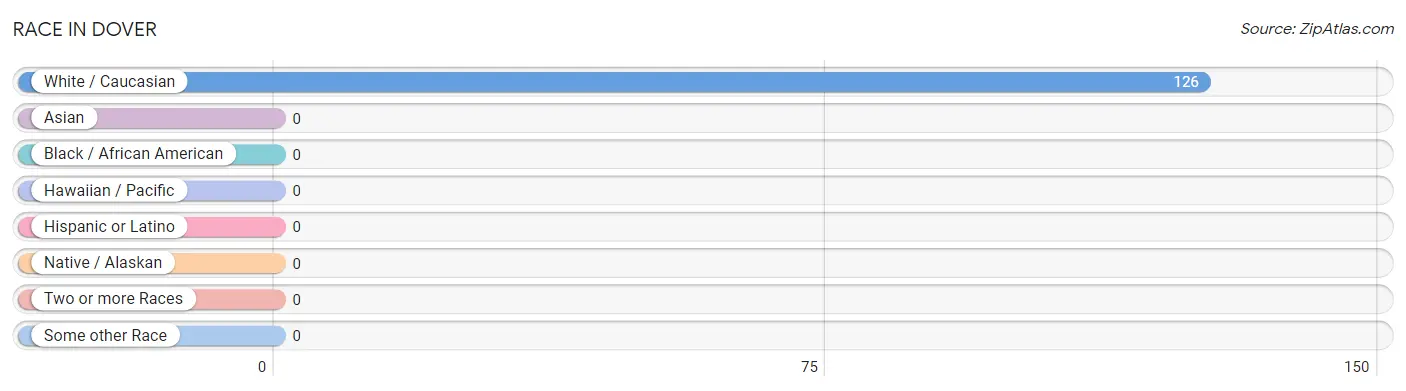
| Race | # Population | % Population |
| Asian | 0 | 0.0% |
| Black / African American | 0 | 0.0% |
| Hawaiian / Pacific | 0 | 0.0% |
| Hispanic or Latino | 0 | 0.0% |
| Native / Alaskan | 0 | 0.0% |
| White / Caucasian | 126 | 100.0% |
| Two or more Races | 0 | 0.0% |
| Some other Race | 0 | 0.0% |
| Total | 126 | 100.0% |
Ancestry in Dover
The most populous ancestries reported in Dover are German (21 | 16.7%), Irish (15 | 11.9%), European (11 | 8.7%), American (10 | 7.9%), and English (5 | 4.0%), together accounting for 49.2% of all Dover residents.
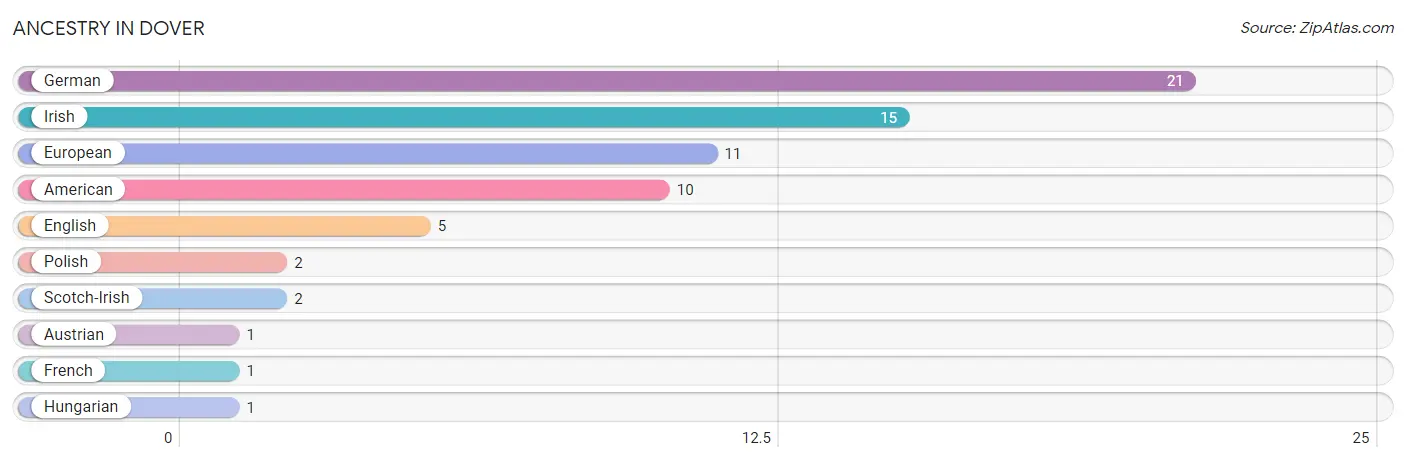
| Ancestry | # Population | % Population |
| American | 10 | 7.9% |
| Austrian | 1 | 0.8% |
| English | 5 | 4.0% |
| European | 11 | 8.7% |
| French | 1 | 0.8% |
| German | 21 | 16.7% |
| Hungarian | 1 | 0.8% |
| Irish | 15 | 11.9% |
| Polish | 2 | 1.6% |
| Scotch-Irish | 2 | 1.6% | View All 10 Rows |
Immigrants in Dover

| Immigration Origin | # Population | % Population | View All 0 Rows |
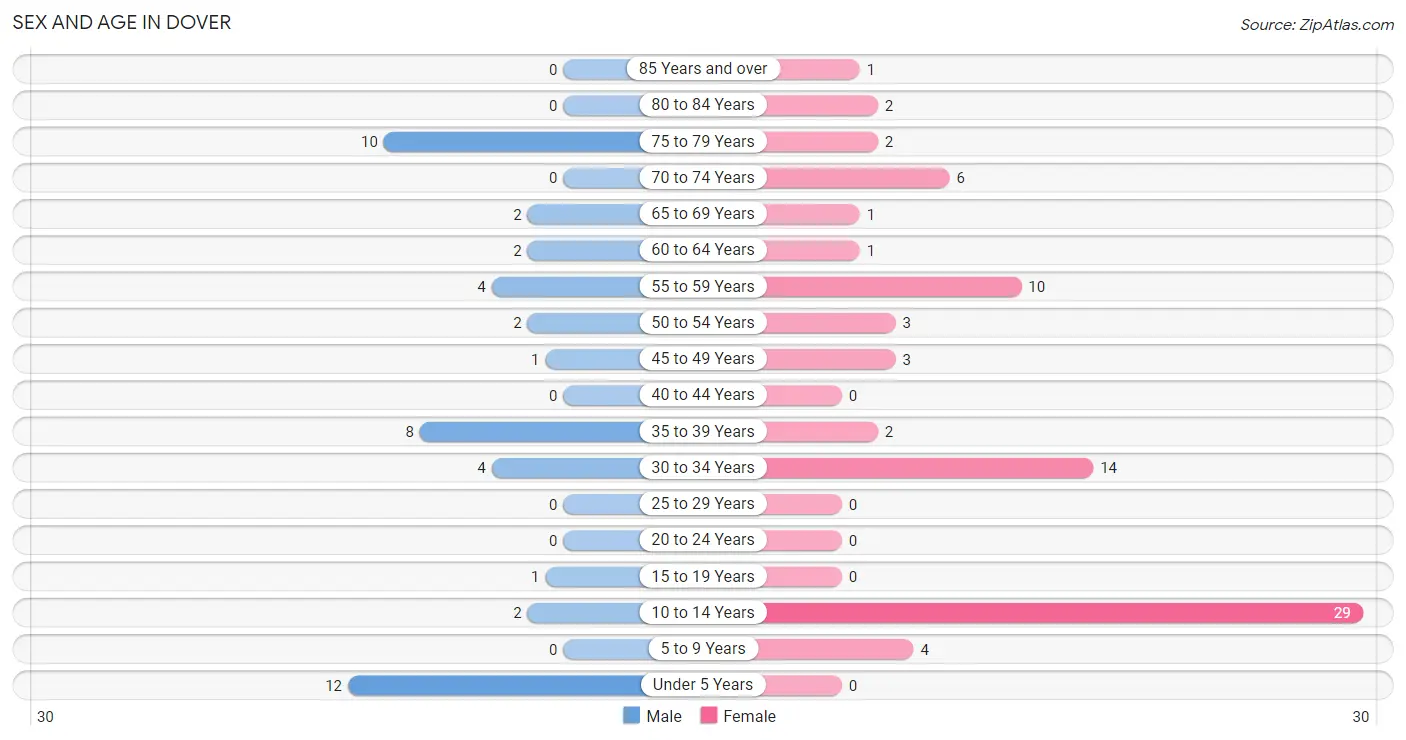
Sex and Age in Dover
Sex and Age in Dover
The most populous age groups in Dover are Under 5 Years (12 | 25.0%) for men and 10 to 14 Years (29 | 37.2%) for women.
| Age Bracket | Male | Female |
| Under 5 Years | 12 (25.0%) | 0 (0.0%) |
| 5 to 9 Years | 0 (0.0%) | 4 (5.1%) |
| 10 to 14 Years | 2 (4.2%) | 29 (37.2%) |
| 15 to 19 Years | 1 (2.1%) | 0 (0.0%) |
| 20 to 24 Years | 0 (0.0%) | 0 (0.0%) |
| 25 to 29 Years | 0 (0.0%) | 0 (0.0%) |
| 30 to 34 Years | 4 (8.3%) | 14 (17.9%) |
| 35 to 39 Years | 8 (16.7%) | 2 (2.6%) |
| 40 to 44 Years | 0 (0.0%) | 0 (0.0%) |
| 45 to 49 Years | 1 (2.1%) | 3 (3.8%) |
| 50 to 54 Years | 2 (4.2%) | 3 (3.8%) |
| 55 to 59 Years | 4 (8.3%) | 10 (12.8%) |
| 60 to 64 Years | 2 (4.2%) | 1 (1.3%) |
| 65 to 69 Years | 2 (4.2%) | 1 (1.3%) |
| 70 to 74 Years | 0 (0.0%) | 6 (7.7%) |
| 75 to 79 Years | 10 (20.8%) | 2 (2.6%) |
| 80 to 84 Years | 0 (0.0%) | 2 (2.6%) |
| 85 Years and over | 0 (0.0%) | 1 (1.3%) |
| Total | 48 (100.0%) | 78 (100.0%) |
Families and Households in Dover
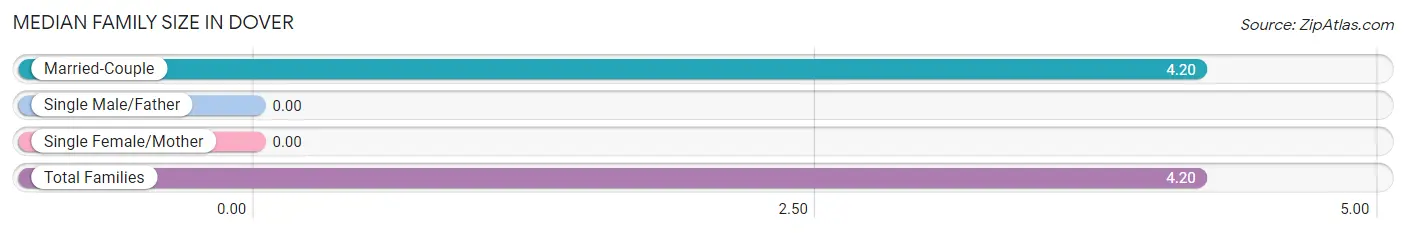
Median Family Size in Dover
| Family Type | # Families | Family Size |
| Married-Couple | 25 (100.0%) | 4.20 |
| Single Male/Father | 0 (0.0%) | - |
| Single Female/Mother | 0 (0.0%) | - |
| Total Families | 25 (100.0%) | 4.20 |
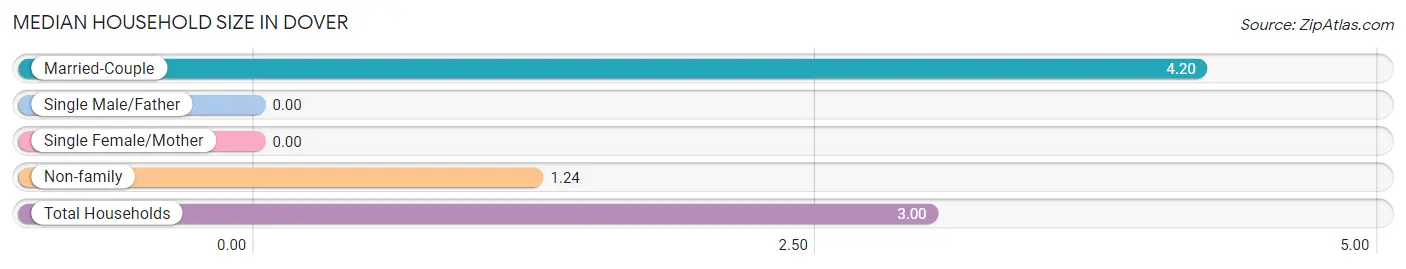
Median Household Size in Dover
| Household Type | # Households | Household Size |
| Married-Couple | 25 (59.5%) | 4.20 |
| Single Male/Father | 0 (0.0%) | - |
| Single Female/Mother | 0 (0.0%) | - |
| Non-family | 17 (40.5%) | 1.24 |
| Total Households | 42 (100.0%) | 3.00 |
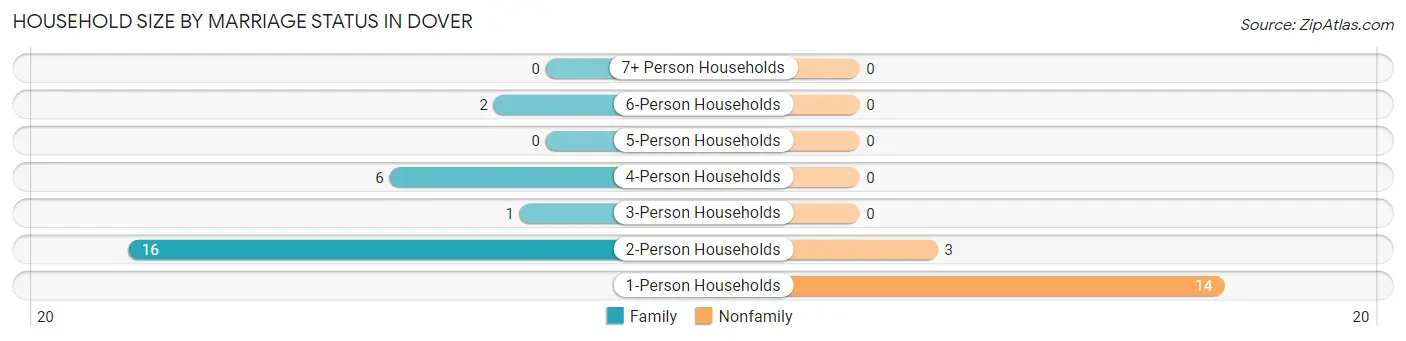
Household Size by Marriage Status in Dover
Out of a total of 42 households in Dover, 25 (59.5%) are family households, while 17 (40.5%) are nonfamily households. The most numerous type of family households are 2-person households, comprising 16, and the most common type of nonfamily households are 1-person households, comprising 14.
| Household Size | Family Households | Nonfamily Households |
| 1-Person Households | - | 14 (33.3%) |
| 2-Person Households | 16 (38.1%) | 3 (7.1%) |
| 3-Person Households | 1 (2.4%) | 0 (0.0%) |
| 4-Person Households | 6 (14.3%) | 0 (0.0%) |
| 5-Person Households | 0 (0.0%) | 0 (0.0%) |
| 6-Person Households | 2 (4.8%) | 0 (0.0%) |
| 7+ Person Households | 0 (0.0%) | 0 (0.0%) |
| Total | 25 (59.5%) | 17 (40.5%) |
Female Fertility in Dover
Fertility by Age in Dover
| Age Bracket | Women with Births | Births / 1,000 Women |
| 15 to 19 years | 0 (0.0%) | 0.0 |
| 20 to 34 years | 0 (0.0%) | 0.0 |
| 35 to 50 years | 0 (0.0%) | 0.0 |
| Total | 0 (0.0%) | 0.0 |
Fertility by Age by Marriage Status in Dover
| Age Bracket | Married | Unmarried |
| 15 to 19 years | 0 (0.0%) | 0 (0.0%) |
| 20 to 34 years | 0 (0.0%) | 0 (0.0%) |
| 35 to 50 years | 0 (0.0%) | 0 (0.0%) |
| Total | 0 (0.0%) | 0 (0.0%) |
Fertility by Education in Dover
| Educational Attainment | Women with Births | Births / 1,000 Women |
| Less than High School | 0 (0.0%) | 0.0 |
| High School Diploma | 0 (0.0%) | 0.0 |
| College or Associate's Degree | 0 (0.0%) | 0.0 |
| Bachelor's Degree | 0 (0.0%) | 0.0 |
| Graduate Degree | 0 (0.0%) | 0.0 |
| Total | 0 (0.0%) | 0.0 |
Fertility by Education by Marriage Status in Dover
| Educational Attainment | Married | Unmarried |
| Less than High School | 0 (0.0%) | 0 (0.0%) |
| High School Diploma | 0 (0.0%) | 0 (0.0%) |
| College or Associate's Degree | 0 (0.0%) | 0 (0.0%) |
| Bachelor's Degree | 0 (0.0%) | 0 (0.0%) |
| Graduate Degree | 0 (0.0%) | 0 (0.0%) |
| Total | 0 (0.0%) | 0 (0.0%) |
Employment Characteristics in Dover
Employment by Class of Employer in Dover
Among the 36 employed individuals in Dover, private company employees (30 | 83.3%), state government employees (4 | 11.1%), and local government employees (1 | 2.8%) make up the most common classes of employment.
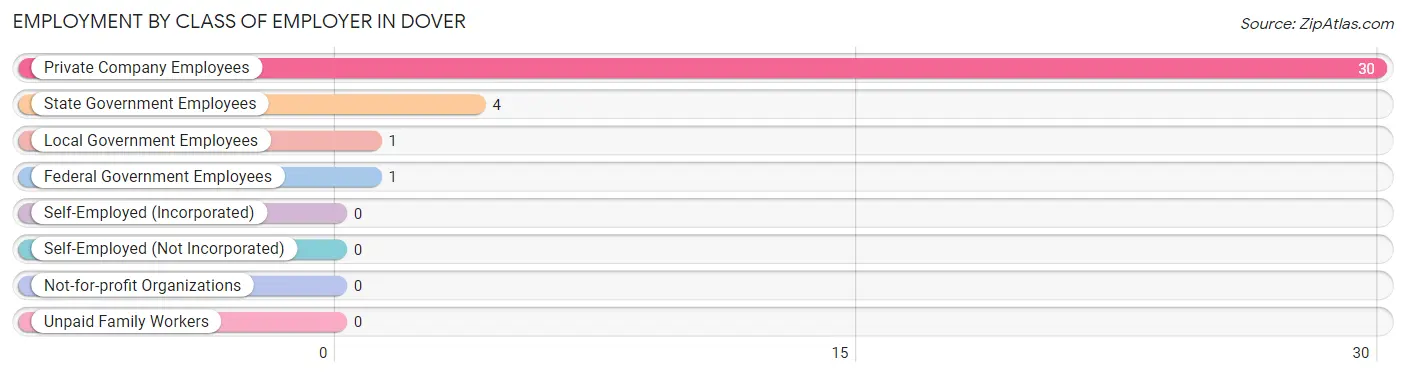
| Employer Class | # Employees | % Employees |
| Private Company Employees | 30 | 83.3% |
| Self-Employed (Incorporated) | 0 | 0.0% |
| Self-Employed (Not Incorporated) | 0 | 0.0% |
| Not-for-profit Organizations | 0 | 0.0% |
| Local Government Employees | 1 | 2.8% |
| State Government Employees | 4 | 11.1% |
| Federal Government Employees | 1 | 2.8% |
| Unpaid Family Workers | 0 | 0.0% |
| Total | 36 | 100.0% |
Employment Status by Age in Dover
According to the labor force statistics for Dover, out of the total population over 16 years of age (79), 46.8% or 37 individuals are in the labor force, with 2.7% or 1 of them unemployed. The age group with the highest labor force participation rate is 30 to 34 years, with 88.9% or 16 individuals in the labor force. Within the labor force, the 45 to 54 years age range has the highest percentage of unemployed individuals, with 25.0% or 1 of them being unemployed.
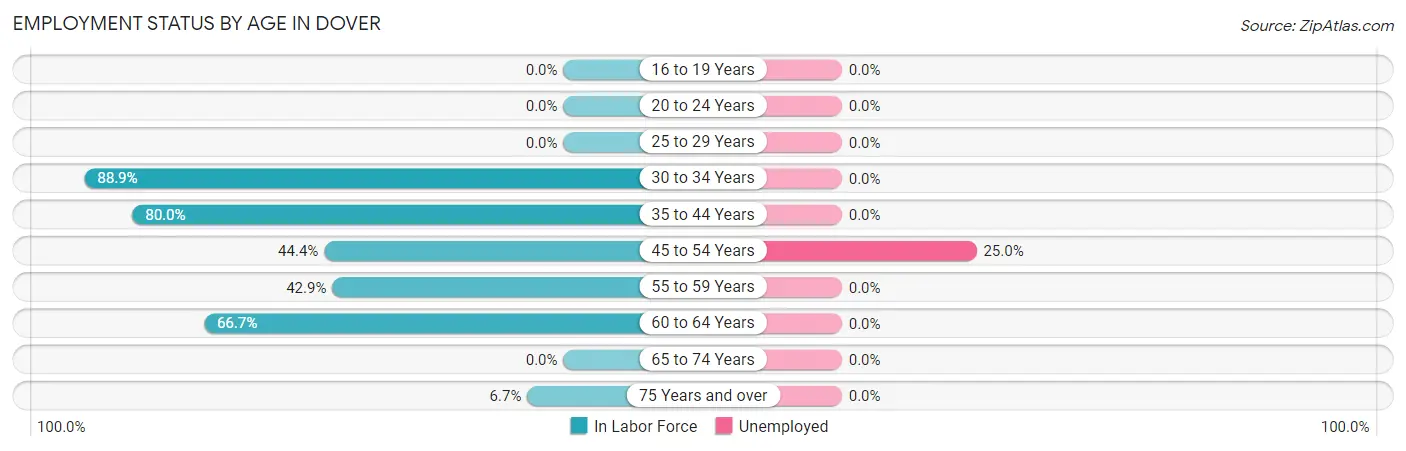
| Age Bracket | In Labor Force | Unemployed |
| 16 to 19 Years | 0 (0.0%) | 0 (0.0%) |
| 20 to 24 Years | 0 (0.0%) | 0 (0.0%) |
| 25 to 29 Years | 0 (0.0%) | 0 (0.0%) |
| 30 to 34 Years | 16 (88.9%) | 0 (0.0%) |
| 35 to 44 Years | 8 (80.0%) | 0 (0.0%) |
| 45 to 54 Years | 4 (44.4%) | 1 (25.0%) |
| 55 to 59 Years | 6 (42.9%) | 0 (0.0%) |
| 60 to 64 Years | 2 (66.7%) | 0 (0.0%) |
| 65 to 74 Years | 0 (0.0%) | 0 (0.0%) |
| 75 Years and over | 1 (6.7%) | 0 (0.0%) |
| Total | 37 (46.8%) | 1 (2.7%) |
Employment Status by Educational Attainment in Dover
According to labor force statistics for Dover, 66.7% of individuals (36) out of the total population between 25 and 64 years of age (54) are in the labor force, with 2.8% or 1 of them being unemployed. The group with the highest labor force participation rate are those with the educational attainment of bachelor's degree or higher, with 86.7% or 13 individuals in the labor force. Within the labor force, individuals with high school diploma education have the highest percentage of unemployment, with 8.3% or 1 of them being unemployed.
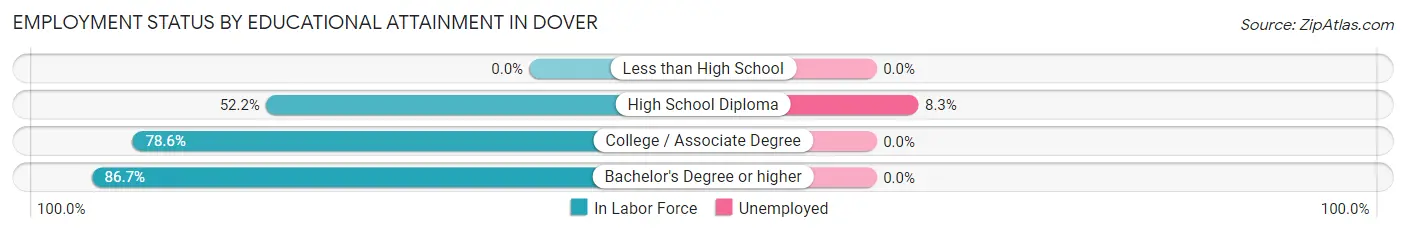
| Educational Attainment | In Labor Force | Unemployed |
| Less than High School | 0 (0.0%) | 0 (0.0%) |
| High School Diploma | 12 (52.2%) | 2 (8.3%) |
| College / Associate Degree | 11 (78.6%) | 0 (0.0%) |
| Bachelor's Degree or higher | 13 (86.7%) | 0 (0.0%) |
| Total | 36 (66.7%) | 2 (2.8%) |
Employment Occupations by Sex in Dover
Management, Business, Science and Arts Occupations
The most common Management, Business, Science and Arts occupations in Dover are Business & Financial (13 | 36.1%), Community & Social Service (1 | 2.8%), and Education Instruction & Library (1 | 2.8%).
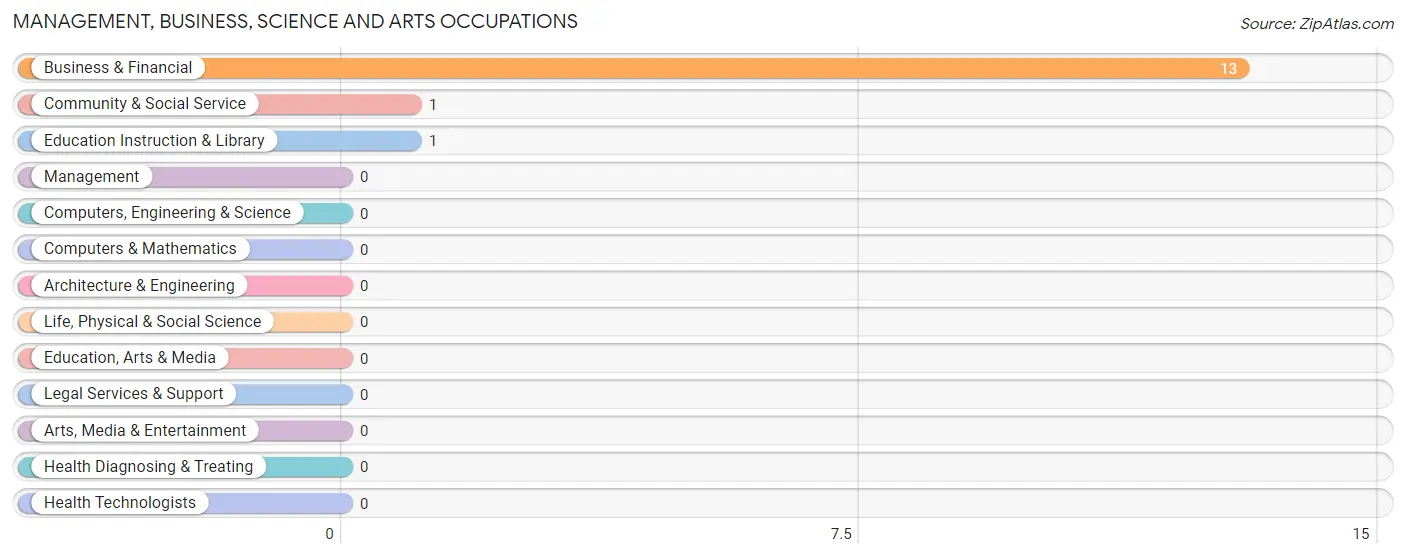
Management, Business, Science and Arts Occupations by Sex
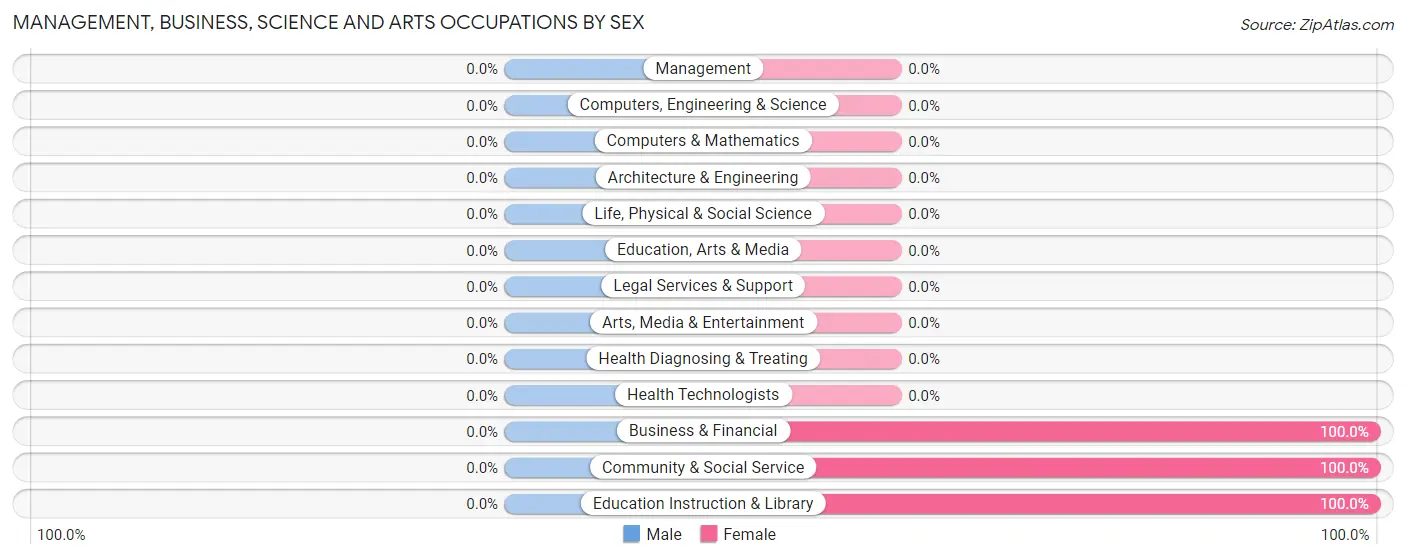
| Occupation | Male | Female |
| Management | 0 (0.0%) | 0 (0.0%) |
| Business & Financial | 0 (0.0%) | 13 (100.0%) |
| Computers, Engineering & Science | 0 (0.0%) | 0 (0.0%) |
| Computers & Mathematics | 0 (0.0%) | 0 (0.0%) |
| Architecture & Engineering | 0 (0.0%) | 0 (0.0%) |
| Life, Physical & Social Science | 0 (0.0%) | 0 (0.0%) |
| Community & Social Service | 0 (0.0%) | 1 (100.0%) |
| Education, Arts & Media | 0 (0.0%) | 0 (0.0%) |
| Legal Services & Support | 0 (0.0%) | 0 (0.0%) |
| Education Instruction & Library | 0 (0.0%) | 1 (100.0%) |
| Arts, Media & Entertainment | 0 (0.0%) | 0 (0.0%) |
| Health Diagnosing & Treating | 0 (0.0%) | 0 (0.0%) |
| Health Technologists | 0 (0.0%) | 0 (0.0%) |
| Total (Category) | 0 (0.0%) | 14 (100.0%) |
| Total (Overall) | 15 (41.7%) | 21 (58.3%) |
Services Occupations
The most common Services occupations in Dover are Healthcare Support (1 | 2.8%), Security & Protection (1 | 2.8%), and Law Enforcement (1 | 2.8%).
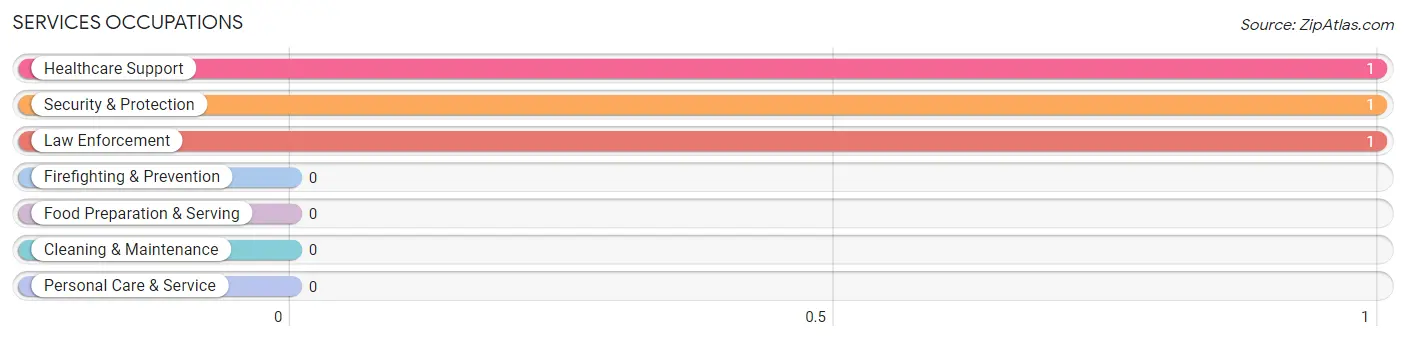
Services Occupations by Sex
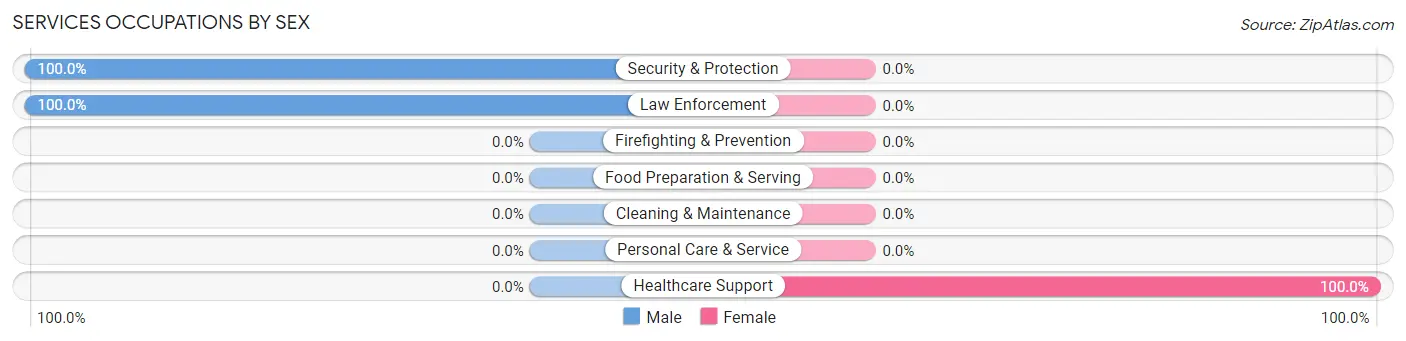
| Occupation | Male | Female |
| Healthcare Support | 0 (0.0%) | 1 (100.0%) |
| Security & Protection | 1 (100.0%) | 0 (0.0%) |
| Firefighting & Prevention | 0 (0.0%) | 0 (0.0%) |
| Law Enforcement | 1 (100.0%) | 0 (0.0%) |
| Food Preparation & Serving | 0 (0.0%) | 0 (0.0%) |
| Cleaning & Maintenance | 0 (0.0%) | 0 (0.0%) |
| Personal Care & Service | 0 (0.0%) | 0 (0.0%) |
| Total (Category) | 1 (50.0%) | 1 (50.0%) |
| Total (Overall) | 15 (41.7%) | 21 (58.3%) |
Sales and Office Occupations
The most common Sales and Office occupations in Dover are , and Office & Administration (6 | 16.7%).
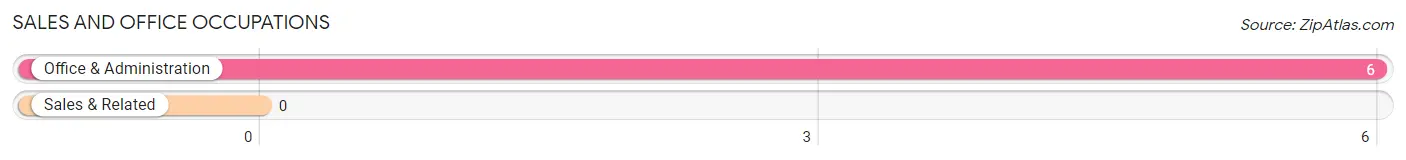
Sales and Office Occupations by Sex
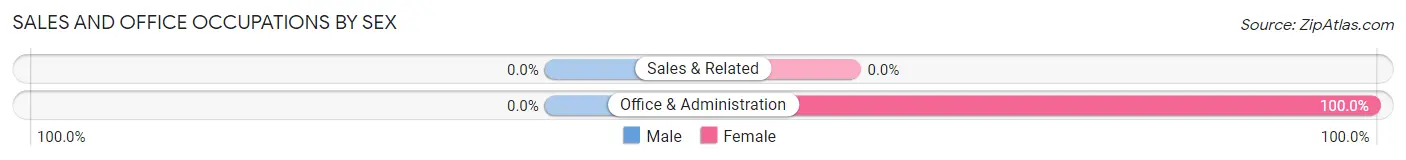
| Occupation | Male | Female |
| Sales & Related | 0 (0.0%) | 0 (0.0%) |
| Office & Administration | 0 (0.0%) | 6 (100.0%) |
| Total (Category) | 0 (0.0%) | 6 (100.0%) |
| Total (Overall) | 15 (41.7%) | 21 (58.3%) |
Natural Resources, Construction and Maintenance Occupations
The most common Natural Resources, Construction and Maintenance occupations in Dover are Construction & Extraction (9 | 25.0%), and Installation, Maintenance & Repair (1 | 2.8%).
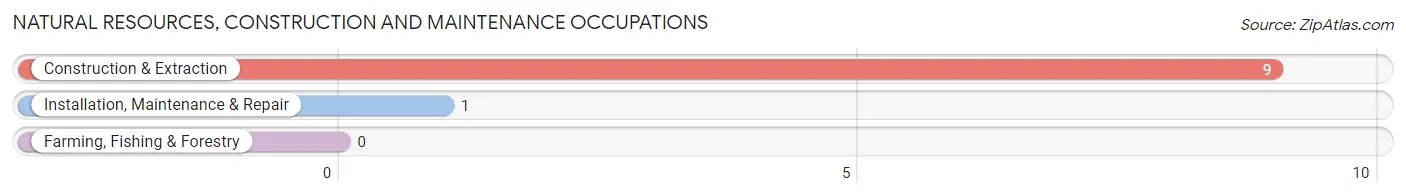
Natural Resources, Construction and Maintenance Occupations by Sex
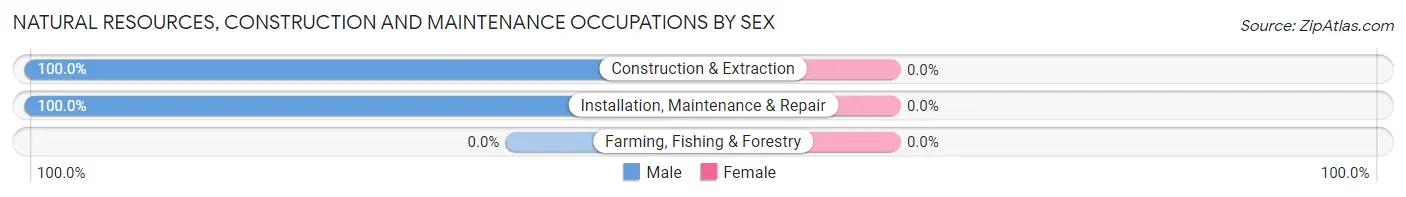
| Occupation | Male | Female |
| Farming, Fishing & Forestry | 0 (0.0%) | 0 (0.0%) |
| Construction & Extraction | 9 (100.0%) | 0 (0.0%) |
| Installation, Maintenance & Repair | 1 (100.0%) | 0 (0.0%) |
| Total (Category) | 10 (100.0%) | 0 (0.0%) |
| Total (Overall) | 15 (41.7%) | 21 (58.3%) |
Production, Transportation and Moving Occupations
The most common Production, Transportation and Moving occupations in Dover are Production (2 | 5.6%), and Transportation (2 | 5.6%).
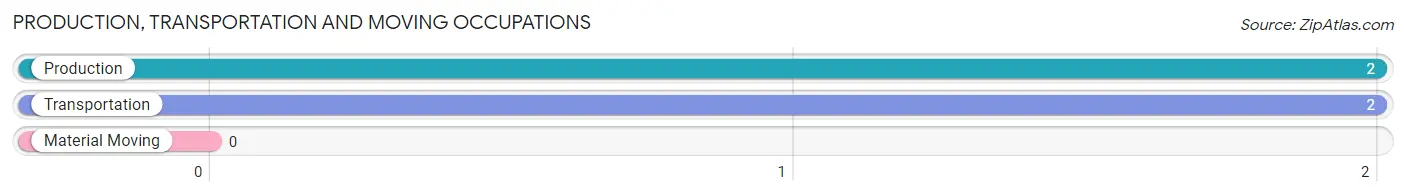
Production, Transportation and Moving Occupations by Sex
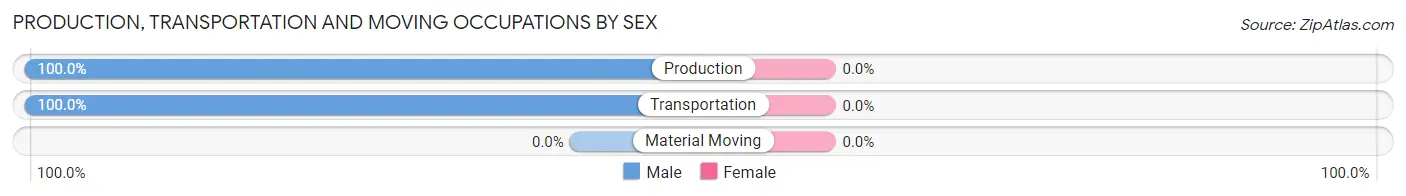
| Occupation | Male | Female |
| Production | 2 (100.0%) | 0 (0.0%) |
| Transportation | 2 (100.0%) | 0 (0.0%) |
| Material Moving | 0 (0.0%) | 0 (0.0%) |
| Total (Category) | 4 (100.0%) | 0 (0.0%) |
| Total (Overall) | 15 (41.7%) | 21 (58.3%) |
Employment Industries by Sex in Dover
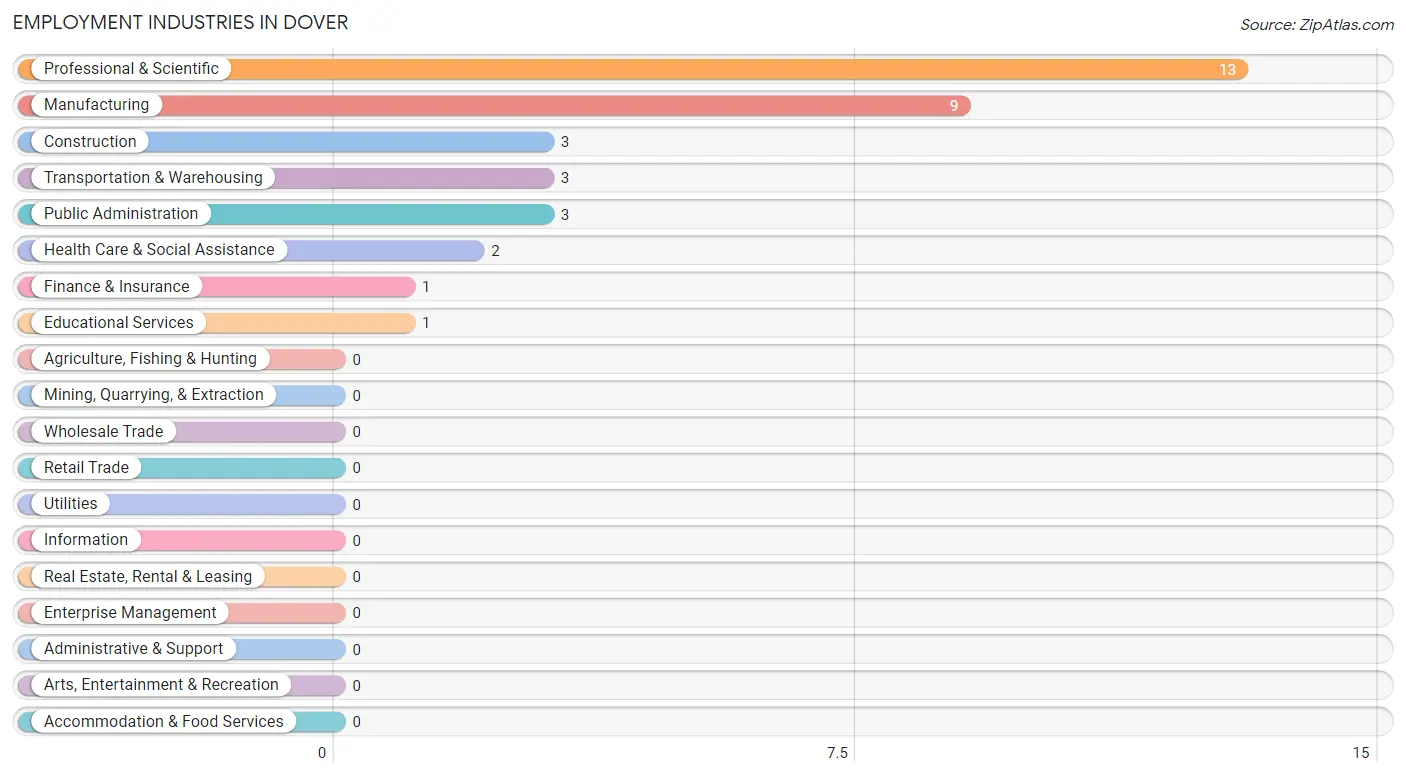
Employment Industries in Dover
The major employment industries in Dover include Professional & Scientific (13 | 36.1%), Manufacturing (9 | 25.0%), Construction (3 | 8.3%), Transportation & Warehousing (3 | 8.3%), and Public Administration (3 | 8.3%).
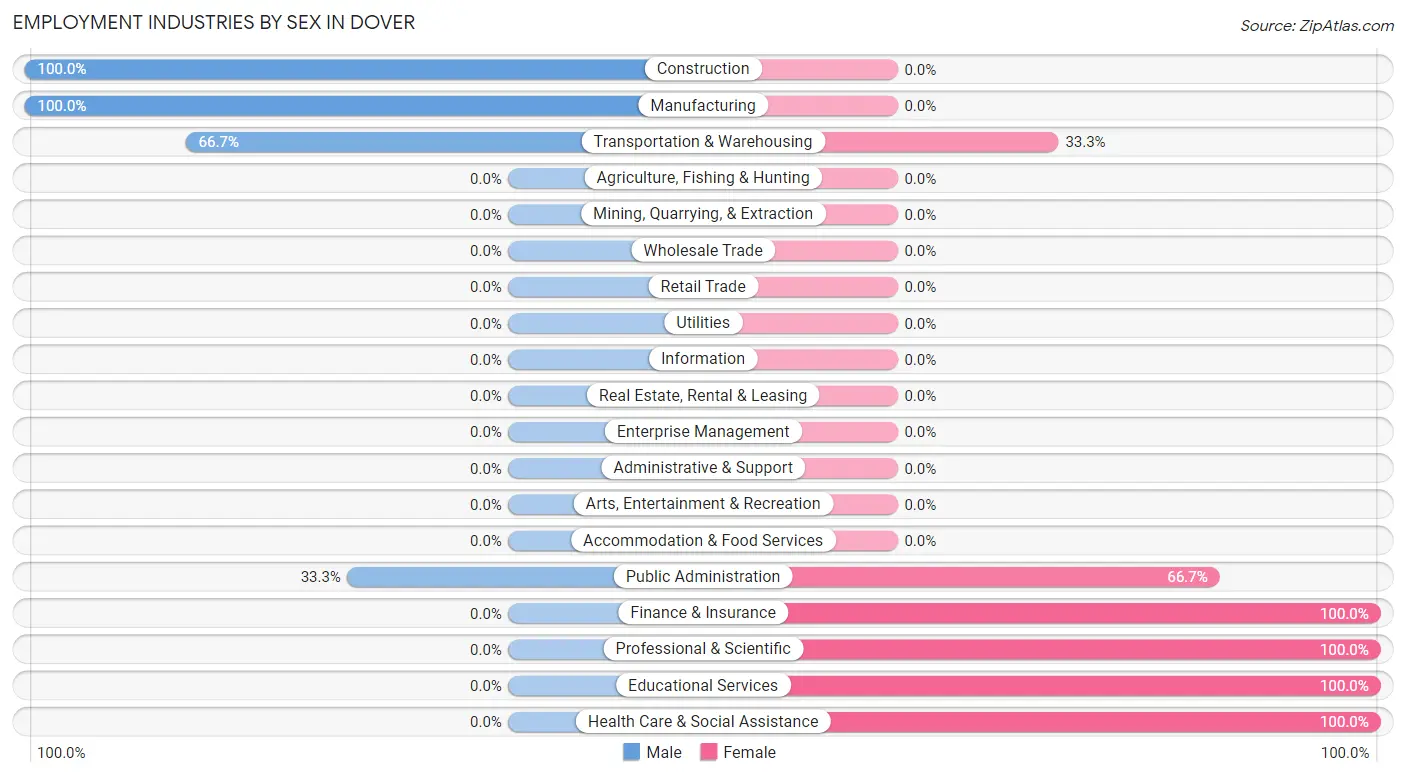
Employment Industries by Sex in Dover
The Dover industries that see more men than women are Construction (100.0%), Manufacturing (100.0%), and Transportation & Warehousing (66.7%), whereas the industries that tend to have a higher number of women are Finance & Insurance (100.0%), Professional & Scientific (100.0%), and Educational Services (100.0%).
| Industry | Male | Female |
| Agriculture, Fishing & Hunting | 0 (0.0%) | 0 (0.0%) |
| Mining, Quarrying, & Extraction | 0 (0.0%) | 0 (0.0%) |
| Construction | 3 (100.0%) | 0 (0.0%) |
| Manufacturing | 9 (100.0%) | 0 (0.0%) |
| Wholesale Trade | 0 (0.0%) | 0 (0.0%) |
| Retail Trade | 0 (0.0%) | 0 (0.0%) |
| Transportation & Warehousing | 2 (66.7%) | 1 (33.3%) |
| Utilities | 0 (0.0%) | 0 (0.0%) |
| Information | 0 (0.0%) | 0 (0.0%) |
| Finance & Insurance | 0 (0.0%) | 1 (100.0%) |
| Real Estate, Rental & Leasing | 0 (0.0%) | 0 (0.0%) |
| Professional & Scientific | 0 (0.0%) | 13 (100.0%) |
| Enterprise Management | 0 (0.0%) | 0 (0.0%) |
| Administrative & Support | 0 (0.0%) | 0 (0.0%) |
| Educational Services | 0 (0.0%) | 1 (100.0%) |
| Health Care & Social Assistance | 0 (0.0%) | 2 (100.0%) |
| Arts, Entertainment & Recreation | 0 (0.0%) | 0 (0.0%) |
| Accommodation & Food Services | 0 (0.0%) | 0 (0.0%) |
| Public Administration | 1 (33.3%) | 2 (66.7%) |
| Total | 15 (41.7%) | 21 (58.3%) |
Education in Dover
School Enrollment in Dover
The most common levels of schooling among the 48 students in Dover are high school (28 | 58.3%), nursery / preschool (12 | 25.0%), and elementary school (4 | 8.3%).
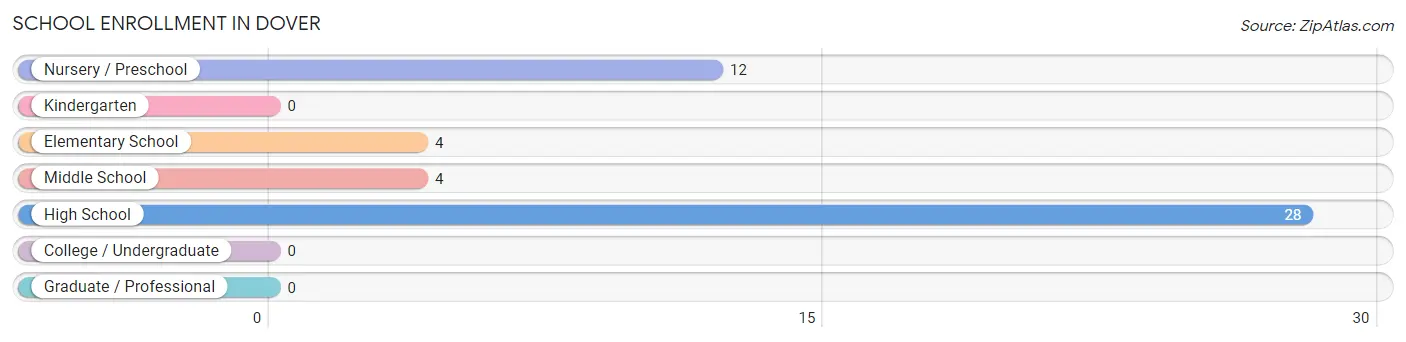
| School Level | # Students | % Students |
| Nursery / Preschool | 12 | 25.0% |
| Kindergarten | 0 | 0.0% |
| Elementary School | 4 | 8.3% |
| Middle School | 4 | 8.3% |
| High School | 28 | 58.3% |
| College / Undergraduate | 0 | 0.0% |
| Graduate / Professional | 0 | 0.0% |
| Total | 48 | 100.0% |
School Enrollment by Age by Funding Source in Dover
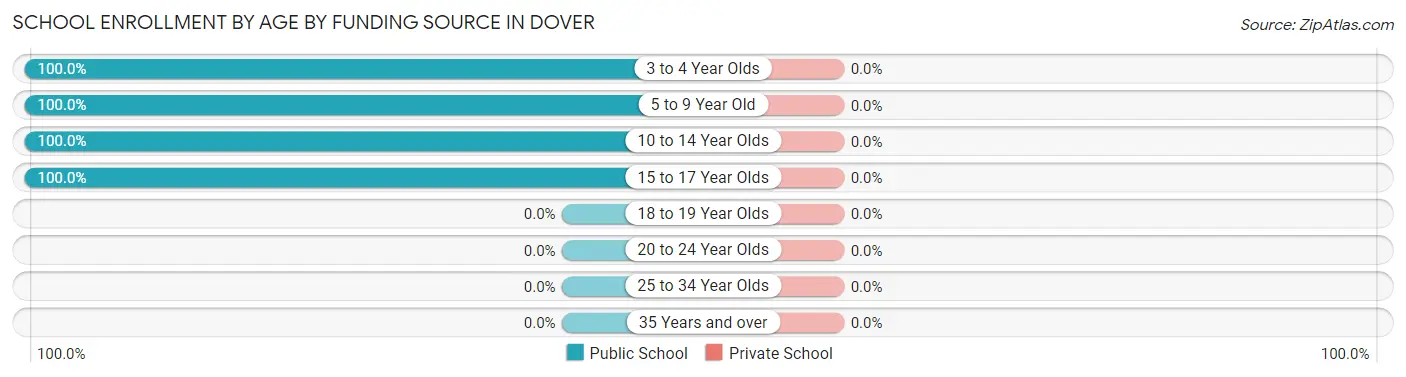
| Age Bracket | Public School | Private School |
| 3 to 4 Year Olds | 12 (100.0%) | 0 (0.0%) |
| 5 to 9 Year Old | 4 (100.0%) | 0 (0.0%) |
| 10 to 14 Year Olds | 31 (100.0%) | 0 (0.0%) |
| 15 to 17 Year Olds | 1 (100.0%) | 0 (0.0%) |
| 18 to 19 Year Olds | 0 (0.0%) | 0 (0.0%) |
| 20 to 24 Year Olds | 0 (0.0%) | 0 (0.0%) |
| 25 to 34 Year Olds | 0 (0.0%) | 0 (0.0%) |
| 35 Years and over | 0 (0.0%) | 0 (0.0%) |
| Total | 48 (100.0%) | 0 (0.0%) |
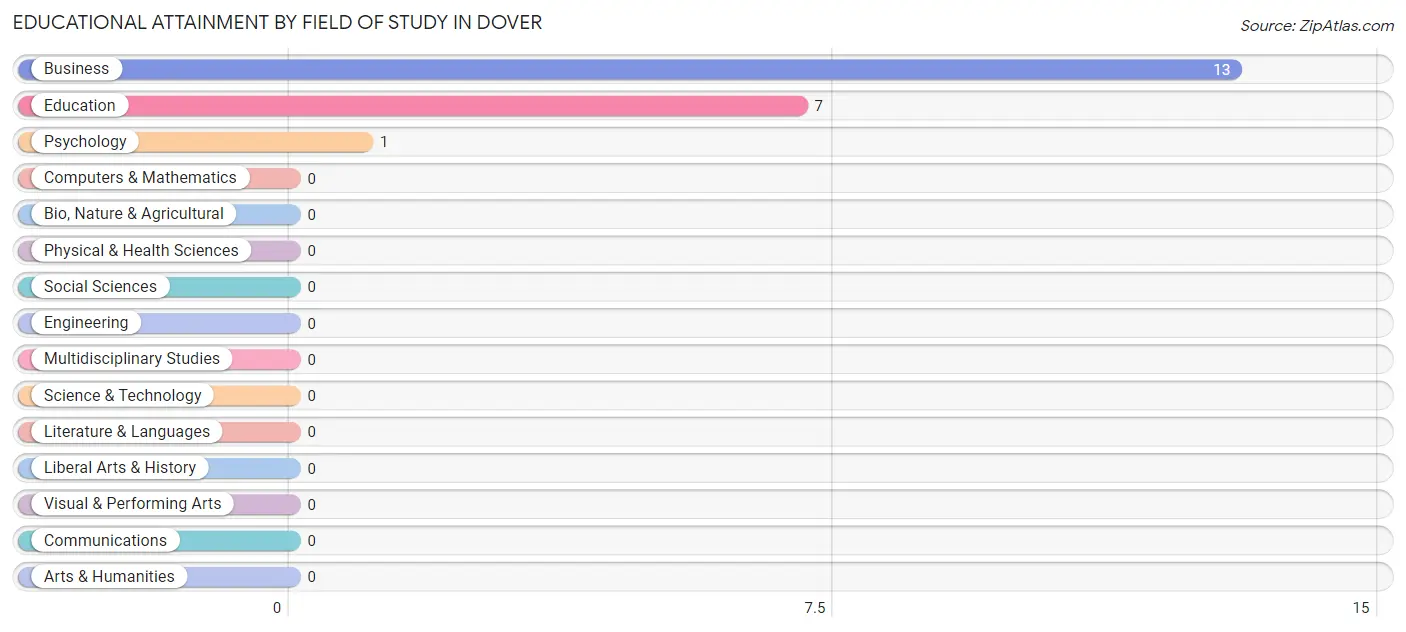
Educational Attainment by Field of Study in Dover
Business (13 | 61.9%), education (7 | 33.3%), and psychology (1 | 4.8%) are the most common fields of study among 21 individuals in Dover who have obtained a bachelor's degree or higher.
| Field of Study | # Graduates | % Graduates |
| Computers & Mathematics | 0 | 0.0% |
| Bio, Nature & Agricultural | 0 | 0.0% |
| Physical & Health Sciences | 0 | 0.0% |
| Psychology | 1 | 4.8% |
| Social Sciences | 0 | 0.0% |
| Engineering | 0 | 0.0% |
| Multidisciplinary Studies | 0 | 0.0% |
| Science & Technology | 0 | 0.0% |
| Business | 13 | 61.9% |
| Education | 7 | 33.3% |
| Literature & Languages | 0 | 0.0% |
| Liberal Arts & History | 0 | 0.0% |
| Visual & Performing Arts | 0 | 0.0% |
| Communications | 0 | 0.0% |
| Arts & Humanities | 0 | 0.0% |
| Total | 21 | 100.0% |
Transportation & Commute in Dover
Vehicle Availability by Sex in Dover
The most prevalent vehicle ownership categories in Dover are males with 3 vehicles (9, accounting for 60.0%) and females with 3 vehicles (15, making up 42.9%).
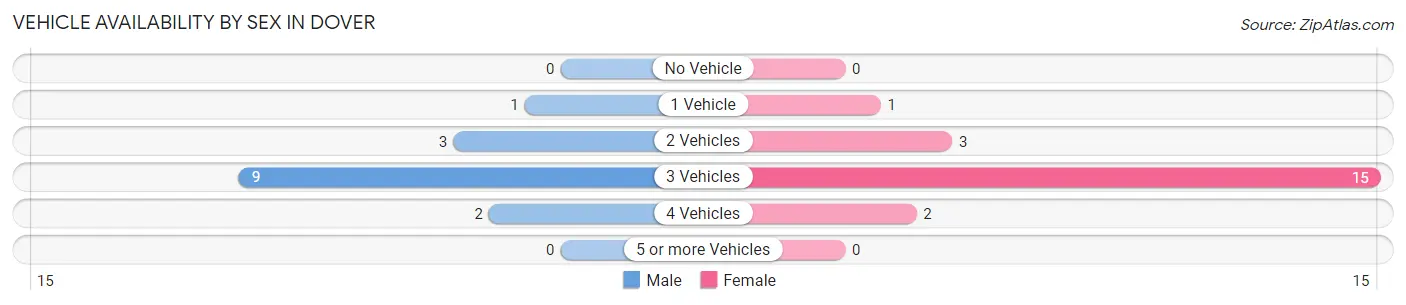
| Vehicles Available | Male | Female |
| No Vehicle | 0 (0.0%) | 0 (0.0%) |
| 1 Vehicle | 1 (6.7%) | 1 (4.8%) |
| 2 Vehicles | 3 (20.0%) | 3 (14.3%) |
| 3 Vehicles | 9 (60.0%) | 15 (71.4%) |
| 4 Vehicles | 2 (13.3%) | 2 (9.5%) |
| 5 or more Vehicles | 0 (0.0%) | 0 (0.0%) |
| Total | 15 (100.0%) | 21 (100.0%) |
Commute Time in Dover
The most frequently occuring commute durations in Dover are 25 to 29 minutes (13 commuters, 36.1%), 30 to 34 minutes (7 commuters, 19.4%), and 15 to 19 minutes (5 commuters, 13.9%).

| Commute Time | # Commuters | % Commuters |
| Less than 5 Minutes | 0 | 0.0% |
| 5 to 9 Minutes | 1 | 2.8% |
| 10 to 14 Minutes | 1 | 2.8% |
| 15 to 19 Minutes | 5 | 13.9% |
| 20 to 24 Minutes | 2 | 5.6% |
| 25 to 29 Minutes | 13 | 36.1% |
| 30 to 34 Minutes | 7 | 19.4% |
| 35 to 39 Minutes | 0 | 0.0% |
| 40 to 44 Minutes | 0 | 0.0% |
| 45 to 59 Minutes | 3 | 8.3% |
| 60 to 89 Minutes | 4 | 11.1% |
| 90 or more Minutes | 0 | 0.0% |
Commute Time by Sex in Dover
The most common commute times in Dover are 30 to 34 minutes (6 commuters, 40.0%) for males and 25 to 29 minutes (13 commuters, 61.9%) for females.
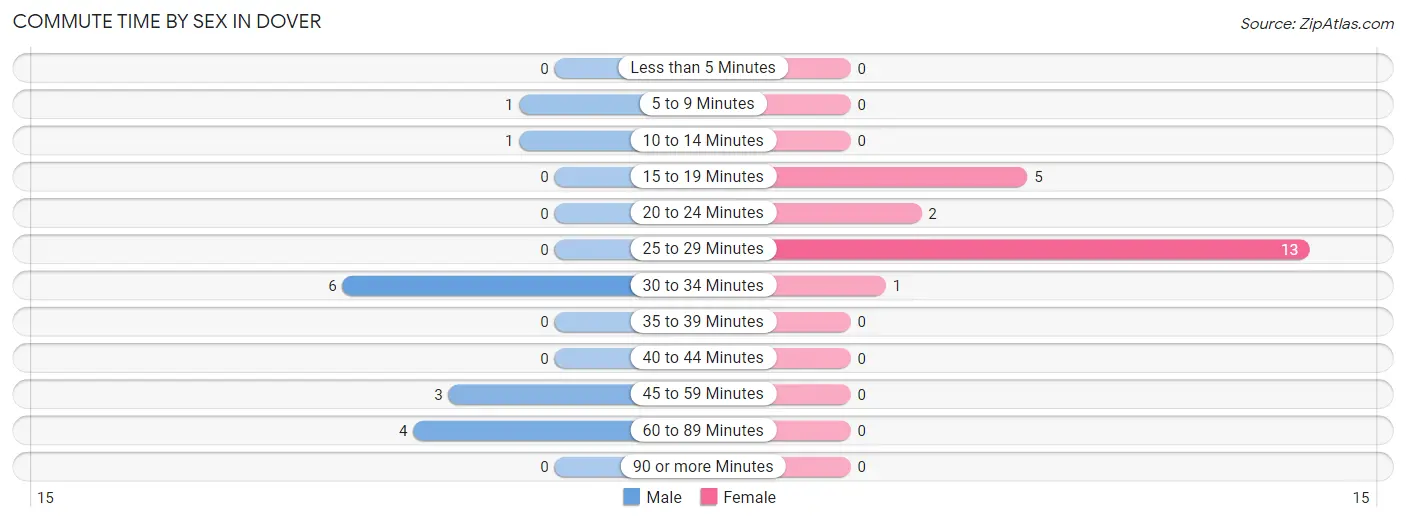
| Commute Time | Male | Female |
| Less than 5 Minutes | 0 (0.0%) | 0 (0.0%) |
| 5 to 9 Minutes | 1 (6.7%) | 0 (0.0%) |
| 10 to 14 Minutes | 1 (6.7%) | 0 (0.0%) |
| 15 to 19 Minutes | 0 (0.0%) | 5 (23.8%) |
| 20 to 24 Minutes | 0 (0.0%) | 2 (9.5%) |
| 25 to 29 Minutes | 0 (0.0%) | 13 (61.9%) |
| 30 to 34 Minutes | 6 (40.0%) | 1 (4.8%) |
| 35 to 39 Minutes | 0 (0.0%) | 0 (0.0%) |
| 40 to 44 Minutes | 0 (0.0%) | 0 (0.0%) |
| 45 to 59 Minutes | 3 (20.0%) | 0 (0.0%) |
| 60 to 89 Minutes | 4 (26.7%) | 0 (0.0%) |
| 90 or more Minutes | 0 (0.0%) | 0 (0.0%) |
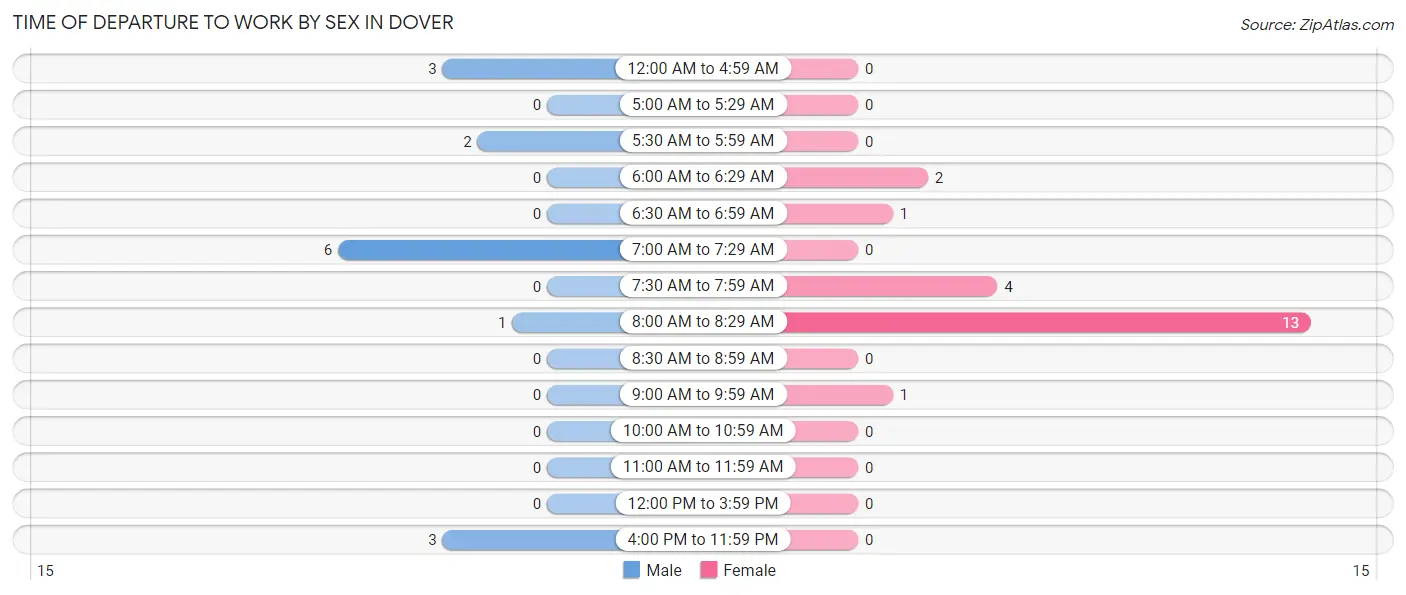
Time of Departure to Work by Sex in Dover
The most frequent times of departure to work in Dover are 7:00 AM to 7:29 AM (6, 40.0%) for males and 8:00 AM to 8:29 AM (13, 61.9%) for females.
| Time of Departure | Male | Female |
| 12:00 AM to 4:59 AM | 3 (20.0%) | 0 (0.0%) |
| 5:00 AM to 5:29 AM | 0 (0.0%) | 0 (0.0%) |
| 5:30 AM to 5:59 AM | 2 (13.3%) | 0 (0.0%) |
| 6:00 AM to 6:29 AM | 0 (0.0%) | 2 (9.5%) |
| 6:30 AM to 6:59 AM | 0 (0.0%) | 1 (4.8%) |
| 7:00 AM to 7:29 AM | 6 (40.0%) | 0 (0.0%) |
| 7:30 AM to 7:59 AM | 0 (0.0%) | 4 (19.1%) |
| 8:00 AM to 8:29 AM | 1 (6.7%) | 13 (61.9%) |
| 8:30 AM to 8:59 AM | 0 (0.0%) | 0 (0.0%) |
| 9:00 AM to 9:59 AM | 0 (0.0%) | 1 (4.8%) |
| 10:00 AM to 10:59 AM | 0 (0.0%) | 0 (0.0%) |
| 11:00 AM to 11:59 AM | 0 (0.0%) | 0 (0.0%) |
| 12:00 PM to 3:59 PM | 0 (0.0%) | 0 (0.0%) |
| 4:00 PM to 11:59 PM | 3 (20.0%) | 0 (0.0%) |
| Total | 15 (100.0%) | 21 (100.0%) |
Housing Occupancy in Dover
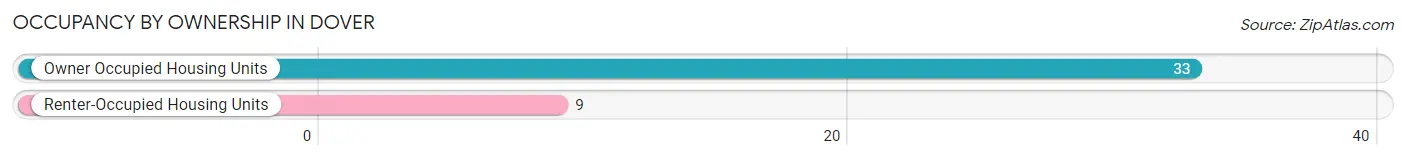
Occupancy by Ownership in Dover
Of the total 42 dwellings in Dover, owner-occupied units account for 33 (78.6%), while renter-occupied units make up 9 (21.4%).
| Occupancy | # Housing Units | % Housing Units |
| Owner Occupied Housing Units | 33 | 78.6% |
| Renter-Occupied Housing Units | 9 | 21.4% |
| Total Occupied Housing Units | 42 | 100.0% |
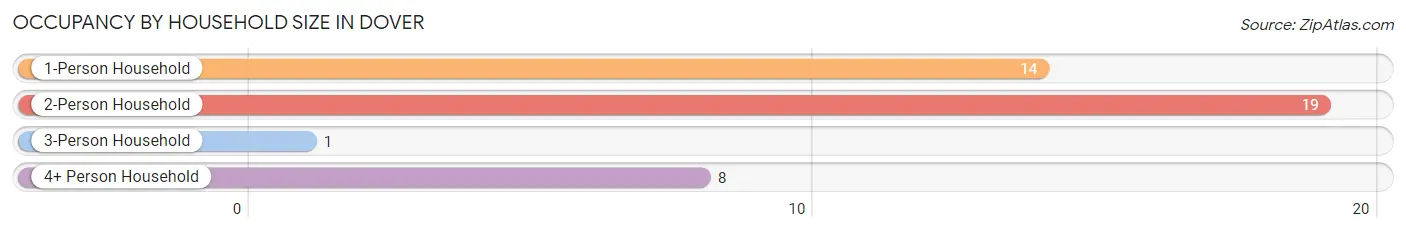
Occupancy by Household Size in Dover
| Household Size | # Housing Units | % Housing Units |
| 1-Person Household | 14 | 33.3% |
| 2-Person Household | 19 | 45.2% |
| 3-Person Household | 1 | 2.4% |
| 4+ Person Household | 8 | 19.1% |
| Total Housing Units | 42 | 100.0% |
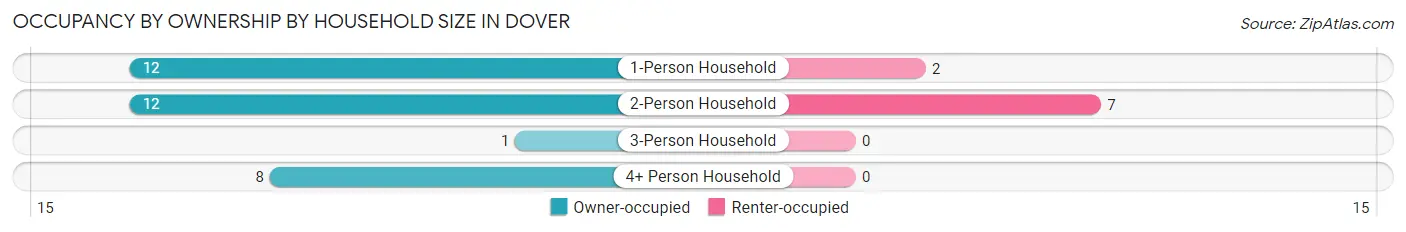
Occupancy by Ownership by Household Size in Dover
| Household Size | Owner-occupied | Renter-occupied |
| 1-Person Household | 12 (85.7%) | 2 (14.3%) |
| 2-Person Household | 12 (63.2%) | 7 (36.8%) |
| 3-Person Household | 1 (100.0%) | 0 (0.0%) |
| 4+ Person Household | 8 (100.0%) | 0 (0.0%) |
| Total Housing Units | 33 (78.6%) | 9 (21.4%) |
Occupancy by Educational Attainment in Dover
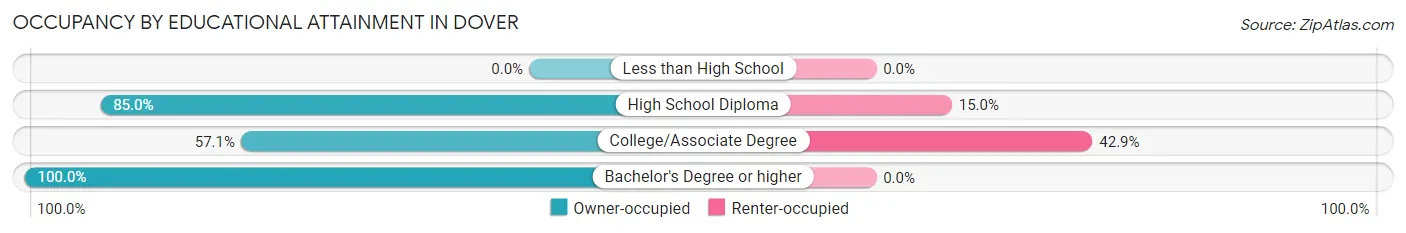
| Household Size | Owner-occupied | Renter-occupied |
| Less than High School | 0 (0.0%) | 0 (0.0%) |
| High School Diploma | 17 (85.0%) | 3 (15.0%) |
| College/Associate Degree | 8 (57.1%) | 6 (42.9%) |
| Bachelor's Degree or higher | 8 (100.0%) | 0 (0.0%) |
Occupancy by Age of Householder in Dover
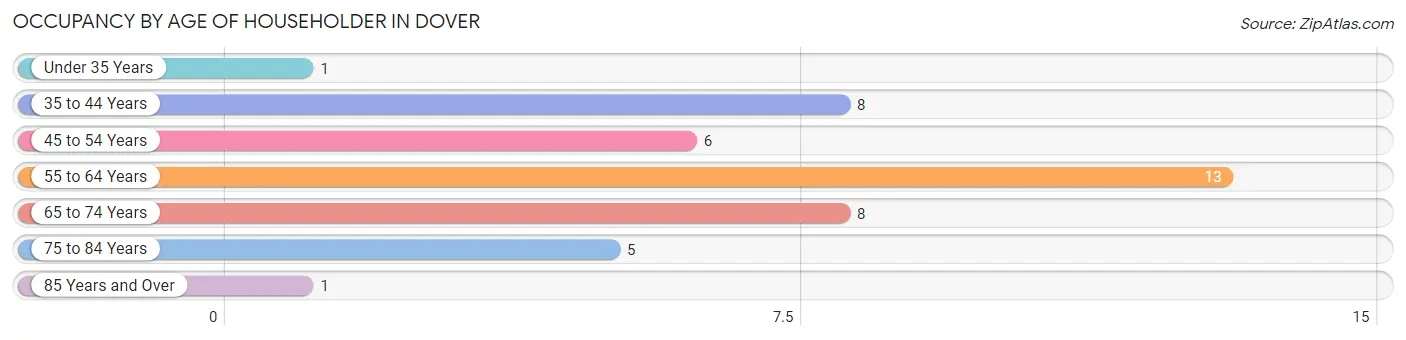
| Age Bracket | # Households | % Households |
| Under 35 Years | 1 | 2.4% |
| 35 to 44 Years | 8 | 19.1% |
| 45 to 54 Years | 6 | 14.3% |
| 55 to 64 Years | 13 | 30.9% |
| 65 to 74 Years | 8 | 19.1% |
| 75 to 84 Years | 5 | 11.9% |
| 85 Years and Over | 1 | 2.4% |
| Total | 42 | 100.0% |
Housing Finances in Dover
Median Income by Occupancy in Dover
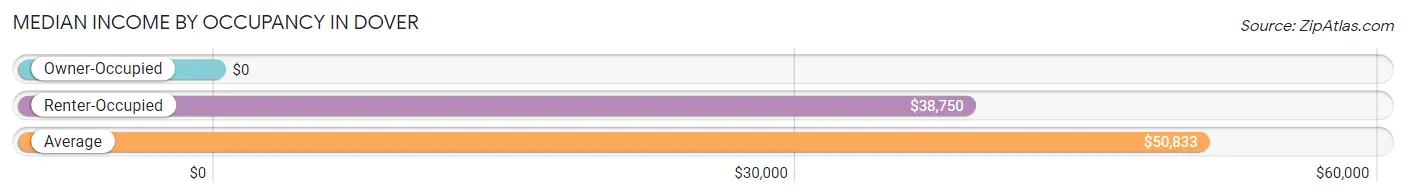
| Occupancy Type | # Households | Median Income |
| Owner-Occupied | 33 (78.6%) | $0 |
| Renter-Occupied | 9 (21.4%) | $38,750 |
| Average | 42 (100.0%) | $50,833 |
Occupancy by Householder Income Bracket in Dover
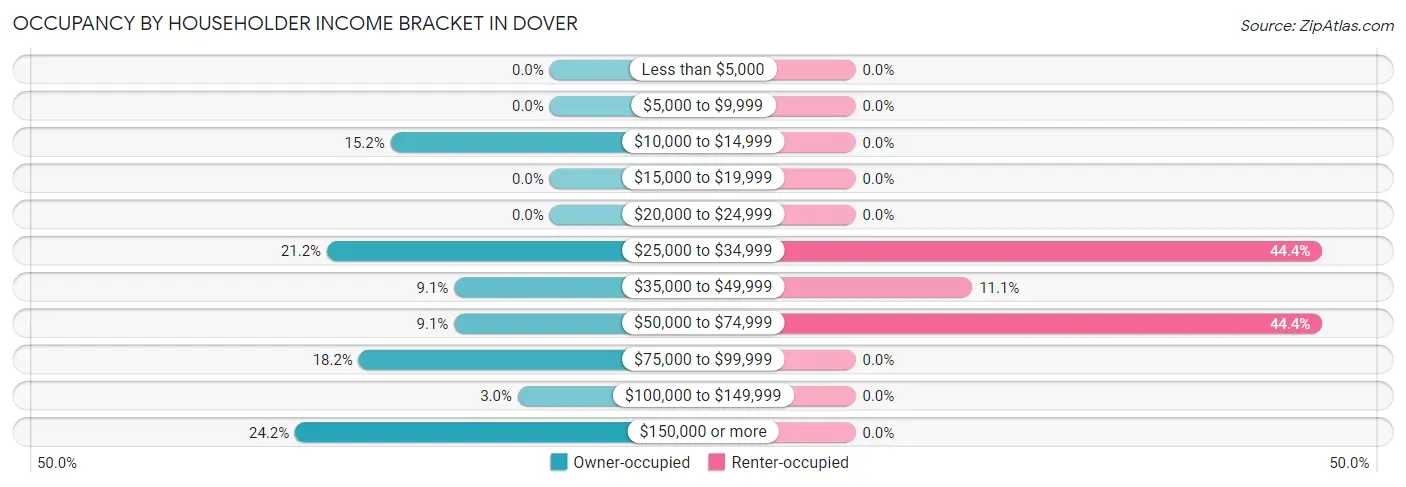
| Income Bracket | Owner-occupied | Renter-occupied |
| Less than $5,000 | 0 (0.0%) | 0 (0.0%) |
| $5,000 to $9,999 | 0 (0.0%) | 0 (0.0%) |
| $10,000 to $14,999 | 5 (15.1%) | 0 (0.0%) |
| $15,000 to $19,999 | 0 (0.0%) | 0 (0.0%) |
| $20,000 to $24,999 | 0 (0.0%) | 0 (0.0%) |
| $25,000 to $34,999 | 7 (21.2%) | 4 (44.4%) |
| $35,000 to $49,999 | 3 (9.1%) | 1 (11.1%) |
| $50,000 to $74,999 | 3 (9.1%) | 4 (44.4%) |
| $75,000 to $99,999 | 6 (18.2%) | 0 (0.0%) |
| $100,000 to $149,999 | 1 (3.0%) | 0 (0.0%) |
| $150,000 or more | 8 (24.2%) | 0 (0.0%) |
| Total | 33 (100.0%) | 9 (100.0%) |
Monthly Housing Cost Tiers in Dover
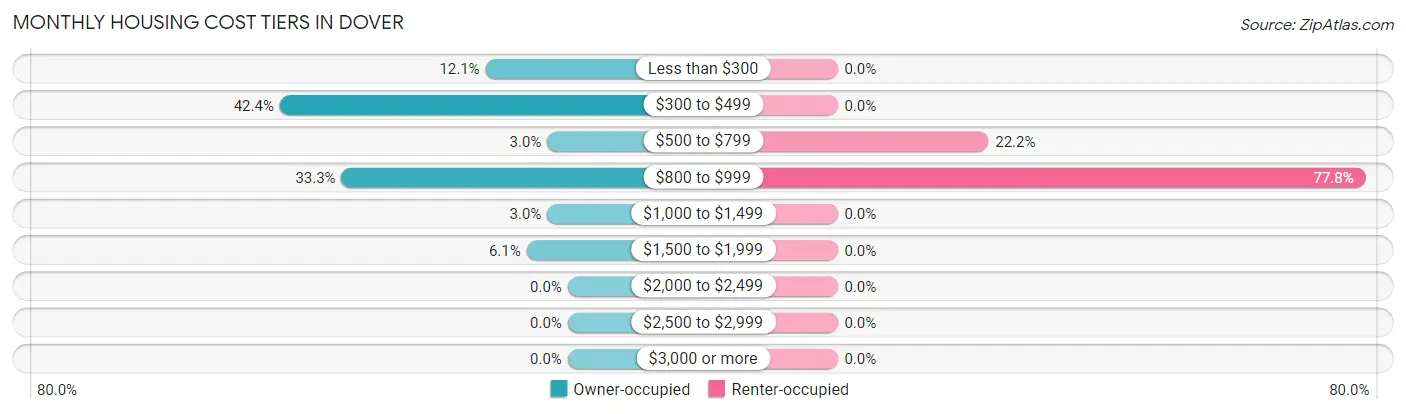
| Monthly Cost | Owner-occupied | Renter-occupied |
| Less than $300 | 4 (12.1%) | 0 (0.0%) |
| $300 to $499 | 14 (42.4%) | 0 (0.0%) |
| $500 to $799 | 1 (3.0%) | 2 (22.2%) |
| $800 to $999 | 11 (33.3%) | 7 (77.8%) |
| $1,000 to $1,499 | 1 (3.0%) | 0 (0.0%) |
| $1,500 to $1,999 | 2 (6.1%) | 0 (0.0%) |
| $2,000 to $2,499 | 0 (0.0%) | 0 (0.0%) |
| $2,500 to $2,999 | 0 (0.0%) | 0 (0.0%) |
| $3,000 or more | 0 (0.0%) | 0 (0.0%) |
| Total | 33 (100.0%) | 9 (100.0%) |
Physical Housing Characteristics in Dover
Housing Structures in Dover
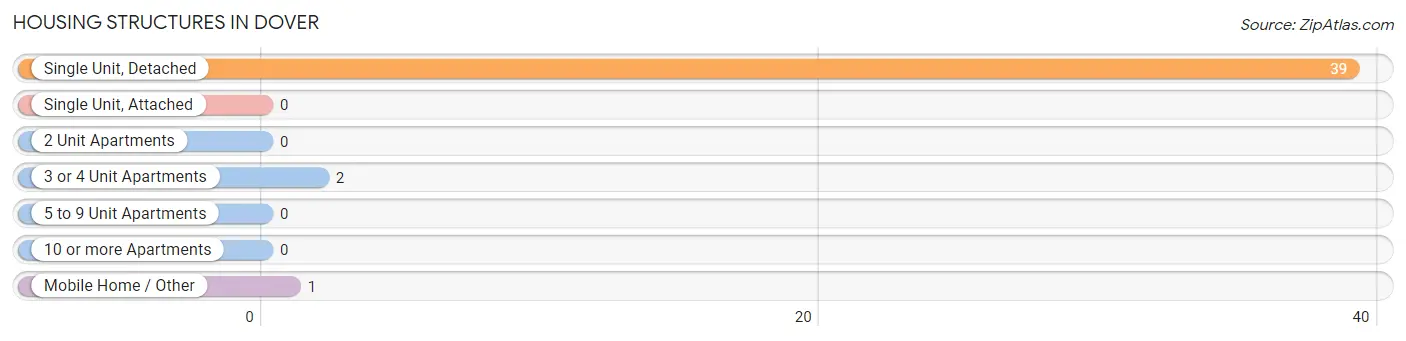
| Structure Type | # Housing Units | % Housing Units |
| Single Unit, Detached | 39 | 92.9% |
| Single Unit, Attached | 0 | 0.0% |
| 2 Unit Apartments | 0 | 0.0% |
| 3 or 4 Unit Apartments | 2 | 4.8% |
| 5 to 9 Unit Apartments | 0 | 0.0% |
| 10 or more Apartments | 0 | 0.0% |
| Mobile Home / Other | 1 | 2.4% |
| Total | 42 | 100.0% |
Housing Structures by Occupancy in Dover
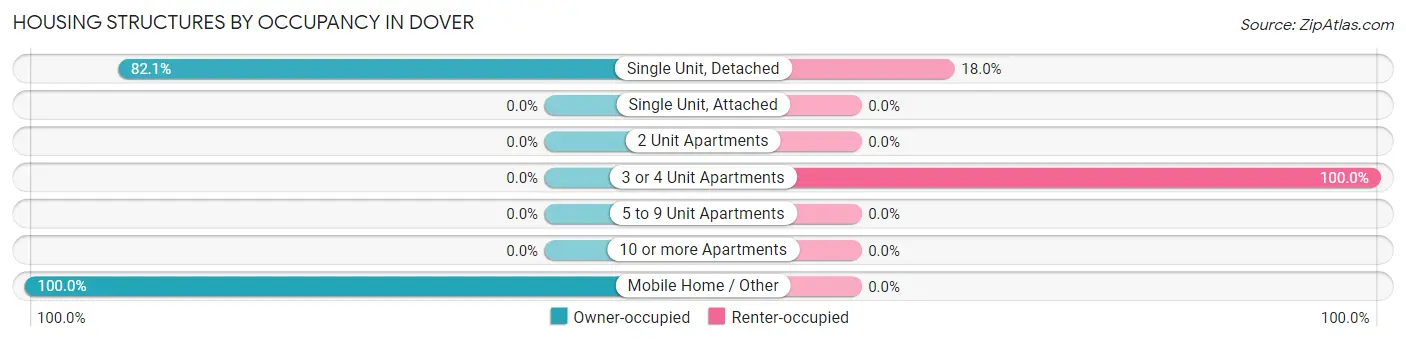
| Structure Type | Owner-occupied | Renter-occupied |
| Single Unit, Detached | 32 (82.1%) | 7 (17.9%) |
| Single Unit, Attached | 0 (0.0%) | 0 (0.0%) |
| 2 Unit Apartments | 0 (0.0%) | 0 (0.0%) |
| 3 or 4 Unit Apartments | 0 (0.0%) | 2 (100.0%) |
| 5 to 9 Unit Apartments | 0 (0.0%) | 0 (0.0%) |
| 10 or more Apartments | 0 (0.0%) | 0 (0.0%) |
| Mobile Home / Other | 1 (100.0%) | 0 (0.0%) |
| Total | 33 (78.6%) | 9 (21.4%) |
Housing Structures by Number of Rooms in Dover
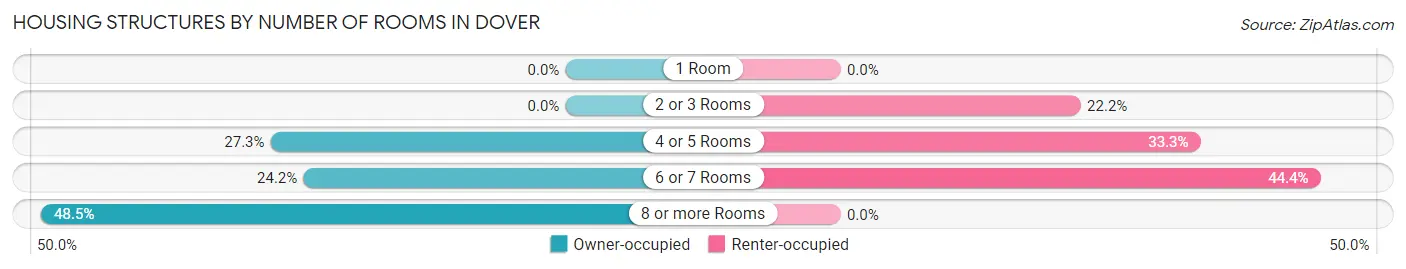
| Number of Rooms | Owner-occupied | Renter-occupied |
| 1 Room | 0 (0.0%) | 0 (0.0%) |
| 2 or 3 Rooms | 0 (0.0%) | 2 (22.2%) |
| 4 or 5 Rooms | 9 (27.3%) | 3 (33.3%) |
| 6 or 7 Rooms | 8 (24.2%) | 4 (44.4%) |
| 8 or more Rooms | 16 (48.5%) | 0 (0.0%) |
| Total | 33 (100.0%) | 9 (100.0%) |
Housing Structure by Heating Type in Dover
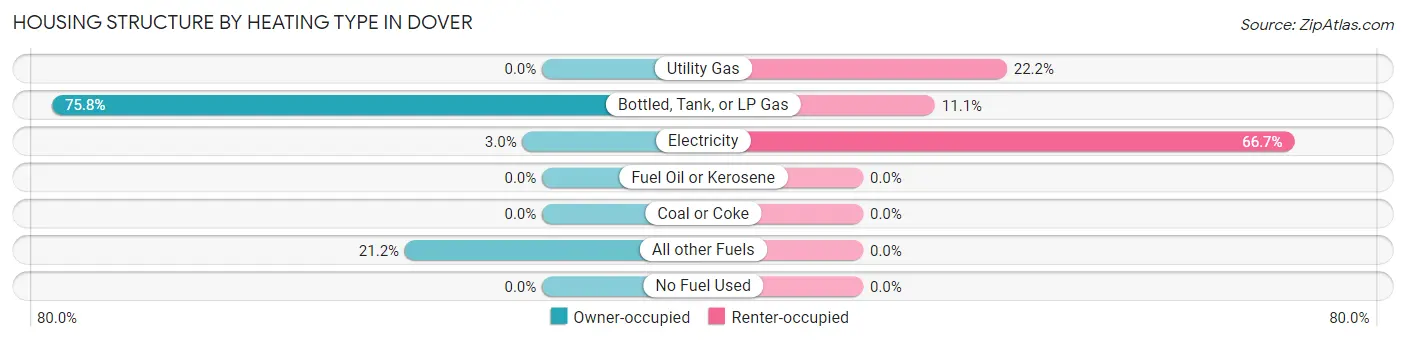
| Heating Type | Owner-occupied | Renter-occupied |
| Utility Gas | 0 (0.0%) | 2 (22.2%) |
| Bottled, Tank, or LP Gas | 25 (75.8%) | 1 (11.1%) |
| Electricity | 1 (3.0%) | 6 (66.7%) |
| Fuel Oil or Kerosene | 0 (0.0%) | 0 (0.0%) |
| Coal or Coke | 0 (0.0%) | 0 (0.0%) |
| All other Fuels | 7 (21.2%) | 0 (0.0%) |
| No Fuel Used | 0 (0.0%) | 0 (0.0%) |
| Total | 33 (100.0%) | 9 (100.0%) |
Household Vehicle Usage in Dover
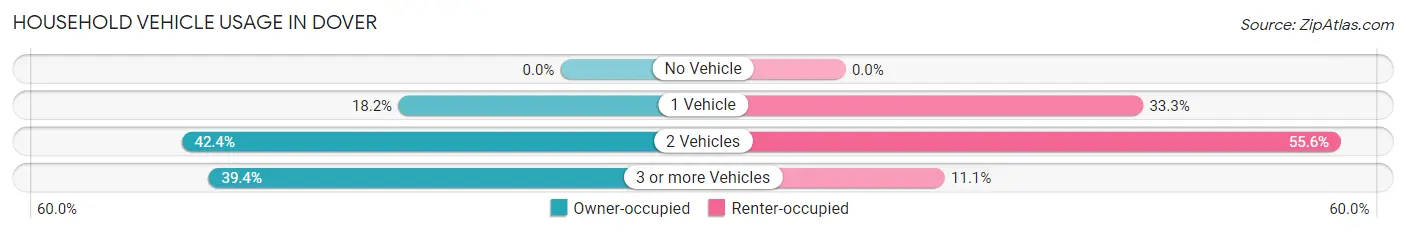
| Vehicles per Household | Owner-occupied | Renter-occupied |
| No Vehicle | 0 (0.0%) | 0 (0.0%) |
| 1 Vehicle | 6 (18.2%) | 3 (33.3%) |
| 2 Vehicles | 14 (42.4%) | 5 (55.6%) |
| 3 or more Vehicles | 13 (39.4%) | 1 (11.1%) |
| Total | 33 (100.0%) | 9 (100.0%) |
Real Estate & Mortgages in Dover
Real Estate and Mortgage Overview in Dover
| Characteristic | Without Mortgage | With Mortgage |
| Housing Units | 20 | 13 |
| Median Property Value | - | - |
| Median Household Income | $29,000 | $8 |
| Monthly Housing Costs | $427 | $0 |
| Real Estate Taxes | $567 | $0 |
Property Value by Mortgage Status in Dover
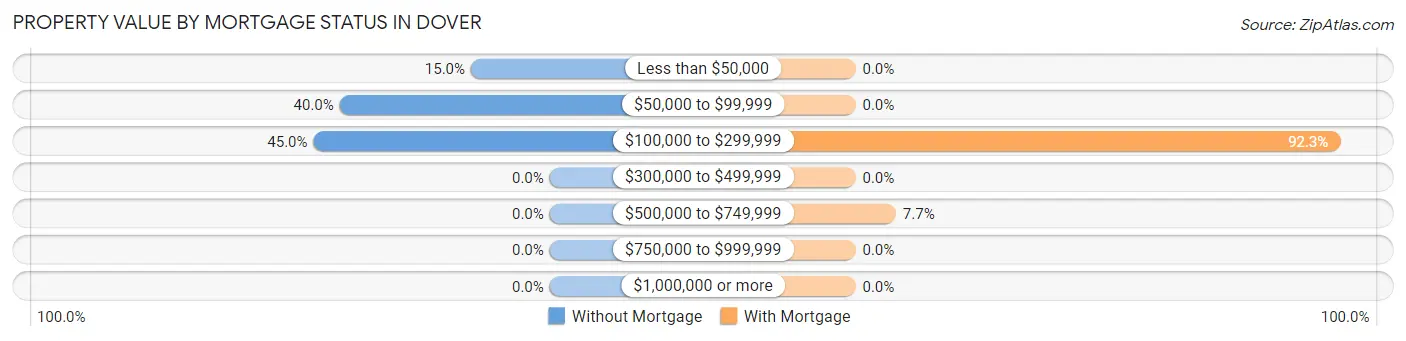
| Property Value | Without Mortgage | With Mortgage |
| Less than $50,000 | 3 (15.0%) | 0 (0.0%) |
| $50,000 to $99,999 | 8 (40.0%) | 0 (0.0%) |
| $100,000 to $299,999 | 9 (45.0%) | 12 (92.3%) |
| $300,000 to $499,999 | 0 (0.0%) | 0 (0.0%) |
| $500,000 to $749,999 | 0 (0.0%) | 1 (7.7%) |
| $750,000 to $999,999 | 0 (0.0%) | 0 (0.0%) |
| $1,000,000 or more | 0 (0.0%) | 0 (0.0%) |
| Total | 20 (100.0%) | 13 (100.0%) |
Household Income by Mortgage Status in Dover
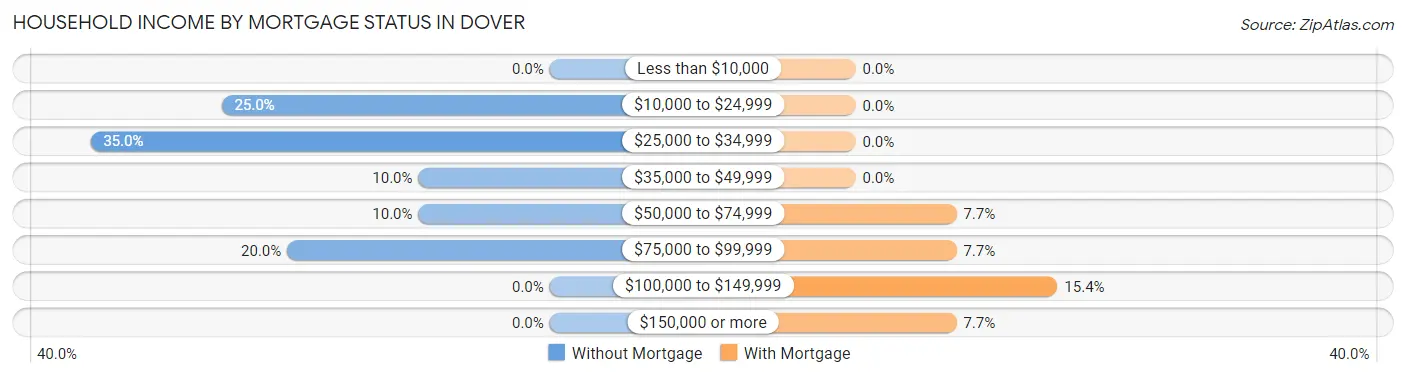
| Household Income | Without Mortgage | With Mortgage |
| Less than $10,000 | 0 (0.0%) | 0 (0.0%) |
| $10,000 to $24,999 | 5 (25.0%) | 0 (0.0%) |
| $25,000 to $34,999 | 7 (35.0%) | 0 (0.0%) |
| $35,000 to $49,999 | 2 (10.0%) | 0 (0.0%) |
| $50,000 to $74,999 | 2 (10.0%) | 1 (7.7%) |
| $75,000 to $99,999 | 4 (20.0%) | 1 (7.7%) |
| $100,000 to $149,999 | 0 (0.0%) | 2 (15.4%) |
| $150,000 or more | 0 (0.0%) | 1 (7.7%) |
| Total | 20 (100.0%) | 13 (100.0%) |
Property Value to Household Income Ratio in Dover
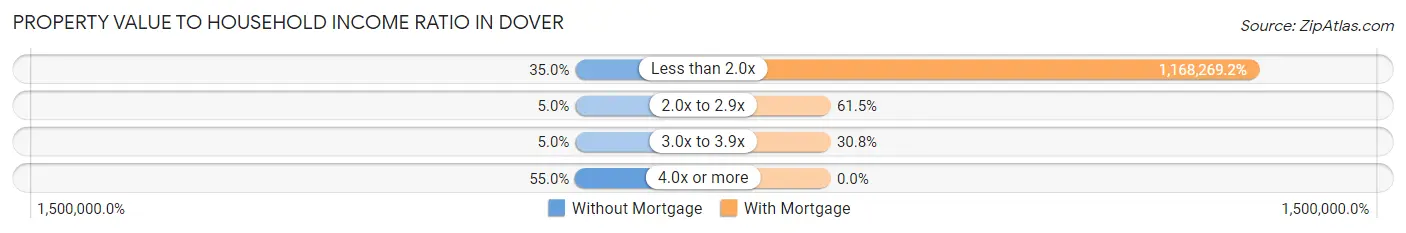
| Value-to-Income Ratio | Without Mortgage | With Mortgage |
| Less than 2.0x | 7 (35.0%) | 151,875 (1,168,269.2%) |
| 2.0x to 2.9x | 1 (5.0%) | 8 (61.5%) |
| 3.0x to 3.9x | 1 (5.0%) | 4 (30.8%) |
| 4.0x or more | 11 (55.0%) | 0 (0.0%) |
| Total | 20 (100.0%) | 13 (100.0%) |
Real Estate Taxes by Mortgage Status in Dover
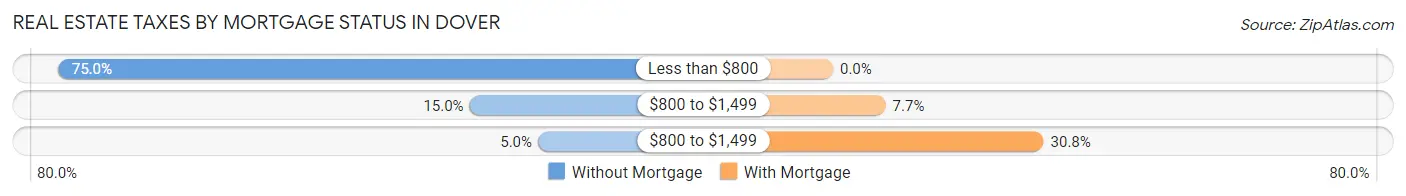
| Property Taxes | Without Mortgage | With Mortgage |
| Less than $800 | 15 (75.0%) | 0 (0.0%) |
| $800 to $1,499 | 3 (15.0%) | 1 (7.7%) |
| $800 to $1,499 | 1 (5.0%) | 4 (30.8%) |
| Total | 20 (100.0%) | 13 (100.0%) |
Health & Disability in Dover
Health Insurance Coverage by Age in Dover
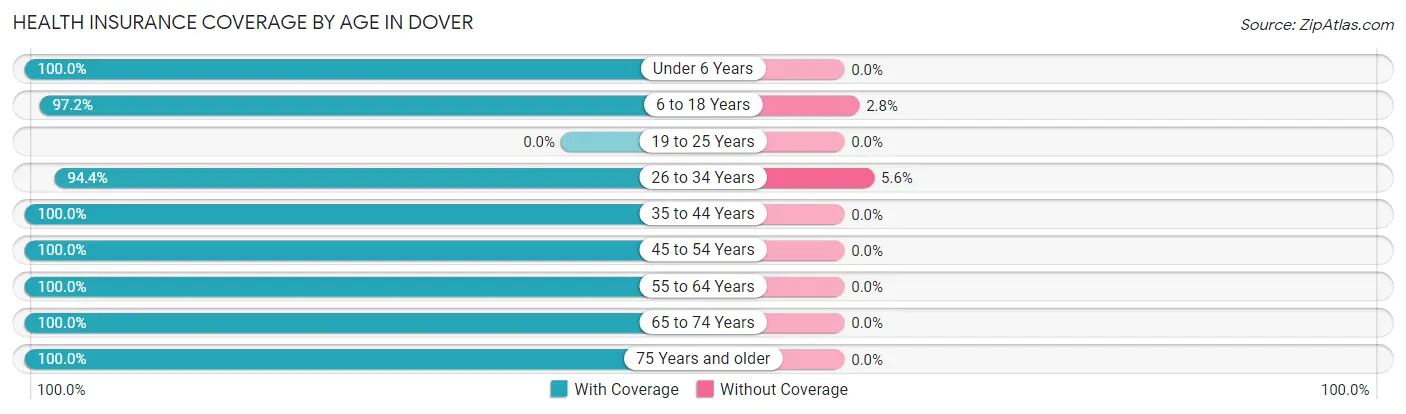
| Age Bracket | With Coverage | Without Coverage |
| Under 6 Years | 12 (100.0%) | 0 (0.0%) |
| 6 to 18 Years | 35 (97.2%) | 1 (2.8%) |
| 19 to 25 Years | 0 (0.0%) | 0 (0.0%) |
| 26 to 34 Years | 17 (94.4%) | 1 (5.6%) |
| 35 to 44 Years | 10 (100.0%) | 0 (0.0%) |
| 45 to 54 Years | 9 (100.0%) | 0 (0.0%) |
| 55 to 64 Years | 17 (100.0%) | 0 (0.0%) |
| 65 to 74 Years | 9 (100.0%) | 0 (0.0%) |
| 75 Years and older | 15 (100.0%) | 0 (0.0%) |
| Total | 124 (98.4%) | 2 (1.6%) |
Health Insurance Coverage by Citizenship Status in Dover
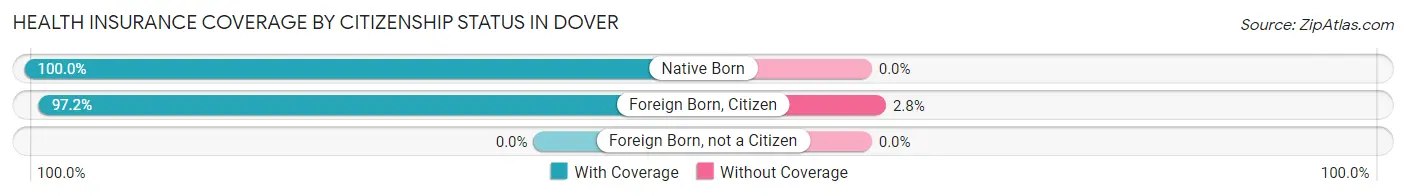
| Citizenship Status | With Coverage | Without Coverage |
| Native Born | 12 (100.0%) | 0 (0.0%) |
| Foreign Born, Citizen | 35 (97.2%) | 1 (2.8%) |
| Foreign Born, not a Citizen | 0 (0.0%) | 0 (0.0%) |
Health Insurance Coverage by Household Income in Dover
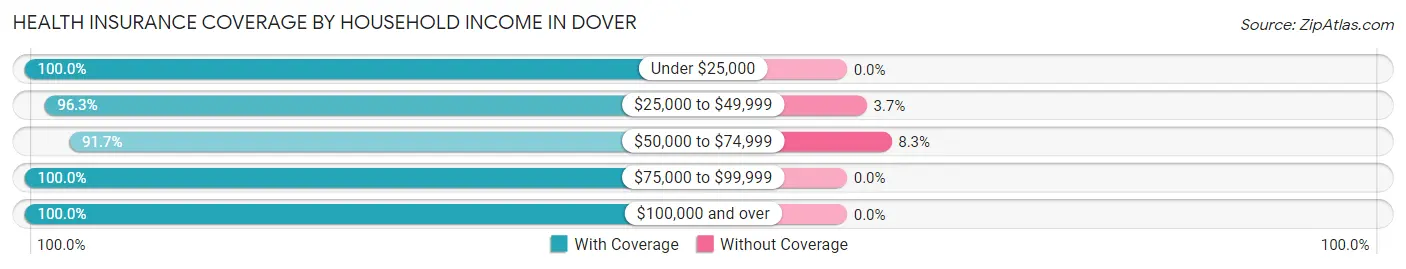
| Household Income | With Coverage | Without Coverage |
| Under $25,000 | 5 (100.0%) | 0 (0.0%) |
| $25,000 to $49,999 | 26 (96.3%) | 1 (3.7%) |
| $50,000 to $74,999 | 11 (91.7%) | 1 (8.3%) |
| $75,000 to $99,999 | 10 (100.0%) | 0 (0.0%) |
| $100,000 and over | 72 (100.0%) | 0 (0.0%) |
Public vs Private Health Insurance Coverage by Age in Dover
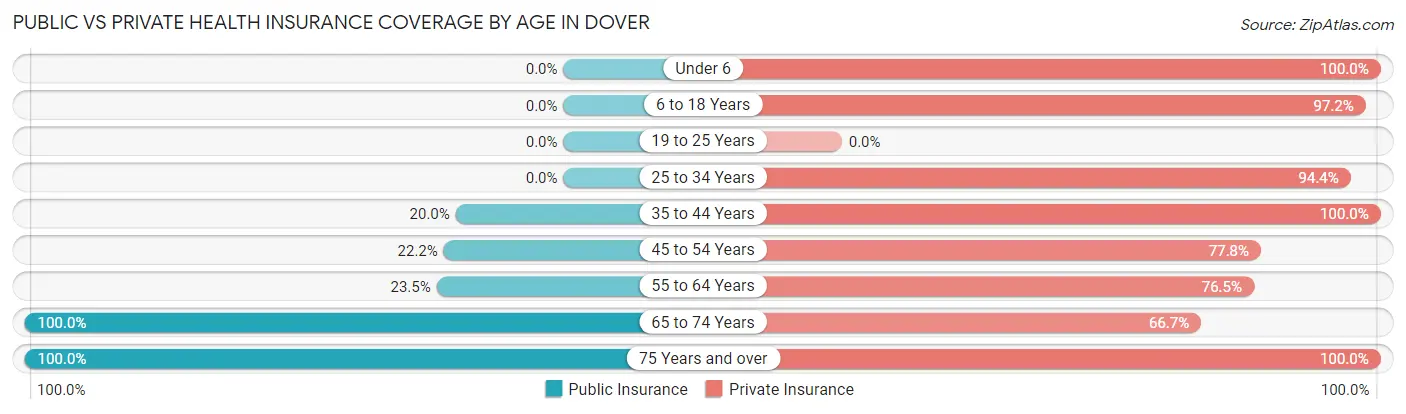
| Age Bracket | Public Insurance | Private Insurance |
| Under 6 | 0 (0.0%) | 12 (100.0%) |
| 6 to 18 Years | 0 (0.0%) | 35 (97.2%) |
| 19 to 25 Years | 0 (0.0%) | 0 (0.0%) |
| 25 to 34 Years | 0 (0.0%) | 17 (94.4%) |
| 35 to 44 Years | 2 (20.0%) | 10 (100.0%) |
| 45 to 54 Years | 2 (22.2%) | 7 (77.8%) |
| 55 to 64 Years | 4 (23.5%) | 13 (76.5%) |
| 65 to 74 Years | 9 (100.0%) | 6 (66.7%) |
| 75 Years and over | 15 (100.0%) | 15 (100.0%) |
| Total | 32 (25.4%) | 115 (91.3%) |
Disability Status by Sex by Age in Dover
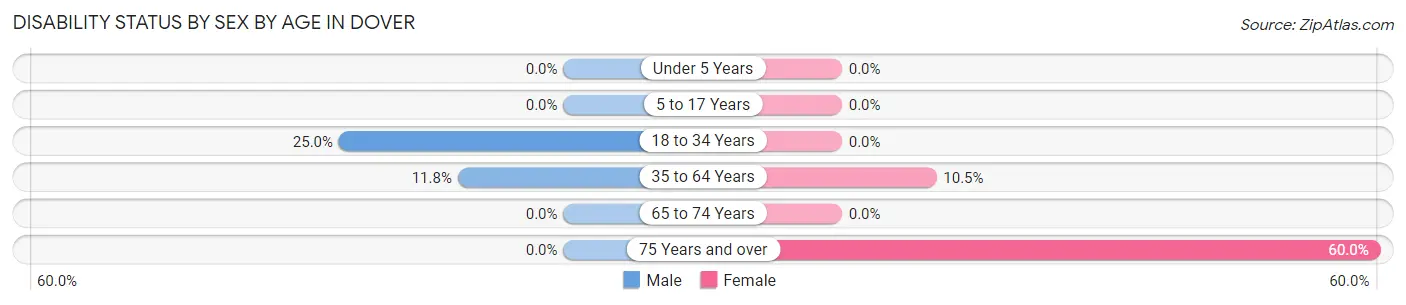
| Age Bracket | Male | Female |
| Under 5 Years | 0 (0.0%) | 0 (0.0%) |
| 5 to 17 Years | 0 (0.0%) | 0 (0.0%) |
| 18 to 34 Years | 1 (25.0%) | 0 (0.0%) |
| 35 to 64 Years | 2 (11.8%) | 2 (10.5%) |
| 65 to 74 Years | 0 (0.0%) | 0 (0.0%) |
| 75 Years and over | 0 (0.0%) | 3 (60.0%) |
Disability Class by Sex by Age in Dover
Disability Class: Hearing Difficulty
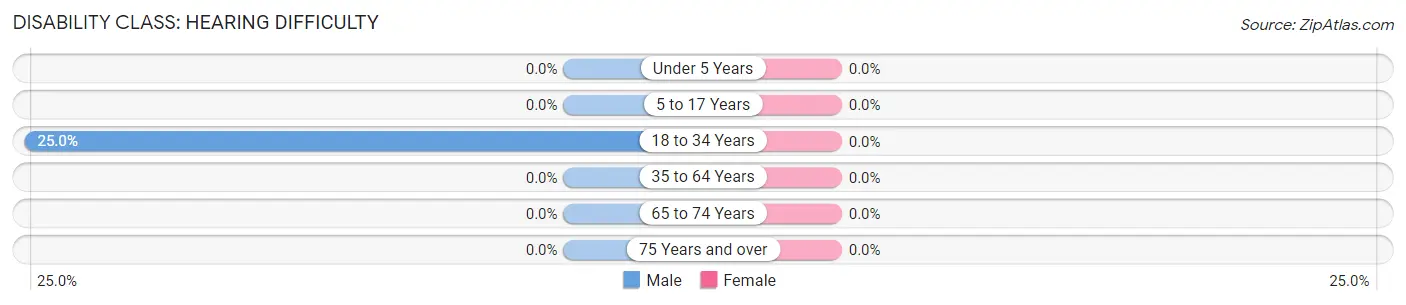
| Age Bracket | Male | Female |
| Under 5 Years | 0 (0.0%) | 0 (0.0%) |
| 5 to 17 Years | 0 (0.0%) | 0 (0.0%) |
| 18 to 34 Years | 1 (25.0%) | 0 (0.0%) |
| 35 to 64 Years | 0 (0.0%) | 0 (0.0%) |
| 65 to 74 Years | 0 (0.0%) | 0 (0.0%) |
| 75 Years and over | 0 (0.0%) | 0 (0.0%) |
Disability Class: Vision Difficulty
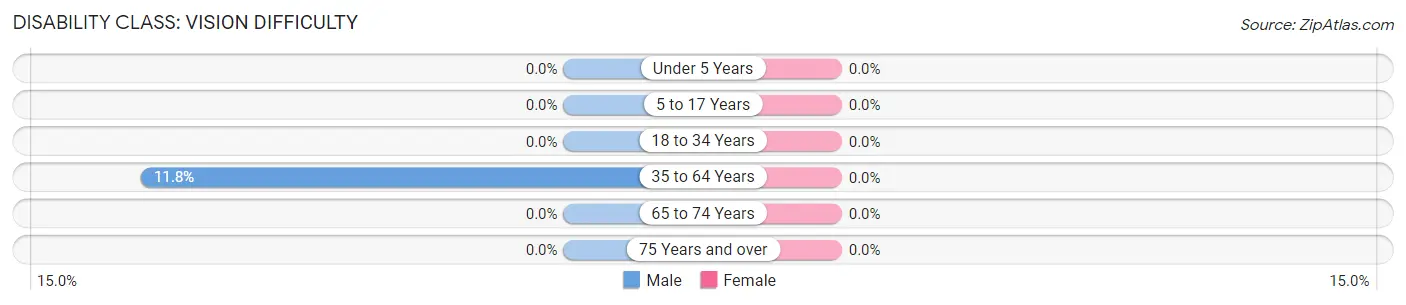
| Age Bracket | Male | Female |
| Under 5 Years | 0 (0.0%) | 0 (0.0%) |
| 5 to 17 Years | 0 (0.0%) | 0 (0.0%) |
| 18 to 34 Years | 0 (0.0%) | 0 (0.0%) |
| 35 to 64 Years | 2 (11.8%) | 0 (0.0%) |
| 65 to 74 Years | 0 (0.0%) | 0 (0.0%) |
| 75 Years and over | 0 (0.0%) | 0 (0.0%) |
Disability Class: Cognitive Difficulty
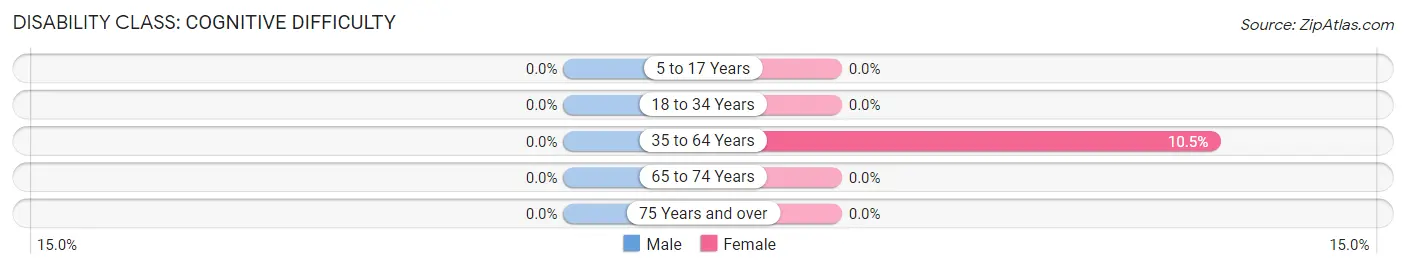
| Age Bracket | Male | Female |
| 5 to 17 Years | 0 (0.0%) | 0 (0.0%) |
| 18 to 34 Years | 0 (0.0%) | 0 (0.0%) |
| 35 to 64 Years | 0 (0.0%) | 2 (10.5%) |
| 65 to 74 Years | 0 (0.0%) | 0 (0.0%) |
| 75 Years and over | 0 (0.0%) | 0 (0.0%) |
Disability Class: Ambulatory Difficulty
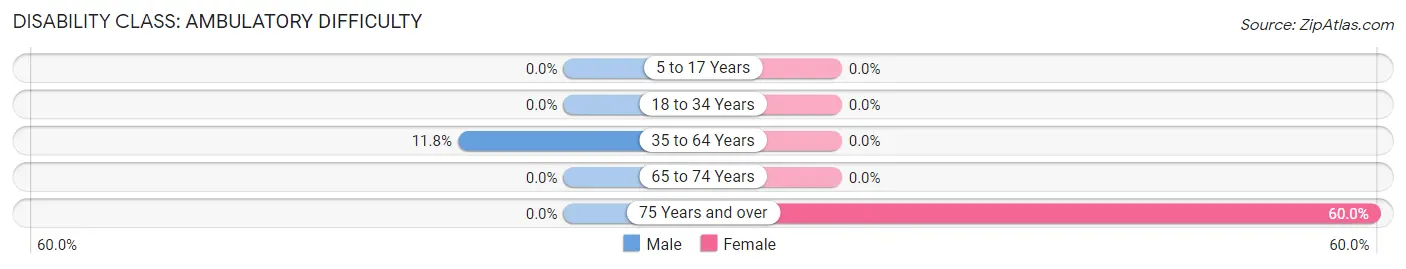
| Age Bracket | Male | Female |
| 5 to 17 Years | 0 (0.0%) | 0 (0.0%) |
| 18 to 34 Years | 0 (0.0%) | 0 (0.0%) |
| 35 to 64 Years | 2 (11.8%) | 0 (0.0%) |
| 65 to 74 Years | 0 (0.0%) | 0 (0.0%) |
| 75 Years and over | 0 (0.0%) | 3 (60.0%) |
Disability Class: Self-Care Difficulty
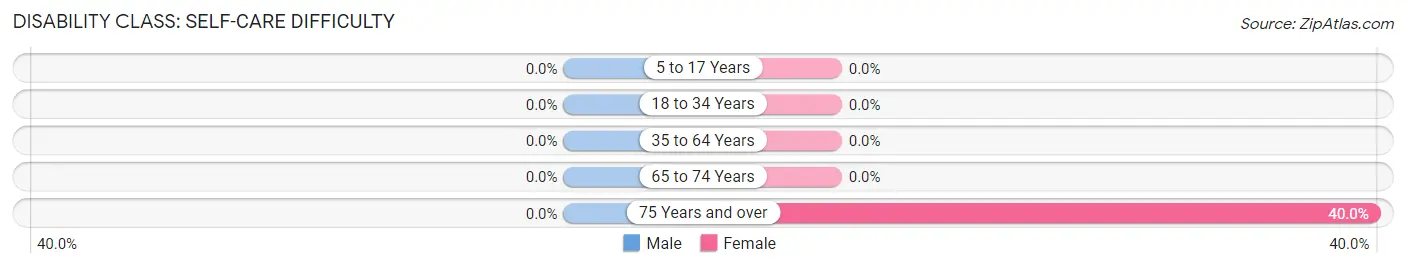
| Age Bracket | Male | Female |
| 5 to 17 Years | 0 (0.0%) | 0 (0.0%) |
| 18 to 34 Years | 0 (0.0%) | 0 (0.0%) |
| 35 to 64 Years | 0 (0.0%) | 0 (0.0%) |
| 65 to 74 Years | 0 (0.0%) | 0 (0.0%) |
| 75 Years and over | 0 (0.0%) | 2 (40.0%) |
Technology Access in Dover
Computing Device Access in Dover
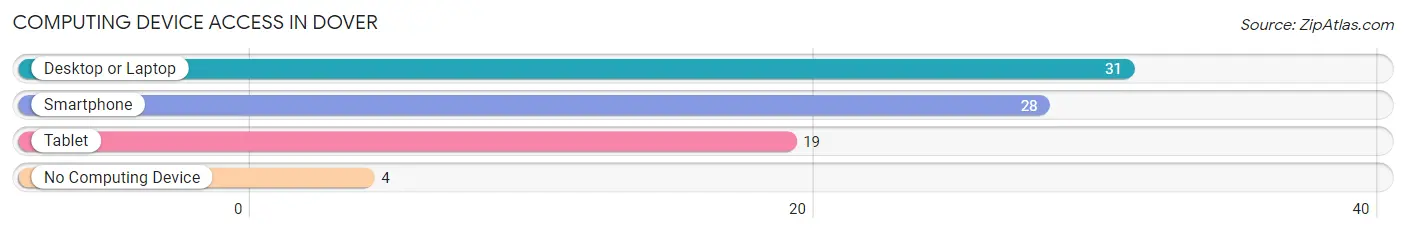
| Device Type | # Households | % Households |
| Desktop or Laptop | 31 | 73.8% |
| Smartphone | 28 | 66.7% |
| Tablet | 19 | 45.2% |
| No Computing Device | 4 | 9.5% |
| Total | 42 | 100.0% |
Internet Access in Dover
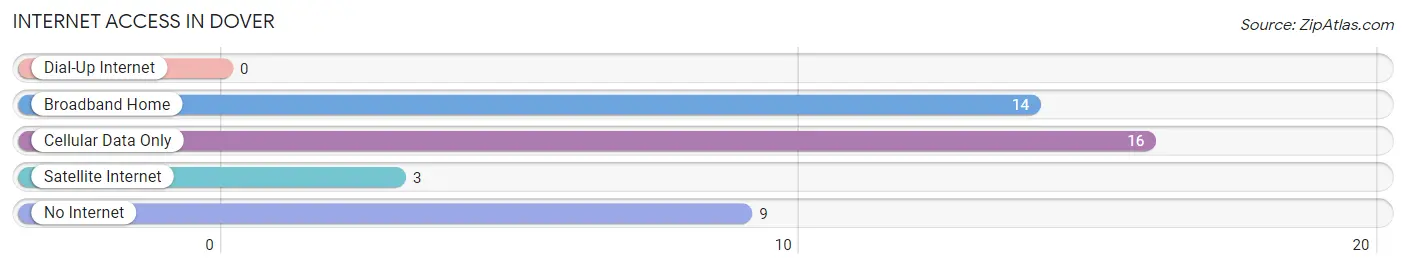
| Internet Type | # Households | % Households |
| Dial-Up Internet | 0 | 0.0% |
| Broadband Home | 14 | 33.3% |
| Cellular Data Only | 16 | 38.1% |
| Satellite Internet | 3 | 7.1% |
| No Internet | 9 | 21.4% |
| Total | 42 | 100.0% |
Dover Summary
Dover, Missouri is a small town located in the southeastern corner of St. Charles County, Missouri. It is situated on the banks of the Missouri River, just north of the city of St. Louis. The town was founded in 1819 and has a population of approximately 1,000 people.
Geography
Dover is located in the southeastern corner of St. Charles County, Missouri. It is situated on the banks of the Missouri River, just north of the city of St. Louis. The town is located in the Missouri River Valley, which is a major agricultural region. The town is surrounded by rolling hills and is home to several small lakes and ponds. The town is located in a temperate climate, with hot summers and cold winters.
Economy
Dover’s economy is largely based on agriculture. The town is home to several farms, which produce a variety of crops, including corn, soybeans, wheat, and hay. The town also has a few small businesses, including a grocery store, a hardware store, and a few restaurants.
Demographics
As of the 2010 census, Dover had a population of 1,000 people. The town is predominantly white, with a small African American population. The median household income is $45,000, and the median home value is $150,000.
History
Dover was founded in 1819 by a group of settlers from Kentucky. The town was originally known as “Dover’s Landing”, and was a popular stop for steamboats traveling up and down the Missouri River. The town was officially incorporated in 1837, and the first post office was established in 1841.
In the late 19th century, Dover was a popular destination for tourists, who came to enjoy the town’s natural beauty and the nearby Missouri River. The town was also home to several factories, which produced a variety of goods, including furniture, clothing, and shoes.
In the early 20th century, Dover experienced a period of decline, as the factories closed and the population dwindled. However, in recent years, the town has experienced a resurgence, as new businesses have opened and the population has grown.
Today, Dover is a small, quiet town with a strong sense of community. The town is home to several parks and recreational areas, and is a popular destination for outdoor enthusiasts. The town is also home to several historic sites, including the Dover Cemetery, which dates back to the early 19th century.
Common Questions
What is Per Capita Income in Dover?
Per Capita income in Dover is $26,913.
What is the Median Household income in Dover?
Median Household Income in Dover is $50,833.
What is Inequality or Gini Index in Dover?
Inequality or Gini Index in Dover is 0.40.
What is the Total Population of Dover?
Total Population of Dover is 126.
What is the Total Male Population of Dover?
Total Male Population of Dover is 48.
What is the Total Female Population of Dover?
Total Female Population of Dover is 78.
What is the Ratio of Males per 100 Females in Dover?
There are 61.54 Males per 100 Females in Dover.
What is the Ratio of Females per 100 Males in Dover?
There are 162.50 Females per 100 Males in Dover.
What is the Median Population Age in Dover?
Median Population Age in Dover is 33.8 Years.
What is the Average Family Size in Dover
Average Family Size in Dover is 4.2 People.
What is the Average Household Size in Dover
Average Household Size in Dover is 3.0 People.
How Large is the Labor Force in Dover?
There are 37 People in the Labor Forcein in Dover.
What is the Percentage of People in the Labor Force in Dover?
46.8% of People are in the Labor Force in Dover.
What is the Unemployment Rate in Dover?
Unemployment Rate in Dover is 2.7%.