Wright County, MO Map & Demographics
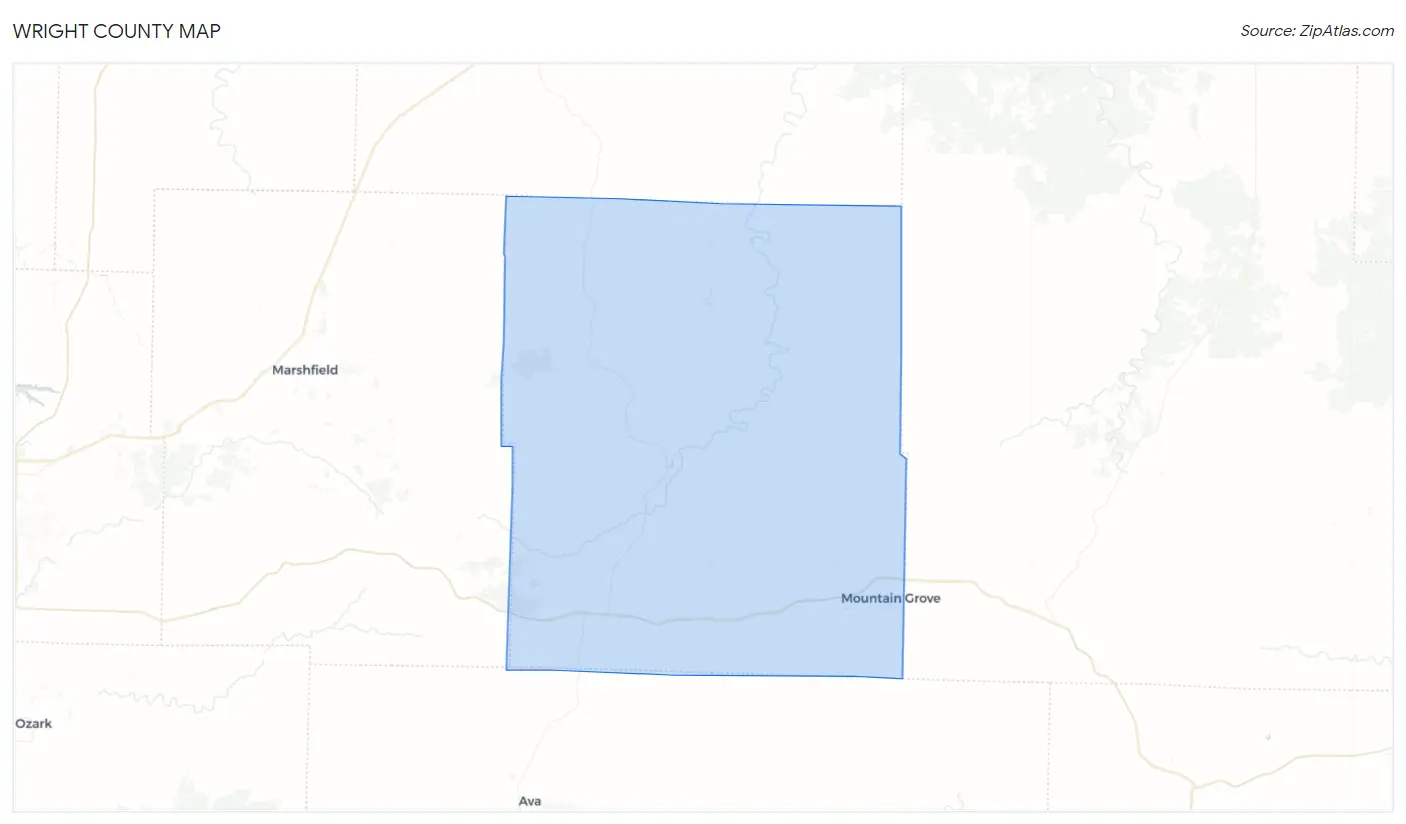
Wright County Map
Wright County Overview
$22,602
PER CAPITA INCOME
$51,265
AVG FAMILY INCOME
$43,573
AVG HOUSEHOLD INCOME
32.7%
WAGE / INCOME GAP [ % ]
67.3¢/ $1
WAGE / INCOME GAP [ $ ]
$9,783
FAMILY INCOME DEFICIT
0.43
INEQUALITY / GINI INDEX
18,475
TOTAL POPULATION
9,137
MALE POPULATION
9,338
FEMALE POPULATION
97.85
MALES / 100 FEMALES
102.20
FEMALES / 100 MALES
41.1
MEDIAN AGE
3.2
AVG FAMILY SIZE
2.7
AVG HOUSEHOLD SIZE
7,214
LABOR FORCE [ PEOPLE ]
50.6%
PERCENT IN LABOR FORCE
4.8%
UNEMPLOYMENT RATE
Wright County Area Codes
Income in Wright County
Income Overview in Wright County
Per Capita Income in Wright County is $22,602, while median incomes of families and households are $51,265 and $43,573 respectively.
| Characteristic | Number | Measure |
| Per Capita Income | 18,475 | $22,602 |
| Median Family Income | 4,653 | $51,265 |
| Mean Family Income | 4,653 | $67,119 |
| Median Household Income | 6,825 | $43,573 |
| Mean Household Income | 6,825 | $56,971 |
| Income Deficit | 4,653 | $9,783 |
| Wage / Income Gap (%) | 18,475 | 32.70% |
| Wage / Income Gap ($) | 18,475 | 67.30¢ per $1 |
| Gini / Inequality Index | 18,475 | 0.43 |
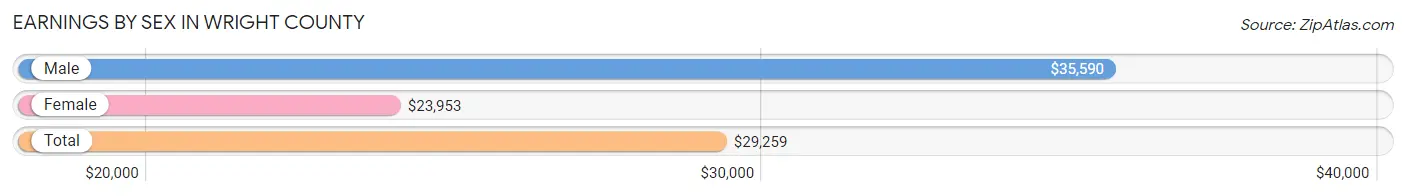
Earnings by Sex in Wright County
Average Earnings in Wright County are $29,259, $35,590 for men and $23,953 for women, a difference of 32.7%.
| Sex | Number | Average Earnings |
| Male | 4,090 (53.0%) | $35,590 |
| Female | 3,633 (47.0%) | $23,953 |
| Total | 7,723 (100.0%) | $29,259 |
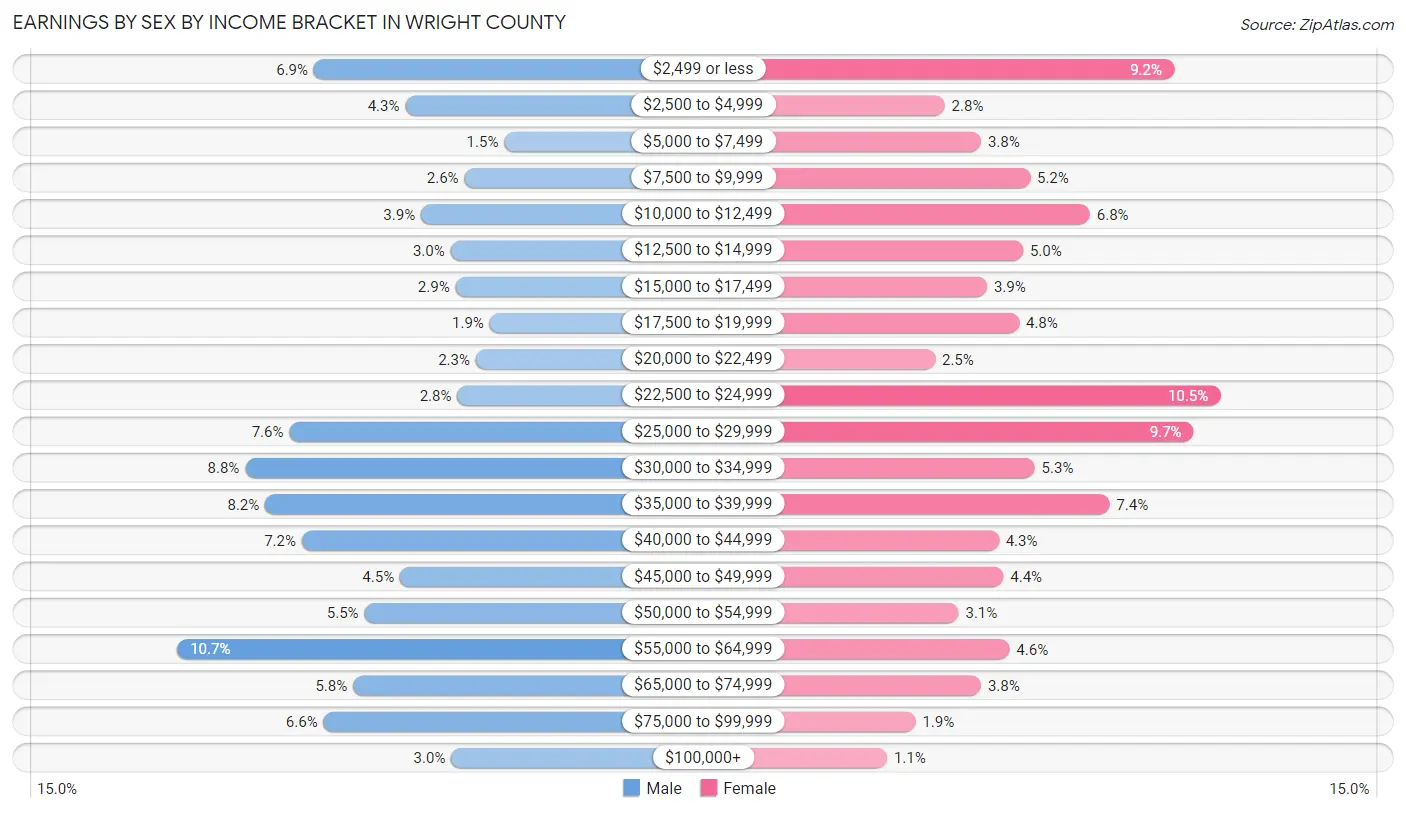
Earnings by Sex by Income Bracket in Wright County
The most common earnings brackets in Wright County are $55,000 to $64,999 for men (438 | 10.7%) and $22,500 to $24,999 for women (381 | 10.5%).
| Income | Male | Female |
| $2,499 or less | 281 (6.9%) | 334 (9.2%) |
| $2,500 to $4,999 | 176 (4.3%) | 100 (2.8%) |
| $5,000 to $7,499 | 62 (1.5%) | 137 (3.8%) |
| $7,500 to $9,999 | 108 (2.6%) | 187 (5.1%) |
| $10,000 to $12,499 | 158 (3.9%) | 248 (6.8%) |
| $12,500 to $14,999 | 124 (3.0%) | 180 (5.0%) |
| $15,000 to $17,499 | 118 (2.9%) | 143 (3.9%) |
| $17,500 to $19,999 | 79 (1.9%) | 176 (4.8%) |
| $20,000 to $22,499 | 95 (2.3%) | 90 (2.5%) |
| $22,500 to $24,999 | 116 (2.8%) | 381 (10.5%) |
| $25,000 to $29,999 | 309 (7.6%) | 354 (9.7%) |
| $30,000 to $34,999 | 360 (8.8%) | 192 (5.3%) |
| $35,000 to $39,999 | 337 (8.2%) | 268 (7.4%) |
| $40,000 to $44,999 | 295 (7.2%) | 155 (4.3%) |
| $45,000 to $49,999 | 182 (4.4%) | 160 (4.4%) |
| $50,000 to $54,999 | 223 (5.4%) | 114 (3.1%) |
| $55,000 to $64,999 | 438 (10.7%) | 166 (4.6%) |
| $65,000 to $74,999 | 236 (5.8%) | 137 (3.8%) |
| $75,000 to $99,999 | 270 (6.6%) | 70 (1.9%) |
| $100,000+ | 123 (3.0%) | 41 (1.1%) |
| Total | 4,090 (100.0%) | 3,633 (100.0%) |
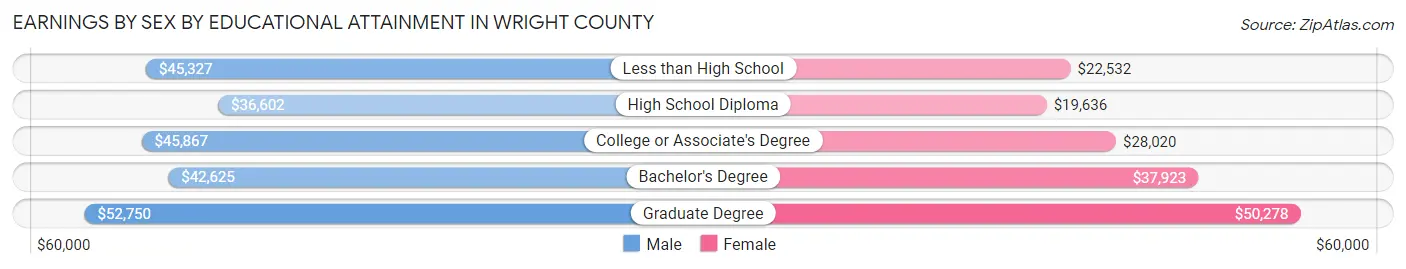
Earnings by Sex by Educational Attainment in Wright County
Average earnings in Wright County are $40,540 for men and $26,442 for women, a difference of 34.8%. Men with an educational attainment of graduate degree enjoy the highest average annual earnings of $52,750, while those with high school diploma education earn the least with $36,602. Women with an educational attainment of graduate degree earn the most with the average annual earnings of $50,278, while those with high school diploma education have the smallest earnings of $19,636.
| Educational Attainment | Male Income | Female Income |
| Less than High School | $45,327 | $22,532 |
| High School Diploma | $36,602 | $19,636 |
| College or Associate's Degree | $45,867 | $28,020 |
| Bachelor's Degree | $42,625 | $37,923 |
| Graduate Degree | $52,750 | $50,278 |
| Total | $40,540 | $26,442 |
Family Income in Wright County
Family Income Brackets in Wright County
According to the Wright County family income data, there are 893 families falling into the $35,000 to $49,999 income range, which is the most common income bracket and makes up 19.2% of all families. Conversely, the $10,000 to $14,999 income bracket is the least frequent group with only 79 families (1.7%) belonging to this category.
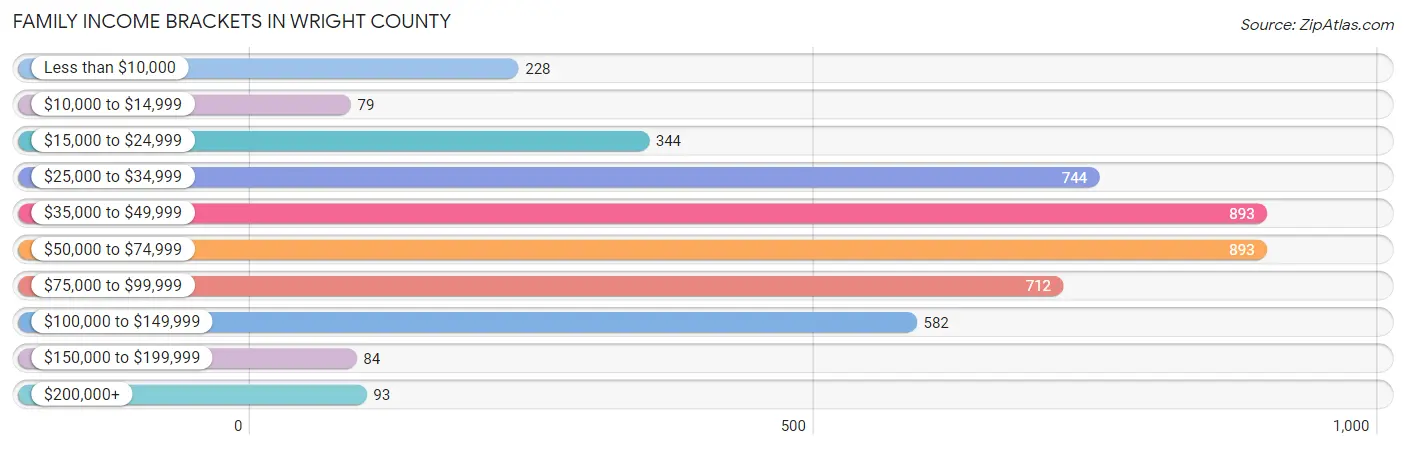
| Income Bracket | # Families | % Families |
| Less than $10,000 | 228 | 4.9% |
| $10,000 to $14,999 | 79 | 1.7% |
| $15,000 to $24,999 | 344 | 7.4% |
| $25,000 to $34,999 | 744 | 16.0% |
| $35,000 to $49,999 | 893 | 19.2% |
| $50,000 to $74,999 | 893 | 19.2% |
| $75,000 to $99,999 | 712 | 15.3% |
| $100,000 to $149,999 | 582 | 12.5% |
| $150,000 to $199,999 | 84 | 1.8% |
| $200,000+ | 93 | 2.0% |
Family Income by Famaliy Size in Wright County
5-person families (400 | 8.6%) account for the highest median family income in Wright County with $70,278 per family, while 2-person families (2,560 | 55.0%) have the highest median income of $24,107 per family member.
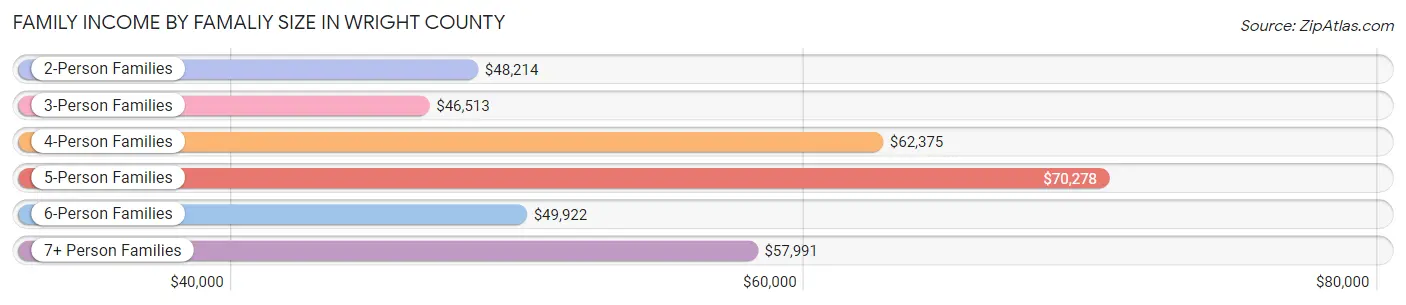
| Income Bracket | # Families | Median Income |
| 2-Person Families | 2,560 (55.0%) | $48,214 |
| 3-Person Families | 919 (19.8%) | $46,513 |
| 4-Person Families | 564 (12.1%) | $62,375 |
| 5-Person Families | 400 (8.6%) | $70,278 |
| 6-Person Families | 105 (2.3%) | $49,922 |
| 7+ Person Families | 105 (2.3%) | $57,991 |
| Total | 4,653 (100.0%) | $51,265 |
Family Income by Number of Earners in Wright County
The median family income in Wright County is $51,265, with families comprising 3+ earners (225) having the highest median family income of $95,795, while families with 1 earner (1,704) have the lowest median family income of $40,663, accounting for 4.8% and 36.6% of families, respectively.
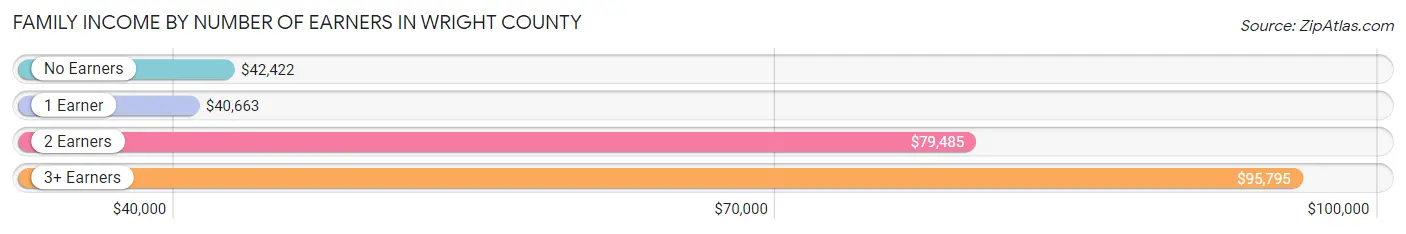
| Number of Earners | # Families | Median Income |
| No Earners | 1,118 (24.0%) | $42,422 |
| 1 Earner | 1,704 (36.6%) | $40,663 |
| 2 Earners | 1,606 (34.5%) | $79,485 |
| 3+ Earners | 225 (4.8%) | $95,795 |
| Total | 4,653 (100.0%) | $51,265 |
Household Income in Wright County
Household Income Brackets in Wright County
With 1,283 households falling in the category, the $35,000 to $49,999 income range is the most frequent in Wright County, accounting for 18.8% of all households. In contrast, only 89 households (1.3%) fall into the $150,000 to $199,999 income bracket, making it the least populous group.
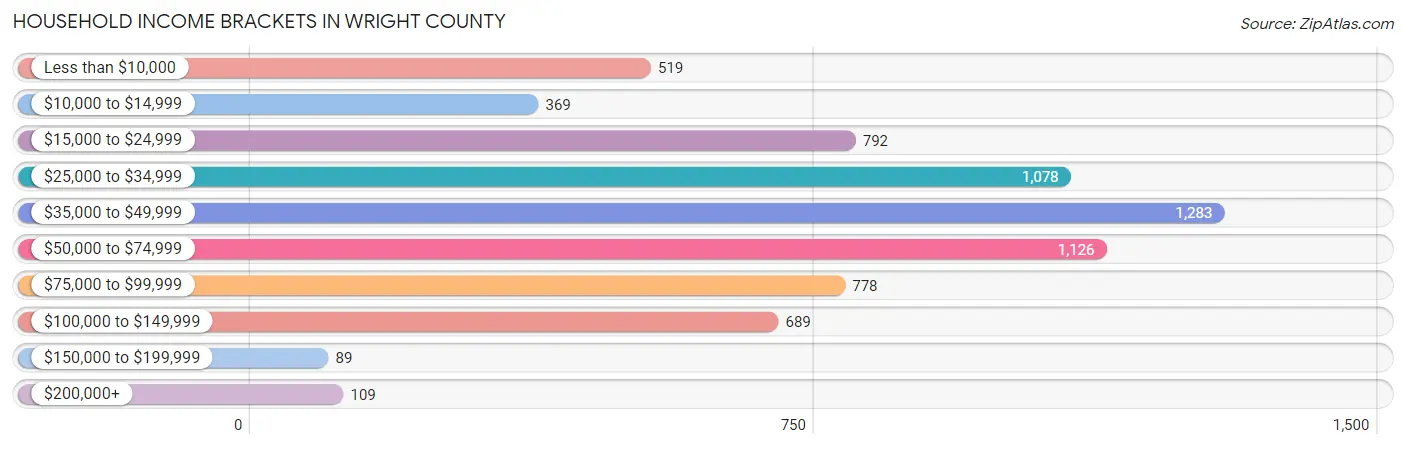
| Income Bracket | # Households | % Households |
| Less than $10,000 | 519 | 7.6% |
| $10,000 to $14,999 | 369 | 5.4% |
| $15,000 to $24,999 | 792 | 11.6% |
| $25,000 to $34,999 | 1,078 | 15.8% |
| $35,000 to $49,999 | 1,283 | 18.8% |
| $50,000 to $74,999 | 1,126 | 16.5% |
| $75,000 to $99,999 | 778 | 11.4% |
| $100,000 to $149,999 | 689 | 10.1% |
| $150,000 to $199,999 | 89 | 1.3% |
| $200,000+ | 109 | 1.6% |
Household Income by Householder Age in Wright County
The median household income in Wright County is $43,573, with the highest median household income of $55,307 found in the 45 to 64 years age bracket for the primary householder. A total of 2,447 households (35.8%) fall into this category. Meanwhile, the 15 to 24 years age bracket for the primary householder has the lowest median household income of $31,118, with 238 households (3.5%) in this group.
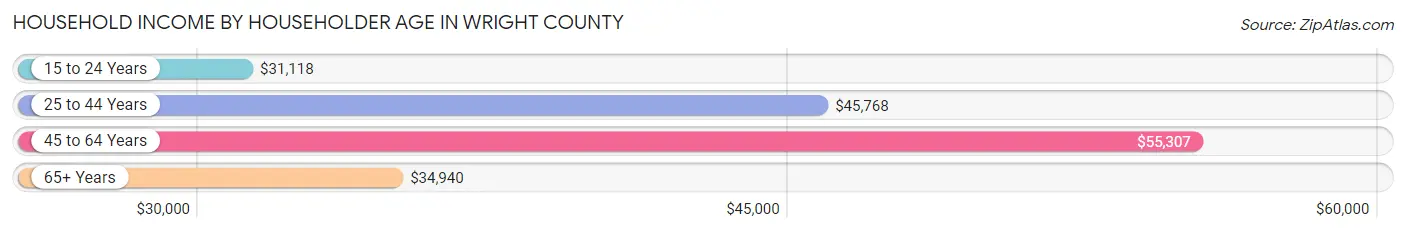
| Income Bracket | # Households | Median Income |
| 15 to 24 Years | 238 (3.5%) | $31,118 |
| 25 to 44 Years | 1,949 (28.6%) | $45,768 |
| 45 to 64 Years | 2,447 (35.8%) | $55,307 |
| 65+ Years | 2,191 (32.1%) | $34,940 |
| Total | 6,825 (100.0%) | $43,573 |
Poverty in Wright County
Income Below Poverty by Sex and Age in Wright County
With 20.7% poverty level for males and 20.0% for females among the residents of Wright County, under 5 year old males and 5 year old females are the most vulnerable to poverty, with 269 males (46.9%) and 88 females (68.2%) in their respective age groups living below the poverty level.
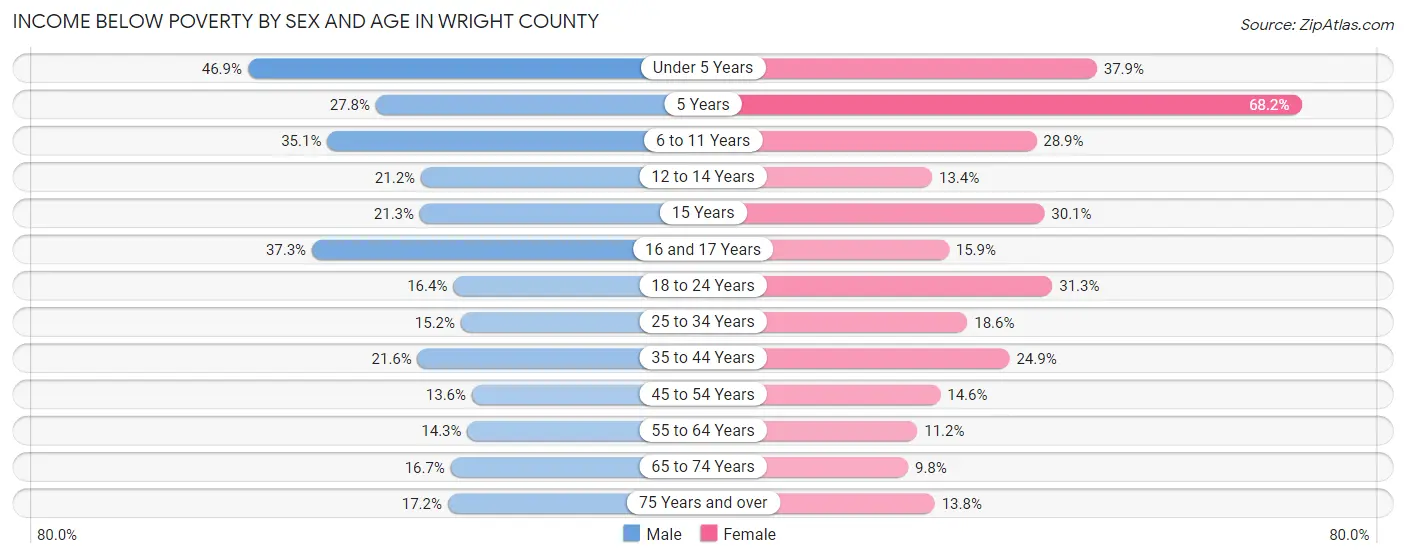
| Age Bracket | Male | Female |
| Under 5 Years | 269 (46.9%) | 203 (37.9%) |
| 5 Years | 27 (27.8%) | 88 (68.2%) |
| 6 to 11 Years | 244 (35.1%) | 238 (28.9%) |
| 12 to 14 Years | 96 (21.1%) | 43 (13.4%) |
| 15 Years | 39 (21.3%) | 40 (30.1%) |
| 16 and 17 Years | 81 (37.3%) | 58 (15.9%) |
| 18 to 24 Years | 119 (16.4%) | 236 (31.3%) |
| 25 to 34 Years | 158 (15.2%) | 173 (18.6%) |
| 35 to 44 Years | 208 (21.6%) | 246 (24.9%) |
| 45 to 54 Years | 139 (13.6%) | 153 (14.6%) |
| 55 to 64 Years | 175 (14.2%) | 141 (11.2%) |
| 65 to 74 Years | 164 (16.7%) | 106 (9.8%) |
| 75 Years and over | 116 (17.2%) | 114 (13.8%) |
| Total | 1,835 (20.7%) | 1,839 (20.0%) |
Income Above Poverty by Sex and Age in Wright County
According to the poverty statistics in Wright County, males aged 45 to 54 years and females aged 65 to 74 years are the age groups that are most secure financially, with 86.4% of males and 90.2% of females in these age groups living above the poverty line.
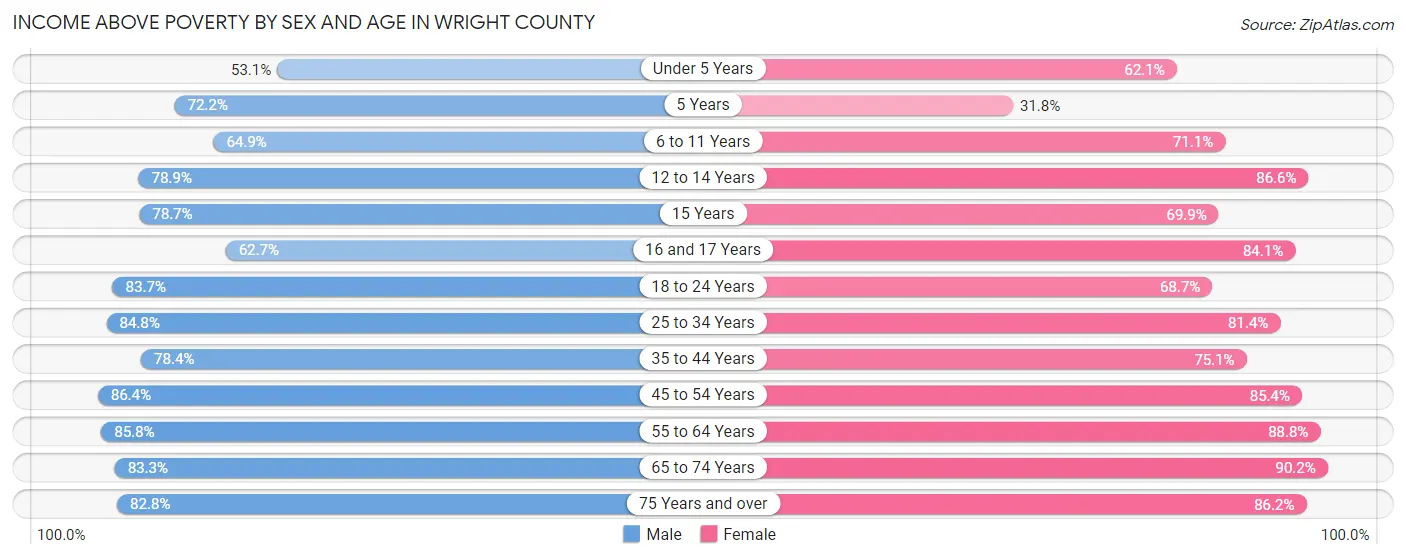
| Age Bracket | Male | Female |
| Under 5 Years | 305 (53.1%) | 333 (62.1%) |
| 5 Years | 70 (72.2%) | 41 (31.8%) |
| 6 to 11 Years | 452 (64.9%) | 586 (71.1%) |
| 12 to 14 Years | 358 (78.8%) | 278 (86.6%) |
| 15 Years | 144 (78.7%) | 93 (69.9%) |
| 16 and 17 Years | 136 (62.7%) | 307 (84.1%) |
| 18 to 24 Years | 609 (83.7%) | 519 (68.7%) |
| 25 to 34 Years | 880 (84.8%) | 755 (81.4%) |
| 35 to 44 Years | 753 (78.4%) | 742 (75.1%) |
| 45 to 54 Years | 884 (86.4%) | 893 (85.4%) |
| 55 to 64 Years | 1,053 (85.8%) | 1,117 (88.8%) |
| 65 to 74 Years | 816 (83.3%) | 971 (90.2%) |
| 75 Years and over | 560 (82.8%) | 712 (86.2%) |
| Total | 7,020 (79.3%) | 7,347 (80.0%) |
Income Below Poverty Among Married-Couple Families in Wright County
The poverty statistics for married-couple families in Wright County show that 8.2% or 300 of the total 3,659 families live below the poverty line. Families with 5 or more children have the highest poverty rate of 73.3%, comprising of 55 families. On the other hand, families with no children have the lowest poverty rate of 4.7%, which includes 105 families.
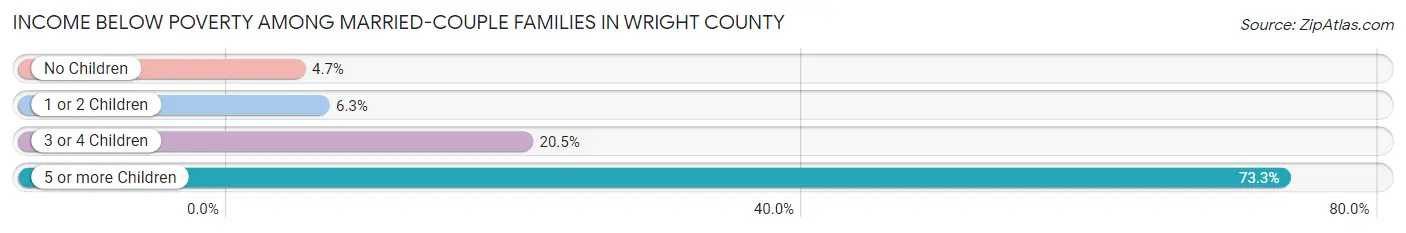
| Children | Above Poverty | Below Poverty |
| No Children | 2,142 (95.3%) | 105 (4.7%) |
| 1 or 2 Children | 887 (93.7%) | 60 (6.3%) |
| 3 or 4 Children | 310 (79.5%) | 80 (20.5%) |
| 5 or more Children | 20 (26.7%) | 55 (73.3%) |
| Total | 3,359 (91.8%) | 300 (8.2%) |
Income Below Poverty Among Single-Parent Households in Wright County
According to the poverty data in Wright County, 17.9% or 48 single-father households and 39.0% or 283 single-mother households are living below the poverty line. Among single-father households, those with 5 or more children have the highest poverty rate, with 2 households (100.0%) experiencing poverty. Likewise, among single-mother households, those with 3 or 4 children have the highest poverty rate, with 66 households (72.5%) falling below the poverty line.
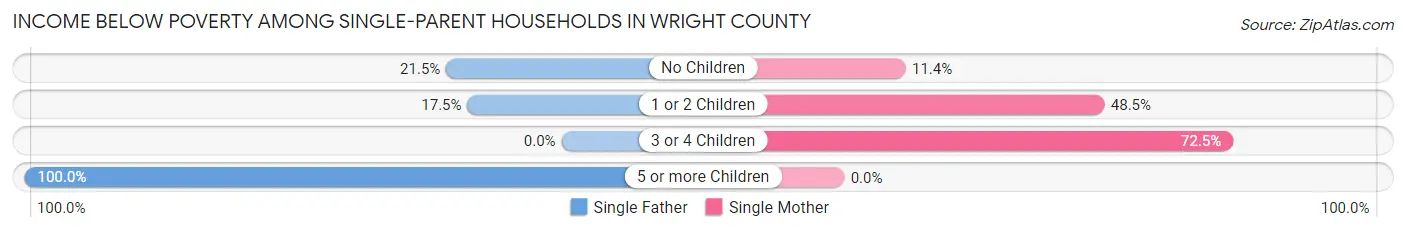
| Children | Single Father | Single Mother |
| No Children | 29 (21.5%) | 28 (11.4%) |
| 1 or 2 Children | 17 (17.5%) | 189 (48.5%) |
| 3 or 4 Children | 0 (0.0%) | 66 (72.5%) |
| 5 or more Children | 2 (100.0%) | 0 (0.0%) |
| Total | 48 (17.9%) | 283 (39.0%) |
Income Below Poverty Among Married-Couple vs Single-Parent Households in Wright County
The poverty data for Wright County shows that 300 of the married-couple family households (8.2%) and 331 of the single-parent households (33.3%) are living below the poverty level. Within the married-couple family households, those with 5 or more children have the highest poverty rate, with 55 households (73.3%) falling below the poverty line. Among the single-parent households, those with 5 or more children have the highest poverty rate, with 2 household (100.0%) living below poverty.
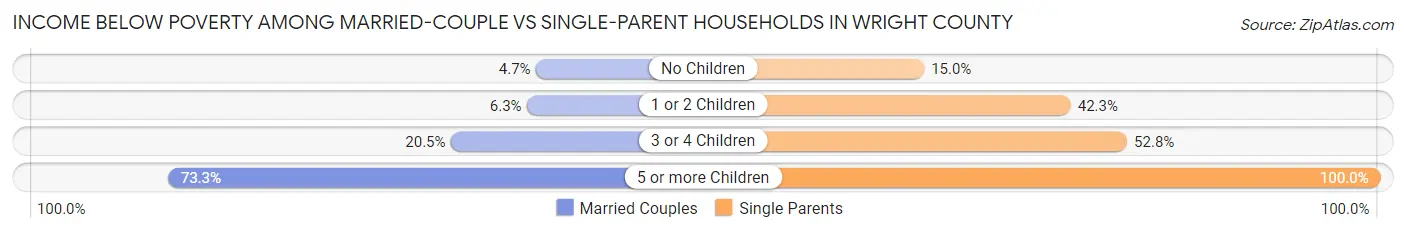
| Children | Married-Couple Families | Single-Parent Households |
| No Children | 105 (4.7%) | 57 (15.0%) |
| 1 or 2 Children | 60 (6.3%) | 206 (42.3%) |
| 3 or 4 Children | 80 (20.5%) | 66 (52.8%) |
| 5 or more Children | 55 (73.3%) | 2 (100.0%) |
| Total | 300 (8.2%) | 331 (33.3%) |
Race in Wright County
The most populous races in Wright County are White / Caucasian (17,473 | 94.6%), Two or more Races (829 | 4.5%), and Hispanic or Latino (449 | 2.4%).
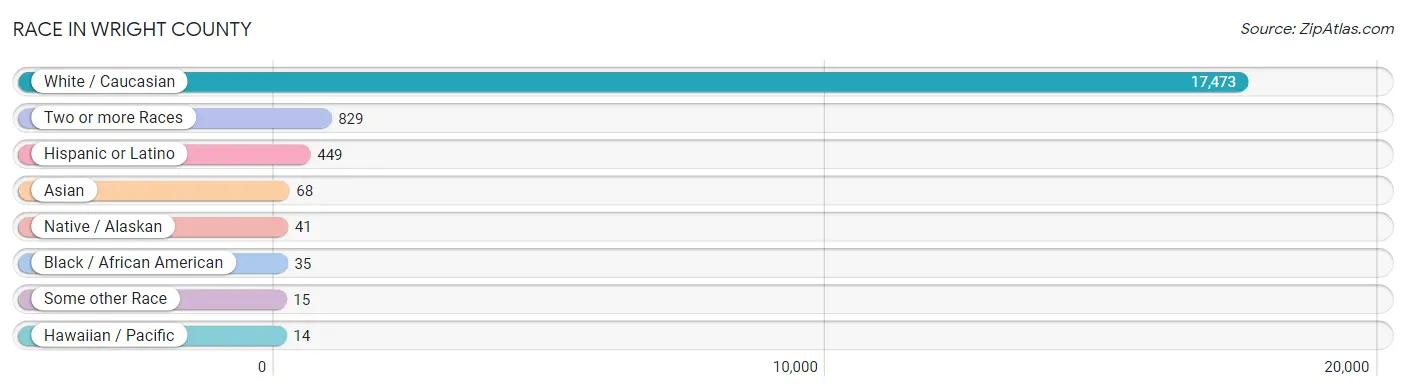
| Race | # Population | % Population |
| Asian | 68 | 0.4% |
| Black / African American | 35 | 0.2% |
| Hawaiian / Pacific | 14 | 0.1% |
| Hispanic or Latino | 449 | 2.4% |
| Native / Alaskan | 41 | 0.2% |
| White / Caucasian | 17,473 | 94.6% |
| Two or more Races | 829 | 4.5% |
| Some other Race | 15 | 0.1% |
| Total | 18,475 | 100.0% |
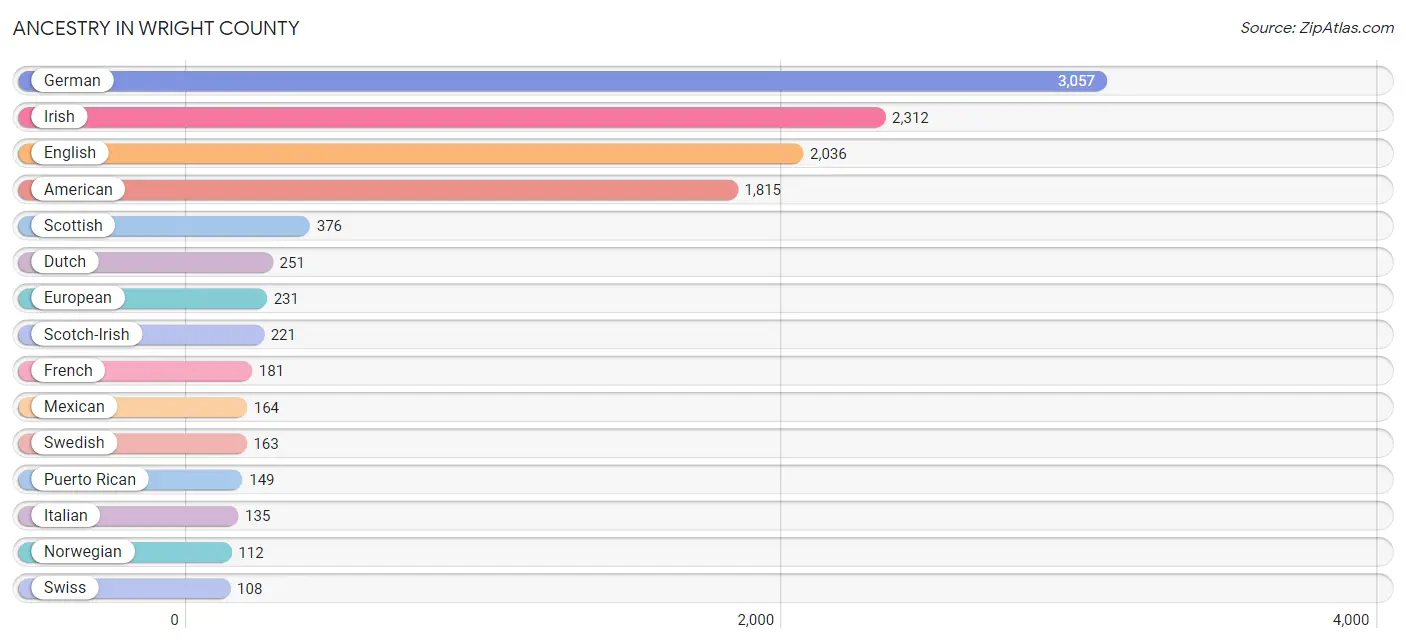
Ancestry in Wright County
The most populous ancestries reported in Wright County are German (3,057 | 16.6%), Irish (2,312 | 12.5%), English (2,036 | 11.0%), American (1,815 | 9.8%), and Scottish (376 | 2.0%), together accounting for 51.9% of all Wright County residents.
| Ancestry | # Population | % Population |
| African | 4 | 0.0% |
| American | 1,815 | 9.8% |
| Apache | 1 | 0.0% |
| Arab | 4 | 0.0% |
| Belizean | 15 | 0.1% |
| Bhutanese | 61 | 0.3% |
| Blackfeet | 7 | 0.0% |
| British | 27 | 0.2% |
| Canadian | 11 | 0.1% |
| Cherokee | 66 | 0.4% |
| Cheyenne | 15 | 0.1% |
| Choctaw | 3 | 0.0% |
| Cuban | 34 | 0.2% |
| Czech | 54 | 0.3% |
| Czechoslovakian | 3 | 0.0% |
| Danish | 24 | 0.1% |
| Delaware | 8 | 0.0% |
| Dutch | 251 | 1.4% |
| Eastern European | 25 | 0.1% |
| Egyptian | 4 | 0.0% |
| English | 2,036 | 11.0% |
| European | 231 | 1.3% |
| Finnish | 15 | 0.1% |
| French | 181 | 1.0% |
| French Canadian | 7 | 0.0% |
| German | 3,057 | 16.6% |
| Guamanian / Chamorro | 14 | 0.1% |
| Irish | 2,312 | 12.5% |
| Italian | 135 | 0.7% |
| Korean | 28 | 0.2% |
| Lithuanian | 3 | 0.0% |
| Mexican | 164 | 0.9% |
| Northern European | 18 | 0.1% |
| Norwegian | 112 | 0.6% |
| Pennsylvania German | 85 | 0.5% |
| Polish | 18 | 0.1% |
| Portuguese | 18 | 0.1% |
| Puerto Rican | 149 | 0.8% |
| Russian | 19 | 0.1% |
| Scandinavian | 39 | 0.2% |
| Scotch-Irish | 221 | 1.2% |
| Scottish | 376 | 2.0% |
| Sioux | 6 | 0.0% |
| Spaniard | 54 | 0.3% |
| Subsaharan African | 4 | 0.0% |
| Swedish | 163 | 0.9% |
| Swiss | 108 | 0.6% |
| Thai | 2 | 0.0% |
| Turkish | 9 | 0.1% |
| Ukrainian | 9 | 0.1% |
| Welsh | 69 | 0.4% | View All 51 Rows |
Immigrants in Wright County
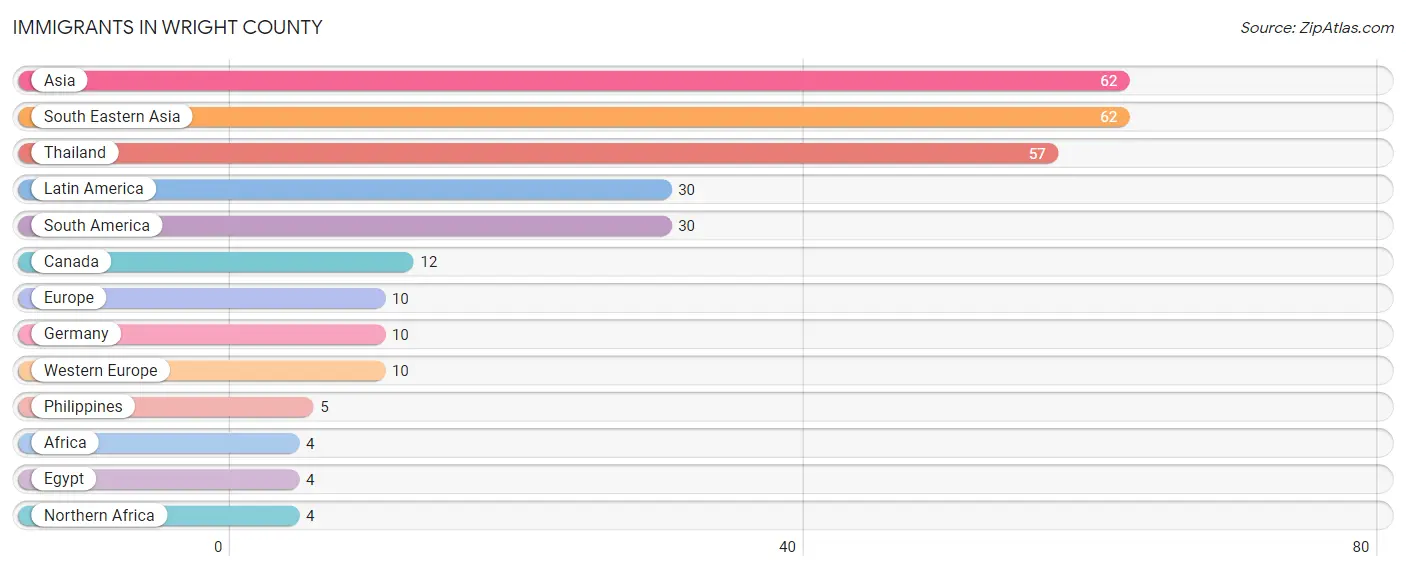
The most numerous immigrant groups reported in Wright County came from Asia (62 | 0.3%), South Eastern Asia (62 | 0.3%), Thailand (57 | 0.3%), Latin America (30 | 0.2%), and South America (30 | 0.2%), together accounting for 1.3% of all Wright County residents.
| Immigration Origin | # Population | % Population |
| Africa | 4 | 0.0% |
| Asia | 62 | 0.3% |
| Canada | 12 | 0.1% |
| Egypt | 4 | 0.0% |
| Europe | 10 | 0.1% |
| Germany | 10 | 0.1% |
| Latin America | 30 | 0.2% |
| Northern Africa | 4 | 0.0% |
| Philippines | 5 | 0.0% |
| South America | 30 | 0.2% |
| South Eastern Asia | 62 | 0.3% |
| Thailand | 57 | 0.3% |
| Western Europe | 10 | 0.1% | View All 13 Rows |
Sex and Age in Wright County
Sex and Age in Wright County
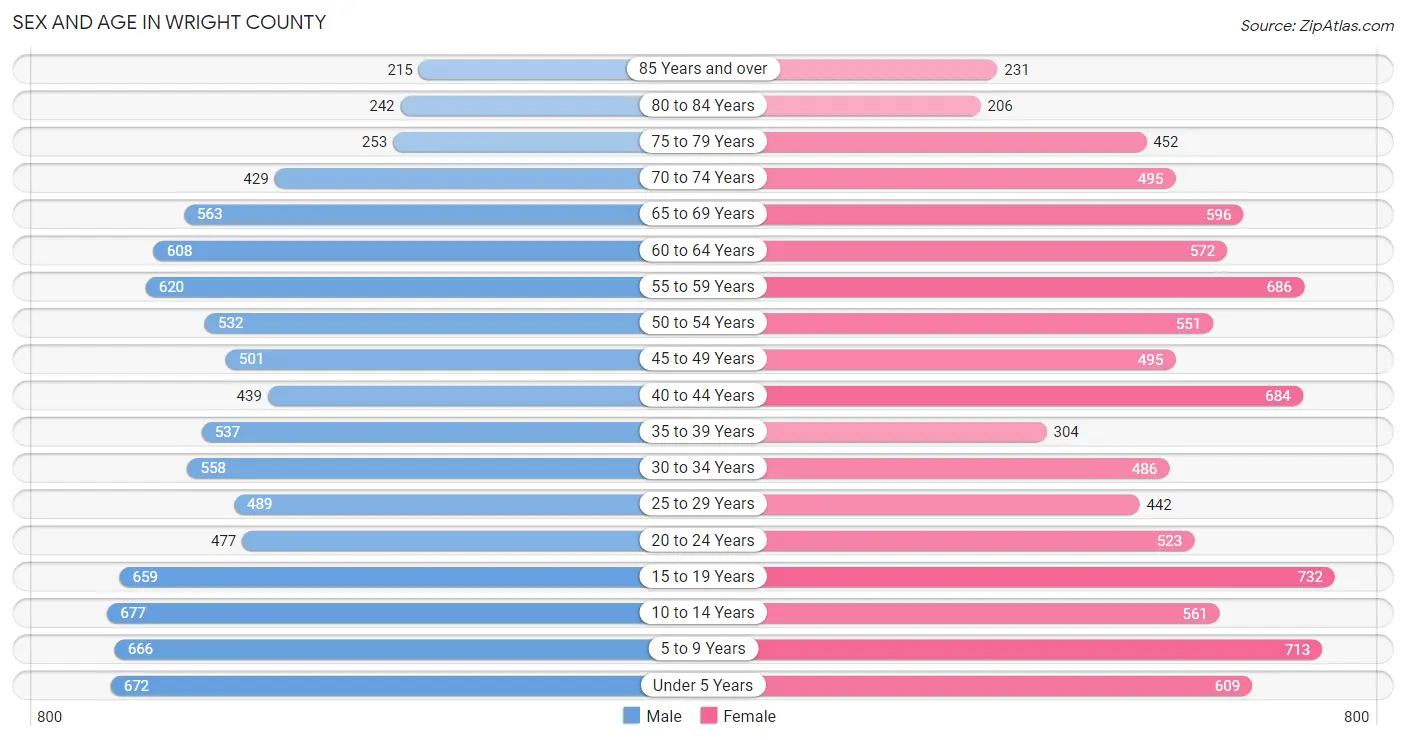
The most populous age groups in Wright County are 10 to 14 Years (677 | 7.4%) for men and 15 to 19 Years (732 | 7.8%) for women.
| Age Bracket | Male | Female |
| Under 5 Years | 672 (7.3%) | 609 (6.5%) |
| 5 to 9 Years | 666 (7.3%) | 713 (7.6%) |
| 10 to 14 Years | 677 (7.4%) | 561 (6.0%) |
| 15 to 19 Years | 659 (7.2%) | 732 (7.8%) |
| 20 to 24 Years | 477 (5.2%) | 523 (5.6%) |
| 25 to 29 Years | 489 (5.3%) | 442 (4.7%) |
| 30 to 34 Years | 558 (6.1%) | 486 (5.2%) |
| 35 to 39 Years | 537 (5.9%) | 304 (3.3%) |
| 40 to 44 Years | 439 (4.8%) | 684 (7.3%) |
| 45 to 49 Years | 501 (5.5%) | 495 (5.3%) |
| 50 to 54 Years | 532 (5.8%) | 551 (5.9%) |
| 55 to 59 Years | 620 (6.8%) | 686 (7.3%) |
| 60 to 64 Years | 608 (6.7%) | 572 (6.1%) |
| 65 to 69 Years | 563 (6.2%) | 596 (6.4%) |
| 70 to 74 Years | 429 (4.7%) | 495 (5.3%) |
| 75 to 79 Years | 253 (2.8%) | 452 (4.8%) |
| 80 to 84 Years | 242 (2.6%) | 206 (2.2%) |
| 85 Years and over | 215 (2.4%) | 231 (2.5%) |
| Total | 9,137 (100.0%) | 9,338 (100.0%) |
Families and Households in Wright County
Median Family Size in Wright County
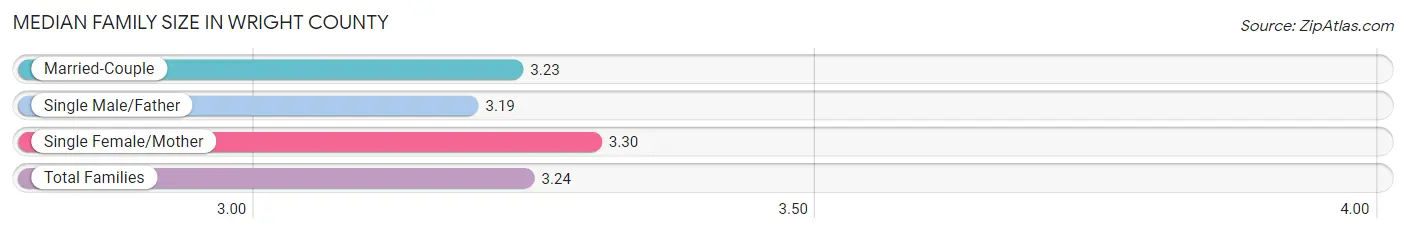
The median family size in Wright County is 3.24 persons per family, with single female/mother families (726 | 15.6%) accounting for the largest median family size of 3.3 persons per family. On the other hand, single male/father families (268 | 5.8%) represent the smallest median family size with 3.19 persons per family.
| Family Type | # Families | Family Size |
| Married-Couple | 3,659 (78.6%) | 3.23 |
| Single Male/Father | 268 (5.8%) | 3.19 |
| Single Female/Mother | 726 (15.6%) | 3.30 |
| Total Families | 4,653 (100.0%) | 3.24 |
Median Household Size in Wright County
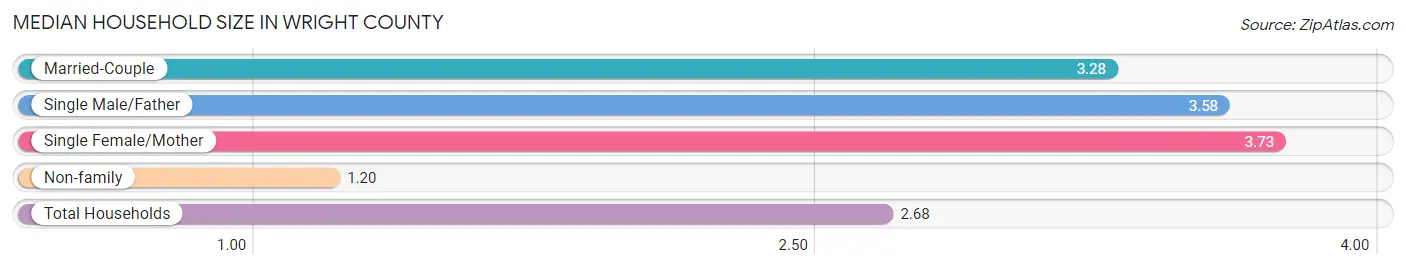
The median household size in Wright County is 2.68 persons per household, with single female/mother households (726 | 10.6%) accounting for the largest median household size of 3.73 persons per household. non-family households (2,172 | 31.8%) represent the smallest median household size with 1.20 persons per household.
| Household Type | # Households | Household Size |
| Married-Couple | 3,659 (53.6%) | 3.28 |
| Single Male/Father | 268 (3.9%) | 3.58 |
| Single Female/Mother | 726 (10.6%) | 3.73 |
| Non-family | 2,172 (31.8%) | 1.20 |
| Total Households | 6,825 (100.0%) | 2.68 |
Household Size by Marriage Status in Wright County
Out of a total of 6,825 households in Wright County, 4,653 (68.2%) are family households, while 2,172 (31.8%) are nonfamily households. The most numerous type of family households are 2-person households, comprising 2,397, and the most common type of nonfamily households are 1-person households, comprising 1,882.
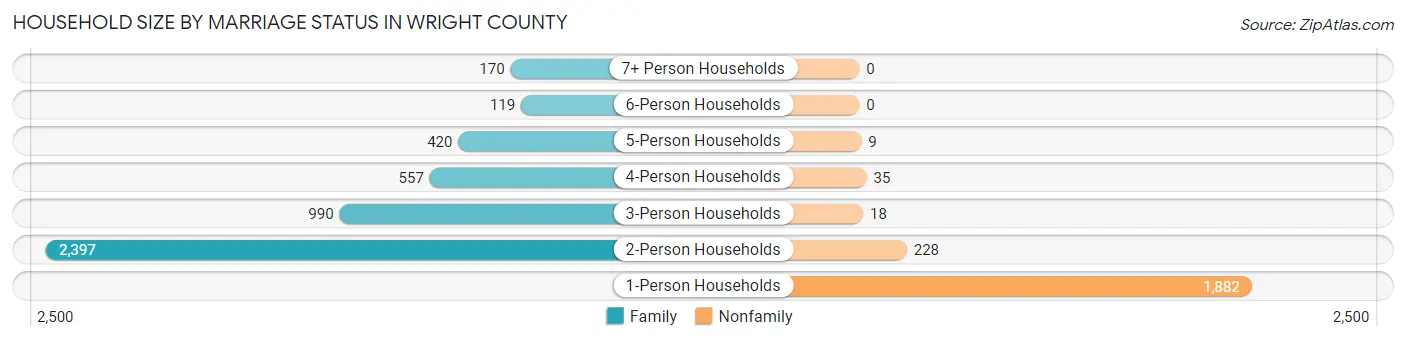
| Household Size | Family Households | Nonfamily Households |
| 1-Person Households | - | 1,882 (27.6%) |
| 2-Person Households | 2,397 (35.1%) | 228 (3.3%) |
| 3-Person Households | 990 (14.5%) | 18 (0.3%) |
| 4-Person Households | 557 (8.2%) | 35 (0.5%) |
| 5-Person Households | 420 (6.1%) | 9 (0.1%) |
| 6-Person Households | 119 (1.7%) | 0 (0.0%) |
| 7+ Person Households | 170 (2.5%) | 0 (0.0%) |
| Total | 4,653 (68.2%) | 2,172 (31.8%) |
Female Fertility in Wright County
Fertility by Age in Wright County
Average fertility rate in Wright County is 64.0 births per 1,000 women. Women in the age bracket of 20 to 34 years have the highest fertility rate with 115.0 births per 1,000 women. Women in the age bracket of 20 to 34 years acount for 69.6% of all women with births.
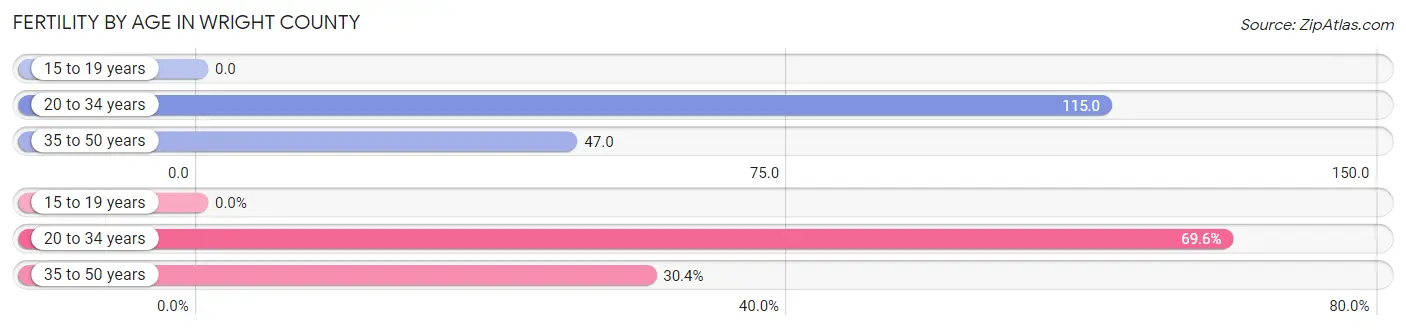
| Age Bracket | Women with Births | Births / 1,000 Women |
| 15 to 19 years | 0 (0.0%) | 0.0 |
| 20 to 34 years | 167 (69.6%) | 115.0 |
| 35 to 50 years | 73 (30.4%) | 47.0 |
| Total | 240 (100.0%) | 64.0 |
Fertility by Age by Marriage Status in Wright County
78.7% of women with births (240) in Wright County are married. The highest percentage of unmarried women with births falls into 20 to 34 years age bracket with 30.5% of them unmarried at the time of birth, while the lowest percentage of unmarried women with births belong to 35 to 50 years age bracket with 0.0% of them unmarried.
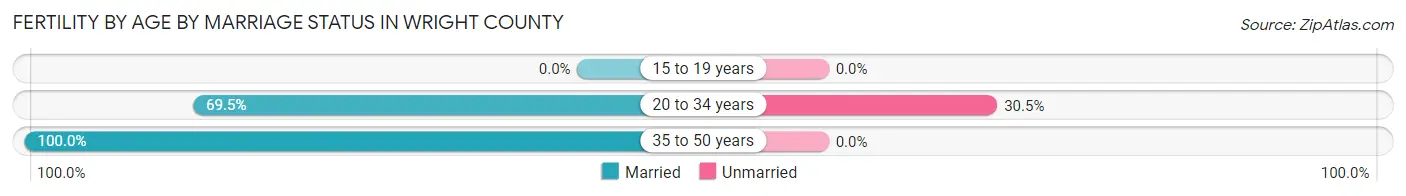
| Age Bracket | Married | Unmarried |
| 15 to 19 years | 0 (0.0%) | 0 (0.0%) |
| 20 to 34 years | 116 (69.5%) | 51 (30.5%) |
| 35 to 50 years | 73 (100.0%) | 0 (0.0%) |
| Total | 189 (78.7%) | 51 (21.2%) |
Fertility by Education in Wright County
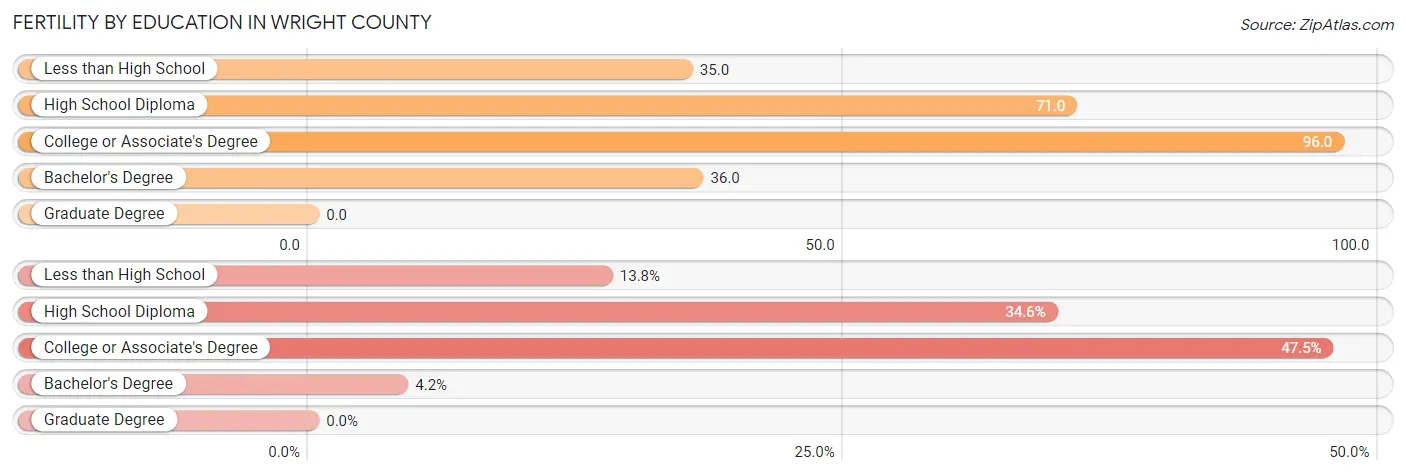
| Educational Attainment | Women with Births | Births / 1,000 Women |
| Less than High School | 33 (13.8%) | 35.0 |
| High School Diploma | 83 (34.6%) | 71.0 |
| College or Associate's Degree | 114 (47.5%) | 96.0 |
| Bachelor's Degree | 10 (4.2%) | 36.0 |
| Graduate Degree | 0 (0.0%) | 0.0 |
| Total | 240 (100.0%) | 64.0 |
Fertility by Education by Marriage Status in Wright County
21.2% of women with births in Wright County are unmarried. Women with the educational attainment of less than high school are most likely to be married with 100.0% of them married at childbirth, while women with the educational attainment of college or associate's degree are least likely to be married with 31.6% of them unmarried at childbirth.
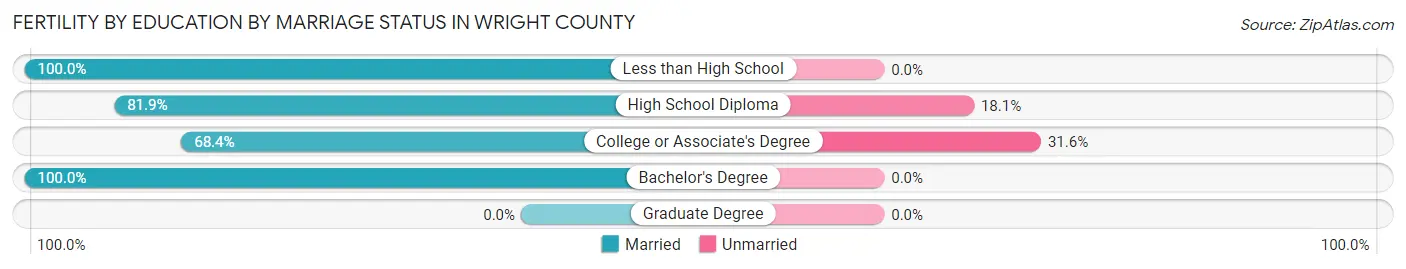
| Educational Attainment | Married | Unmarried |
| Less than High School | 33 (100.0%) | 0 (0.0%) |
| High School Diploma | 68 (81.9%) | 15 (18.1%) |
| College or Associate's Degree | 78 (68.4%) | 36 (31.6%) |
| Bachelor's Degree | 10 (100.0%) | 0 (0.0%) |
| Graduate Degree | 0 (0.0%) | 0 (0.0%) |
| Total | 189 (78.7%) | 51 (21.2%) |
Employment Characteristics in Wright County
Employment by Class of Employer in Wright County
Among the 6,803 employed individuals in Wright County, private company employees (4,340 | 63.8%), self-employed (not incorporated) (756 | 11.1%), and local government employees (551 | 8.1%) make up the most common classes of employment.
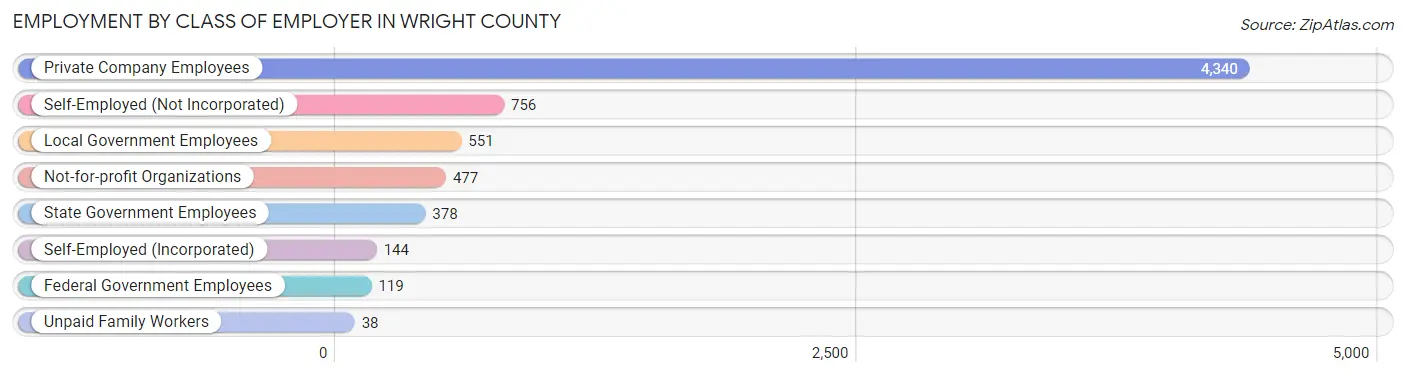
| Employer Class | # Employees | % Employees |
| Private Company Employees | 4,340 | 63.8% |
| Self-Employed (Incorporated) | 144 | 2.1% |
| Self-Employed (Not Incorporated) | 756 | 11.1% |
| Not-for-profit Organizations | 477 | 7.0% |
| Local Government Employees | 551 | 8.1% |
| State Government Employees | 378 | 5.6% |
| Federal Government Employees | 119 | 1.8% |
| Unpaid Family Workers | 38 | 0.6% |
| Total | 6,803 | 100.0% |
Employment Status by Age in Wright County
According to the labor force statistics for Wright County, out of the total population over 16 years of age (14,257), 50.6% or 7,214 individuals are in the labor force, with 4.8% or 346 of them unemployed. The age group with the highest labor force participation rate is 35 to 44 years, with 78.7% or 1,546 individuals in the labor force. Within the labor force, the 16 to 19 years age range has the highest percentage of unemployed individuals, with 15.1% or 65 of them being unemployed.
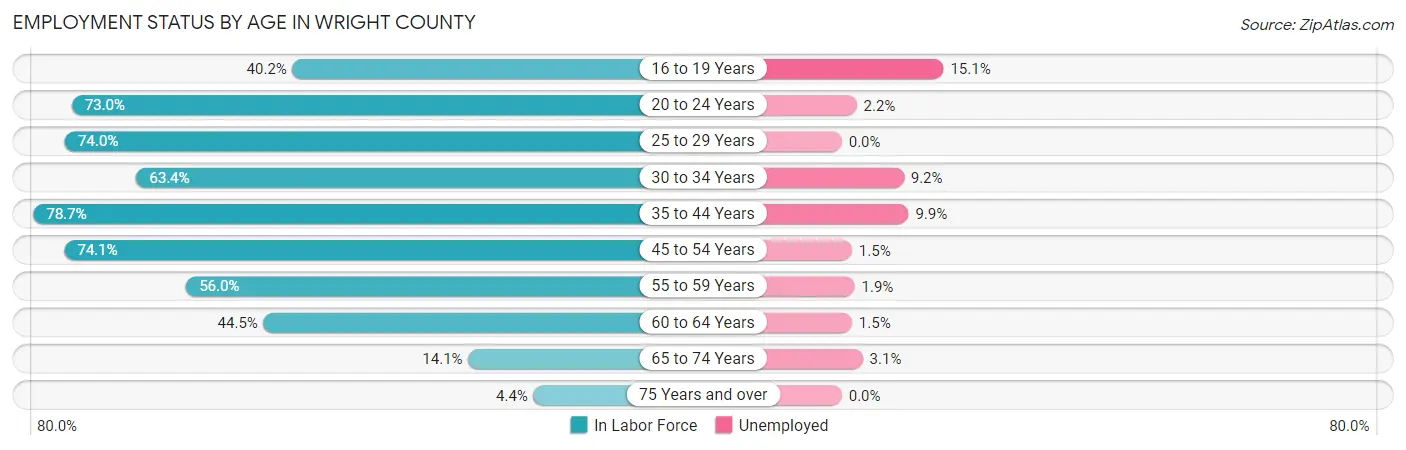
| Age Bracket | In Labor Force | Unemployed |
| 16 to 19 Years | 431 (40.2%) | 65 (15.1%) |
| 20 to 24 Years | 730 (73.0%) | 16 (2.2%) |
| 25 to 29 Years | 689 (74.0%) | 0 (0.0%) |
| 30 to 34 Years | 662 (63.4%) | 61 (9.2%) |
| 35 to 44 Years | 1,546 (78.7%) | 153 (9.9%) |
| 45 to 54 Years | 1,541 (74.1%) | 23 (1.5%) |
| 55 to 59 Years | 731 (56.0%) | 14 (1.9%) |
| 60 to 64 Years | 525 (44.5%) | 8 (1.5%) |
| 65 to 74 Years | 294 (14.1%) | 9 (3.1%) |
| 75 Years and over | 70 (4.4%) | 0 (0.0%) |
| Total | 7,214 (50.6%) | 346 (4.8%) |
Employment Status by Educational Attainment in Wright County
According to labor force statistics for Wright County, 67.0% of individuals (5,698) out of the total population between 25 and 64 years of age (8,504) are in the labor force, with 4.5% or 256 of them being unemployed. The group with the highest labor force participation rate are those with the educational attainment of bachelor's degree or higher, with 80.6% or 930 individuals in the labor force. Within the labor force, individuals with less than high school education have the highest percentage of unemployment, with 21.2% or 145 of them being unemployed.
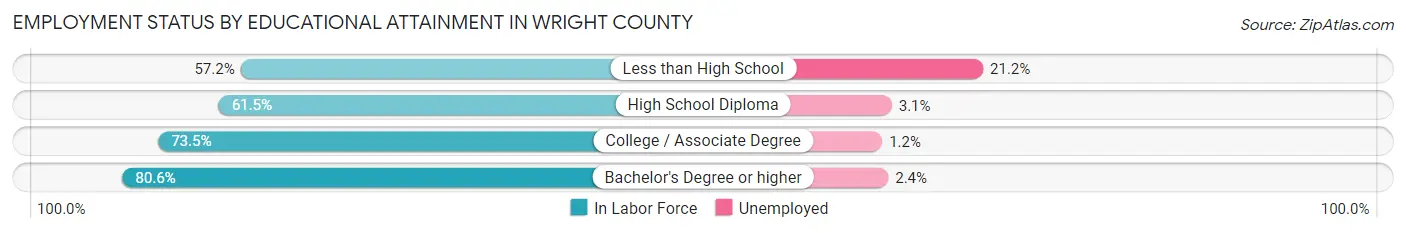
| Educational Attainment | In Labor Force | Unemployed |
| Less than High School | 685 (57.2%) | 254 (21.2%) |
| High School Diploma | 2,275 (61.5%) | 115 (3.1%) |
| College / Associate Degree | 1,803 (73.5%) | 29 (1.2%) |
| Bachelor's Degree or higher | 930 (80.6%) | 28 (2.4%) |
| Total | 5,698 (67.0%) | 383 (4.5%) |
Employment Occupations by Sex in Wright County
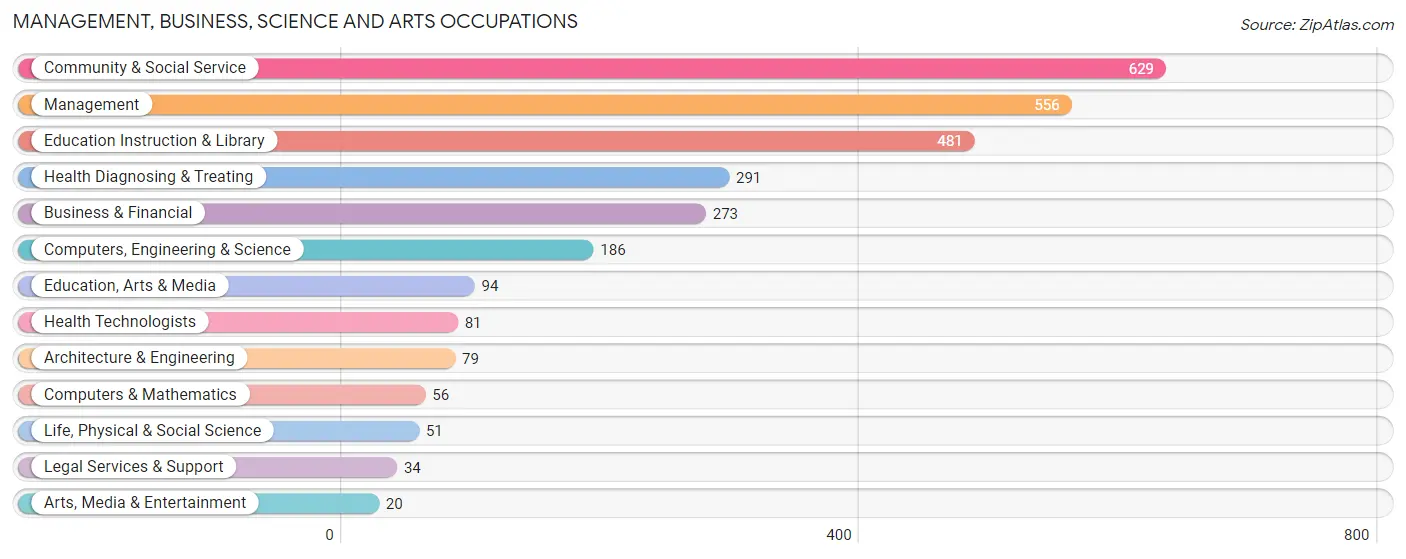
Management, Business, Science and Arts Occupations
The most common Management, Business, Science and Arts occupations in Wright County are Community & Social Service (629 | 9.2%), Management (556 | 8.1%), Education Instruction & Library (481 | 7.0%), Health Diagnosing & Treating (291 | 4.2%), and Business & Financial (273 | 4.0%).
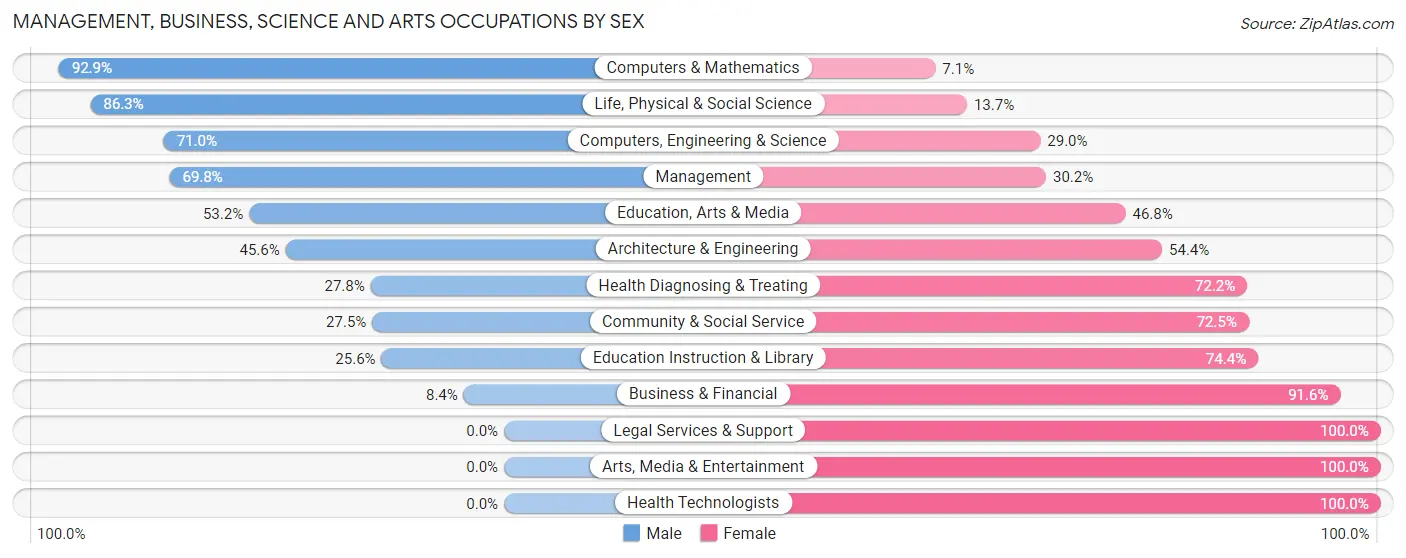
Management, Business, Science and Arts Occupations by Sex
Within the Management, Business, Science and Arts occupations in Wright County, the most male-oriented occupations are Computers & Mathematics (92.9%), Life, Physical & Social Science (86.3%), and Computers, Engineering & Science (71.0%), while the most female-oriented occupations are Legal Services & Support (100.0%), Arts, Media & Entertainment (100.0%), and Health Technologists (100.0%).
| Occupation | Male | Female |
| Management | 388 (69.8%) | 168 (30.2%) |
| Business & Financial | 23 (8.4%) | 250 (91.6%) |
| Computers, Engineering & Science | 132 (71.0%) | 54 (29.0%) |
| Computers & Mathematics | 52 (92.9%) | 4 (7.1%) |
| Architecture & Engineering | 36 (45.6%) | 43 (54.4%) |
| Life, Physical & Social Science | 44 (86.3%) | 7 (13.7%) |
| Community & Social Service | 173 (27.5%) | 456 (72.5%) |
| Education, Arts & Media | 50 (53.2%) | 44 (46.8%) |
| Legal Services & Support | 0 (0.0%) | 34 (100.0%) |
| Education Instruction & Library | 123 (25.6%) | 358 (74.4%) |
| Arts, Media & Entertainment | 0 (0.0%) | 20 (100.0%) |
| Health Diagnosing & Treating | 81 (27.8%) | 210 (72.2%) |
| Health Technologists | 0 (0.0%) | 81 (100.0%) |
| Total (Category) | 797 (41.2%) | 1,138 (58.8%) |
| Total (Overall) | 3,718 (54.2%) | 3,141 (45.8%) |
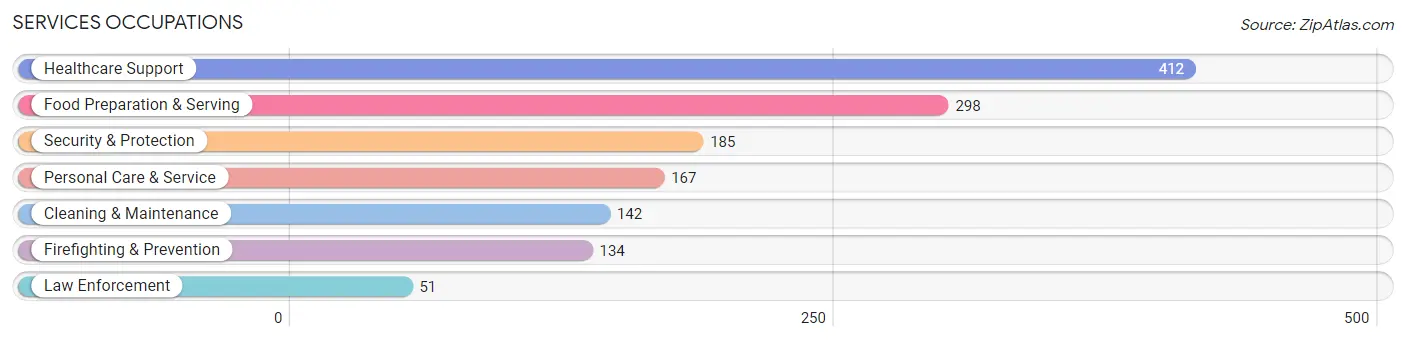
Services Occupations
The most common Services occupations in Wright County are Healthcare Support (412 | 6.0%), Food Preparation & Serving (298 | 4.3%), Security & Protection (185 | 2.7%), Personal Care & Service (167 | 2.4%), and Cleaning & Maintenance (142 | 2.1%).
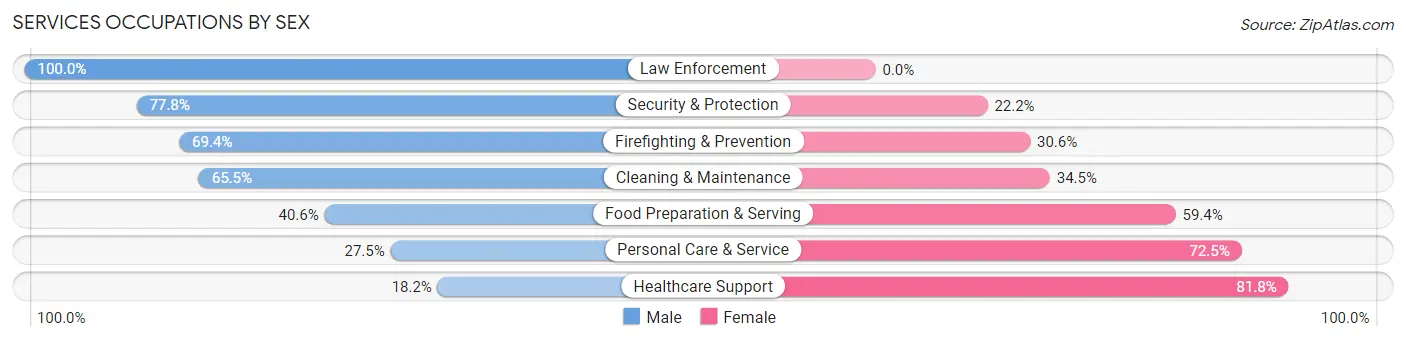
Services Occupations by Sex
Within the Services occupations in Wright County, the most male-oriented occupations are Law Enforcement (100.0%), Security & Protection (77.8%), and Firefighting & Prevention (69.4%), while the most female-oriented occupations are Healthcare Support (81.8%), Personal Care & Service (72.5%), and Food Preparation & Serving (59.4%).
| Occupation | Male | Female |
| Healthcare Support | 75 (18.2%) | 337 (81.8%) |
| Security & Protection | 144 (77.8%) | 41 (22.2%) |
| Firefighting & Prevention | 93 (69.4%) | 41 (30.6%) |
| Law Enforcement | 51 (100.0%) | 0 (0.0%) |
| Food Preparation & Serving | 121 (40.6%) | 177 (59.4%) |
| Cleaning & Maintenance | 93 (65.5%) | 49 (34.5%) |
| Personal Care & Service | 46 (27.5%) | 121 (72.5%) |
| Total (Category) | 479 (39.8%) | 725 (60.2%) |
| Total (Overall) | 3,718 (54.2%) | 3,141 (45.8%) |
Sales and Office Occupations
The most common Sales and Office occupations in Wright County are Sales & Related (686 | 10.0%), and Office & Administration (562 | 8.2%).
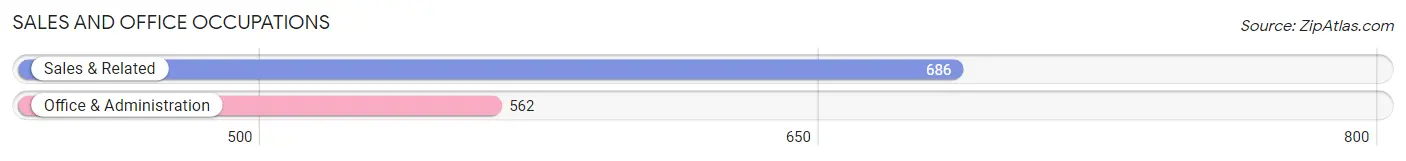
Sales and Office Occupations by Sex

| Occupation | Male | Female |
| Sales & Related | 210 (30.6%) | 476 (69.4%) |
| Office & Administration | 52 (9.2%) | 510 (90.7%) |
| Total (Category) | 262 (21.0%) | 986 (79.0%) |
| Total (Overall) | 3,718 (54.2%) | 3,141 (45.8%) |
Natural Resources, Construction and Maintenance Occupations
The most common Natural Resources, Construction and Maintenance occupations in Wright County are Construction & Extraction (528 | 7.7%), Installation, Maintenance & Repair (207 | 3.0%), and Farming, Fishing & Forestry (173 | 2.5%).
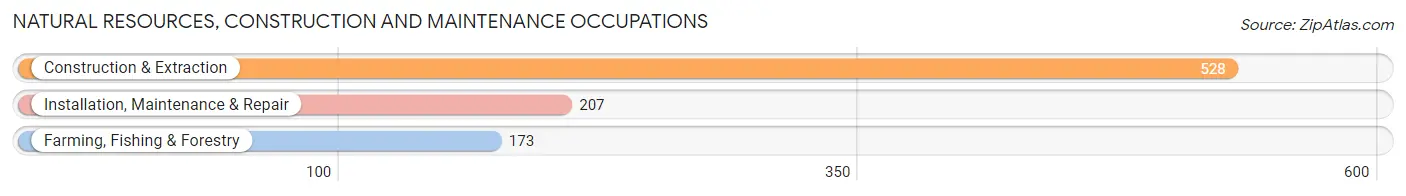
Natural Resources, Construction and Maintenance Occupations by Sex
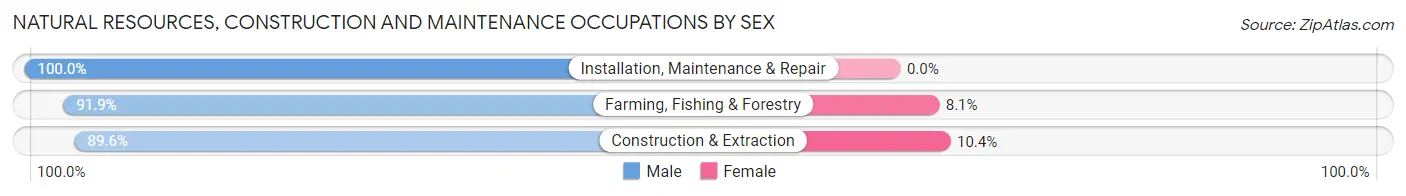
| Occupation | Male | Female |
| Farming, Fishing & Forestry | 159 (91.9%) | 14 (8.1%) |
| Construction & Extraction | 473 (89.6%) | 55 (10.4%) |
| Installation, Maintenance & Repair | 207 (100.0%) | 0 (0.0%) |
| Total (Category) | 839 (92.4%) | 69 (7.6%) |
| Total (Overall) | 3,718 (54.2%) | 3,141 (45.8%) |
Production, Transportation and Moving Occupations
The most common Production, Transportation and Moving occupations in Wright County are Production (834 | 12.2%), Transportation (562 | 8.2%), and Material Moving (168 | 2.5%).
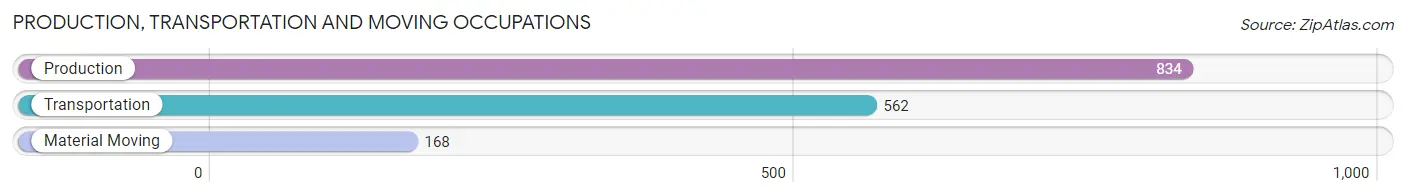
Production, Transportation and Moving Occupations by Sex
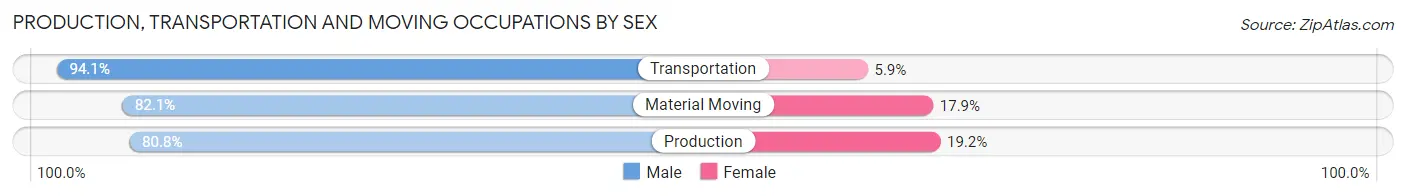
| Occupation | Male | Female |
| Production | 674 (80.8%) | 160 (19.2%) |
| Transportation | 529 (94.1%) | 33 (5.9%) |
| Material Moving | 138 (82.1%) | 30 (17.9%) |
| Total (Category) | 1,341 (85.7%) | 223 (14.3%) |
| Total (Overall) | 3,718 (54.2%) | 3,141 (45.8%) |
Employment Industries by Sex in Wright County
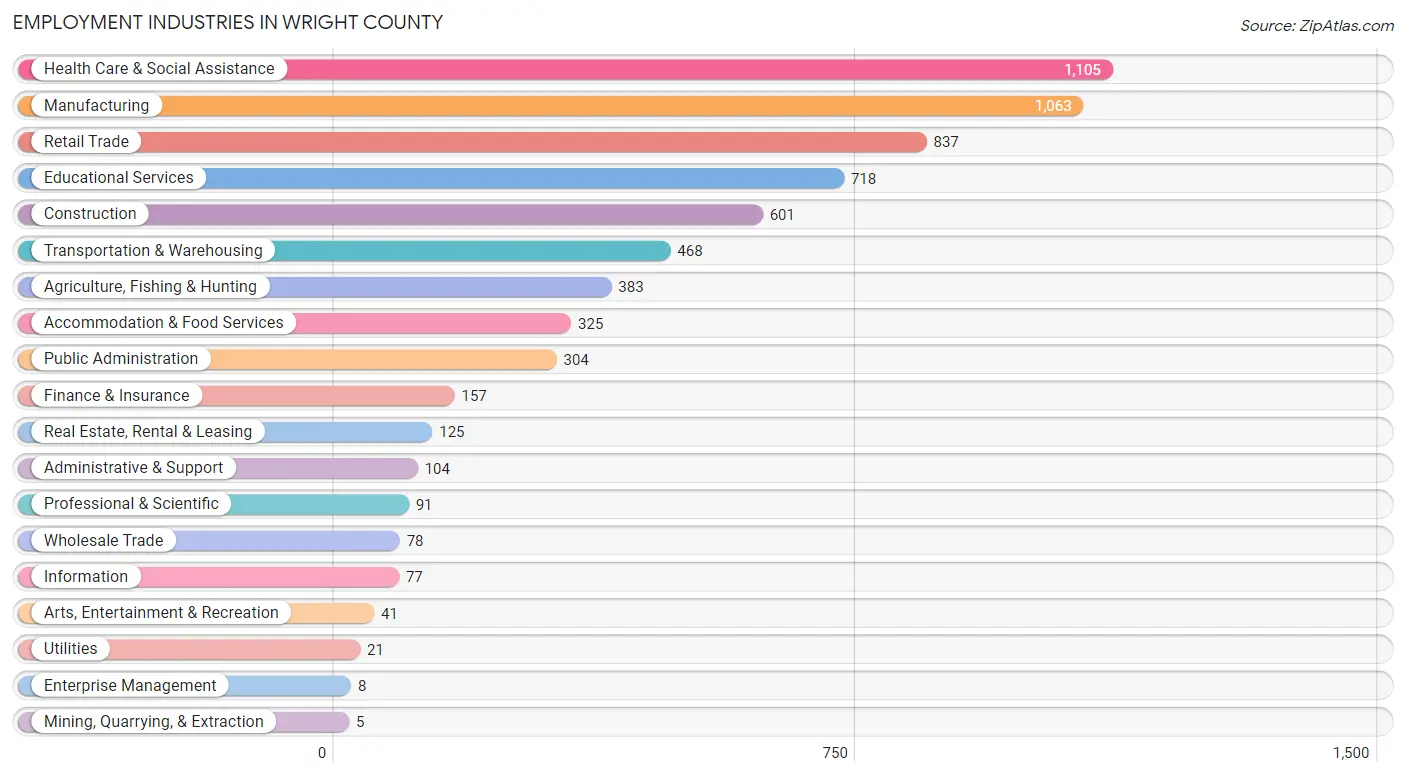
Employment Industries in Wright County
The major employment industries in Wright County include Health Care & Social Assistance (1,105 | 16.1%), Manufacturing (1,063 | 15.5%), Retail Trade (837 | 12.2%), Educational Services (718 | 10.5%), and Construction (601 | 8.8%).
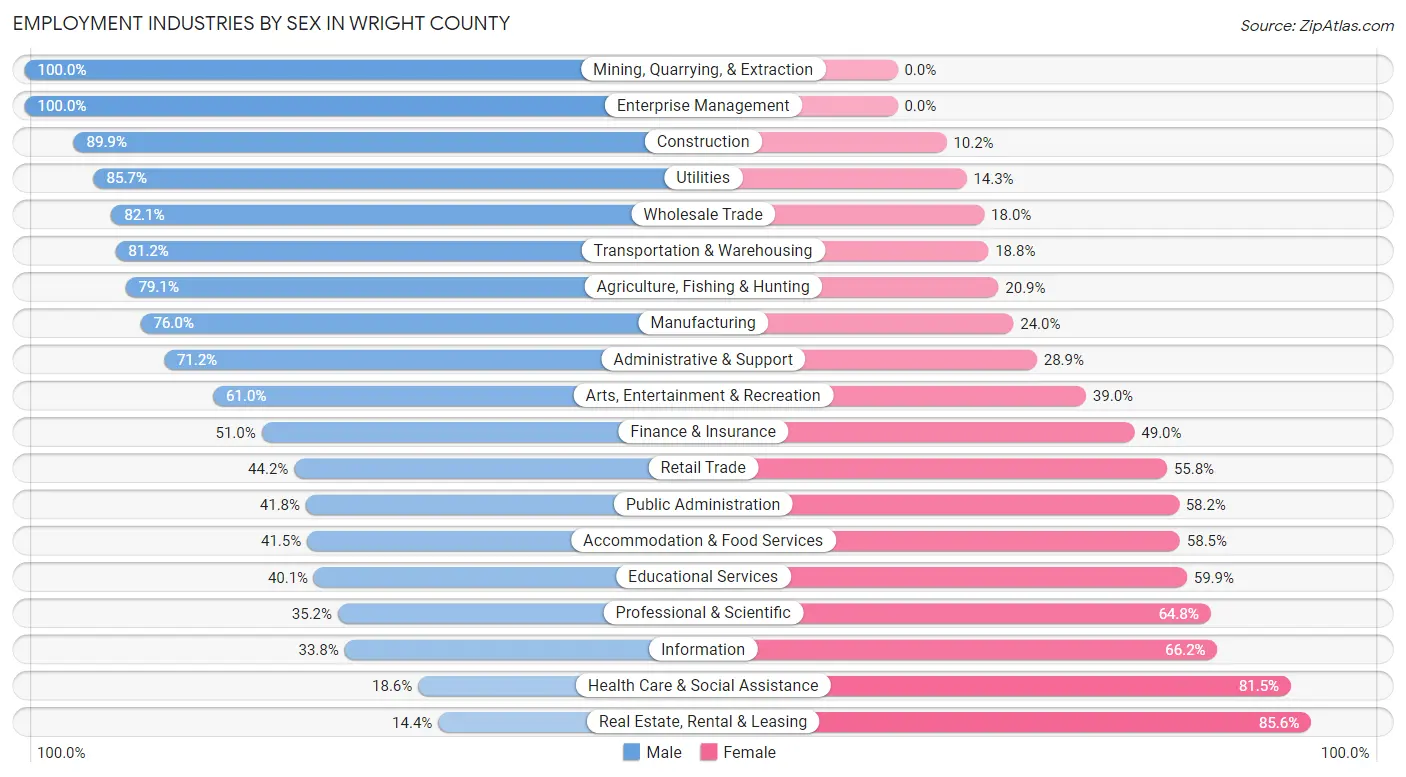
Employment Industries by Sex in Wright County
The Wright County industries that see more men than women are Mining, Quarrying, & Extraction (100.0%), Enterprise Management (100.0%), and Construction (89.8%), whereas the industries that tend to have a higher number of women are Real Estate, Rental & Leasing (85.6%), Health Care & Social Assistance (81.5%), and Information (66.2%).
| Industry | Male | Female |
| Agriculture, Fishing & Hunting | 303 (79.1%) | 80 (20.9%) |
| Mining, Quarrying, & Extraction | 5 (100.0%) | 0 (0.0%) |
| Construction | 540 (89.8%) | 61 (10.2%) |
| Manufacturing | 808 (76.0%) | 255 (24.0%) |
| Wholesale Trade | 64 (82.1%) | 14 (17.9%) |
| Retail Trade | 370 (44.2%) | 467 (55.8%) |
| Transportation & Warehousing | 380 (81.2%) | 88 (18.8%) |
| Utilities | 18 (85.7%) | 3 (14.3%) |
| Information | 26 (33.8%) | 51 (66.2%) |
| Finance & Insurance | 80 (51.0%) | 77 (49.0%) |
| Real Estate, Rental & Leasing | 18 (14.4%) | 107 (85.6%) |
| Professional & Scientific | 32 (35.2%) | 59 (64.8%) |
| Enterprise Management | 8 (100.0%) | 0 (0.0%) |
| Administrative & Support | 74 (71.2%) | 30 (28.8%) |
| Educational Services | 288 (40.1%) | 430 (59.9%) |
| Health Care & Social Assistance | 205 (18.5%) | 900 (81.5%) |
| Arts, Entertainment & Recreation | 25 (61.0%) | 16 (39.0%) |
| Accommodation & Food Services | 135 (41.5%) | 190 (58.5%) |
| Public Administration | 127 (41.8%) | 177 (58.2%) |
| Total | 3,718 (54.2%) | 3,141 (45.8%) |
Education in Wright County
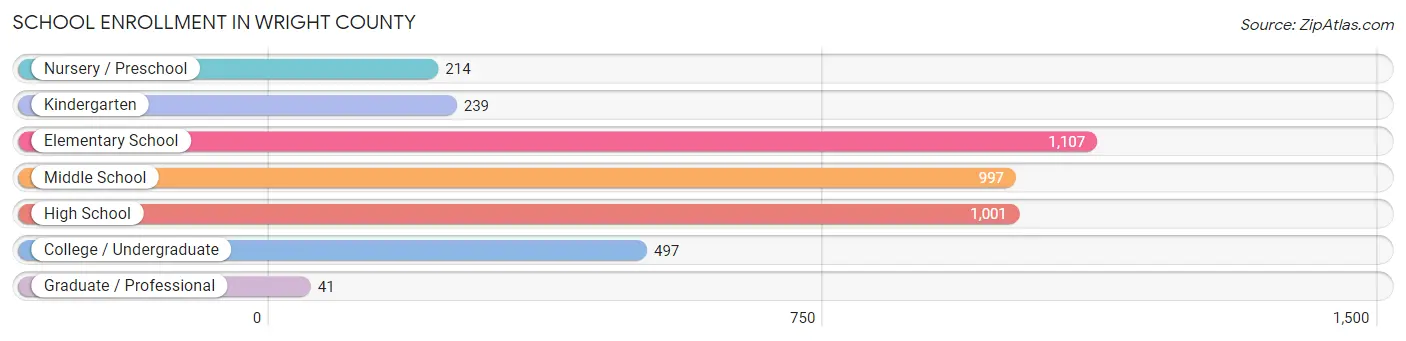
School Enrollment in Wright County
The most common levels of schooling among the 4,096 students in Wright County are elementary school (1,107 | 27.0%), high school (1,001 | 24.4%), and middle school (997 | 24.3%).
| School Level | # Students | % Students |
| Nursery / Preschool | 214 | 5.2% |
| Kindergarten | 239 | 5.8% |
| Elementary School | 1,107 | 27.0% |
| Middle School | 997 | 24.3% |
| High School | 1,001 | 24.4% |
| College / Undergraduate | 497 | 12.1% |
| Graduate / Professional | 41 | 1.0% |
| Total | 4,096 | 100.0% |
School Enrollment by Age by Funding Source in Wright County
Out of a total of 4,096 students who are enrolled in schools in Wright County, 1,024 (25.0%) attend a private institution, while the remaining 3,072 (75.0%) are enrolled in public schools. The age group of 3 to 4 year olds has the highest likelihood of being enrolled in private schools, with 75 (51.0% in the age bracket) enrolled. Conversely, the age group of 15 to 17 year olds has the lowest likelihood of being enrolled in a private school, with 687 (89.4% in the age bracket) attending a public institution.
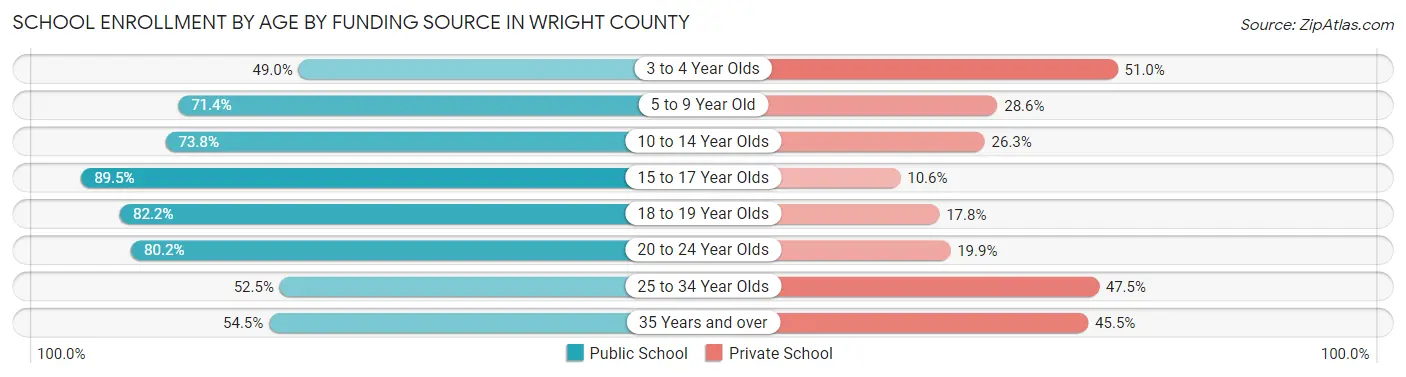
| Age Bracket | Public School | Private School |
| 3 to 4 Year Olds | 72 (49.0%) | 75 (51.0%) |
| 5 to 9 Year Old | 908 (71.4%) | 364 (28.6%) |
| 10 to 14 Year Olds | 871 (73.8%) | 310 (26.3%) |
| 15 to 17 Year Olds | 687 (89.4%) | 81 (10.5%) |
| 18 to 19 Year Olds | 217 (82.2%) | 47 (17.8%) |
| 20 to 24 Year Olds | 210 (80.1%) | 52 (19.9%) |
| 25 to 34 Year Olds | 53 (52.5%) | 48 (47.5%) |
| 35 Years and over | 55 (54.5%) | 46 (45.5%) |
| Total | 3,072 (75.0%) | 1,024 (25.0%) |
Educational Attainment by Field of Study in Wright County
Education (453 | 26.9%), business (239 | 14.2%), science & technology (202 | 12.0%), bio, nature & agricultural (173 | 10.3%), and physical & health sciences (159 | 9.4%) are the most common fields of study among 1,686 individuals in Wright County who have obtained a bachelor's degree or higher.
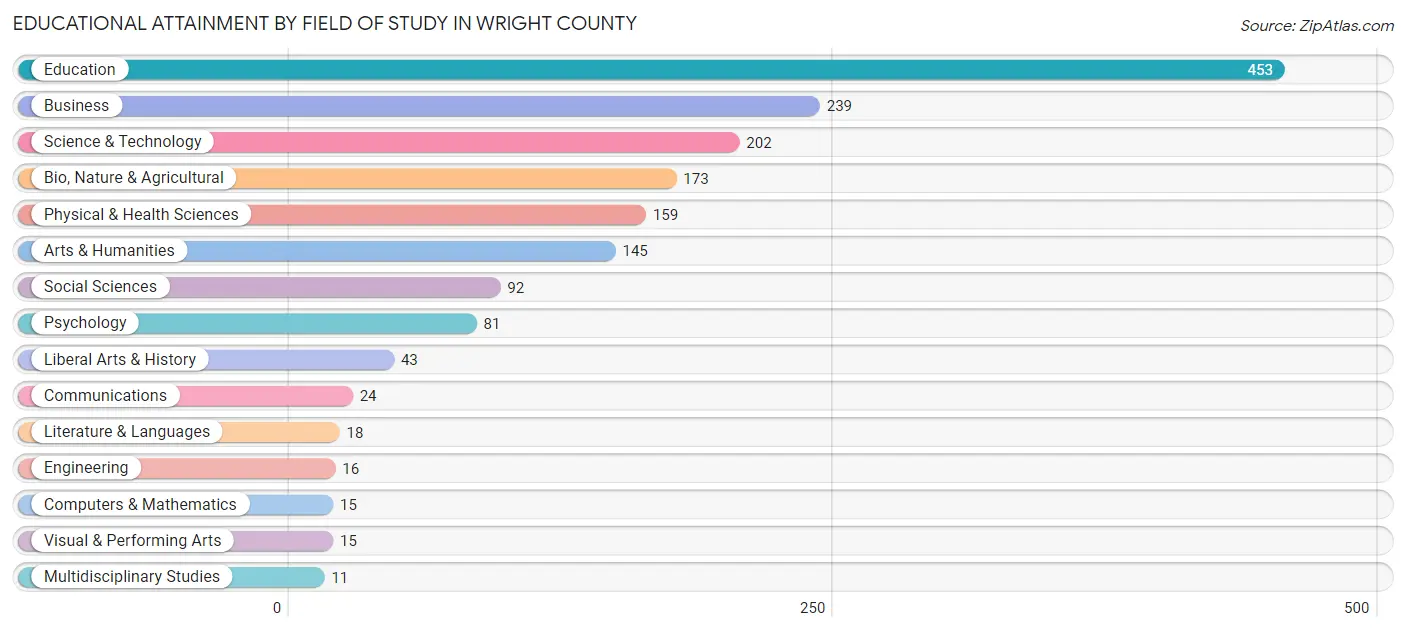
| Field of Study | # Graduates | % Graduates |
| Computers & Mathematics | 15 | 0.9% |
| Bio, Nature & Agricultural | 173 | 10.3% |
| Physical & Health Sciences | 159 | 9.4% |
| Psychology | 81 | 4.8% |
| Social Sciences | 92 | 5.5% |
| Engineering | 16 | 0.9% |
| Multidisciplinary Studies | 11 | 0.6% |
| Science & Technology | 202 | 12.0% |
| Business | 239 | 14.2% |
| Education | 453 | 26.9% |
| Literature & Languages | 18 | 1.1% |
| Liberal Arts & History | 43 | 2.5% |
| Visual & Performing Arts | 15 | 0.9% |
| Communications | 24 | 1.4% |
| Arts & Humanities | 145 | 8.6% |
| Total | 1,686 | 100.0% |
Transportation & Commute in Wright County
Vehicle Availability by Sex in Wright County
The most prevalent vehicle ownership categories in Wright County are males with 2 vehicles (1,240, accounting for 33.7%) and females with 2 vehicles (1,157, making up 39.7%).
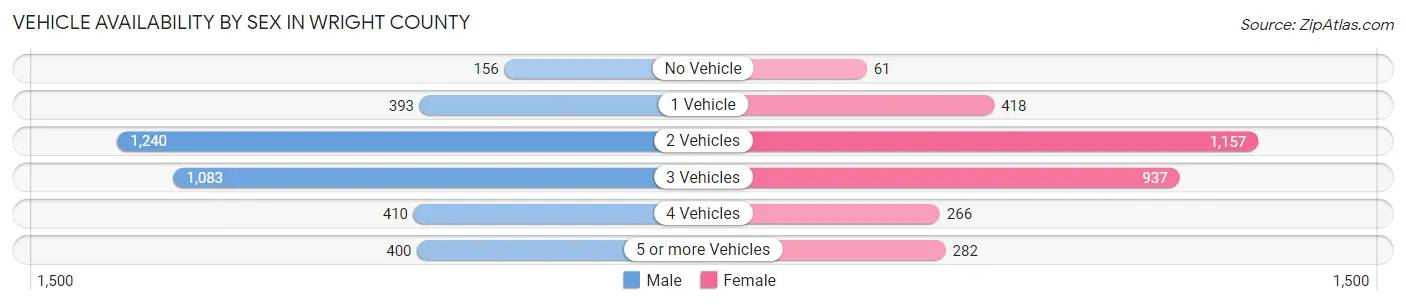
| Vehicles Available | Male | Female |
| No Vehicle | 156 (4.2%) | 61 (1.9%) |
| 1 Vehicle | 393 (10.7%) | 418 (13.4%) |
| 2 Vehicles | 1,240 (33.7%) | 1,157 (37.1%) |
| 3 Vehicles | 1,083 (29.4%) | 937 (30.0%) |
| 4 Vehicles | 410 (11.1%) | 266 (8.5%) |
| 5 or more Vehicles | 400 (10.9%) | 282 (9.0%) |
| Total | 3,682 (100.0%) | 3,121 (100.0%) |
Commute Time in Wright County
The most frequently occuring commute durations in Wright County are 5 to 9 minutes (991 commuters, 15.1%), 10 to 14 minutes (752 commuters, 11.5%), and 45 to 59 minutes (729 commuters, 11.1%).
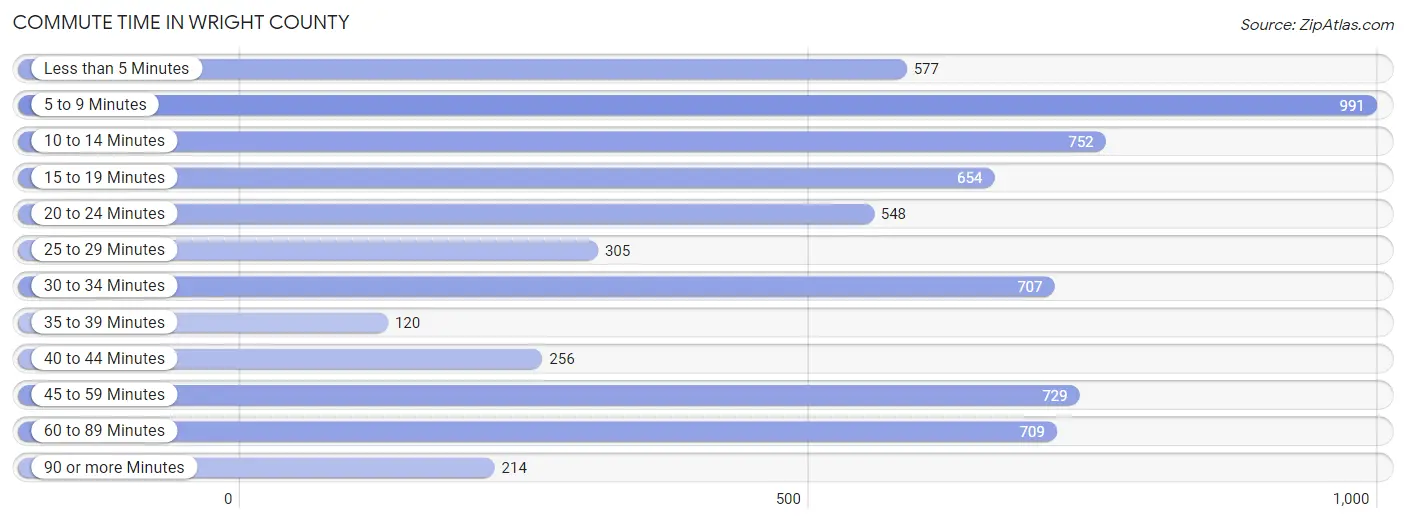
| Commute Time | # Commuters | % Commuters |
| Less than 5 Minutes | 577 | 8.8% |
| 5 to 9 Minutes | 991 | 15.1% |
| 10 to 14 Minutes | 752 | 11.5% |
| 15 to 19 Minutes | 654 | 10.0% |
| 20 to 24 Minutes | 548 | 8.4% |
| 25 to 29 Minutes | 305 | 4.6% |
| 30 to 34 Minutes | 707 | 10.8% |
| 35 to 39 Minutes | 120 | 1.8% |
| 40 to 44 Minutes | 256 | 3.9% |
| 45 to 59 Minutes | 729 | 11.1% |
| 60 to 89 Minutes | 709 | 10.8% |
| 90 or more Minutes | 214 | 3.3% |
Commute Time by Sex in Wright County
The most common commute times in Wright County are 45 to 59 minutes (491 commuters, 13.7%) for males and 5 to 9 minutes (535 commuters, 18.0%) for females.
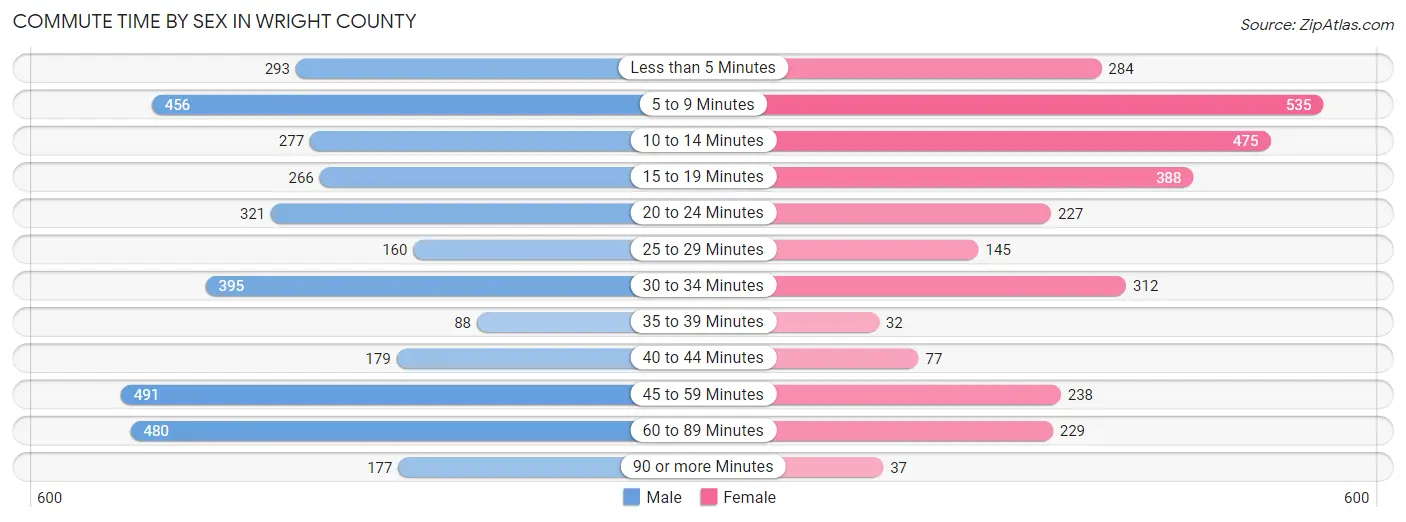
| Commute Time | Male | Female |
| Less than 5 Minutes | 293 (8.2%) | 284 (9.5%) |
| 5 to 9 Minutes | 456 (12.7%) | 535 (18.0%) |
| 10 to 14 Minutes | 277 (7.7%) | 475 (15.9%) |
| 15 to 19 Minutes | 266 (7.4%) | 388 (13.0%) |
| 20 to 24 Minutes | 321 (9.0%) | 227 (7.6%) |
| 25 to 29 Minutes | 160 (4.5%) | 145 (4.9%) |
| 30 to 34 Minutes | 395 (11.0%) | 312 (10.5%) |
| 35 to 39 Minutes | 88 (2.5%) | 32 (1.1%) |
| 40 to 44 Minutes | 179 (5.0%) | 77 (2.6%) |
| 45 to 59 Minutes | 491 (13.7%) | 238 (8.0%) |
| 60 to 89 Minutes | 480 (13.4%) | 229 (7.7%) |
| 90 or more Minutes | 177 (4.9%) | 37 (1.2%) |
Time of Departure to Work by Sex in Wright County
The most frequent times of departure to work in Wright County are 7:00 AM to 7:29 AM (514, 14.3%) for males and 7:00 AM to 7:29 AM (552, 18.5%) for females.
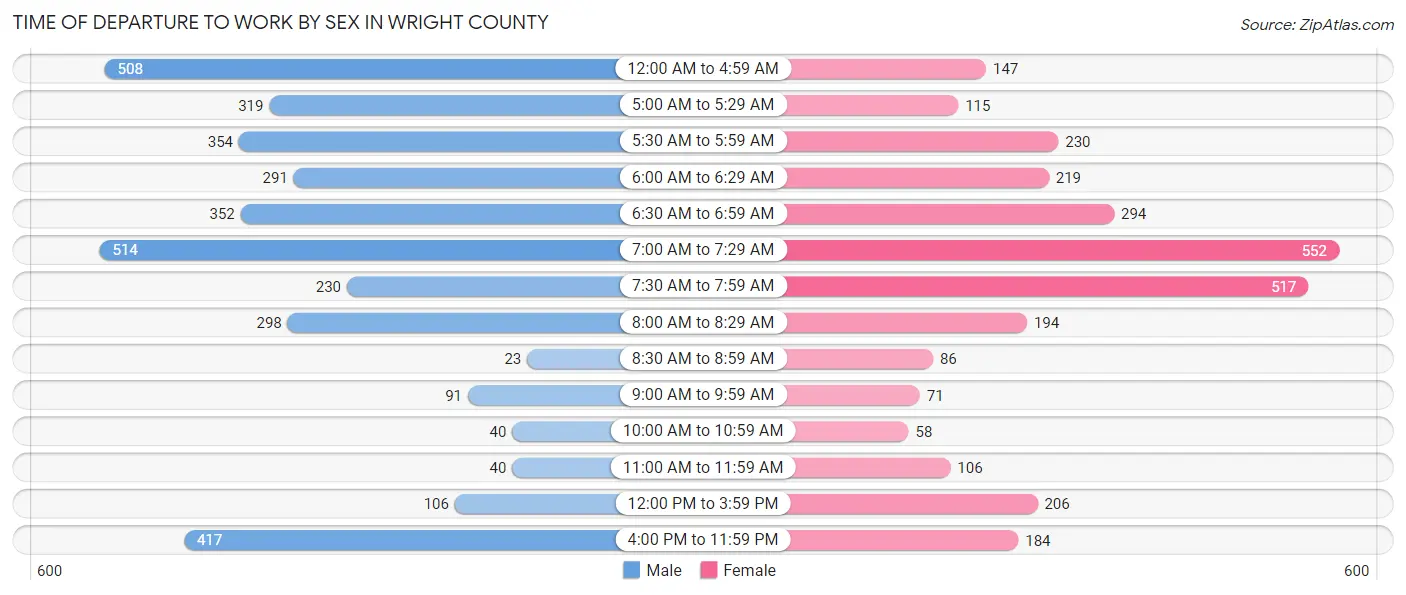
| Time of Departure | Male | Female |
| 12:00 AM to 4:59 AM | 508 (14.2%) | 147 (4.9%) |
| 5:00 AM to 5:29 AM | 319 (8.9%) | 115 (3.9%) |
| 5:30 AM to 5:59 AM | 354 (9.9%) | 230 (7.7%) |
| 6:00 AM to 6:29 AM | 291 (8.1%) | 219 (7.3%) |
| 6:30 AM to 6:59 AM | 352 (9.8%) | 294 (9.9%) |
| 7:00 AM to 7:29 AM | 514 (14.3%) | 552 (18.5%) |
| 7:30 AM to 7:59 AM | 230 (6.4%) | 517 (17.3%) |
| 8:00 AM to 8:29 AM | 298 (8.3%) | 194 (6.5%) |
| 8:30 AM to 8:59 AM | 23 (0.6%) | 86 (2.9%) |
| 9:00 AM to 9:59 AM | 91 (2.5%) | 71 (2.4%) |
| 10:00 AM to 10:59 AM | 40 (1.1%) | 58 (1.9%) |
| 11:00 AM to 11:59 AM | 40 (1.1%) | 106 (3.6%) |
| 12:00 PM to 3:59 PM | 106 (3.0%) | 206 (6.9%) |
| 4:00 PM to 11:59 PM | 417 (11.6%) | 184 (6.2%) |
| Total | 3,583 (100.0%) | 2,979 (100.0%) |
Housing Occupancy in Wright County
Occupancy by Ownership in Wright County
Of the total 6,825 dwellings in Wright County, owner-occupied units account for 5,284 (77.4%), while renter-occupied units make up 1,541 (22.6%).
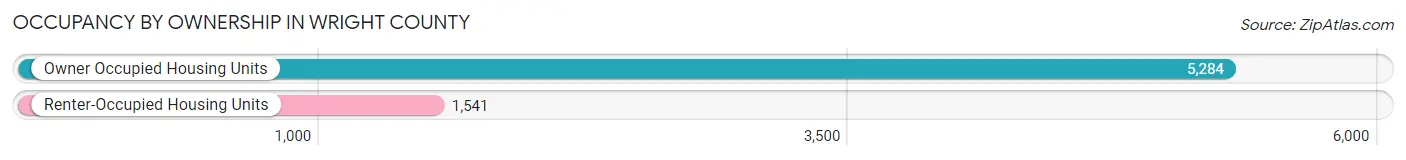
| Occupancy | # Housing Units | % Housing Units |
| Owner Occupied Housing Units | 5,284 | 77.4% |
| Renter-Occupied Housing Units | 1,541 | 22.6% |
| Total Occupied Housing Units | 6,825 | 100.0% |
Occupancy by Household Size in Wright County
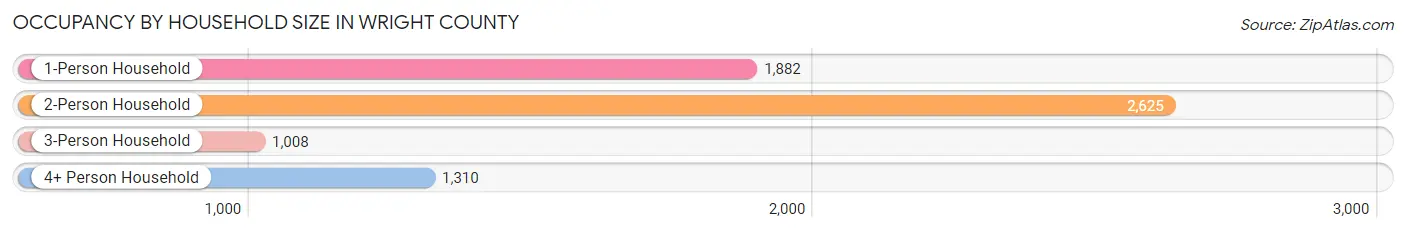
| Household Size | # Housing Units | % Housing Units |
| 1-Person Household | 1,882 | 27.6% |
| 2-Person Household | 2,625 | 38.5% |
| 3-Person Household | 1,008 | 14.8% |
| 4+ Person Household | 1,310 | 19.2% |
| Total Housing Units | 6,825 | 100.0% |
Occupancy by Ownership by Household Size in Wright County
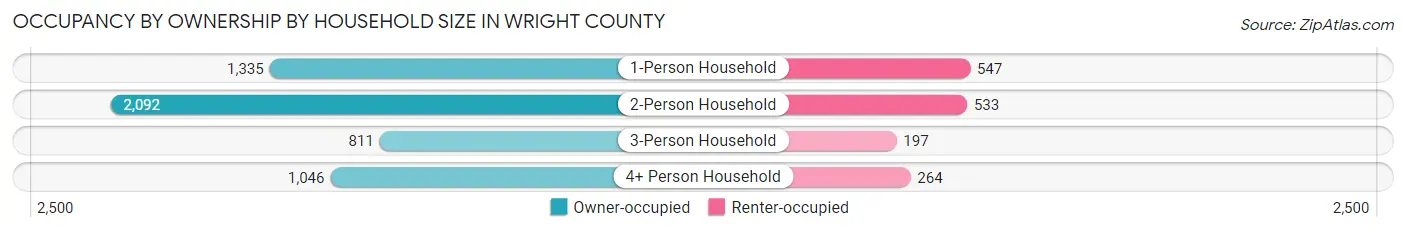
| Household Size | Owner-occupied | Renter-occupied |
| 1-Person Household | 1,335 (70.9%) | 547 (29.1%) |
| 2-Person Household | 2,092 (79.7%) | 533 (20.3%) |
| 3-Person Household | 811 (80.5%) | 197 (19.5%) |
| 4+ Person Household | 1,046 (79.8%) | 264 (20.2%) |
| Total Housing Units | 5,284 (77.4%) | 1,541 (22.6%) |
Occupancy by Educational Attainment in Wright County
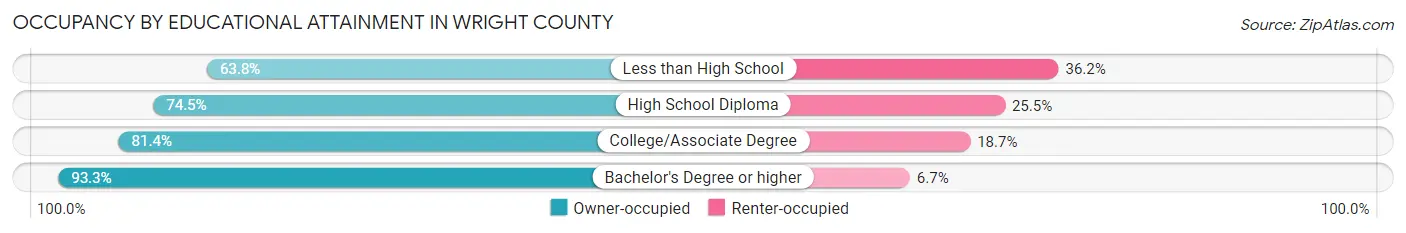
| Household Size | Owner-occupied | Renter-occupied |
| Less than High School | 699 (63.8%) | 396 (36.2%) |
| High School Diploma | 2,044 (74.5%) | 701 (25.5%) |
| College/Associate Degree | 1,662 (81.4%) | 381 (18.6%) |
| Bachelor's Degree or higher | 879 (93.3%) | 63 (6.7%) |
Occupancy by Age of Householder in Wright County
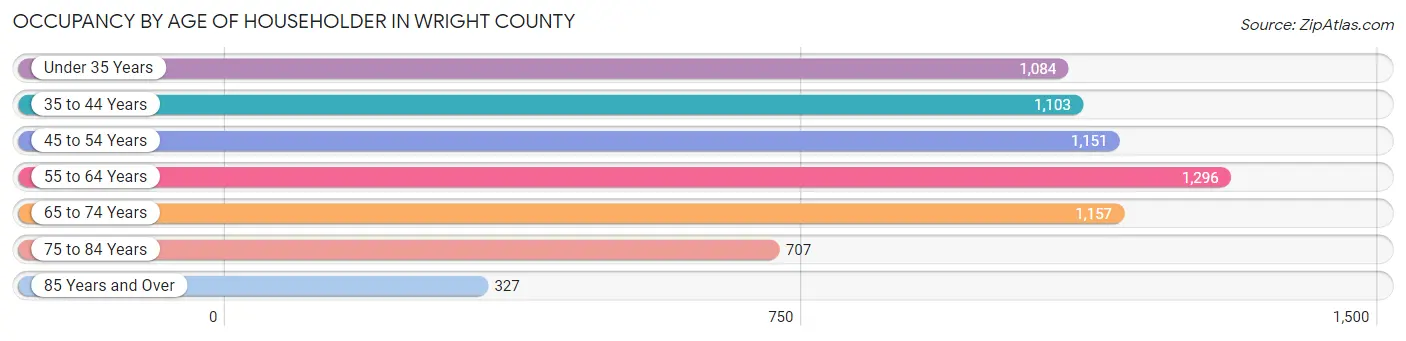
| Age Bracket | # Households | % Households |
| Under 35 Years | 1,084 | 15.9% |
| 35 to 44 Years | 1,103 | 16.2% |
| 45 to 54 Years | 1,151 | 16.9% |
| 55 to 64 Years | 1,296 | 19.0% |
| 65 to 74 Years | 1,157 | 17.0% |
| 75 to 84 Years | 707 | 10.4% |
| 85 Years and Over | 327 | 4.8% |
| Total | 6,825 | 100.0% |
Housing Finances in Wright County
Median Income by Occupancy in Wright County
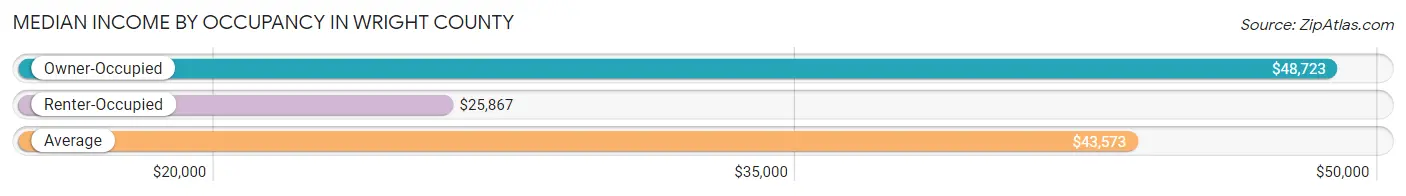
| Occupancy Type | # Households | Median Income |
| Owner-Occupied | 5,284 (77.4%) | $48,723 |
| Renter-Occupied | 1,541 (22.6%) | $25,867 |
| Average | 6,825 (100.0%) | $43,573 |
Occupancy by Householder Income Bracket in Wright County
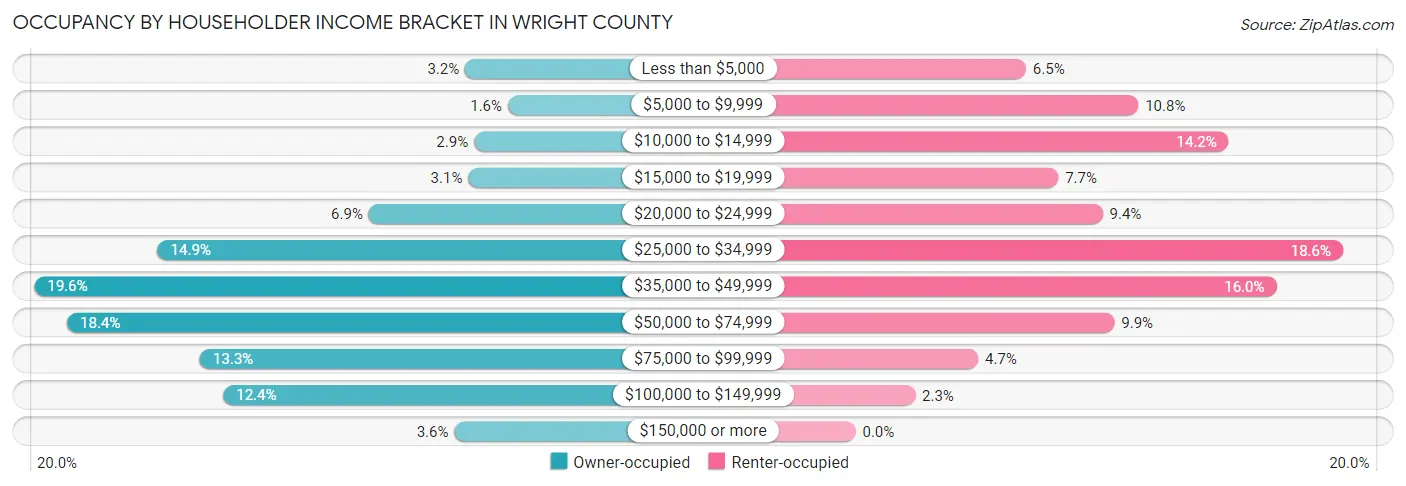
| Income Bracket | Owner-occupied | Renter-occupied |
| Less than $5,000 | 170 (3.2%) | 100 (6.5%) |
| $5,000 to $9,999 | 84 (1.6%) | 166 (10.8%) |
| $10,000 to $14,999 | 152 (2.9%) | 219 (14.2%) |
| $15,000 to $19,999 | 164 (3.1%) | 119 (7.7%) |
| $20,000 to $24,999 | 364 (6.9%) | 145 (9.4%) |
| $25,000 to $34,999 | 789 (14.9%) | 286 (18.6%) |
| $35,000 to $49,999 | 1,037 (19.6%) | 247 (16.0%) |
| $50,000 to $74,999 | 971 (18.4%) | 152 (9.9%) |
| $75,000 to $99,999 | 704 (13.3%) | 72 (4.7%) |
| $100,000 to $149,999 | 657 (12.4%) | 35 (2.3%) |
| $150,000 or more | 192 (3.6%) | 0 (0.0%) |
| Total | 5,284 (100.0%) | 1,541 (100.0%) |
Monthly Housing Cost Tiers in Wright County
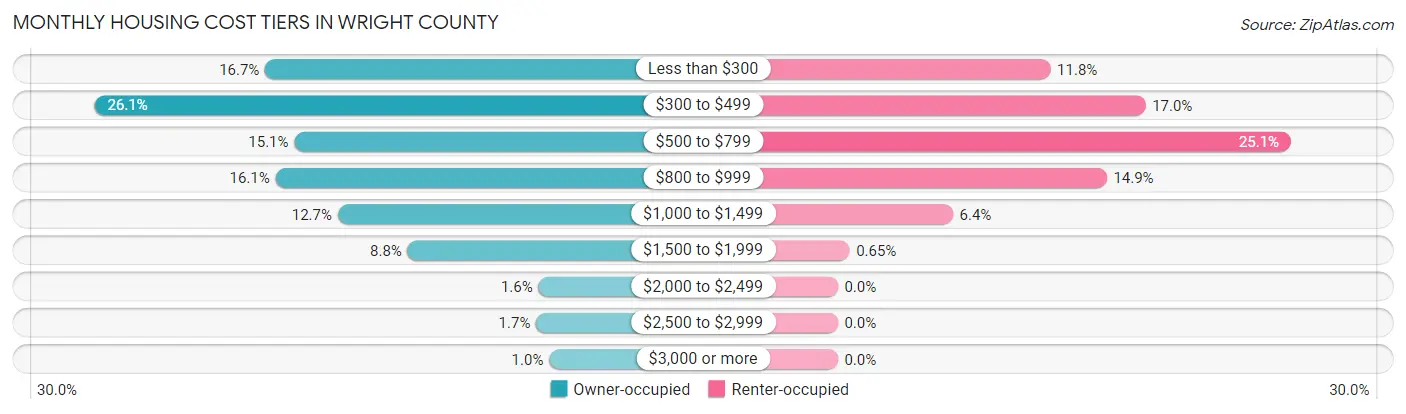
| Monthly Cost | Owner-occupied | Renter-occupied |
| Less than $300 | 883 (16.7%) | 181 (11.7%) |
| $300 to $499 | 1,381 (26.1%) | 262 (17.0%) |
| $500 to $799 | 798 (15.1%) | 386 (25.1%) |
| $800 to $999 | 853 (16.1%) | 229 (14.9%) |
| $1,000 to $1,499 | 671 (12.7%) | 98 (6.4%) |
| $1,500 to $1,999 | 467 (8.8%) | 10 (0.6%) |
| $2,000 to $2,499 | 85 (1.6%) | 0 (0.0%) |
| $2,500 to $2,999 | 92 (1.7%) | 0 (0.0%) |
| $3,000 or more | 54 (1.0%) | 0 (0.0%) |
| Total | 5,284 (100.0%) | 1,541 (100.0%) |
Physical Housing Characteristics in Wright County
Housing Structures in Wright County
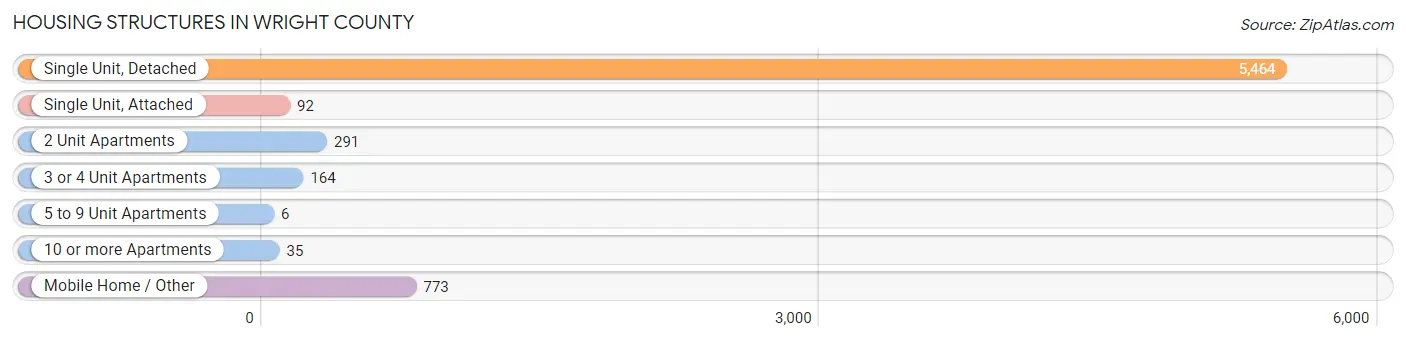
| Structure Type | # Housing Units | % Housing Units |
| Single Unit, Detached | 5,464 | 80.1% |
| Single Unit, Attached | 92 | 1.3% |
| 2 Unit Apartments | 291 | 4.3% |
| 3 or 4 Unit Apartments | 164 | 2.4% |
| 5 to 9 Unit Apartments | 6 | 0.1% |
| 10 or more Apartments | 35 | 0.5% |
| Mobile Home / Other | 773 | 11.3% |
| Total | 6,825 | 100.0% |
Housing Structures by Occupancy in Wright County
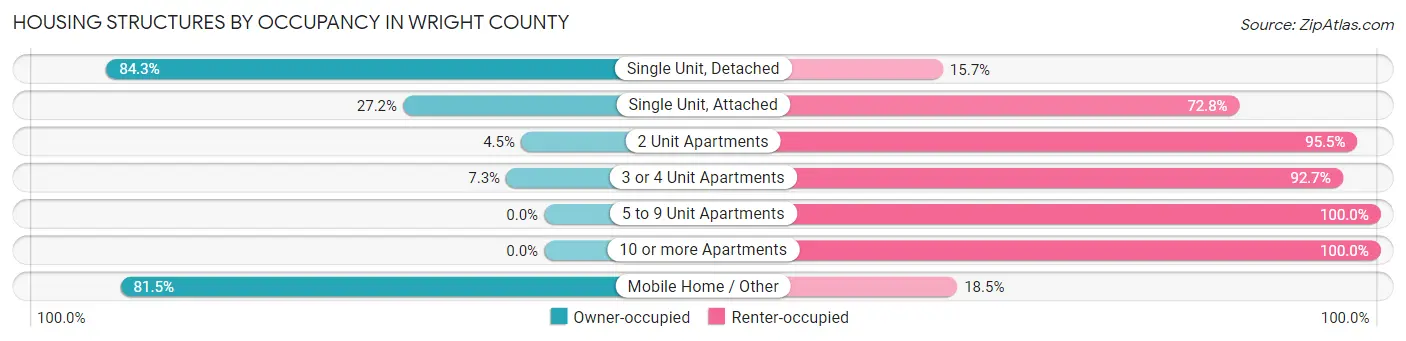
| Structure Type | Owner-occupied | Renter-occupied |
| Single Unit, Detached | 4,604 (84.3%) | 860 (15.7%) |
| Single Unit, Attached | 25 (27.2%) | 67 (72.8%) |
| 2 Unit Apartments | 13 (4.5%) | 278 (95.5%) |
| 3 or 4 Unit Apartments | 12 (7.3%) | 152 (92.7%) |
| 5 to 9 Unit Apartments | 0 (0.0%) | 6 (100.0%) |
| 10 or more Apartments | 0 (0.0%) | 35 (100.0%) |
| Mobile Home / Other | 630 (81.5%) | 143 (18.5%) |
| Total | 5,284 (77.4%) | 1,541 (22.6%) |
Housing Structures by Number of Rooms in Wright County
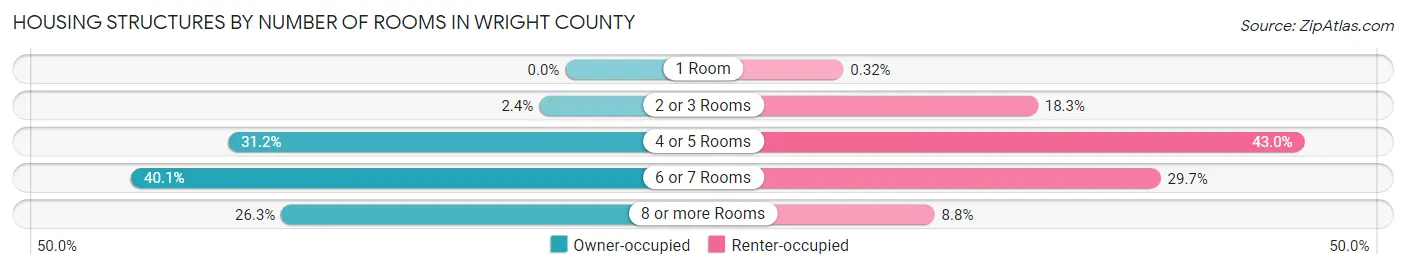
| Number of Rooms | Owner-occupied | Renter-occupied |
| 1 Room | 0 (0.0%) | 5 (0.3%) |
| 2 or 3 Rooms | 128 (2.4%) | 282 (18.3%) |
| 4 or 5 Rooms | 1,647 (31.2%) | 662 (43.0%) |
| 6 or 7 Rooms | 2,121 (40.1%) | 457 (29.7%) |
| 8 or more Rooms | 1,388 (26.3%) | 135 (8.8%) |
| Total | 5,284 (100.0%) | 1,541 (100.0%) |
Housing Structure by Heating Type in Wright County
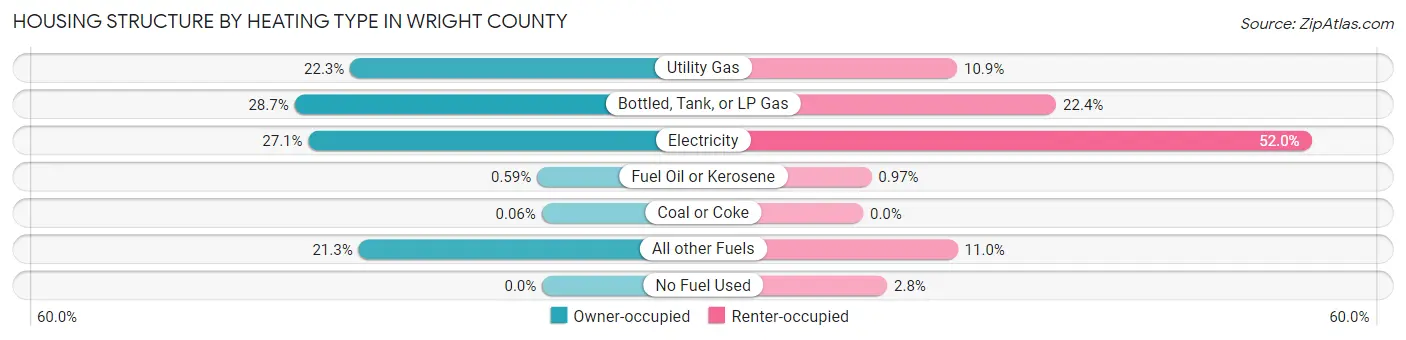
| Heating Type | Owner-occupied | Renter-occupied |
| Utility Gas | 1,176 (22.3%) | 168 (10.9%) |
| Bottled, Tank, or LP Gas | 1,517 (28.7%) | 345 (22.4%) |
| Electricity | 1,432 (27.1%) | 801 (52.0%) |
| Fuel Oil or Kerosene | 31 (0.6%) | 15 (1.0%) |
| Coal or Coke | 3 (0.1%) | 0 (0.0%) |
| All other Fuels | 1,125 (21.3%) | 169 (11.0%) |
| No Fuel Used | 0 (0.0%) | 43 (2.8%) |
| Total | 5,284 (100.0%) | 1,541 (100.0%) |
Household Vehicle Usage in Wright County
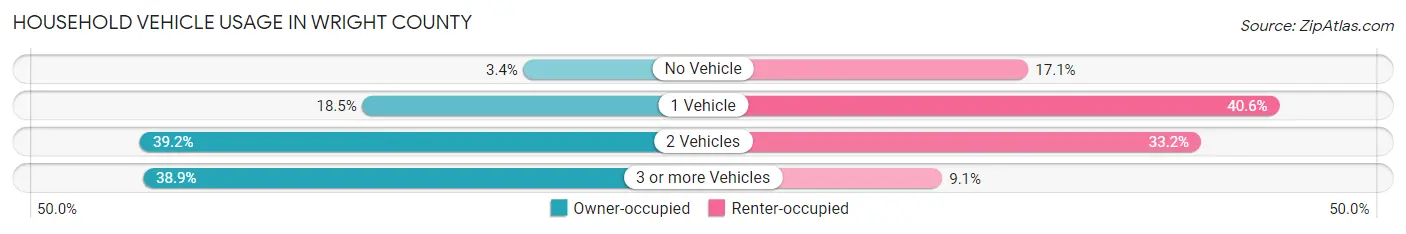
| Vehicles per Household | Owner-occupied | Renter-occupied |
| No Vehicle | 180 (3.4%) | 264 (17.1%) |
| 1 Vehicle | 975 (18.4%) | 625 (40.6%) |
| 2 Vehicles | 2,072 (39.2%) | 512 (33.2%) |
| 3 or more Vehicles | 2,057 (38.9%) | 140 (9.1%) |
| Total | 5,284 (100.0%) | 1,541 (100.0%) |
Real Estate & Mortgages in Wright County
Real Estate and Mortgage Overview in Wright County
| Characteristic | Without Mortgage | With Mortgage |
| Housing Units | 2,559 | 2,725 |
| Median Property Value | $156,000 | $132,300 |
| Median Household Income | $43,645 | $128 |
| Monthly Housing Costs | $351 | $26 |
| Real Estate Taxes | $535 | $38 |
Property Value by Mortgage Status in Wright County
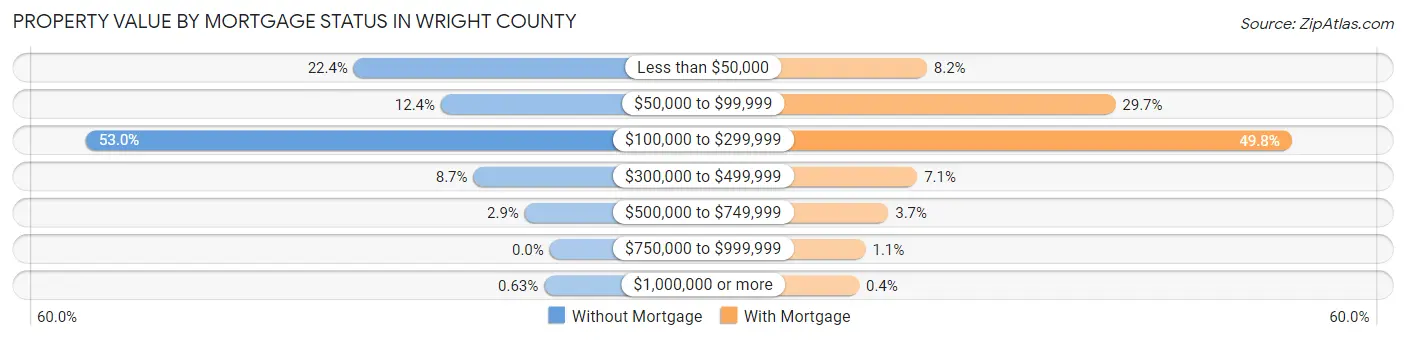
| Property Value | Without Mortgage | With Mortgage |
| Less than $50,000 | 573 (22.4%) | 222 (8.2%) |
| $50,000 to $99,999 | 318 (12.4%) | 809 (29.7%) |
| $100,000 to $299,999 | 1,356 (53.0%) | 1,358 (49.8%) |
| $300,000 to $499,999 | 223 (8.7%) | 192 (7.0%) |
| $500,000 to $749,999 | 73 (2.9%) | 102 (3.7%) |
| $750,000 to $999,999 | 0 (0.0%) | 31 (1.1%) |
| $1,000,000 or more | 16 (0.6%) | 11 (0.4%) |
| Total | 2,559 (100.0%) | 2,725 (100.0%) |
Household Income by Mortgage Status in Wright County
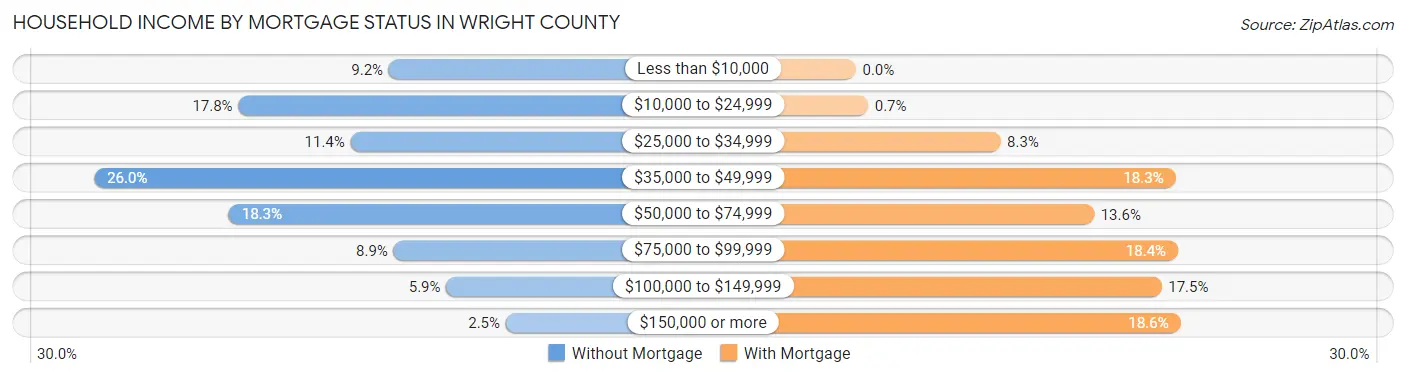
| Household Income | Without Mortgage | With Mortgage |
| Less than $10,000 | 235 (9.2%) | 0 (0.0%) |
| $10,000 to $24,999 | 455 (17.8%) | 19 (0.7%) |
| $25,000 to $34,999 | 291 (11.4%) | 225 (8.3%) |
| $35,000 to $49,999 | 666 (26.0%) | 498 (18.3%) |
| $50,000 to $74,999 | 469 (18.3%) | 371 (13.6%) |
| $75,000 to $99,999 | 228 (8.9%) | 502 (18.4%) |
| $100,000 to $149,999 | 151 (5.9%) | 476 (17.5%) |
| $150,000 or more | 64 (2.5%) | 506 (18.6%) |
| Total | 2,559 (100.0%) | 2,725 (100.0%) |
Property Value to Household Income Ratio in Wright County
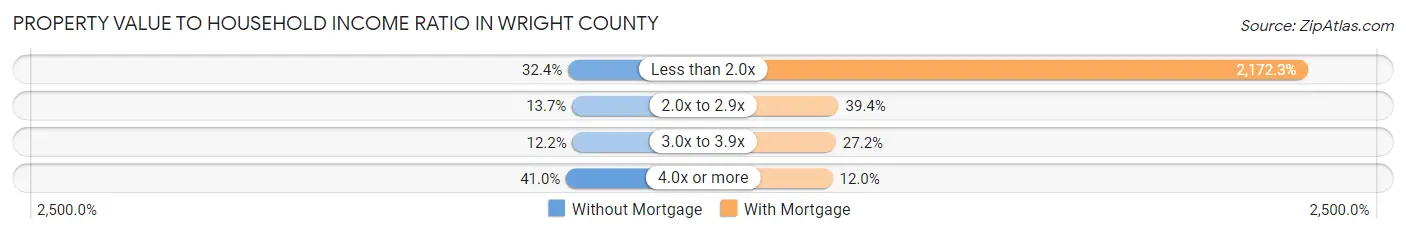
| Value-to-Income Ratio | Without Mortgage | With Mortgage |
| Less than 2.0x | 830 (32.4%) | 59,196 (2,172.3%) |
| 2.0x to 2.9x | 351 (13.7%) | 1,073 (39.4%) |
| 3.0x to 3.9x | 312 (12.2%) | 742 (27.2%) |
| 4.0x or more | 1,050 (41.0%) | 326 (12.0%) |
| Total | 2,559 (100.0%) | 2,725 (100.0%) |
Real Estate Taxes by Mortgage Status in Wright County
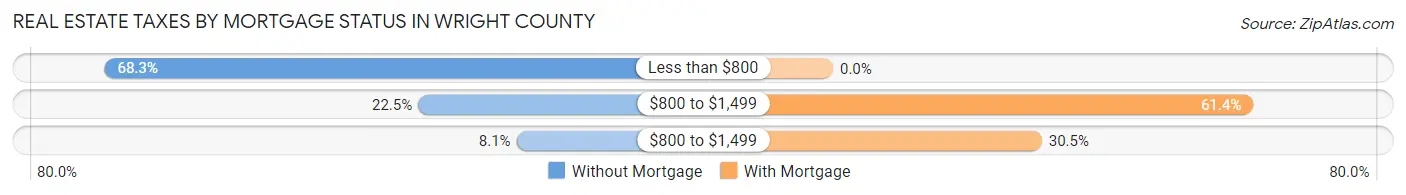
| Property Taxes | Without Mortgage | With Mortgage |
| Less than $800 | 1,748 (68.3%) | 0 (0.0%) |
| $800 to $1,499 | 576 (22.5%) | 1,673 (61.4%) |
| $800 to $1,499 | 208 (8.1%) | 831 (30.5%) |
| Total | 2,559 (100.0%) | 2,725 (100.0%) |
Health & Disability in Wright County
Health Insurance Coverage by Age in Wright County
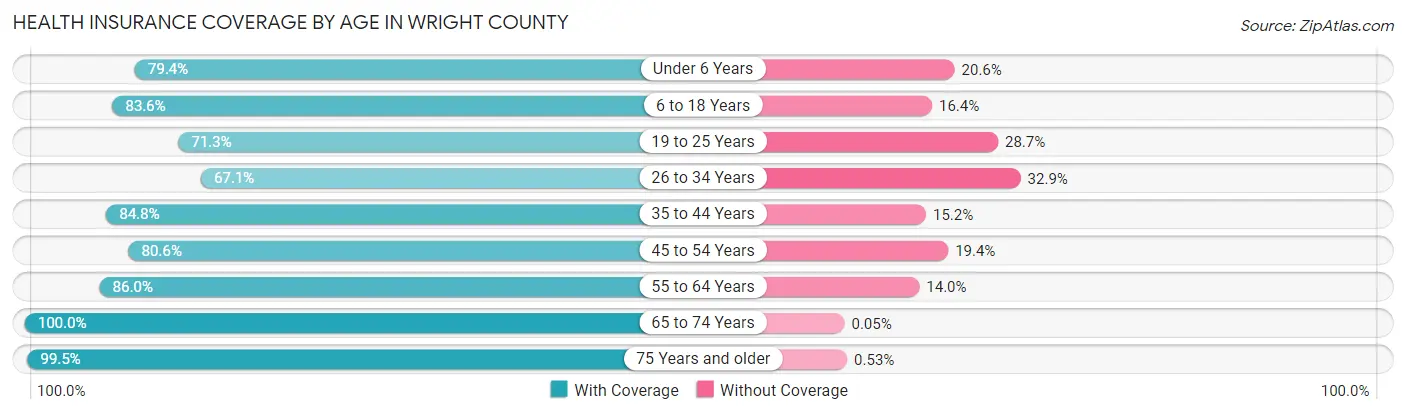
| Age Bracket | With Coverage | Without Coverage |
| Under 6 Years | 1,197 (79.4%) | 310 (20.6%) |
| 6 to 18 Years | 2,962 (83.6%) | 580 (16.4%) |
| 19 to 25 Years | 1,025 (71.3%) | 412 (28.7%) |
| 26 to 34 Years | 1,171 (67.1%) | 574 (32.9%) |
| 35 to 44 Years | 1,652 (84.8%) | 297 (15.2%) |
| 45 to 54 Years | 1,668 (80.6%) | 401 (19.4%) |
| 55 to 64 Years | 2,138 (86.0%) | 348 (14.0%) |
| 65 to 74 Years | 2,056 (100.0%) | 1 (0.1%) |
| 75 Years and older | 1,494 (99.5%) | 8 (0.5%) |
| Total | 15,363 (84.0%) | 2,931 (16.0%) |
Health Insurance Coverage by Citizenship Status in Wright County
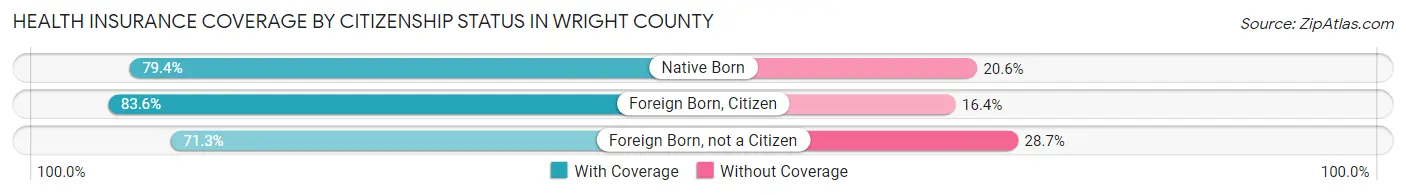
| Citizenship Status | With Coverage | Without Coverage |
| Native Born | 1,197 (79.4%) | 310 (20.6%) |
| Foreign Born, Citizen | 2,962 (83.6%) | 580 (16.4%) |
| Foreign Born, not a Citizen | 1,025 (71.3%) | 412 (28.7%) |
Health Insurance Coverage by Household Income in Wright County
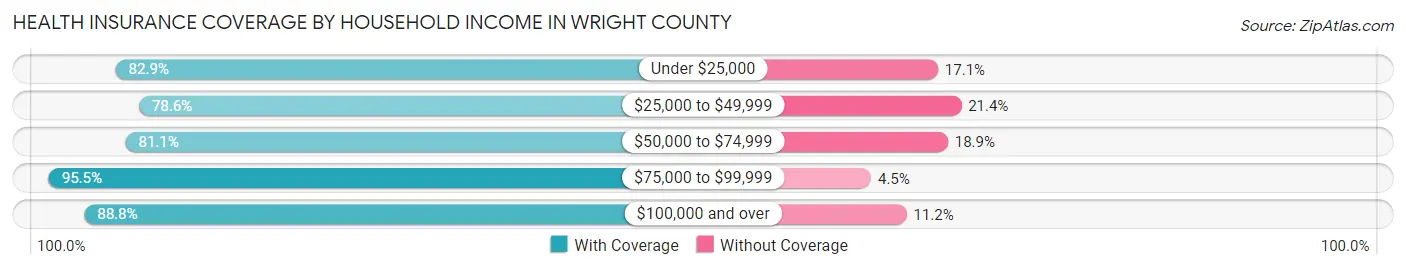
| Household Income | With Coverage | Without Coverage |
| Under $25,000 | 2,341 (82.9%) | 482 (17.1%) |
| $25,000 to $49,999 | 4,951 (78.6%) | 1,350 (21.4%) |
| $50,000 to $74,999 | 2,640 (81.1%) | 616 (18.9%) |
| $75,000 to $99,999 | 2,547 (95.5%) | 121 (4.5%) |
| $100,000 and over | 2,873 (88.8%) | 362 (11.2%) |
Public vs Private Health Insurance Coverage by Age in Wright County
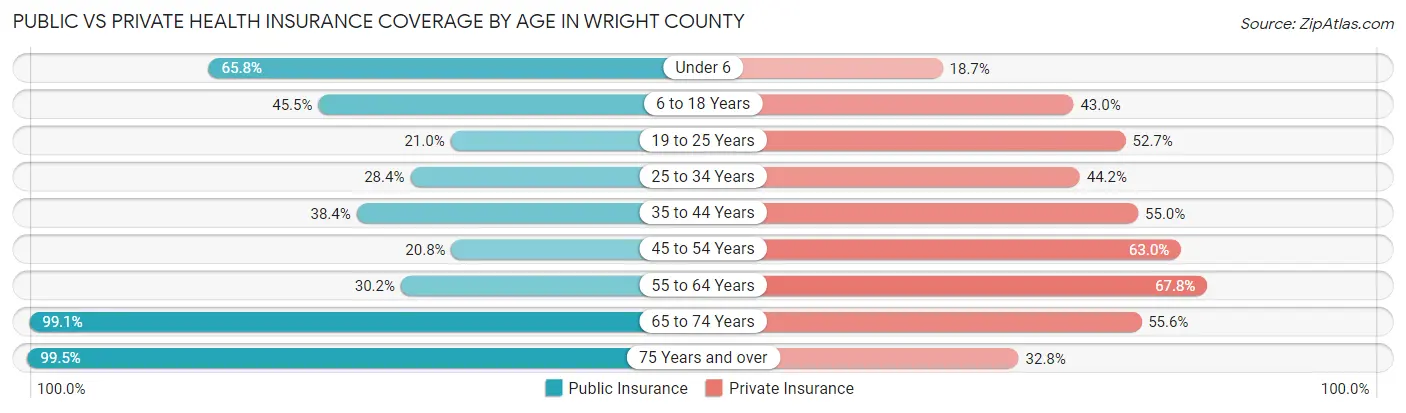
| Age Bracket | Public Insurance | Private Insurance |
| Under 6 | 992 (65.8%) | 282 (18.7%) |
| 6 to 18 Years | 1,611 (45.5%) | 1,523 (43.0%) |
| 19 to 25 Years | 301 (20.9%) | 757 (52.7%) |
| 25 to 34 Years | 496 (28.4%) | 771 (44.2%) |
| 35 to 44 Years | 748 (38.4%) | 1,072 (55.0%) |
| 45 to 54 Years | 430 (20.8%) | 1,303 (63.0%) |
| 55 to 64 Years | 750 (30.2%) | 1,686 (67.8%) |
| 65 to 74 Years | 2,039 (99.1%) | 1,143 (55.6%) |
| 75 Years and over | 1,494 (99.5%) | 493 (32.8%) |
| Total | 8,861 (48.4%) | 9,030 (49.4%) |
Disability Status by Sex by Age in Wright County
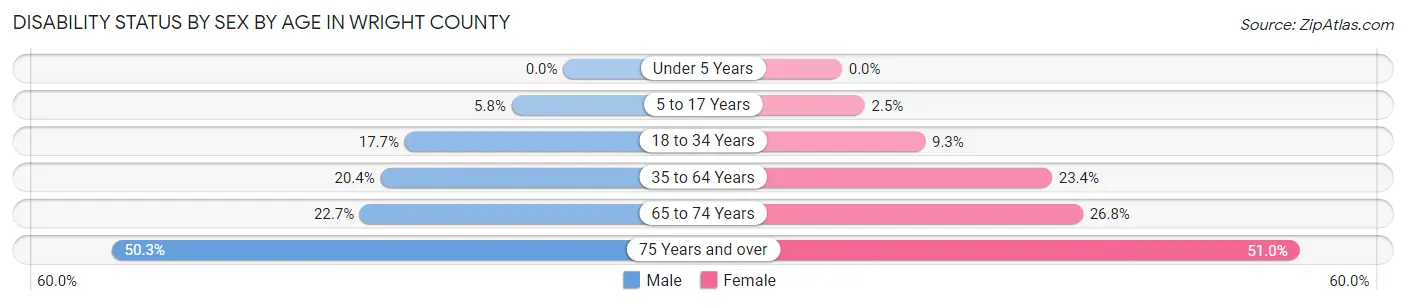
| Age Bracket | Male | Female |
| Under 5 Years | 0 (0.0%) | 0 (0.0%) |
| 5 to 17 Years | 100 (5.8%) | 45 (2.5%) |
| 18 to 34 Years | 310 (17.7%) | 156 (9.3%) |
| 35 to 64 Years | 654 (20.4%) | 770 (23.4%) |
| 65 to 74 Years | 222 (22.7%) | 289 (26.8%) |
| 75 Years and over | 340 (50.3%) | 421 (51.0%) |
Disability Class by Sex by Age in Wright County
Disability Class: Hearing Difficulty
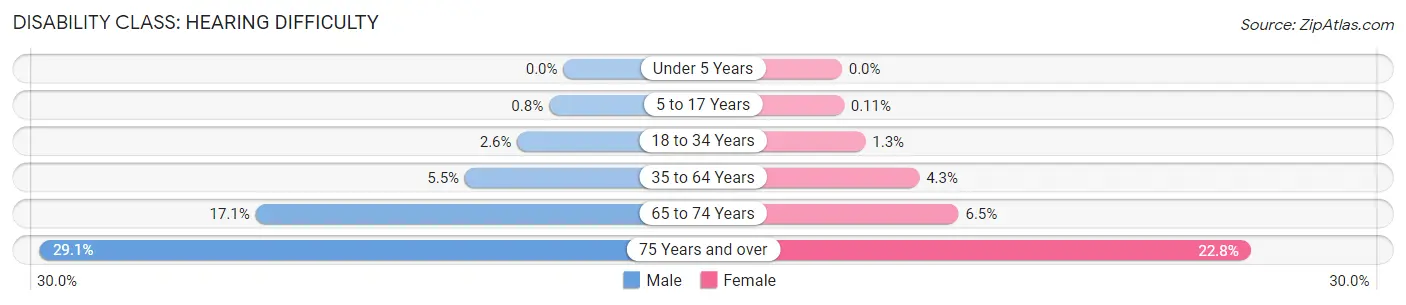
| Age Bracket | Male | Female |
| Under 5 Years | 0 (0.0%) | 0 (0.0%) |
| 5 to 17 Years | 14 (0.8%) | 2 (0.1%) |
| 18 to 34 Years | 45 (2.6%) | 22 (1.3%) |
| 35 to 64 Years | 176 (5.5%) | 142 (4.3%) |
| 65 to 74 Years | 168 (17.1%) | 70 (6.5%) |
| 75 Years and over | 197 (29.1%) | 188 (22.8%) |
Disability Class: Vision Difficulty
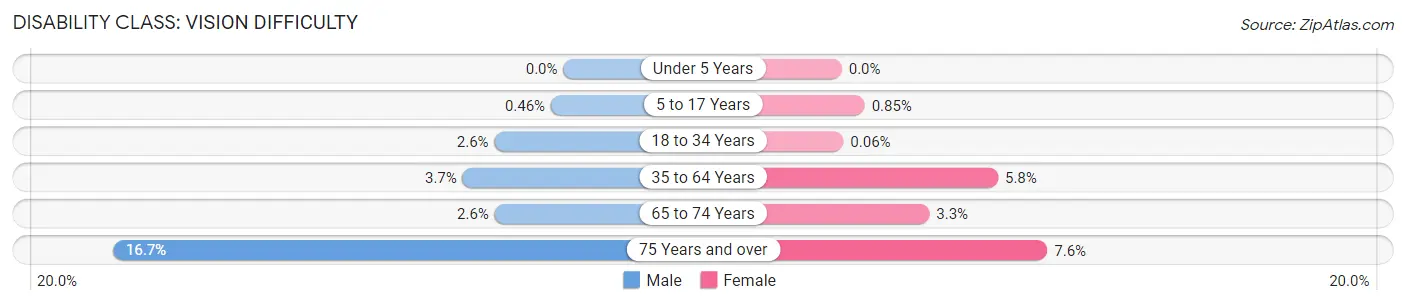
| Age Bracket | Male | Female |
| Under 5 Years | 0 (0.0%) | 0 (0.0%) |
| 5 to 17 Years | 8 (0.5%) | 15 (0.9%) |
| 18 to 34 Years | 45 (2.6%) | 1 (0.1%) |
| 35 to 64 Years | 120 (3.7%) | 191 (5.8%) |
| 65 to 74 Years | 25 (2.5%) | 35 (3.3%) |
| 75 Years and over | 113 (16.7%) | 63 (7.6%) |
Disability Class: Cognitive Difficulty
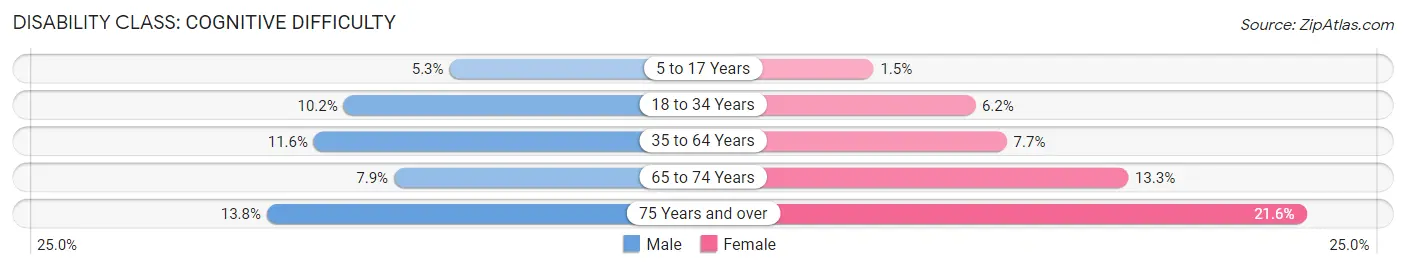
| Age Bracket | Male | Female |
| 5 to 17 Years | 92 (5.3%) | 26 (1.5%) |
| 18 to 34 Years | 179 (10.2%) | 104 (6.2%) |
| 35 to 64 Years | 372 (11.6%) | 252 (7.6%) |
| 65 to 74 Years | 77 (7.9%) | 143 (13.3%) |
| 75 Years and over | 93 (13.8%) | 178 (21.5%) |
Disability Class: Ambulatory Difficulty
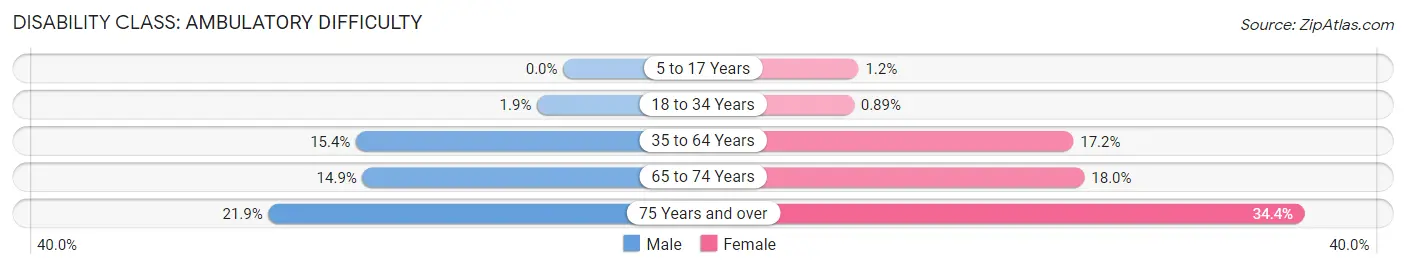
| Age Bracket | Male | Female |
| 5 to 17 Years | 0 (0.0%) | 22 (1.2%) |
| 18 to 34 Years | 34 (1.9%) | 15 (0.9%) |
| 35 to 64 Years | 494 (15.4%) | 566 (17.2%) |
| 65 to 74 Years | 146 (14.9%) | 194 (18.0%) |
| 75 Years and over | 148 (21.9%) | 284 (34.4%) |
Disability Class: Self-Care Difficulty
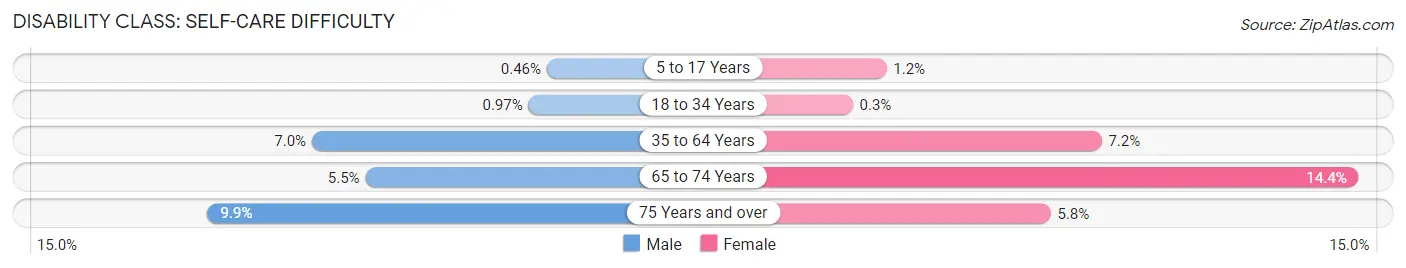
| Age Bracket | Male | Female |
| 5 to 17 Years | 8 (0.5%) | 22 (1.2%) |
| 18 to 34 Years | 17 (1.0%) | 5 (0.3%) |
| 35 to 64 Years | 225 (7.0%) | 238 (7.2%) |
| 65 to 74 Years | 54 (5.5%) | 155 (14.4%) |
| 75 Years and over | 67 (9.9%) | 48 (5.8%) |
Technology Access in Wright County
Computing Device Access in Wright County
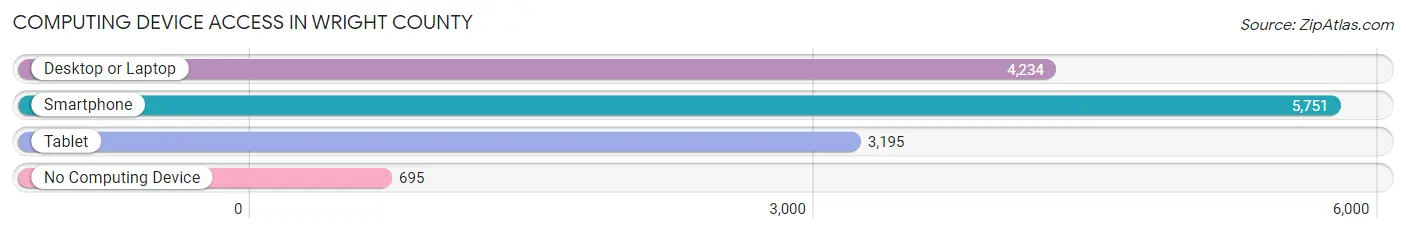
| Device Type | # Households | % Households |
| Desktop or Laptop | 4,234 | 62.0% |
| Smartphone | 5,751 | 84.3% |
| Tablet | 3,195 | 46.8% |
| No Computing Device | 695 | 10.2% |
| Total | 6,825 | 100.0% |
Internet Access in Wright County
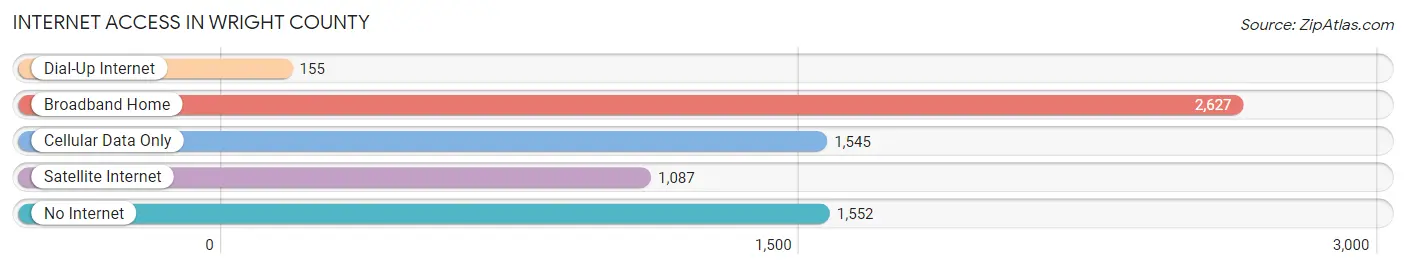
| Internet Type | # Households | % Households |
| Dial-Up Internet | 155 | 2.3% |
| Broadband Home | 2,627 | 38.5% |
| Cellular Data Only | 1,545 | 22.6% |
| Satellite Internet | 1,087 | 15.9% |
| No Internet | 1,552 | 22.7% |
| Total | 6,825 | 100.0% |
Wright County Summary
Wright County is located in the south-central region of Missouri, and is bordered by Texas, Douglas, Webster, Laclede, and Texas counties. The county seat is Hartville, and the county was named after Silas Wright, a former governor of New York. The county has a total area of 590 square miles, and a population of 18,817 as of the 2010 census.
Geography
Wright County is located in the Ozark Plateau region of Missouri, and is characterized by rolling hills and valleys. The county is drained by the Gasconade River, which flows through the county from north to south. The county is also home to several small lakes, including Lake Wright, Lake Hartville, and Lake Norfork. The highest point in the county is located in the northwest corner, at an elevation of 1,400 feet.
The county is mostly rural, with the majority of the population living in small towns and villages. The largest city in the county is Hartville, with a population of 1,817 as of the 2010 census. Other towns and villages include Mountain Grove, Mansfield, Norfork, and Graff.
Economy
The economy of Wright County is largely based on agriculture. The county is home to a variety of crops, including corn, soybeans, wheat, hay, and oats. Livestock production is also important to the county’s economy, with cattle, hogs, and poultry being the main animals raised.
The county is also home to several manufacturing companies, including a furniture factory, a woodworking plant, and a plastics factory. Tourism is also an important part of the county’s economy, with several state parks and recreational areas located in the county.
Demographics
As of the 2010 census, the population of Wright County was 18,817, with a population density of 32 people per square mile. The racial makeup of the county was 97.3% White, 0.7% African American, 0.3% Native American, 0.2% Asian, 0.1% Pacific Islander, 0.4% from other races, and 1.0% from two or more races. Hispanic or Latino of any race were 1.3% of the population.
The median income for a household in the county was $35,945, and the median income for a family was $41,945. The per capita income for the county was $17,845. About 14.2% of the population was below the poverty line.
Conclusion
Wright County is a rural county located in the south-central region of Missouri. The county is characterized by rolling hills and valleys, and is home to a variety of crops and livestock. The economy of the county is largely based on agriculture, with manufacturing and tourism also playing an important role. The population of the county is mostly white, with a median income of $35,945 and a poverty rate of 14.2%.
Common Questions
What is Per Capita Income in Wright County?
Per Capita income in Wright County is $22,602.
What is the Median Family Income in Wright County?
Median Family Income in Wright County is $51,265.
What is the Median Household income in Wright County?
Median Household Income in Wright County is $43,573.
What is Income or Wage Gap in Wright County?
Income or Wage Gap in Wright County is 32.7%.
Women in Wright County earn 67.3 cents for every dollar earned by a man.
What is Family Income Deficit in Wright County?
Family Income Deficit in Wright County is $9,783.
Families that are below poverty line in Wright County earn $9,783 less on average than the poverty threshold level.
What is Inequality or Gini Index in Wright County?
Inequality or Gini Index in Wright County is 0.43.
What is the Total Population of Wright County?
Total Population of Wright County is 18,475.
What is the Total Male Population of Wright County?
Total Male Population of Wright County is 9,137.
What is the Total Female Population of Wright County?
Total Female Population of Wright County is 9,338.
What is the Ratio of Males per 100 Females in Wright County?
There are 97.85 Males per 100 Females in Wright County.
What is the Ratio of Females per 100 Males in Wright County?
There are 102.20 Females per 100 Males in Wright County.
What is the Median Population Age in Wright County?
Median Population Age in Wright County is 41.1 Years.
What is the Average Family Size in Wright County
Average Family Size in Wright County is 3.2 People.
What is the Average Household Size in Wright County
Average Household Size in Wright County is 2.7 People.
How Large is the Labor Force in Wright County?
There are 7,214 People in the Labor Forcein in Wright County.
What is the Percentage of People in the Labor Force in Wright County?
50.6% of People are in the Labor Force in Wright County.
What is the Unemployment Rate in Wright County?
Unemployment Rate in Wright County is 4.8%.