Worth County, MO Map & Demographics
Worth County Map
Worth County Overview
$30,800
PER CAPITA INCOME
$65,000
AVG FAMILY INCOME
$43,536
AVG HOUSEHOLD INCOME
62.9%
WAGE / INCOME GAP [ % ]
37.1¢/ $1
WAGE / INCOME GAP [ $ ]
0.43
INEQUALITY / GINI INDEX
1,982
TOTAL POPULATION
991
MALE POPULATION
991
FEMALE POPULATION
100.00
MALES / 100 FEMALES
100.00
FEMALES / 100 MALES
48.7
MEDIAN AGE
3.4
AVG FAMILY SIZE
2.5
AVG HOUSEHOLD SIZE
939
LABOR FORCE [ PEOPLE ]
58.2%
PERCENT IN LABOR FORCE
0.9%
UNEMPLOYMENT RATE
Worth County Area Codes
Income in Worth County
Income Overview in Worth County
Per Capita Income in Worth County is $30,800, while median incomes of families and households are $65,000 and $43,536 respectively.
| Characteristic | Number | Measure |
| Per Capita Income | 1,982 | $30,800 |
| Median Family Income | 450 | $65,000 |
| Mean Family Income | 450 | $76,660 |
| Median Household Income | 773 | $43,536 |
| Mean Household Income | 773 | $62,637 |
| Income Deficit | 450 | $0 |
| Wage / Income Gap (%) | 1,982 | 62.87% |
| Wage / Income Gap ($) | 1,982 | 37.13¢ per $1 |
| Gini / Inequality Index | 1,982 | 0.43 |
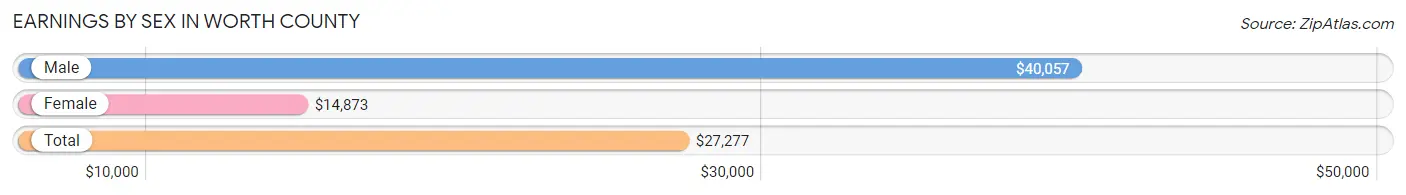
Earnings by Sex in Worth County
Average Earnings in Worth County are $27,277, $40,057 for men and $14,873 for women, a difference of 62.9%.
| Sex | Number | Average Earnings |
| Male | 519 (52.5%) | $40,057 |
| Female | 470 (47.5%) | $14,873 |
| Total | 989 (100.0%) | $27,277 |
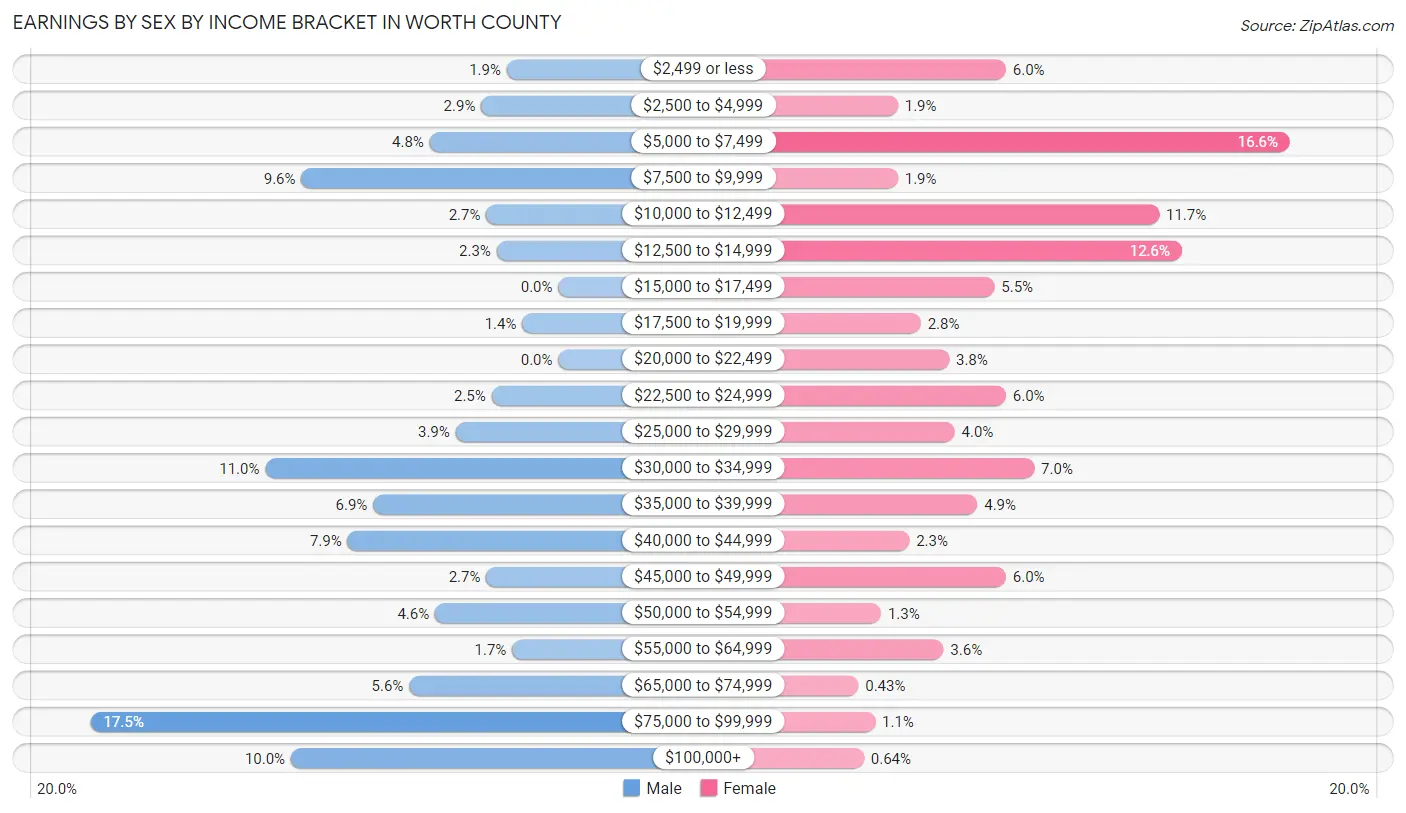
Earnings by Sex by Income Bracket in Worth County
The most common earnings brackets in Worth County are $75,000 to $99,999 for men (91 | 17.5%) and $5,000 to $7,499 for women (78 | 16.6%).
| Income | Male | Female |
| $2,499 or less | 10 (1.9%) | 28 (6.0%) |
| $2,500 to $4,999 | 15 (2.9%) | 9 (1.9%) |
| $5,000 to $7,499 | 25 (4.8%) | 78 (16.6%) |
| $7,500 to $9,999 | 50 (9.6%) | 9 (1.9%) |
| $10,000 to $12,499 | 14 (2.7%) | 55 (11.7%) |
| $12,500 to $14,999 | 12 (2.3%) | 59 (12.6%) |
| $15,000 to $17,499 | 0 (0.0%) | 26 (5.5%) |
| $17,500 to $19,999 | 7 (1.3%) | 13 (2.8%) |
| $20,000 to $22,499 | 0 (0.0%) | 18 (3.8%) |
| $22,500 to $24,999 | 13 (2.5%) | 28 (6.0%) |
| $25,000 to $29,999 | 20 (3.8%) | 19 (4.0%) |
| $30,000 to $34,999 | 57 (11.0%) | 33 (7.0%) |
| $35,000 to $39,999 | 36 (6.9%) | 23 (4.9%) |
| $40,000 to $44,999 | 41 (7.9%) | 11 (2.3%) |
| $45,000 to $49,999 | 14 (2.7%) | 28 (6.0%) |
| $50,000 to $54,999 | 24 (4.6%) | 6 (1.3%) |
| $55,000 to $64,999 | 9 (1.7%) | 17 (3.6%) |
| $65,000 to $74,999 | 29 (5.6%) | 2 (0.4%) |
| $75,000 to $99,999 | 91 (17.5%) | 5 (1.1%) |
| $100,000+ | 52 (10.0%) | 3 (0.6%) |
| Total | 519 (100.0%) | 470 (100.0%) |
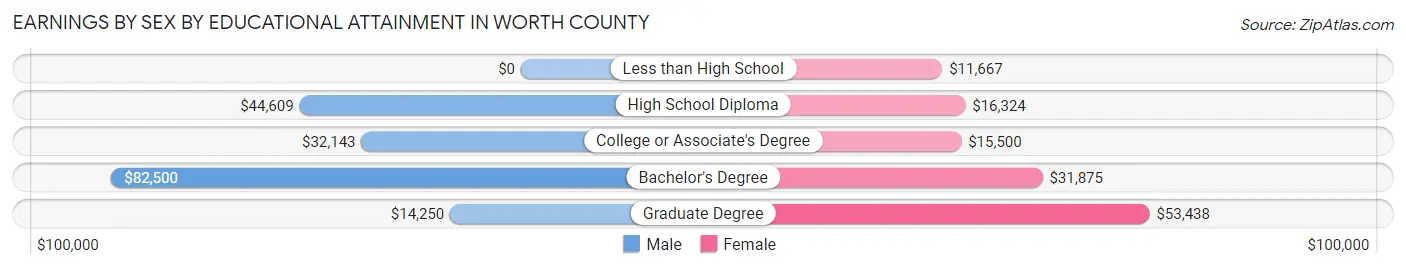
Earnings by Sex by Educational Attainment in Worth County
Average earnings in Worth County are $46,111 for men and $19,904 for women, a difference of 56.8%. Men with an educational attainment of bachelor's degree enjoy the highest average annual earnings of $82,500, while those with graduate degree education earn the least with $14,250. Women with an educational attainment of graduate degree earn the most with the average annual earnings of $53,438, while those with less than high school education have the smallest earnings of $11,667.
| Educational Attainment | Male Income | Female Income |
| Less than High School | - | - |
| High School Diploma | $44,609 | $16,324 |
| College or Associate's Degree | $32,143 | $15,500 |
| Bachelor's Degree | $82,500 | $31,875 |
| Graduate Degree | $14,250 | $53,438 |
| Total | $46,111 | $19,904 |
Family Income in Worth County
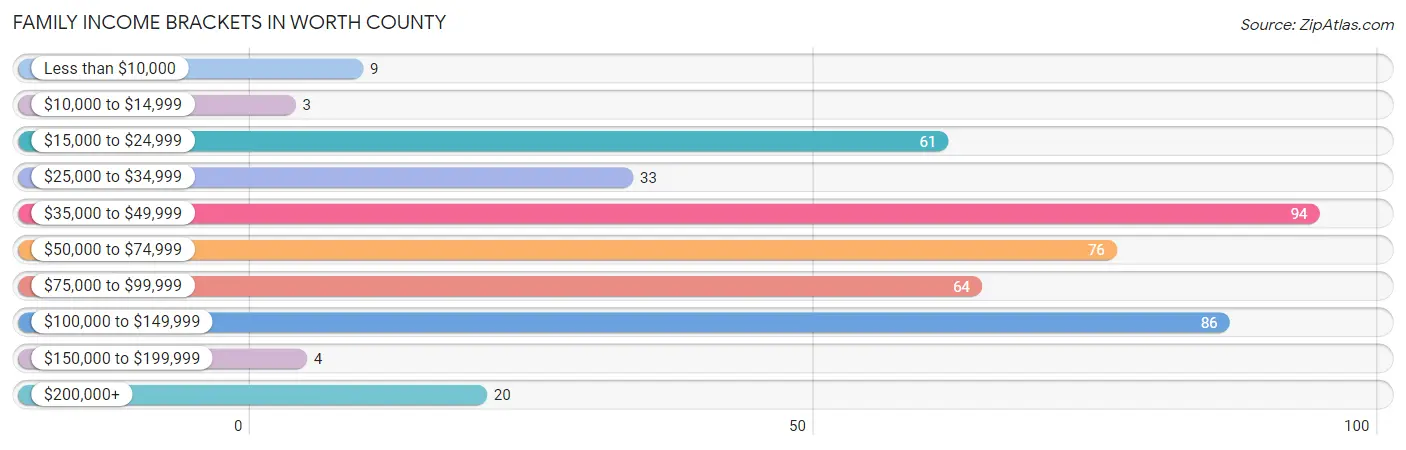
Family Income Brackets in Worth County
According to the Worth County family income data, there are 94 families falling into the $35,000 to $49,999 income range, which is the most common income bracket and makes up 20.9% of all families. Conversely, the $10,000 to $14,999 income bracket is the least frequent group with only 3 families (0.7%) belonging to this category.
| Income Bracket | # Families | % Families |
| Less than $10,000 | 9 | 2.0% |
| $10,000 to $14,999 | 3 | 0.7% |
| $15,000 to $24,999 | 61 | 13.6% |
| $25,000 to $34,999 | 33 | 7.3% |
| $35,000 to $49,999 | 94 | 20.9% |
| $50,000 to $74,999 | 76 | 16.9% |
| $75,000 to $99,999 | 64 | 14.2% |
| $100,000 to $149,999 | 86 | 19.1% |
| $150,000 to $199,999 | 4 | 0.9% |
| $200,000+ | 20 | 4.4% |
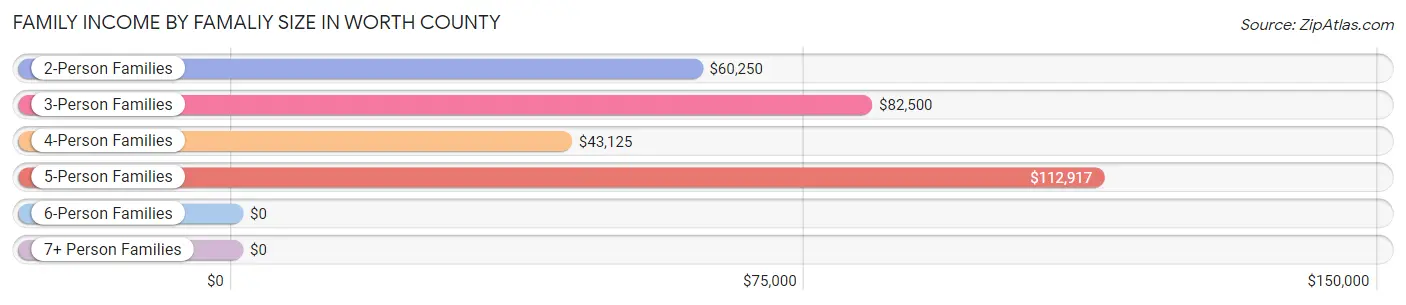
Family Income by Famaliy Size in Worth County
5-person families (39 | 8.7%) account for the highest median family income in Worth County with $112,917 per family, while 2-person families (252 | 56.0%) have the highest median income of $30,125 per family member.
| Income Bracket | # Families | Median Income |
| 2-Person Families | 252 (56.0%) | $60,250 |
| 3-Person Families | 72 (16.0%) | $82,500 |
| 4-Person Families | 87 (19.3%) | $43,125 |
| 5-Person Families | 39 (8.7%) | $112,917 |
| 6-Person Families | 0 (0.0%) | $0 |
| 7+ Person Families | 0 (0.0%) | $0 |
| Total | 450 (100.0%) | $65,000 |
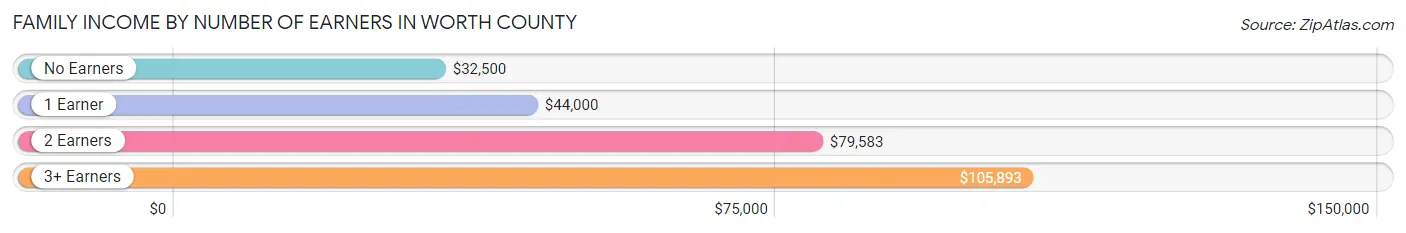
Family Income by Number of Earners in Worth County
The median family income in Worth County is $65,000, with families comprising 3+ earners (49) having the highest median family income of $105,893, while families with no earners (104) have the lowest median family income of $32,500, accounting for 10.9% and 23.1% of families, respectively.
| Number of Earners | # Families | Median Income |
| No Earners | 104 (23.1%) | $32,500 |
| 1 Earner | 146 (32.4%) | $44,000 |
| 2 Earners | 151 (33.6%) | $79,583 |
| 3+ Earners | 49 (10.9%) | $105,893 |
| Total | 450 (100.0%) | $65,000 |
Household Income in Worth County
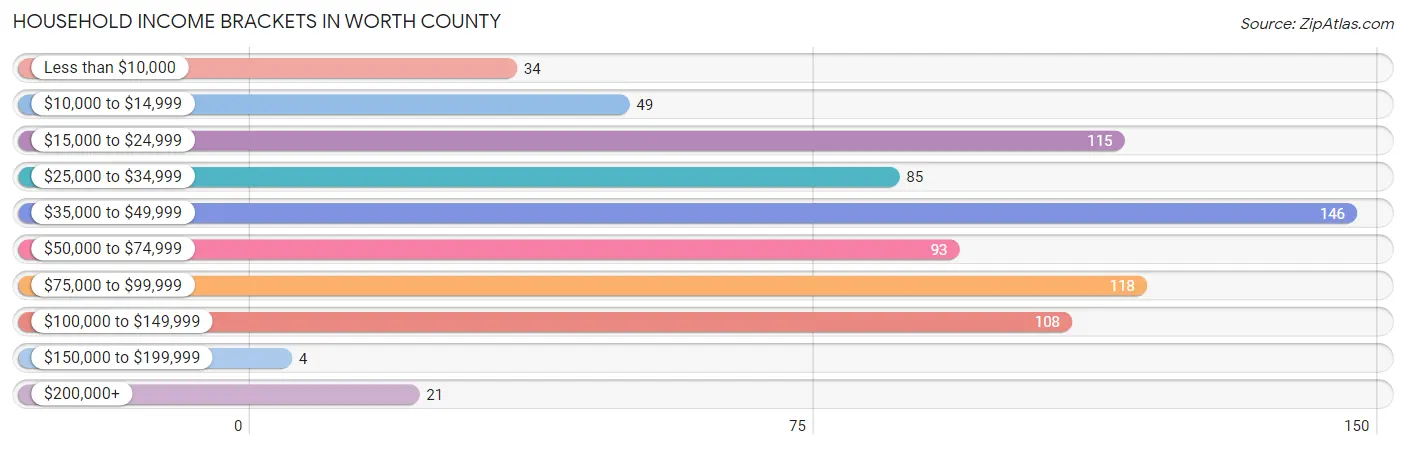
Household Income Brackets in Worth County
With 146 households falling in the category, the $35,000 to $49,999 income range is the most frequent in Worth County, accounting for 18.9% of all households. In contrast, only 4 households (0.5%) fall into the $150,000 to $199,999 income bracket, making it the least populous group.
| Income Bracket | # Households | % Households |
| Less than $10,000 | 34 | 4.4% |
| $10,000 to $14,999 | 49 | 6.3% |
| $15,000 to $24,999 | 115 | 14.9% |
| $25,000 to $34,999 | 85 | 11.0% |
| $35,000 to $49,999 | 146 | 18.9% |
| $50,000 to $74,999 | 93 | 12.0% |
| $75,000 to $99,999 | 118 | 15.3% |
| $100,000 to $149,999 | 108 | 14.0% |
| $150,000 to $199,999 | 4 | 0.5% |
| $200,000+ | 21 | 2.7% |
Household Income by Householder Age in Worth County
The median household income in Worth County is $43,536, with the highest median household income of $65,833 found in the 25 to 44 years age bracket for the primary householder. A total of 208 households (26.9%) fall into this category. Meanwhile, the 15 to 24 years age bracket for the primary householder has the lowest median household income of $32,500, with 6 households (0.8%) in this group.
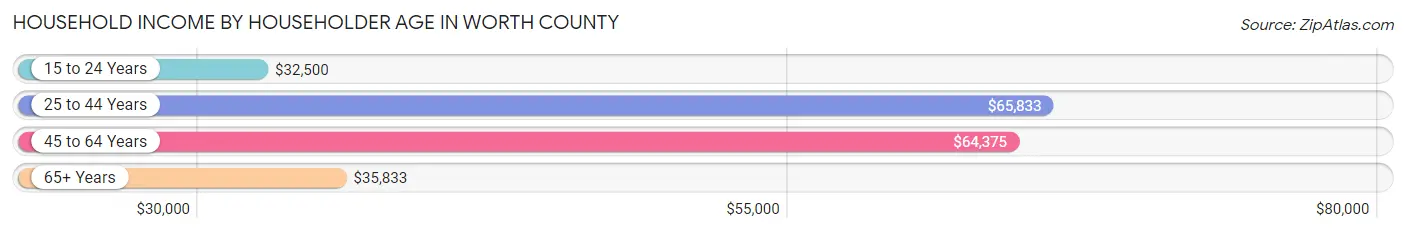
| Income Bracket | # Households | Median Income |
| 15 to 24 Years | 6 (0.8%) | $32,500 |
| 25 to 44 Years | 208 (26.9%) | $65,833 |
| 45 to 64 Years | 291 (37.7%) | $64,375 |
| 65+ Years | 268 (34.7%) | $35,833 |
| Total | 773 (100.0%) | $43,536 |
Poverty in Worth County
Income Below Poverty by Sex and Age in Worth County
With 14.3% poverty level for males and 18.9% for females among the residents of Worth County, 15 year old males and 5 year old females are the most vulnerable to poverty, with 26 males (76.5%) and 10 females (90.9%) in their respective age groups living below the poverty level.
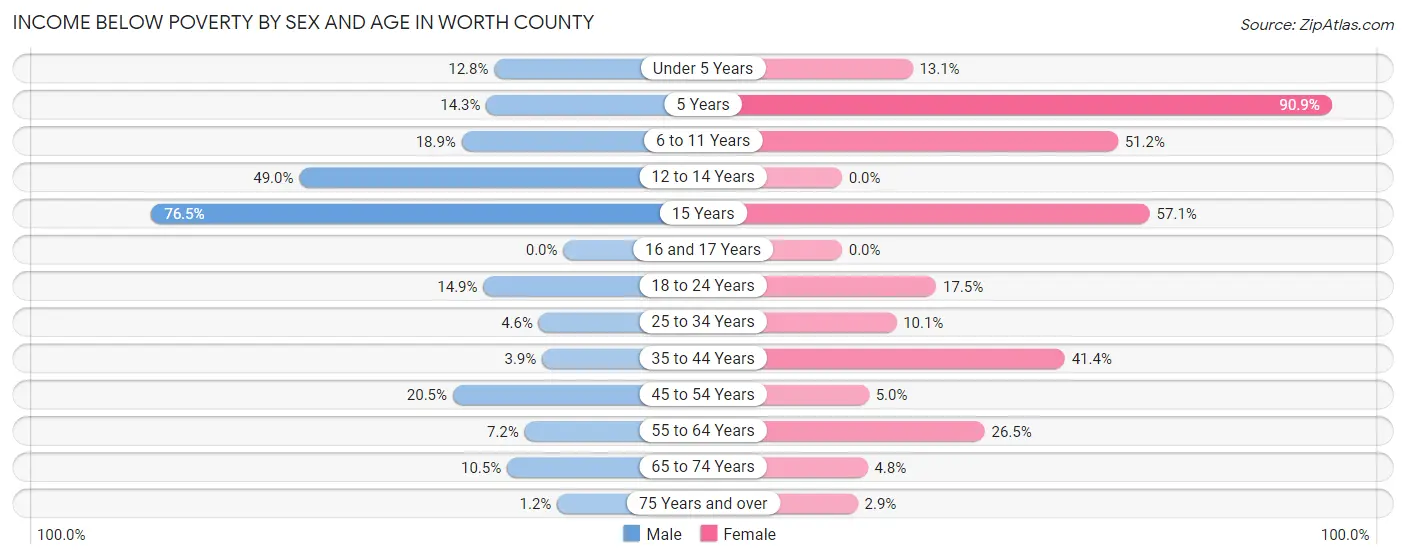
| Age Bracket | Male | Female |
| Under 5 Years | 5 (12.8%) | 8 (13.1%) |
| 5 Years | 1 (14.3%) | 10 (90.9%) |
| 6 to 11 Years | 10 (18.9%) | 42 (51.2%) |
| 12 to 14 Years | 25 (49.0%) | 0 (0.0%) |
| 15 Years | 26 (76.5%) | 8 (57.1%) |
| 16 and 17 Years | 0 (0.0%) | 0 (0.0%) |
| 18 to 24 Years | 15 (14.8%) | 14 (17.5%) |
| 25 to 34 Years | 2 (4.5%) | 10 (10.1%) |
| 35 to 44 Years | 5 (3.9%) | 36 (41.4%) |
| 45 to 54 Years | 24 (20.5%) | 5 (5.0%) |
| 55 to 64 Years | 12 (7.2%) | 40 (26.5%) |
| 65 to 74 Years | 14 (10.4%) | 6 (4.8%) |
| 75 Years and over | 1 (1.1%) | 4 (2.9%) |
| Total | 140 (14.3%) | 183 (18.9%) |
Income Above Poverty by Sex and Age in Worth County
According to the poverty statistics in Worth County, males aged 16 and 17 years and females aged 12 to 14 years are the age groups that are most secure financially, with 100.0% of males and 100.0% of females in these age groups living above the poverty line.
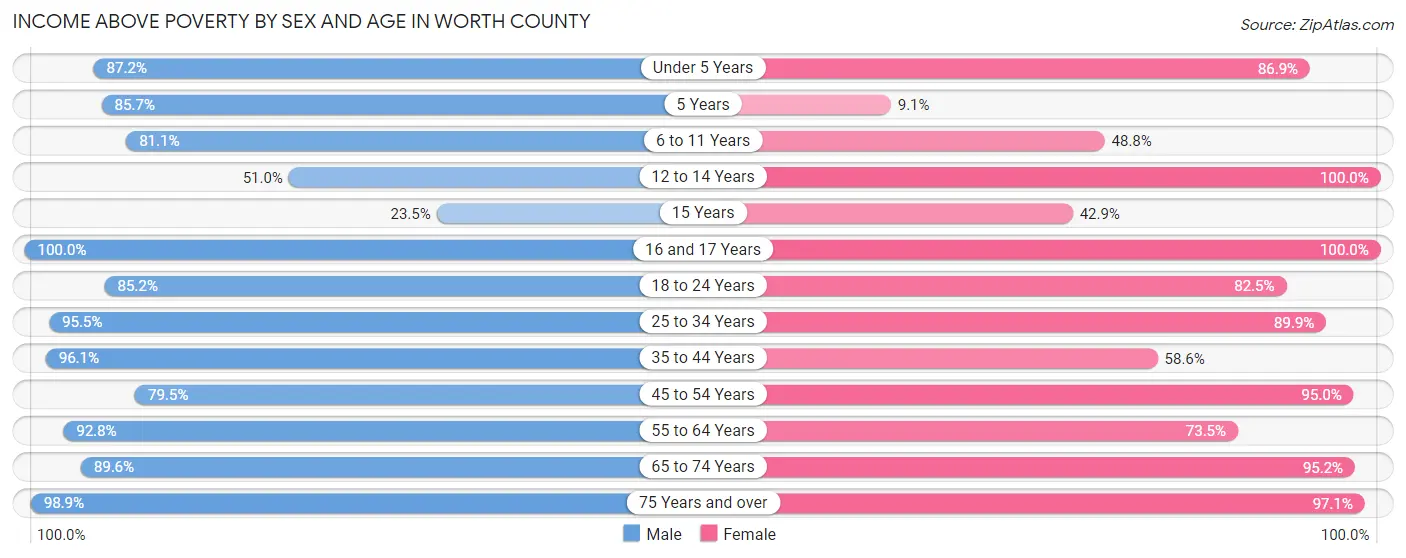
| Age Bracket | Male | Female |
| Under 5 Years | 34 (87.2%) | 53 (86.9%) |
| 5 Years | 6 (85.7%) | 1 (9.1%) |
| 6 to 11 Years | 43 (81.1%) | 40 (48.8%) |
| 12 to 14 Years | 26 (51.0%) | 9 (100.0%) |
| 15 Years | 8 (23.5%) | 6 (42.9%) |
| 16 and 17 Years | 18 (100.0%) | 14 (100.0%) |
| 18 to 24 Years | 86 (85.2%) | 66 (82.5%) |
| 25 to 34 Years | 42 (95.5%) | 89 (89.9%) |
| 35 to 44 Years | 122 (96.1%) | 51 (58.6%) |
| 45 to 54 Years | 93 (79.5%) | 95 (95.0%) |
| 55 to 64 Years | 155 (92.8%) | 111 (73.5%) |
| 65 to 74 Years | 120 (89.5%) | 120 (95.2%) |
| 75 Years and over | 86 (98.9%) | 132 (97.1%) |
| Total | 839 (85.7%) | 787 (81.1%) |
Income Below Poverty Among Married-Couple Families in Worth County
The poverty statistics for married-couple families in Worth County show that 2.8% or 10 of the total 359 families live below the poverty line. Families with 1 or 2 children have the highest poverty rate of 10.8%, comprising of 7 families. On the other hand, families with no children have the lowest poverty rate of 0.8%, which includes 2 families.
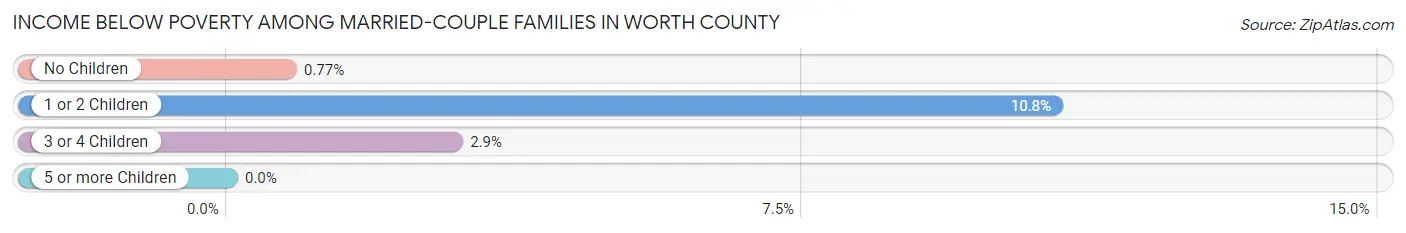
| Children | Above Poverty | Below Poverty |
| No Children | 258 (99.2%) | 2 (0.8%) |
| 1 or 2 Children | 58 (89.2%) | 7 (10.8%) |
| 3 or 4 Children | 33 (97.1%) | 1 (2.9%) |
| 5 or more Children | 0 (0.0%) | 0 (0.0%) |
| Total | 349 (97.2%) | 10 (2.8%) |
Income Below Poverty Among Single-Parent Households in Worth County
According to the poverty data in Worth County, 2.8% or 1 single-father households and 65.4% or 36 single-mother households are living below the poverty line. Among single-father households, those with 1 or 2 children have the highest poverty rate, with 1 households (2.9%) experiencing poverty. Likewise, among single-mother households, those with 3 or 4 children have the highest poverty rate, with 33 households (94.3%) falling below the poverty line.
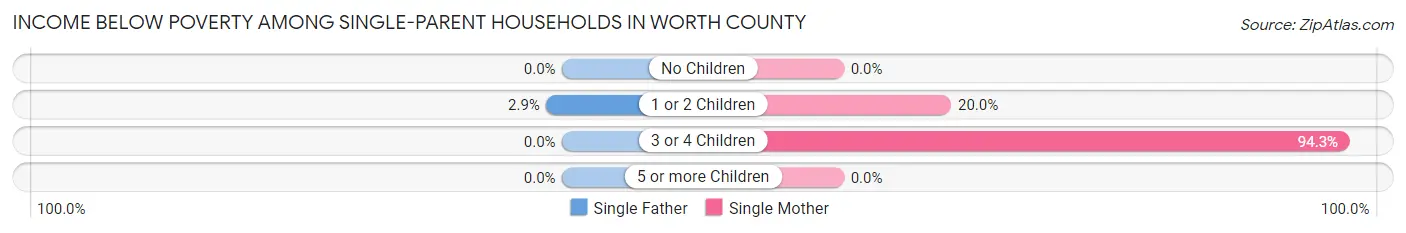
| Children | Single Father | Single Mother |
| No Children | 0 (0.0%) | 0 (0.0%) |
| 1 or 2 Children | 1 (2.9%) | 3 (20.0%) |
| 3 or 4 Children | 0 (0.0%) | 33 (94.3%) |
| 5 or more Children | 0 (0.0%) | 0 (0.0%) |
| Total | 1 (2.8%) | 36 (65.4%) |
Income Below Poverty Among Married-Couple vs Single-Parent Households in Worth County
The poverty data for Worth County shows that 10 of the married-couple family households (2.8%) and 37 of the single-parent households (40.7%) are living below the poverty level. Within the married-couple family households, those with 1 or 2 children have the highest poverty rate, with 7 households (10.8%) falling below the poverty line. Among the single-parent households, those with 3 or 4 children have the highest poverty rate, with 33 household (94.3%) living below poverty.
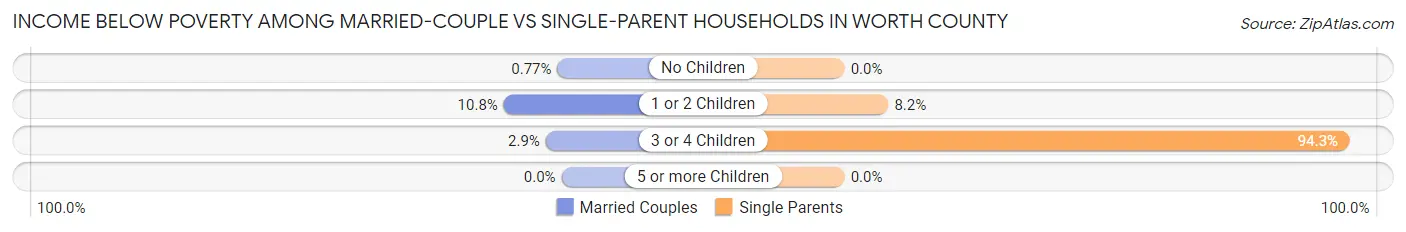
| Children | Married-Couple Families | Single-Parent Households |
| No Children | 2 (0.8%) | 0 (0.0%) |
| 1 or 2 Children | 7 (10.8%) | 4 (8.2%) |
| 3 or 4 Children | 1 (2.9%) | 33 (94.3%) |
| 5 or more Children | 0 (0.0%) | 0 (0.0%) |
| Total | 10 (2.8%) | 37 (40.7%) |
Race in Worth County
The most populous races in Worth County are White / Caucasian (1,915 | 96.6%), Two or more Races (58 | 2.9%), and Hispanic or Latino (38 | 1.9%).
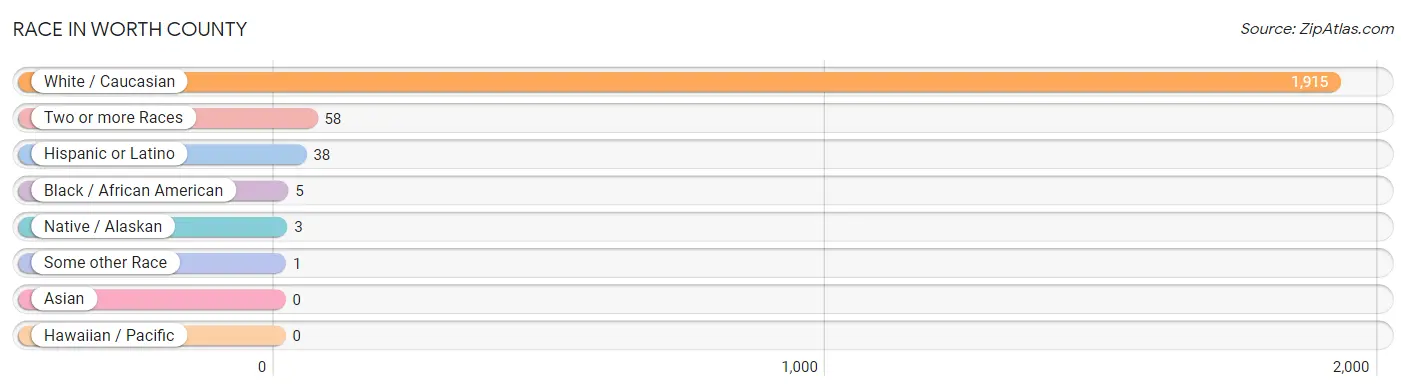
| Race | # Population | % Population |
| Asian | 0 | 0.0% |
| Black / African American | 5 | 0.3% |
| Hawaiian / Pacific | 0 | 0.0% |
| Hispanic or Latino | 38 | 1.9% |
| Native / Alaskan | 3 | 0.2% |
| White / Caucasian | 1,915 | 96.6% |
| Two or more Races | 58 | 2.9% |
| Some other Race | 1 | 0.1% |
| Total | 1,982 | 100.0% |
Ancestry in Worth County
The most populous ancestries reported in Worth County are American (322 | 16.3%), Irish (237 | 12.0%), German (235 | 11.9%), English (209 | 10.5%), and French (107 | 5.4%), together accounting for 56.0% of all Worth County residents.
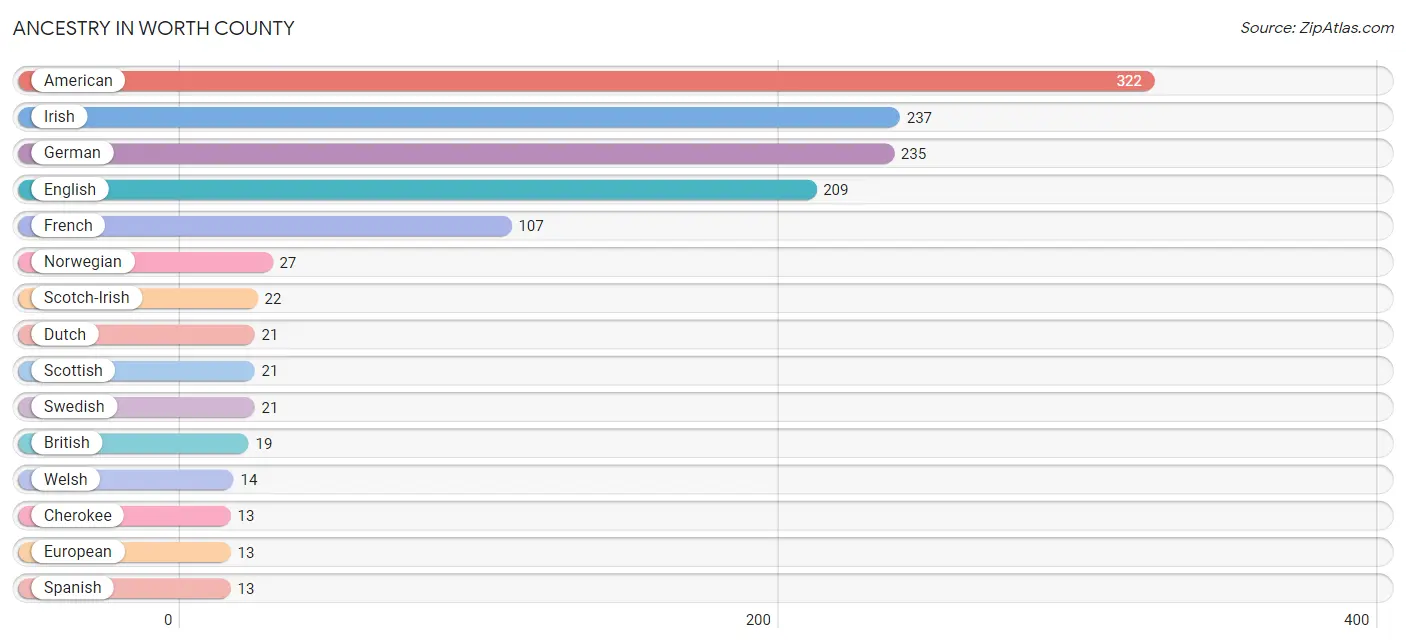
| Ancestry | # Population | % Population |
| African | 5 | 0.3% |
| American | 322 | 16.3% |
| Austrian | 4 | 0.2% |
| British | 19 | 1.0% |
| Burmese | 8 | 0.4% |
| Central American | 1 | 0.1% |
| Cherokee | 13 | 0.7% |
| Croatian | 2 | 0.1% |
| Danish | 8 | 0.4% |
| Delaware | 2 | 0.1% |
| Dutch | 21 | 1.1% |
| Eastern European | 3 | 0.2% |
| English | 209 | 10.5% |
| European | 13 | 0.7% |
| French | 107 | 5.4% |
| German | 235 | 11.9% |
| Greek | 6 | 0.3% |
| Irish | 237 | 12.0% |
| Italian | 4 | 0.2% |
| Mexican | 9 | 0.4% |
| Norwegian | 27 | 1.4% |
| Panamanian | 1 | 0.1% |
| Polish | 6 | 0.3% |
| Portuguese | 3 | 0.2% |
| Russian | 4 | 0.2% |
| Scotch-Irish | 22 | 1.1% |
| Scottish | 21 | 1.1% |
| Spanish | 13 | 0.7% |
| Subsaharan African | 5 | 0.3% |
| Swedish | 21 | 1.1% |
| Swiss | 4 | 0.2% |
| Ukrainian | 5 | 0.3% |
| Welsh | 14 | 0.7% | View All 33 Rows |
Immigrants in Worth County
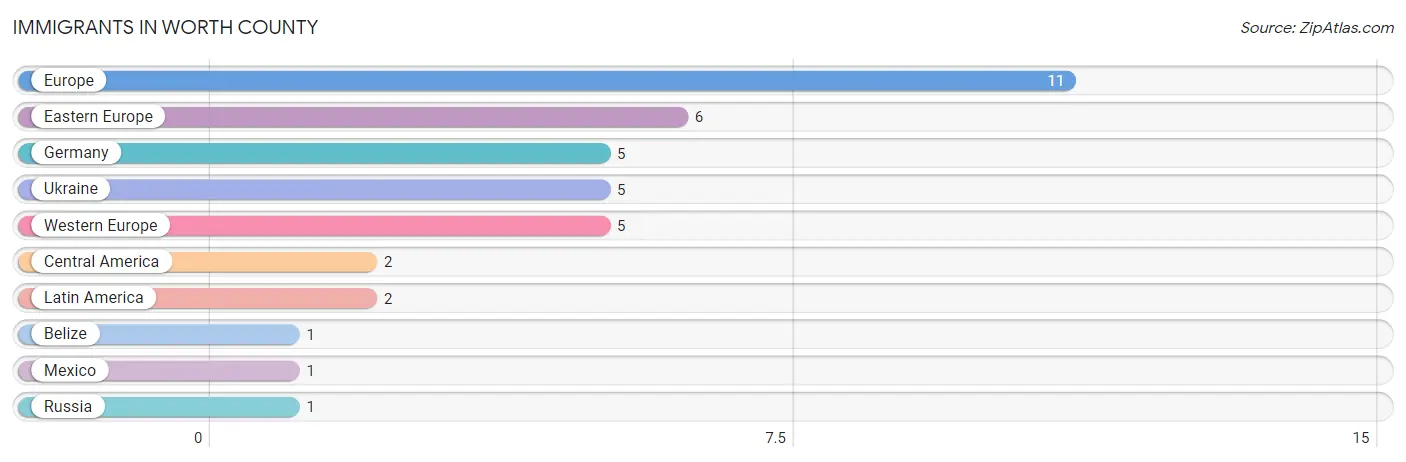
The most numerous immigrant groups reported in Worth County came from Europe (11 | 0.5%), Eastern Europe (6 | 0.3%), Germany (5 | 0.3%), Ukraine (5 | 0.3%), and Western Europe (5 | 0.3%), together accounting for 1.6% of all Worth County residents.
| Immigration Origin | # Population | % Population |
| Belize | 1 | 0.1% |
| Central America | 2 | 0.1% |
| Eastern Europe | 6 | 0.3% |
| Europe | 11 | 0.5% |
| Germany | 5 | 0.3% |
| Latin America | 2 | 0.1% |
| Mexico | 1 | 0.1% |
| Russia | 1 | 0.1% |
| Ukraine | 5 | 0.3% |
| Western Europe | 5 | 0.3% | View All 10 Rows |
Sex and Age in Worth County
Sex and Age in Worth County
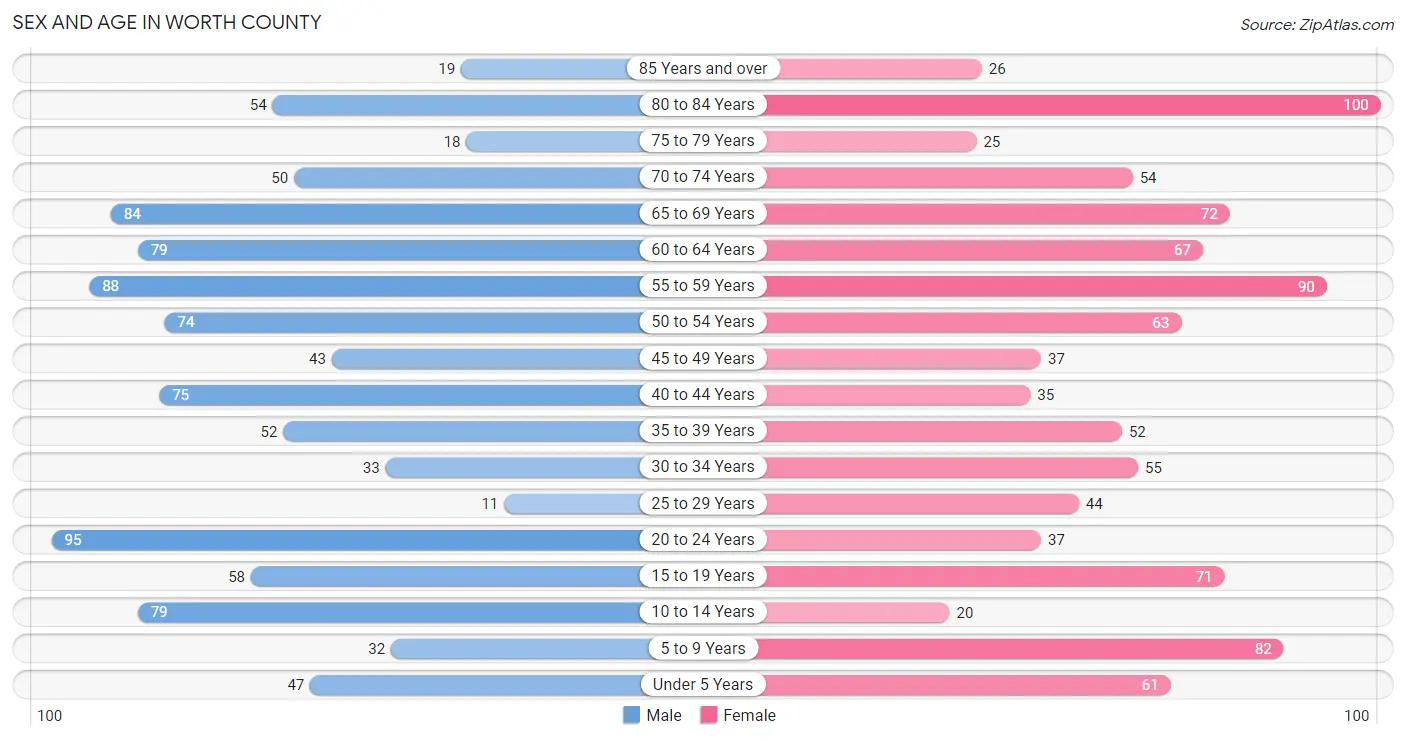
The most populous age groups in Worth County are 20 to 24 Years (95 | 9.6%) for men and 80 to 84 Years (100 | 10.1%) for women.
| Age Bracket | Male | Female |
| Under 5 Years | 47 (4.7%) | 61 (6.2%) |
| 5 to 9 Years | 32 (3.2%) | 82 (8.3%) |
| 10 to 14 Years | 79 (8.0%) | 20 (2.0%) |
| 15 to 19 Years | 58 (5.9%) | 71 (7.2%) |
| 20 to 24 Years | 95 (9.6%) | 37 (3.7%) |
| 25 to 29 Years | 11 (1.1%) | 44 (4.4%) |
| 30 to 34 Years | 33 (3.3%) | 55 (5.6%) |
| 35 to 39 Years | 52 (5.2%) | 52 (5.2%) |
| 40 to 44 Years | 75 (7.6%) | 35 (3.5%) |
| 45 to 49 Years | 43 (4.3%) | 37 (3.7%) |
| 50 to 54 Years | 74 (7.5%) | 63 (6.4%) |
| 55 to 59 Years | 88 (8.9%) | 90 (9.1%) |
| 60 to 64 Years | 79 (8.0%) | 67 (6.8%) |
| 65 to 69 Years | 84 (8.5%) | 72 (7.3%) |
| 70 to 74 Years | 50 (5.1%) | 54 (5.4%) |
| 75 to 79 Years | 18 (1.8%) | 25 (2.5%) |
| 80 to 84 Years | 54 (5.4%) | 100 (10.1%) |
| 85 Years and over | 19 (1.9%) | 26 (2.6%) |
| Total | 991 (100.0%) | 991 (100.0%) |
Families and Households in Worth County
Median Family Size in Worth County
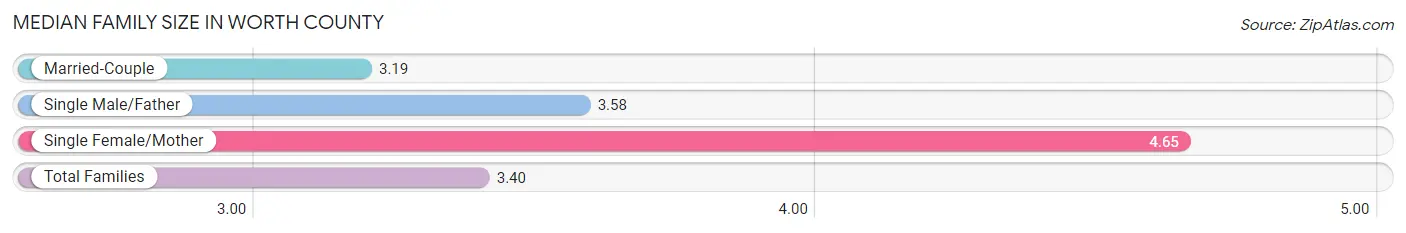
The median family size in Worth County is 3.40 persons per family, with single female/mother families (55 | 12.2%) accounting for the largest median family size of 4.65 persons per family. On the other hand, married-couple families (359 | 79.8%) represent the smallest median family size with 3.19 persons per family.
| Family Type | # Families | Family Size |
| Married-Couple | 359 (79.8%) | 3.19 |
| Single Male/Father | 36 (8.0%) | 3.58 |
| Single Female/Mother | 55 (12.2%) | 4.65 |
| Total Families | 450 (100.0%) | 3.40 |
Median Household Size in Worth County
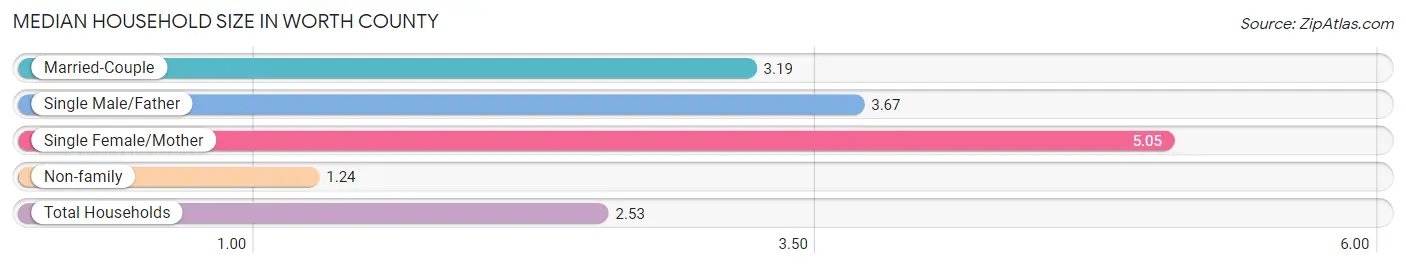
The median household size in Worth County is 2.53 persons per household, with single female/mother households (55 | 7.1%) accounting for the largest median household size of 5.05 persons per household. non-family households (323 | 41.8%) represent the smallest median household size with 1.24 persons per household.
| Household Type | # Households | Household Size |
| Married-Couple | 359 (46.4%) | 3.19 |
| Single Male/Father | 36 (4.7%) | 3.67 |
| Single Female/Mother | 55 (7.1%) | 5.05 |
| Non-family | 323 (41.8%) | 1.24 |
| Total Households | 773 (100.0%) | 2.53 |
Household Size by Marriage Status in Worth County
Out of a total of 773 households in Worth County, 450 (58.2%) are family households, while 323 (41.8%) are nonfamily households. The most numerous type of family households are 2-person households, comprising 243, and the most common type of nonfamily households are 1-person households, comprising 291.
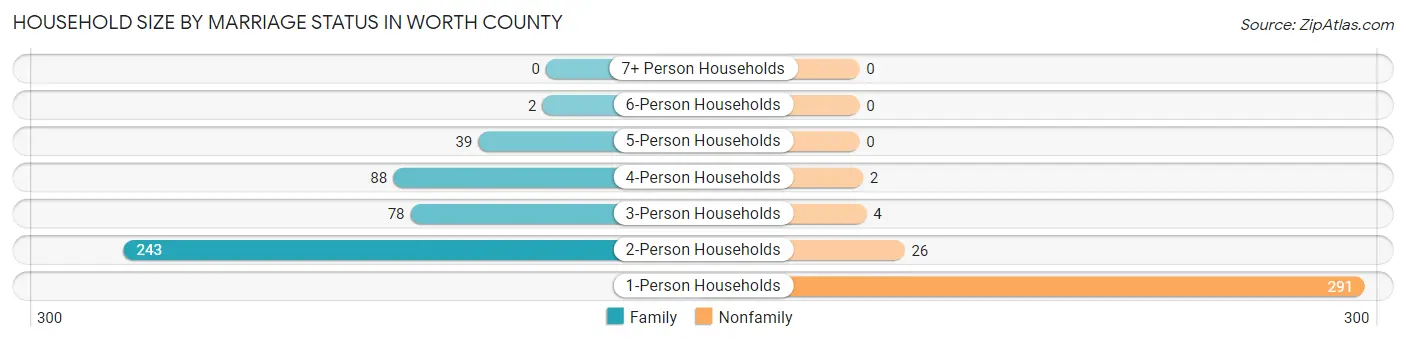
| Household Size | Family Households | Nonfamily Households |
| 1-Person Households | - | 291 (37.7%) |
| 2-Person Households | 243 (31.4%) | 26 (3.4%) |
| 3-Person Households | 78 (10.1%) | 4 (0.5%) |
| 4-Person Households | 88 (11.4%) | 2 (0.3%) |
| 5-Person Households | 39 (5.1%) | 0 (0.0%) |
| 6-Person Households | 2 (0.3%) | 0 (0.0%) |
| 7+ Person Households | 0 (0.0%) | 0 (0.0%) |
| Total | 450 (58.2%) | 323 (41.8%) |
Female Fertility in Worth County
Fertility by Age in Worth County
Average fertility rate in Worth County is 105.0 births per 1,000 women. Women in the age bracket of 20 to 34 years have the highest fertility rate with 265.0 births per 1,000 women. Women in the age bracket of 20 to 34 years acount for 100.0% of all women with births.
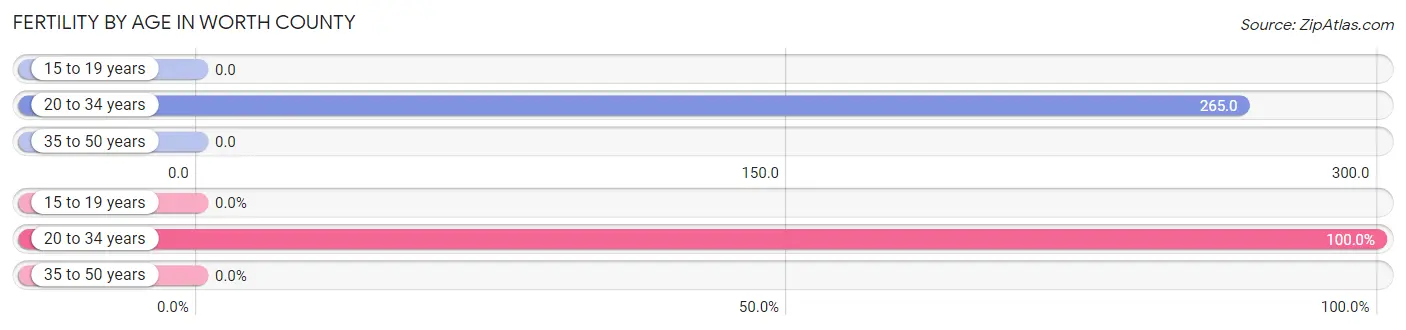
| Age Bracket | Women with Births | Births / 1,000 Women |
| 15 to 19 years | 0 (0.0%) | 0.0 |
| 20 to 34 years | 36 (100.0%) | 265.0 |
| 35 to 50 years | 0 (0.0%) | 0.0 |
| Total | 36 (100.0%) | 105.0 |
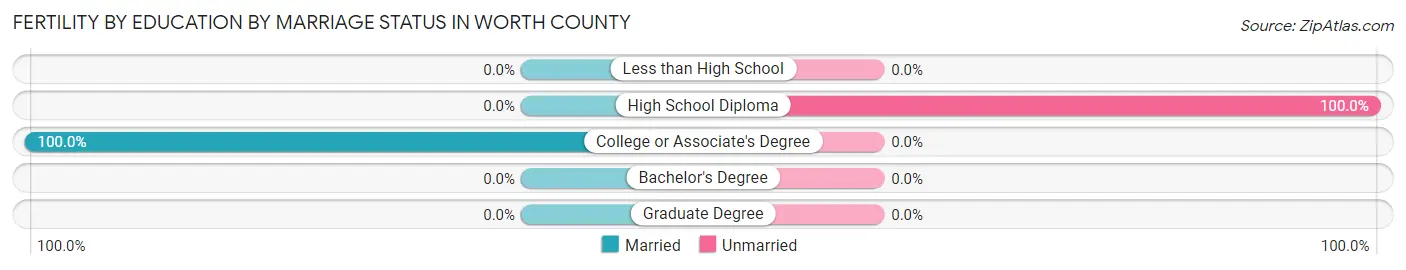
Fertility by Age by Marriage Status in Worth County
30.6% of women with births (36) in Worth County are married. The highest percentage of unmarried women with births falls into 20 to 34 years age bracket with 69.4% of them unmarried at the time of birth, while the lowest percentage of unmarried women with births belong to 20 to 34 years age bracket with 69.4% of them unmarried.
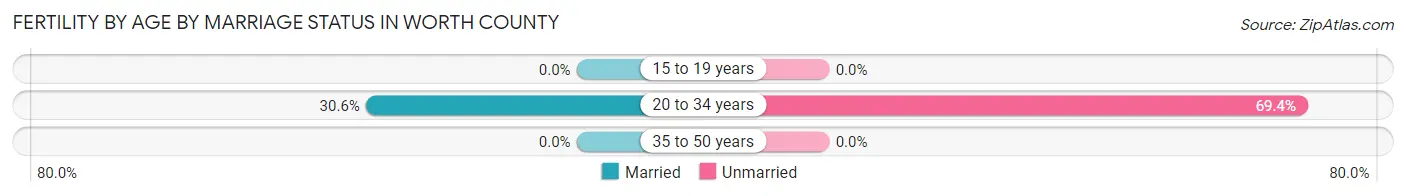
| Age Bracket | Married | Unmarried |
| 15 to 19 years | 0 (0.0%) | 0 (0.0%) |
| 20 to 34 years | 11 (30.6%) | 25 (69.4%) |
| 35 to 50 years | 0 (0.0%) | 0 (0.0%) |
| Total | 11 (30.6%) | 25 (69.4%) |
Fertility by Education in Worth County
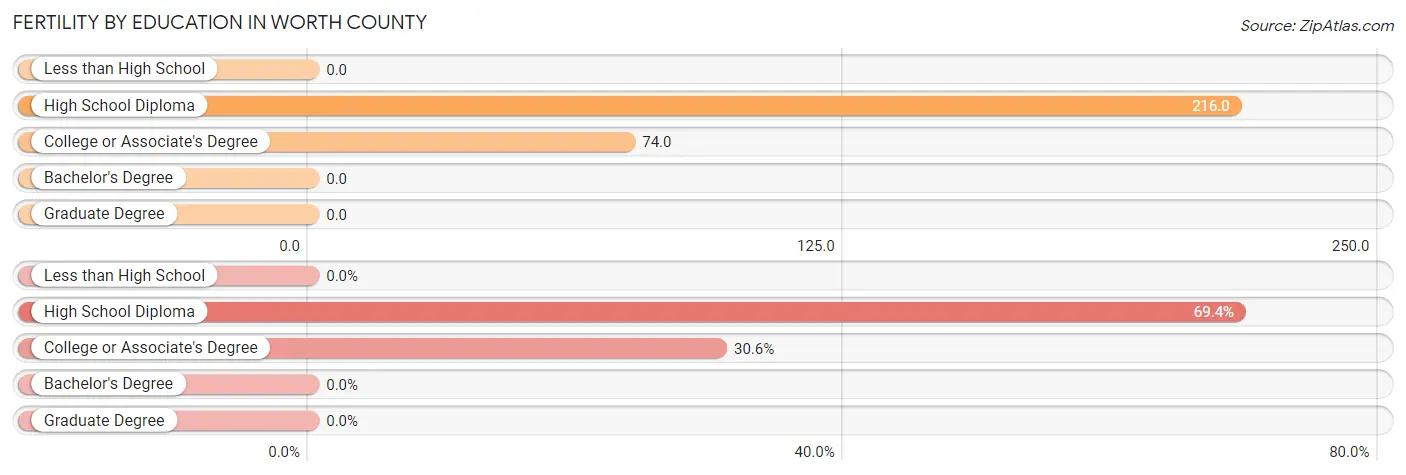
| Educational Attainment | Women with Births | Births / 1,000 Women |
| Less than High School | 0 (0.0%) | 0.0 |
| High School Diploma | 25 (69.4%) | 216.0 |
| College or Associate's Degree | 11 (30.6%) | 74.0 |
| Bachelor's Degree | 0 (0.0%) | 0.0 |
| Graduate Degree | 0 (0.0%) | 0.0 |
| Total | 36 (100.0%) | 105.0 |
Fertility by Education by Marriage Status in Worth County
69.4% of women with births in Worth County are unmarried. Women with the educational attainment of college or associate's degree are most likely to be married with 100.0% of them married at childbirth, while women with the educational attainment of high school diploma are least likely to be married with 100.0% of them unmarried at childbirth.
| Educational Attainment | Married | Unmarried |
| Less than High School | 0 (0.0%) | 0 (0.0%) |
| High School Diploma | 0 (0.0%) | 25 (100.0%) |
| College or Associate's Degree | 11 (100.0%) | 0 (0.0%) |
| Bachelor's Degree | 0 (0.0%) | 0 (0.0%) |
| Graduate Degree | 0 (0.0%) | 0 (0.0%) |
| Total | 11 (30.6%) | 25 (69.4%) |
Employment Characteristics in Worth County
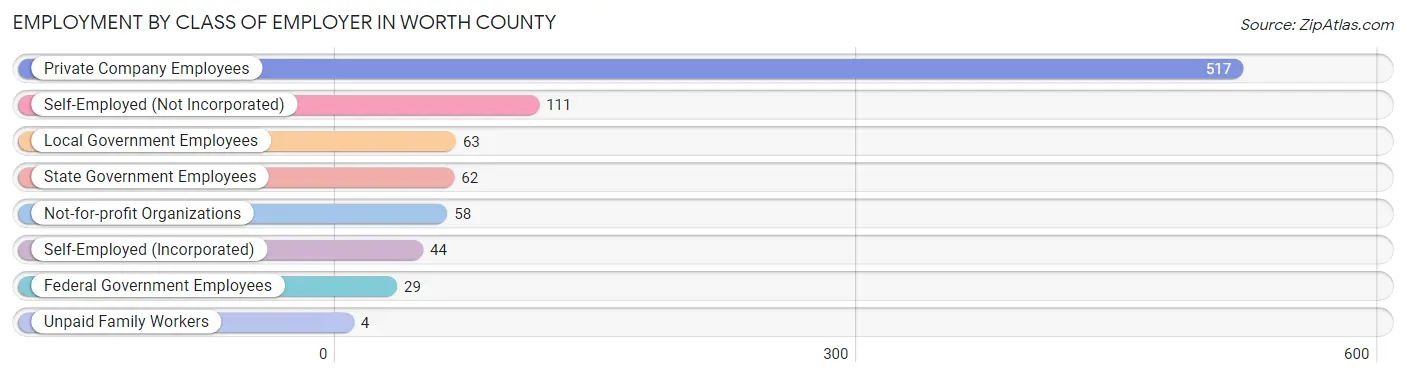
Employment by Class of Employer in Worth County
Among the 888 employed individuals in Worth County, private company employees (517 | 58.2%), self-employed (not incorporated) (111 | 12.5%), and local government employees (63 | 7.1%) make up the most common classes of employment.
| Employer Class | # Employees | % Employees |
| Private Company Employees | 517 | 58.2% |
| Self-Employed (Incorporated) | 44 | 5.0% |
| Self-Employed (Not Incorporated) | 111 | 12.5% |
| Not-for-profit Organizations | 58 | 6.5% |
| Local Government Employees | 63 | 7.1% |
| State Government Employees | 62 | 7.0% |
| Federal Government Employees | 29 | 3.3% |
| Unpaid Family Workers | 4 | 0.4% |
| Total | 888 | 100.0% |
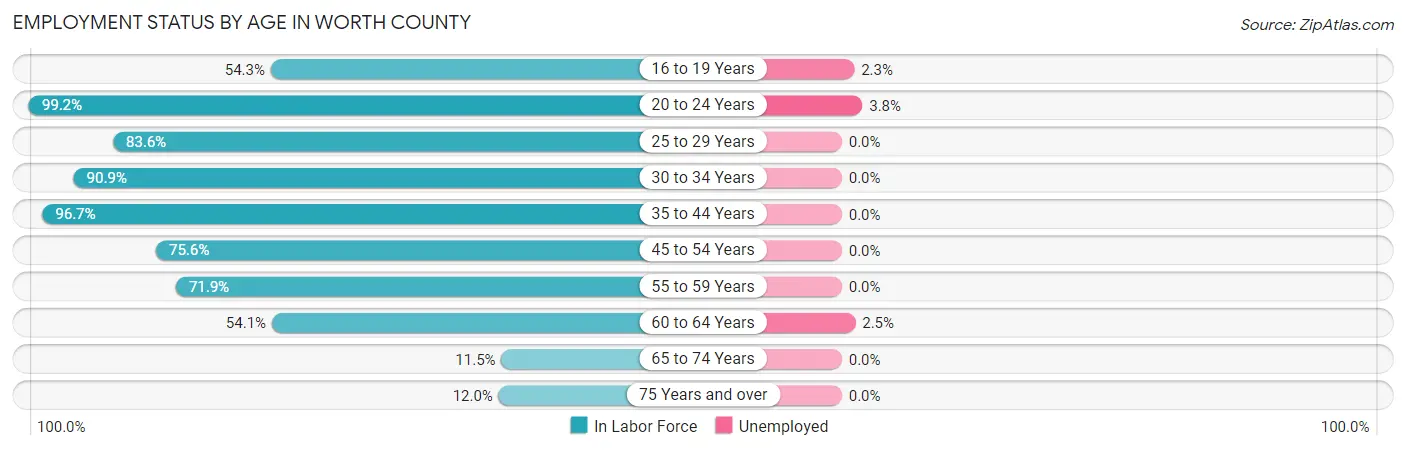
Employment Status by Age in Worth County
According to the labor force statistics for Worth County, out of the total population over 16 years of age (1,613), 58.2% or 939 individuals are in the labor force, with 0.9% or 8 of them unemployed. The age group with the highest labor force participation rate is 20 to 24 years, with 99.2% or 131 individuals in the labor force. Within the labor force, the 20 to 24 years age range has the highest percentage of unemployed individuals, with 3.8% or 5 of them being unemployed.
| Age Bracket | In Labor Force | Unemployed |
| 16 to 19 Years | 44 (54.3%) | 1 (2.3%) |
| 20 to 24 Years | 131 (99.2%) | 5 (3.8%) |
| 25 to 29 Years | 46 (83.6%) | 0 (0.0%) |
| 30 to 34 Years | 80 (90.9%) | 0 (0.0%) |
| 35 to 44 Years | 207 (96.7%) | 0 (0.0%) |
| 45 to 54 Years | 164 (75.6%) | 0 (0.0%) |
| 55 to 59 Years | 128 (71.9%) | 0 (0.0%) |
| 60 to 64 Years | 79 (54.1%) | 2 (2.5%) |
| 65 to 74 Years | 30 (11.5%) | 0 (0.0%) |
| 75 Years and over | 29 (12.0%) | 0 (0.0%) |
| Total | 939 (58.2%) | 8 (0.9%) |
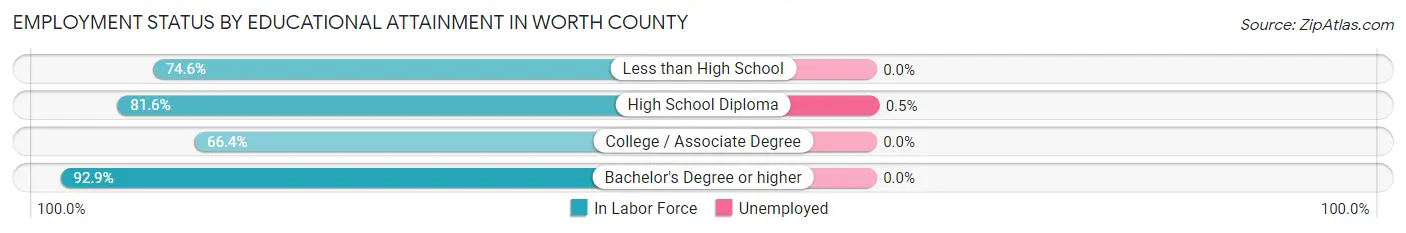
Employment Status by Educational Attainment in Worth County
According to labor force statistics for Worth County, 78.4% of individuals (704) out of the total population between 25 and 64 years of age (898) are in the labor force, with 0.3% or 2 of them being unemployed. The group with the highest labor force participation rate are those with the educational attainment of bachelor's degree or higher, with 92.9% or 105 individuals in the labor force. Within the labor force, individuals with high school diploma education have the highest percentage of unemployment, with 0.5% or 2 of them being unemployed.
| Educational Attainment | In Labor Force | Unemployed |
| Less than High School | 47 (74.6%) | 0 (0.0%) |
| High School Diploma | 390 (81.6%) | 2 (0.5%) |
| College / Associate Degree | 162 (66.4%) | 0 (0.0%) |
| Bachelor's Degree or higher | 105 (92.9%) | 0 (0.0%) |
| Total | 704 (78.4%) | 3 (0.3%) |
Employment Occupations by Sex in Worth County
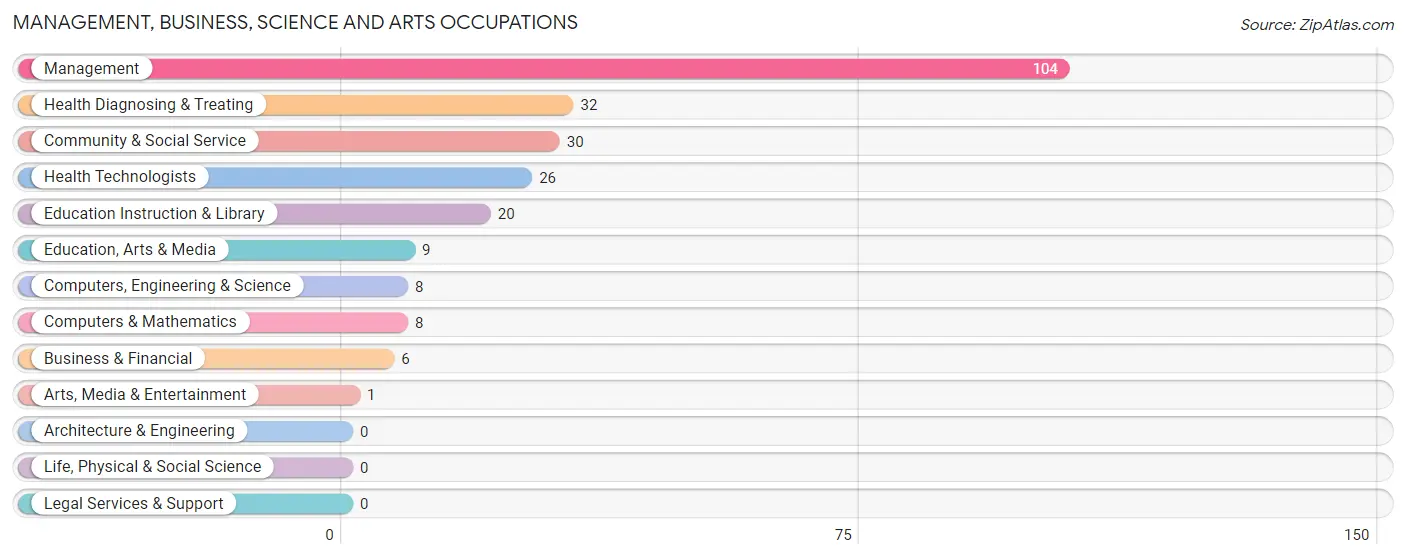
Management, Business, Science and Arts Occupations
The most common Management, Business, Science and Arts occupations in Worth County are Management (104 | 11.2%), Health Diagnosing & Treating (32 | 3.4%), Community & Social Service (30 | 3.2%), Health Technologists (26 | 2.8%), and Education Instruction & Library (20 | 2.1%).
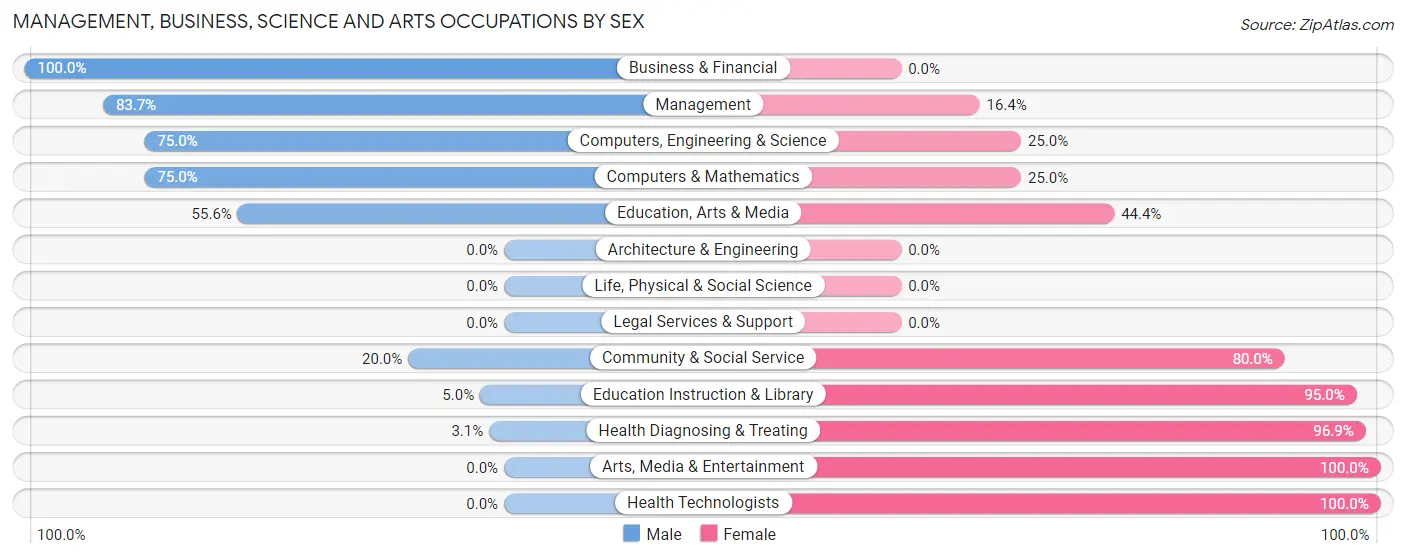
Management, Business, Science and Arts Occupations by Sex
Within the Management, Business, Science and Arts occupations in Worth County, the most male-oriented occupations are Business & Financial (100.0%), Management (83.7%), and Computers, Engineering & Science (75.0%), while the most female-oriented occupations are Arts, Media & Entertainment (100.0%), Health Technologists (100.0%), and Health Diagnosing & Treating (96.9%).
| Occupation | Male | Female |
| Management | 87 (83.7%) | 17 (16.4%) |
| Business & Financial | 6 (100.0%) | 0 (0.0%) |
| Computers, Engineering & Science | 6 (75.0%) | 2 (25.0%) |
| Computers & Mathematics | 6 (75.0%) | 2 (25.0%) |
| Architecture & Engineering | 0 (0.0%) | 0 (0.0%) |
| Life, Physical & Social Science | 0 (0.0%) | 0 (0.0%) |
| Community & Social Service | 6 (20.0%) | 24 (80.0%) |
| Education, Arts & Media | 5 (55.6%) | 4 (44.4%) |
| Legal Services & Support | 0 (0.0%) | 0 (0.0%) |
| Education Instruction & Library | 1 (5.0%) | 19 (95.0%) |
| Arts, Media & Entertainment | 0 (0.0%) | 1 (100.0%) |
| Health Diagnosing & Treating | 1 (3.1%) | 31 (96.9%) |
| Health Technologists | 0 (0.0%) | 26 (100.0%) |
| Total (Category) | 106 (58.9%) | 74 (41.1%) |
| Total (Overall) | 486 (52.3%) | 444 (47.7%) |
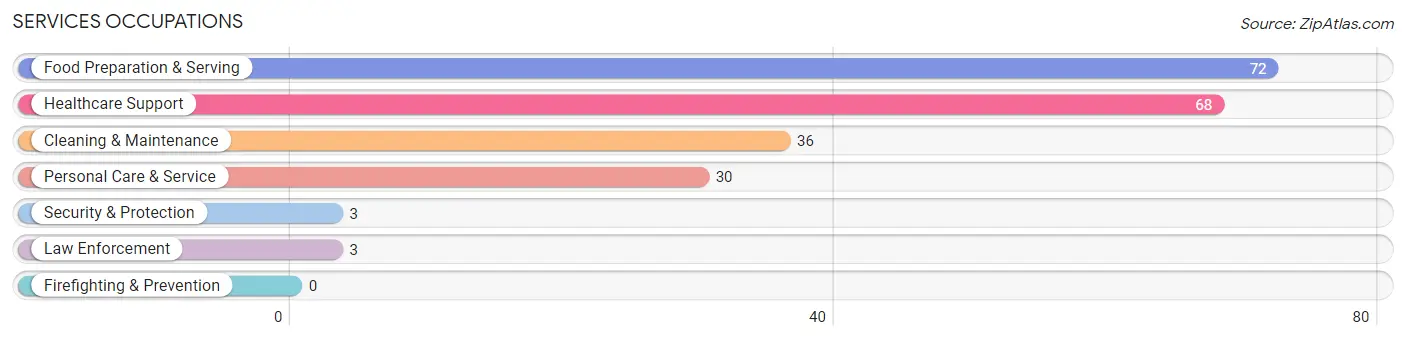
Services Occupations
The most common Services occupations in Worth County are Food Preparation & Serving (72 | 7.7%), Healthcare Support (68 | 7.3%), Cleaning & Maintenance (36 | 3.9%), Personal Care & Service (30 | 3.2%), and Security & Protection (3 | 0.3%).
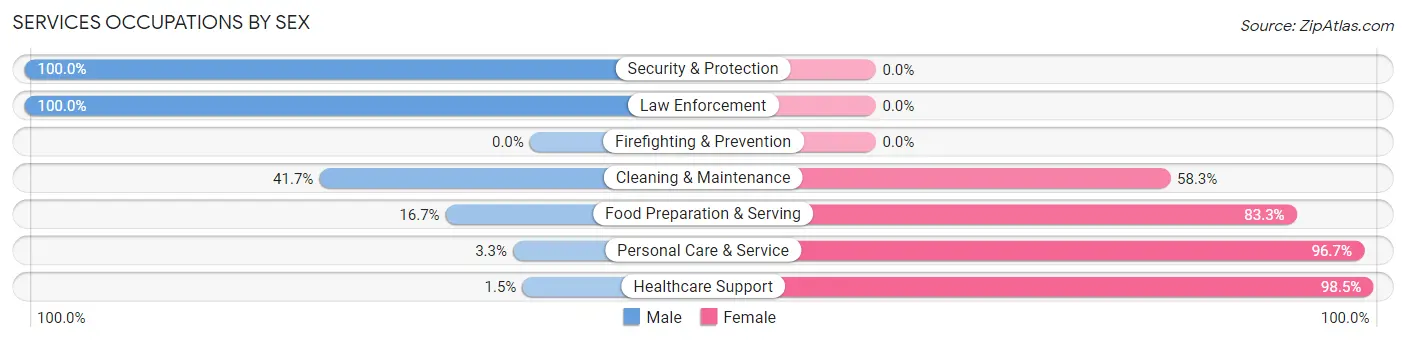
Services Occupations by Sex
Within the Services occupations in Worth County, the most male-oriented occupations are Security & Protection (100.0%), Law Enforcement (100.0%), and Cleaning & Maintenance (41.7%), while the most female-oriented occupations are Healthcare Support (98.5%), Personal Care & Service (96.7%), and Food Preparation & Serving (83.3%).
| Occupation | Male | Female |
| Healthcare Support | 1 (1.5%) | 67 (98.5%) |
| Security & Protection | 3 (100.0%) | 0 (0.0%) |
| Firefighting & Prevention | 0 (0.0%) | 0 (0.0%) |
| Law Enforcement | 3 (100.0%) | 0 (0.0%) |
| Food Preparation & Serving | 12 (16.7%) | 60 (83.3%) |
| Cleaning & Maintenance | 15 (41.7%) | 21 (58.3%) |
| Personal Care & Service | 1 (3.3%) | 29 (96.7%) |
| Total (Category) | 32 (15.3%) | 177 (84.7%) |
| Total (Overall) | 486 (52.3%) | 444 (47.7%) |
Sales and Office Occupations
The most common Sales and Office occupations in Worth County are Sales & Related (168 | 18.1%), and Office & Administration (77 | 8.3%).
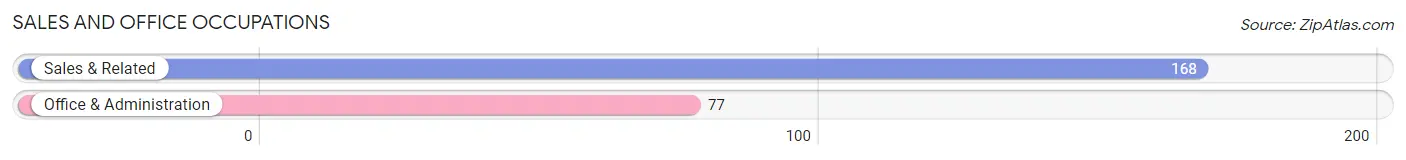
Sales and Office Occupations by Sex
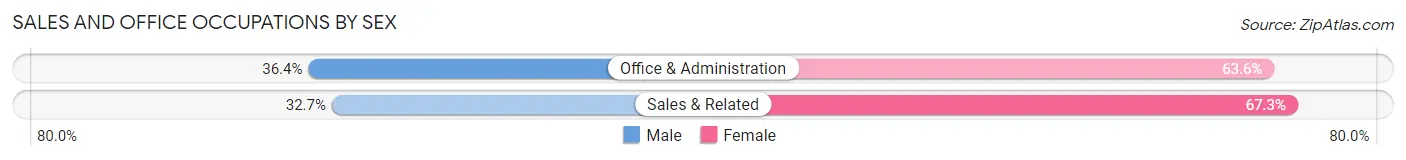
| Occupation | Male | Female |
| Sales & Related | 55 (32.7%) | 113 (67.3%) |
| Office & Administration | 28 (36.4%) | 49 (63.6%) |
| Total (Category) | 83 (33.9%) | 162 (66.1%) |
| Total (Overall) | 486 (52.3%) | 444 (47.7%) |
Natural Resources, Construction and Maintenance Occupations
The most common Natural Resources, Construction and Maintenance occupations in Worth County are Construction & Extraction (90 | 9.7%), Farming, Fishing & Forestry (65 | 7.0%), and Installation, Maintenance & Repair (45 | 4.8%).
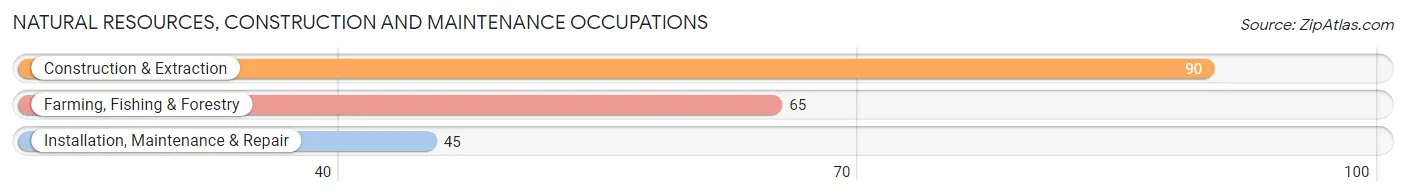
Natural Resources, Construction and Maintenance Occupations by Sex
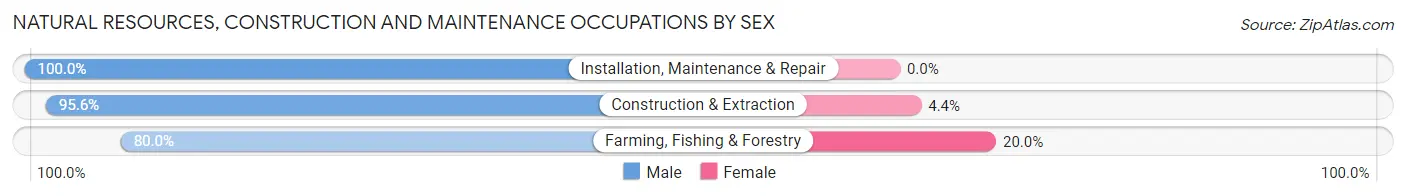
| Occupation | Male | Female |
| Farming, Fishing & Forestry | 52 (80.0%) | 13 (20.0%) |
| Construction & Extraction | 86 (95.6%) | 4 (4.4%) |
| Installation, Maintenance & Repair | 45 (100.0%) | 0 (0.0%) |
| Total (Category) | 183 (91.5%) | 17 (8.5%) |
| Total (Overall) | 486 (52.3%) | 444 (47.7%) |
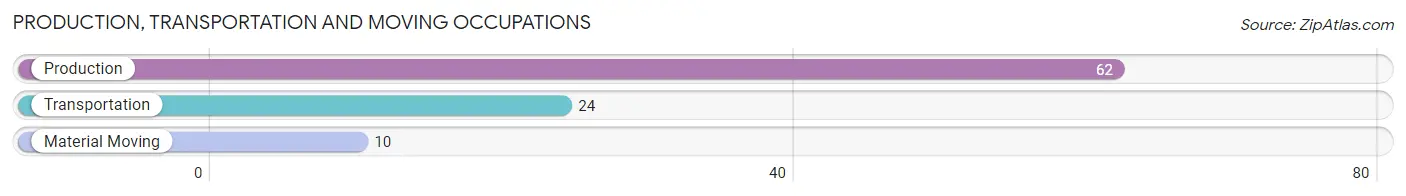
Production, Transportation and Moving Occupations
The most common Production, Transportation and Moving occupations in Worth County are Production (62 | 6.7%), Transportation (24 | 2.6%), and Material Moving (10 | 1.1%).
Production, Transportation and Moving Occupations by Sex
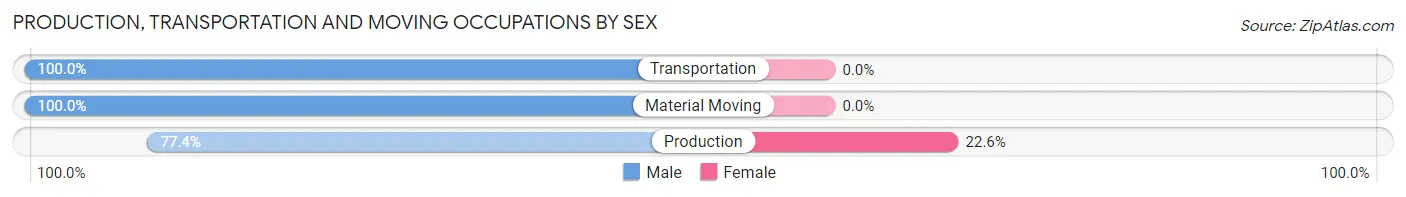
| Occupation | Male | Female |
| Production | 48 (77.4%) | 14 (22.6%) |
| Transportation | 24 (100.0%) | 0 (0.0%) |
| Material Moving | 10 (100.0%) | 0 (0.0%) |
| Total (Category) | 82 (85.4%) | 14 (14.6%) |
| Total (Overall) | 486 (52.3%) | 444 (47.7%) |
Employment Industries by Sex in Worth County
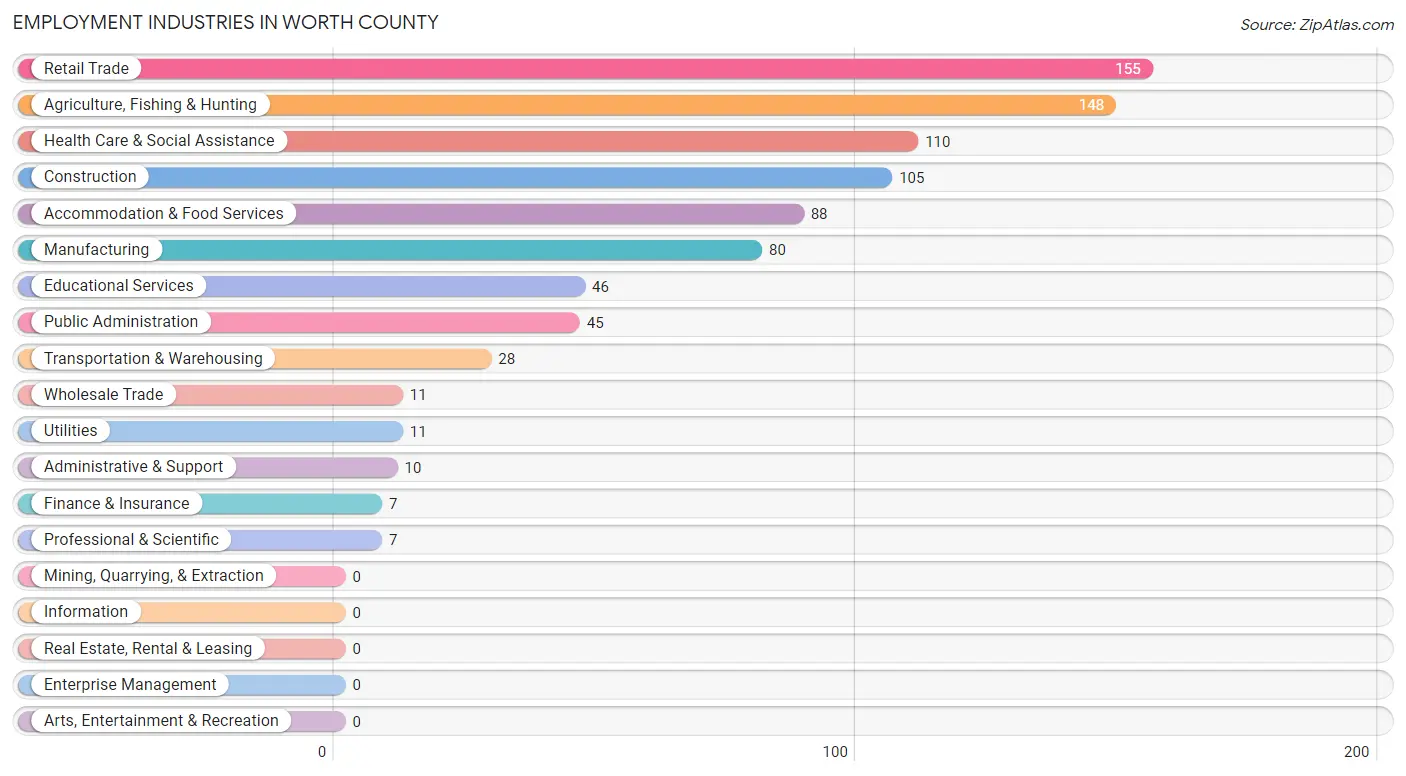
Employment Industries in Worth County
The major employment industries in Worth County include Retail Trade (155 | 16.7%), Agriculture, Fishing & Hunting (148 | 15.9%), Health Care & Social Assistance (110 | 11.8%), Construction (105 | 11.3%), and Accommodation & Food Services (88 | 9.5%).
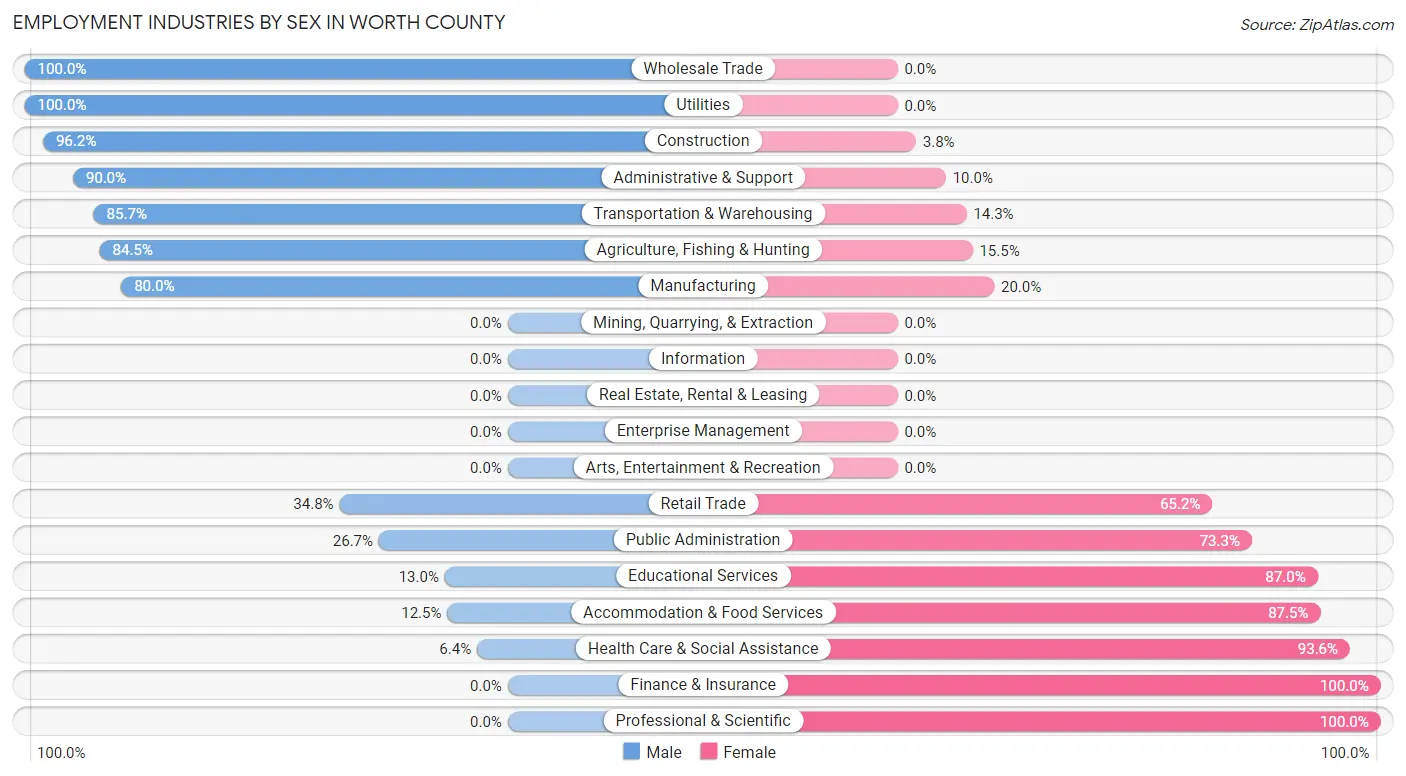
Employment Industries by Sex in Worth County
The Worth County industries that see more men than women are Wholesale Trade (100.0%), Utilities (100.0%), and Construction (96.2%), whereas the industries that tend to have a higher number of women are Finance & Insurance (100.0%), Professional & Scientific (100.0%), and Health Care & Social Assistance (93.6%).
| Industry | Male | Female |
| Agriculture, Fishing & Hunting | 125 (84.5%) | 23 (15.5%) |
| Mining, Quarrying, & Extraction | 0 (0.0%) | 0 (0.0%) |
| Construction | 101 (96.2%) | 4 (3.8%) |
| Manufacturing | 64 (80.0%) | 16 (20.0%) |
| Wholesale Trade | 11 (100.0%) | 0 (0.0%) |
| Retail Trade | 54 (34.8%) | 101 (65.2%) |
| Transportation & Warehousing | 24 (85.7%) | 4 (14.3%) |
| Utilities | 11 (100.0%) | 0 (0.0%) |
| Information | 0 (0.0%) | 0 (0.0%) |
| Finance & Insurance | 0 (0.0%) | 7 (100.0%) |
| Real Estate, Rental & Leasing | 0 (0.0%) | 0 (0.0%) |
| Professional & Scientific | 0 (0.0%) | 7 (100.0%) |
| Enterprise Management | 0 (0.0%) | 0 (0.0%) |
| Administrative & Support | 9 (90.0%) | 1 (10.0%) |
| Educational Services | 6 (13.0%) | 40 (87.0%) |
| Health Care & Social Assistance | 7 (6.4%) | 103 (93.6%) |
| Arts, Entertainment & Recreation | 0 (0.0%) | 0 (0.0%) |
| Accommodation & Food Services | 11 (12.5%) | 77 (87.5%) |
| Public Administration | 12 (26.7%) | 33 (73.3%) |
| Total | 486 (52.3%) | 444 (47.7%) |
Education in Worth County
School Enrollment in Worth County
The most common levels of schooling among the 374 students in Worth County are elementary school (99 | 26.5%), high school (93 | 24.9%), and middle school (74 | 19.8%).
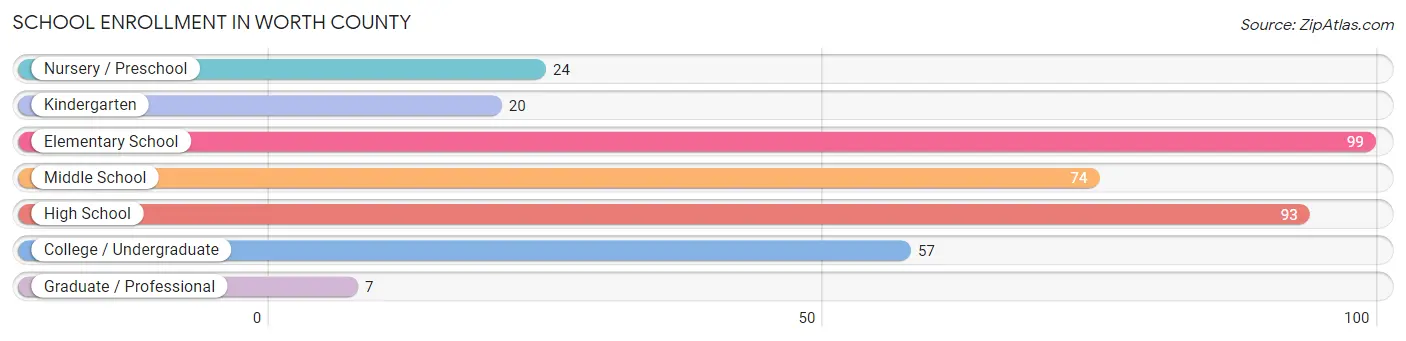
| School Level | # Students | % Students |
| Nursery / Preschool | 24 | 6.4% |
| Kindergarten | 20 | 5.3% |
| Elementary School | 99 | 26.5% |
| Middle School | 74 | 19.8% |
| High School | 93 | 24.9% |
| College / Undergraduate | 57 | 15.2% |
| Graduate / Professional | 7 | 1.9% |
| Total | 374 | 100.0% |
School Enrollment by Age by Funding Source in Worth County
Out of a total of 374 students who are enrolled in schools in Worth County, 11 (2.9%) attend a private institution, while the remaining 363 (97.1%) are enrolled in public schools. The age group of 3 to 4 year olds has the highest likelihood of being enrolled in private schools, with 5 (45.5% in the age bracket) enrolled. Conversely, the age group of 10 to 14 year olds has the lowest likelihood of being enrolled in a private school, with 99 (100.0% in the age bracket) attending a public institution.
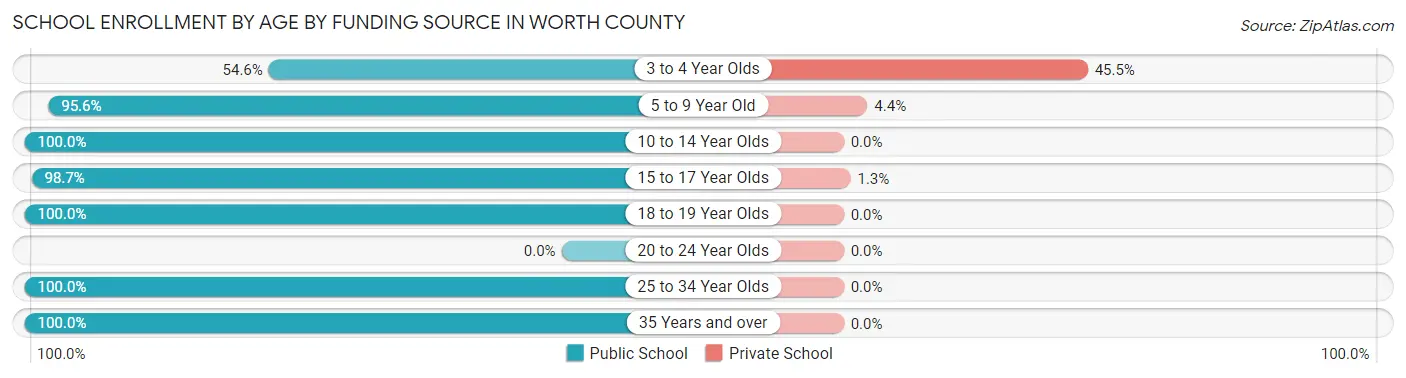
| Age Bracket | Public School | Private School |
| 3 to 4 Year Olds | 6 (54.5%) | 5 (45.5%) |
| 5 to 9 Year Old | 108 (95.6%) | 5 (4.4%) |
| 10 to 14 Year Olds | 99 (100.0%) | 0 (0.0%) |
| 15 to 17 Year Olds | 77 (98.7%) | 1 (1.3%) |
| 18 to 19 Year Olds | 46 (100.0%) | 0 (0.0%) |
| 20 to 24 Year Olds | 0 (0.0%) | 0 (0.0%) |
| 25 to 34 Year Olds | 12 (100.0%) | 0 (0.0%) |
| 35 Years and over | 15 (100.0%) | 0 (0.0%) |
| Total | 363 (97.1%) | 11 (2.9%) |
Educational Attainment by Field of Study in Worth County
Education (58 | 23.4%), business (52 | 21.0%), arts & humanities (44 | 17.7%), bio, nature & agricultural (32 | 12.9%), and science & technology (29 | 11.7%) are the most common fields of study among 248 individuals in Worth County who have obtained a bachelor's degree or higher.
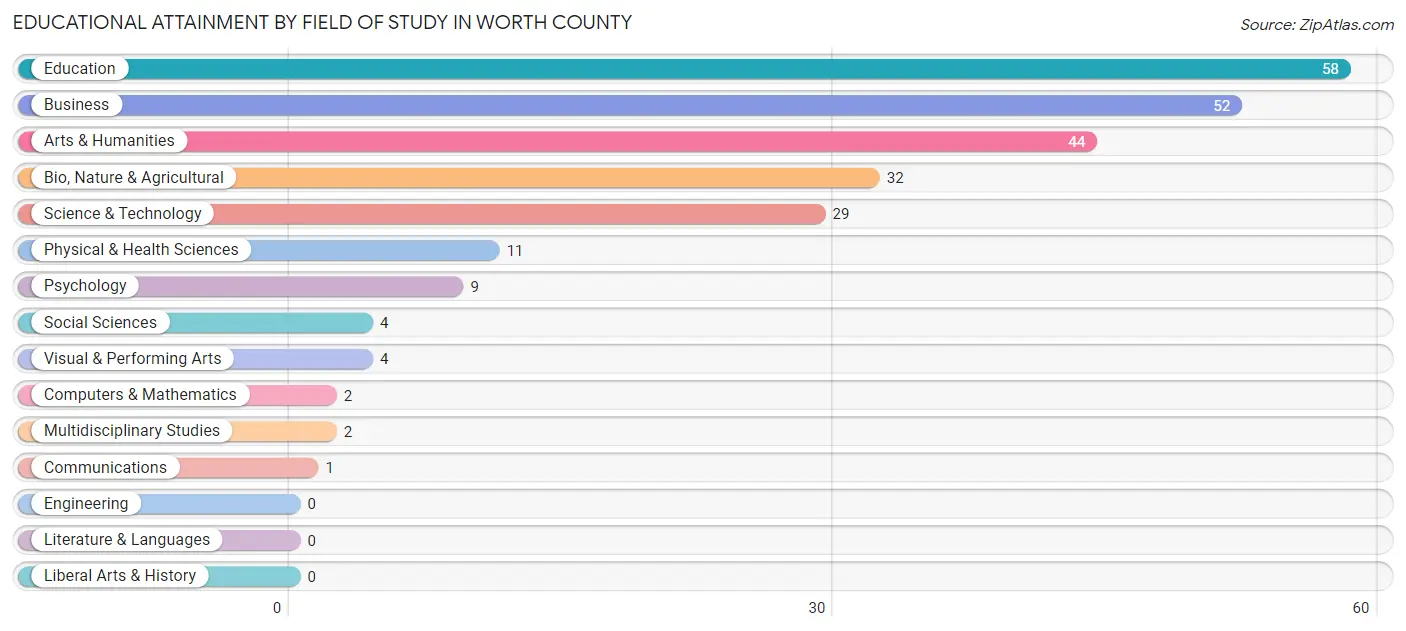
| Field of Study | # Graduates | % Graduates |
| Computers & Mathematics | 2 | 0.8% |
| Bio, Nature & Agricultural | 32 | 12.9% |
| Physical & Health Sciences | 11 | 4.4% |
| Psychology | 9 | 3.6% |
| Social Sciences | 4 | 1.6% |
| Engineering | 0 | 0.0% |
| Multidisciplinary Studies | 2 | 0.8% |
| Science & Technology | 29 | 11.7% |
| Business | 52 | 21.0% |
| Education | 58 | 23.4% |
| Literature & Languages | 0 | 0.0% |
| Liberal Arts & History | 0 | 0.0% |
| Visual & Performing Arts | 4 | 1.6% |
| Communications | 1 | 0.4% |
| Arts & Humanities | 44 | 17.7% |
| Total | 248 | 100.0% |
Transportation & Commute in Worth County
Vehicle Availability by Sex in Worth County
The most prevalent vehicle ownership categories in Worth County are males with 2 vehicles (163, accounting for 33.8%) and females with 2 vehicles (91, making up 40.3%).
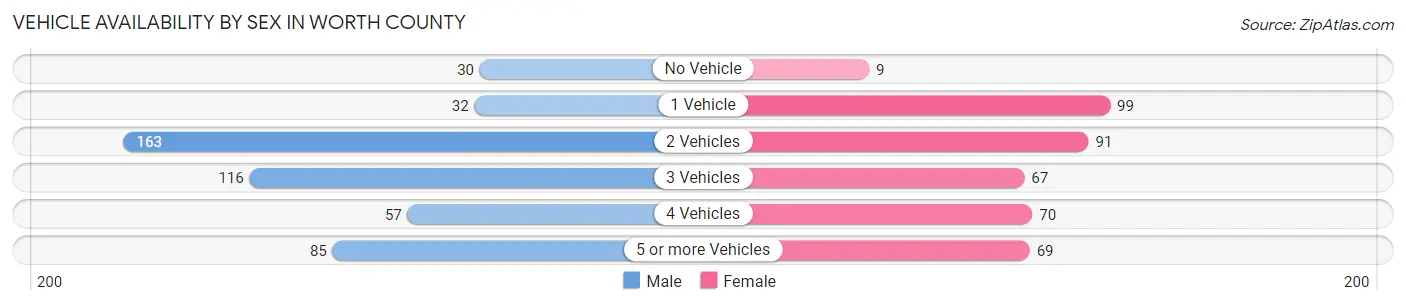
| Vehicles Available | Male | Female |
| No Vehicle | 30 (6.2%) | 9 (2.2%) |
| 1 Vehicle | 32 (6.6%) | 99 (24.4%) |
| 2 Vehicles | 163 (33.8%) | 91 (22.5%) |
| 3 Vehicles | 116 (24.0%) | 67 (16.5%) |
| 4 Vehicles | 57 (11.8%) | 70 (17.3%) |
| 5 or more Vehicles | 85 (17.6%) | 69 (17.0%) |
| Total | 483 (100.0%) | 405 (100.0%) |
Commute Time in Worth County
The most frequently occuring commute durations in Worth County are 5 to 9 minutes (150 commuters, 19.2%), 45 to 59 minutes (108 commuters, 13.9%), and less than 5 minutes (106 commuters, 13.6%).
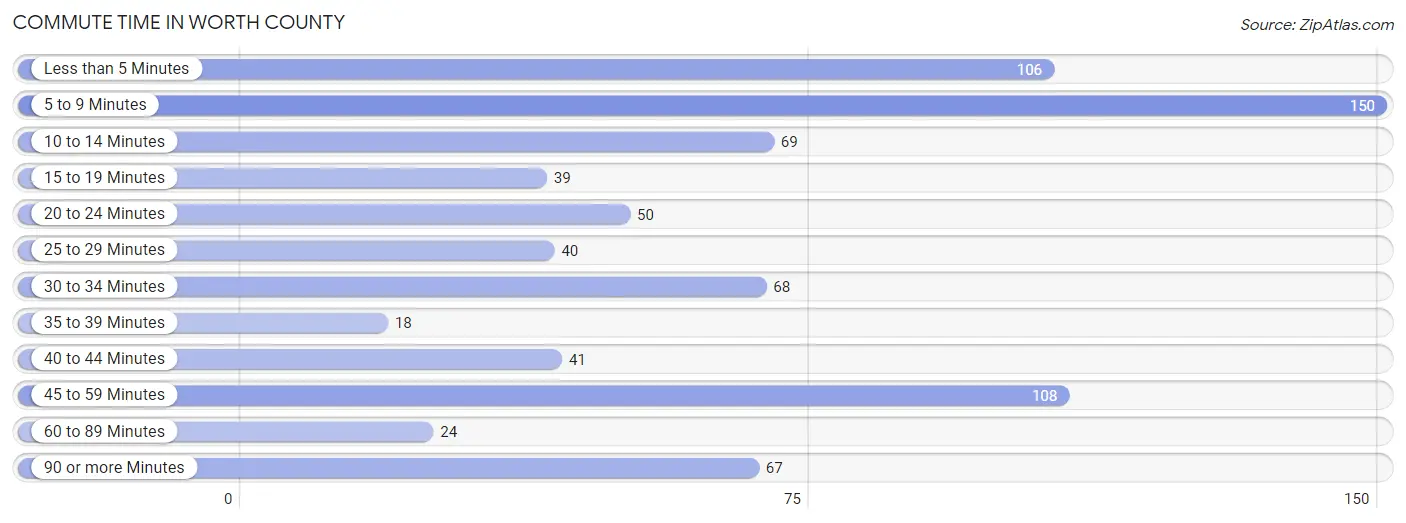
| Commute Time | # Commuters | % Commuters |
| Less than 5 Minutes | 106 | 13.6% |
| 5 to 9 Minutes | 150 | 19.2% |
| 10 to 14 Minutes | 69 | 8.8% |
| 15 to 19 Minutes | 39 | 5.0% |
| 20 to 24 Minutes | 50 | 6.4% |
| 25 to 29 Minutes | 40 | 5.1% |
| 30 to 34 Minutes | 68 | 8.7% |
| 35 to 39 Minutes | 18 | 2.3% |
| 40 to 44 Minutes | 41 | 5.3% |
| 45 to 59 Minutes | 108 | 13.9% |
| 60 to 89 Minutes | 24 | 3.1% |
| 90 or more Minutes | 67 | 8.6% |
Commute Time by Sex in Worth County
The most common commute times in Worth County are 5 to 9 minutes (104 commuters, 24.8%) for males and 10 to 14 minutes (61 commuters, 16.9%) for females.
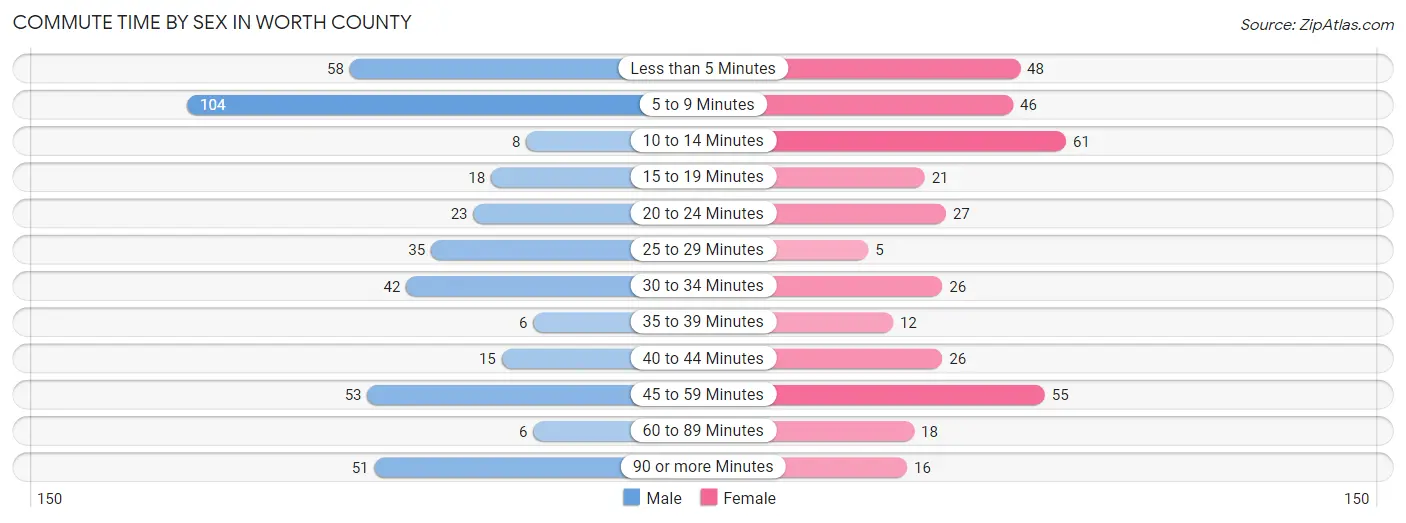
| Commute Time | Male | Female |
| Less than 5 Minutes | 58 (13.8%) | 48 (13.3%) |
| 5 to 9 Minutes | 104 (24.8%) | 46 (12.7%) |
| 10 to 14 Minutes | 8 (1.9%) | 61 (16.9%) |
| 15 to 19 Minutes | 18 (4.3%) | 21 (5.8%) |
| 20 to 24 Minutes | 23 (5.5%) | 27 (7.5%) |
| 25 to 29 Minutes | 35 (8.4%) | 5 (1.4%) |
| 30 to 34 Minutes | 42 (10.0%) | 26 (7.2%) |
| 35 to 39 Minutes | 6 (1.4%) | 12 (3.3%) |
| 40 to 44 Minutes | 15 (3.6%) | 26 (7.2%) |
| 45 to 59 Minutes | 53 (12.7%) | 55 (15.2%) |
| 60 to 89 Minutes | 6 (1.4%) | 18 (5.0%) |
| 90 or more Minutes | 51 (12.2%) | 16 (4.4%) |
Time of Departure to Work by Sex in Worth County
The most frequent times of departure to work in Worth County are 7:00 AM to 7:29 AM (66, 15.8%) for males and 6:30 AM to 6:59 AM (75, 20.8%) for females.
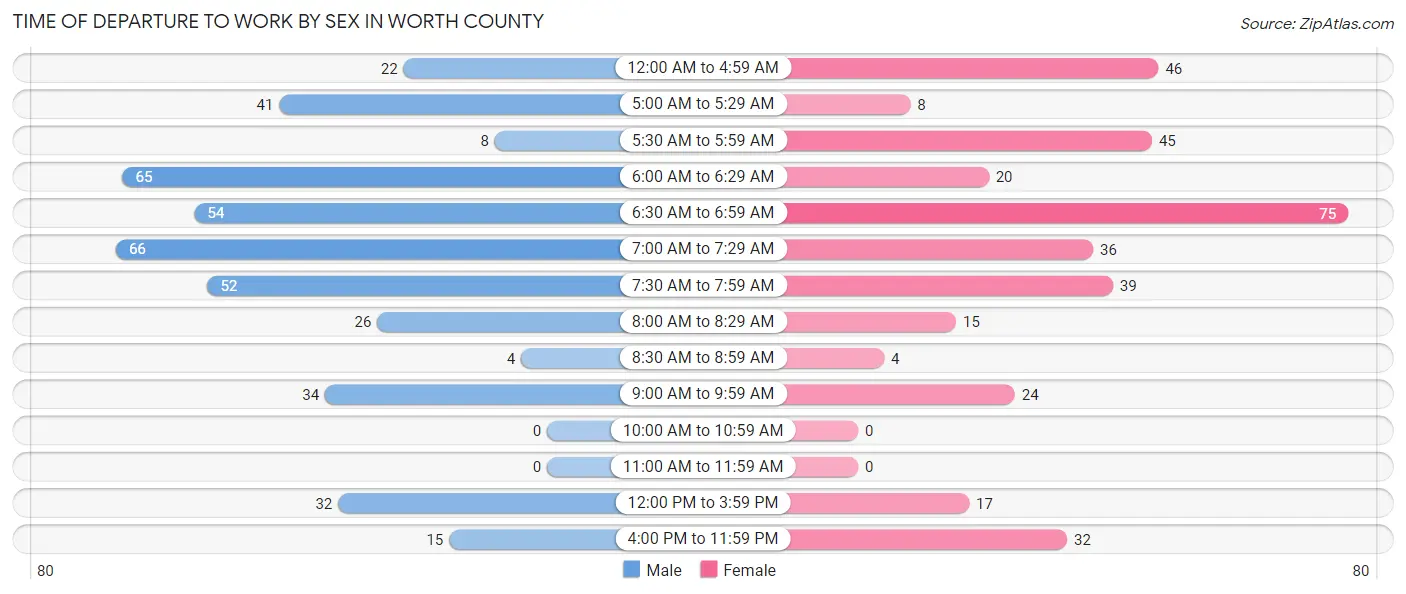
| Time of Departure | Male | Female |
| 12:00 AM to 4:59 AM | 22 (5.2%) | 46 (12.7%) |
| 5:00 AM to 5:29 AM | 41 (9.8%) | 8 (2.2%) |
| 5:30 AM to 5:59 AM | 8 (1.9%) | 45 (12.5%) |
| 6:00 AM to 6:29 AM | 65 (15.5%) | 20 (5.5%) |
| 6:30 AM to 6:59 AM | 54 (12.9%) | 75 (20.8%) |
| 7:00 AM to 7:29 AM | 66 (15.8%) | 36 (10.0%) |
| 7:30 AM to 7:59 AM | 52 (12.4%) | 39 (10.8%) |
| 8:00 AM to 8:29 AM | 26 (6.2%) | 15 (4.2%) |
| 8:30 AM to 8:59 AM | 4 (0.9%) | 4 (1.1%) |
| 9:00 AM to 9:59 AM | 34 (8.1%) | 24 (6.7%) |
| 10:00 AM to 10:59 AM | 0 (0.0%) | 0 (0.0%) |
| 11:00 AM to 11:59 AM | 0 (0.0%) | 0 (0.0%) |
| 12:00 PM to 3:59 PM | 32 (7.6%) | 17 (4.7%) |
| 4:00 PM to 11:59 PM | 15 (3.6%) | 32 (8.9%) |
| Total | 419 (100.0%) | 361 (100.0%) |
Housing Occupancy in Worth County
Occupancy by Ownership in Worth County
Of the total 773 dwellings in Worth County, owner-occupied units account for 618 (79.9%), while renter-occupied units make up 155 (20.1%).
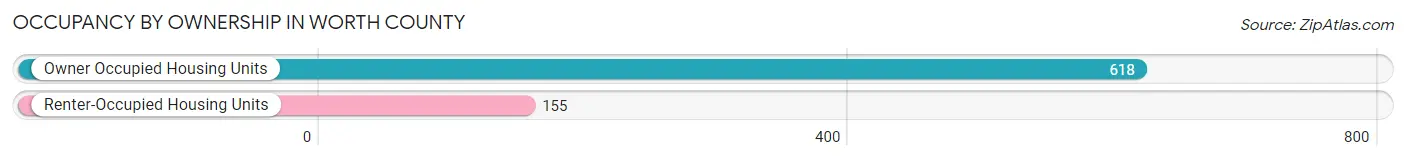
| Occupancy | # Housing Units | % Housing Units |
| Owner Occupied Housing Units | 618 | 79.9% |
| Renter-Occupied Housing Units | 155 | 20.1% |
| Total Occupied Housing Units | 773 | 100.0% |
Occupancy by Household Size in Worth County
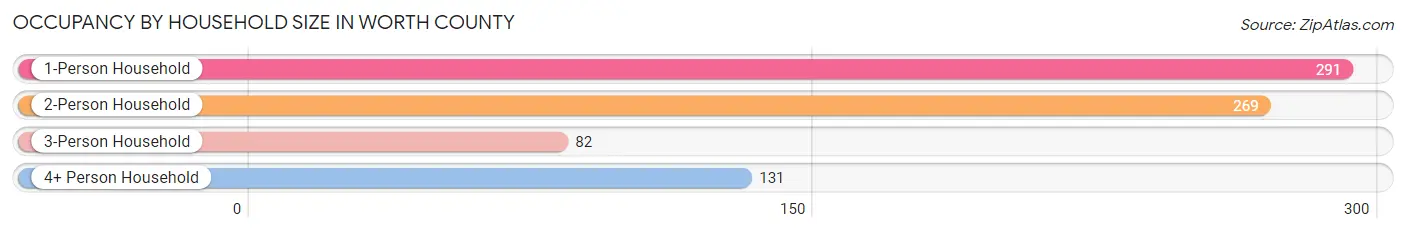
| Household Size | # Housing Units | % Housing Units |
| 1-Person Household | 291 | 37.7% |
| 2-Person Household | 269 | 34.8% |
| 3-Person Household | 82 | 10.6% |
| 4+ Person Household | 131 | 17.0% |
| Total Housing Units | 773 | 100.0% |
Occupancy by Ownership by Household Size in Worth County
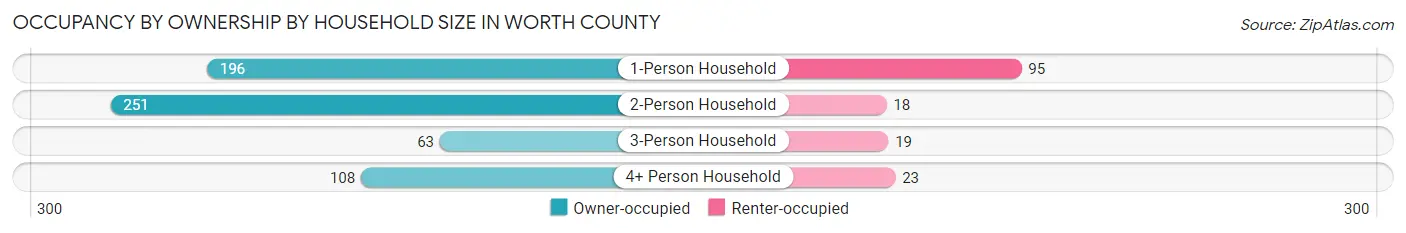
| Household Size | Owner-occupied | Renter-occupied |
| 1-Person Household | 196 (67.3%) | 95 (32.7%) |
| 2-Person Household | 251 (93.3%) | 18 (6.7%) |
| 3-Person Household | 63 (76.8%) | 19 (23.2%) |
| 4+ Person Household | 108 (82.4%) | 23 (17.6%) |
| Total Housing Units | 618 (79.9%) | 155 (20.1%) |
Occupancy by Educational Attainment in Worth County
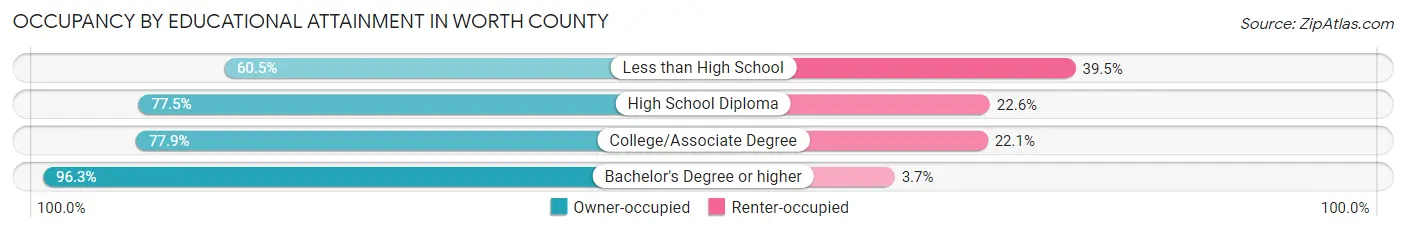
| Household Size | Owner-occupied | Renter-occupied |
| Less than High School | 26 (60.5%) | 17 (39.5%) |
| High School Diploma | 292 (77.4%) | 85 (22.6%) |
| College/Associate Degree | 169 (77.9%) | 48 (22.1%) |
| Bachelor's Degree or higher | 131 (96.3%) | 5 (3.7%) |
Occupancy by Age of Householder in Worth County
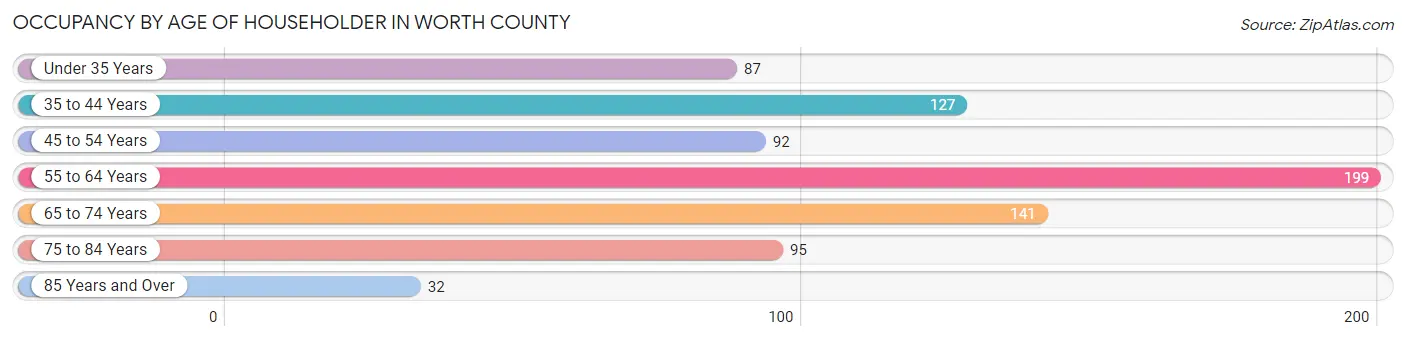
| Age Bracket | # Households | % Households |
| Under 35 Years | 87 | 11.3% |
| 35 to 44 Years | 127 | 16.4% |
| 45 to 54 Years | 92 | 11.9% |
| 55 to 64 Years | 199 | 25.7% |
| 65 to 74 Years | 141 | 18.2% |
| 75 to 84 Years | 95 | 12.3% |
| 85 Years and Over | 32 | 4.1% |
| Total | 773 | 100.0% |
Housing Finances in Worth County
Median Income by Occupancy in Worth County

| Occupancy Type | # Households | Median Income |
| Owner-Occupied | 618 (79.9%) | $53,500 |
| Renter-Occupied | 155 (20.1%) | $28,917 |
| Average | 773 (100.0%) | $43,536 |
Occupancy by Householder Income Bracket in Worth County
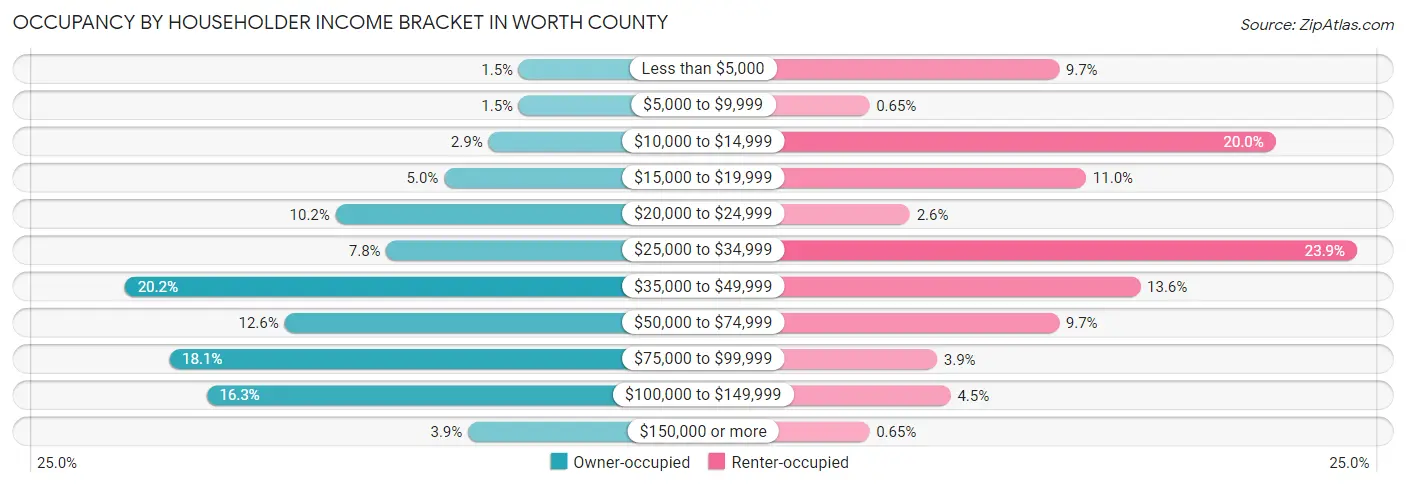
| Income Bracket | Owner-occupied | Renter-occupied |
| Less than $5,000 | 9 (1.5%) | 15 (9.7%) |
| $5,000 to $9,999 | 9 (1.5%) | 1 (0.6%) |
| $10,000 to $14,999 | 18 (2.9%) | 31 (20.0%) |
| $15,000 to $19,999 | 31 (5.0%) | 17 (11.0%) |
| $20,000 to $24,999 | 63 (10.2%) | 4 (2.6%) |
| $25,000 to $34,999 | 48 (7.8%) | 37 (23.9%) |
| $35,000 to $49,999 | 125 (20.2%) | 21 (13.6%) |
| $50,000 to $74,999 | 78 (12.6%) | 15 (9.7%) |
| $75,000 to $99,999 | 112 (18.1%) | 6 (3.9%) |
| $100,000 to $149,999 | 101 (16.3%) | 7 (4.5%) |
| $150,000 or more | 24 (3.9%) | 1 (0.6%) |
| Total | 618 (100.0%) | 155 (100.0%) |
Monthly Housing Cost Tiers in Worth County
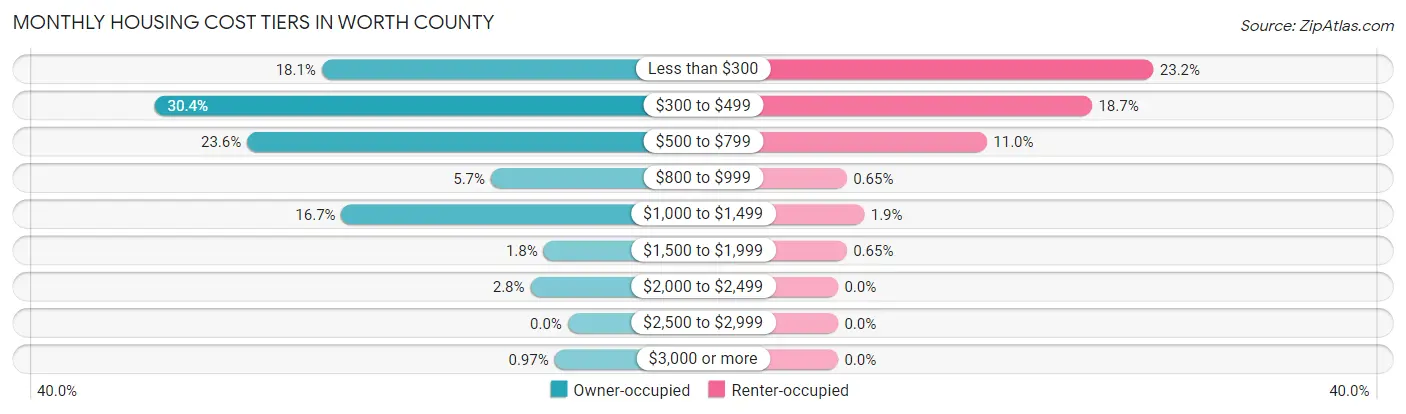
| Monthly Cost | Owner-occupied | Renter-occupied |
| Less than $300 | 112 (18.1%) | 36 (23.2%) |
| $300 to $499 | 188 (30.4%) | 29 (18.7%) |
| $500 to $799 | 146 (23.6%) | 17 (11.0%) |
| $800 to $999 | 35 (5.7%) | 1 (0.6%) |
| $1,000 to $1,499 | 103 (16.7%) | 3 (1.9%) |
| $1,500 to $1,999 | 11 (1.8%) | 1 (0.6%) |
| $2,000 to $2,499 | 17 (2.8%) | 0 (0.0%) |
| $2,500 to $2,999 | 0 (0.0%) | 0 (0.0%) |
| $3,000 or more | 6 (1.0%) | 0 (0.0%) |
| Total | 618 (100.0%) | 155 (100.0%) |
Physical Housing Characteristics in Worth County
Housing Structures in Worth County
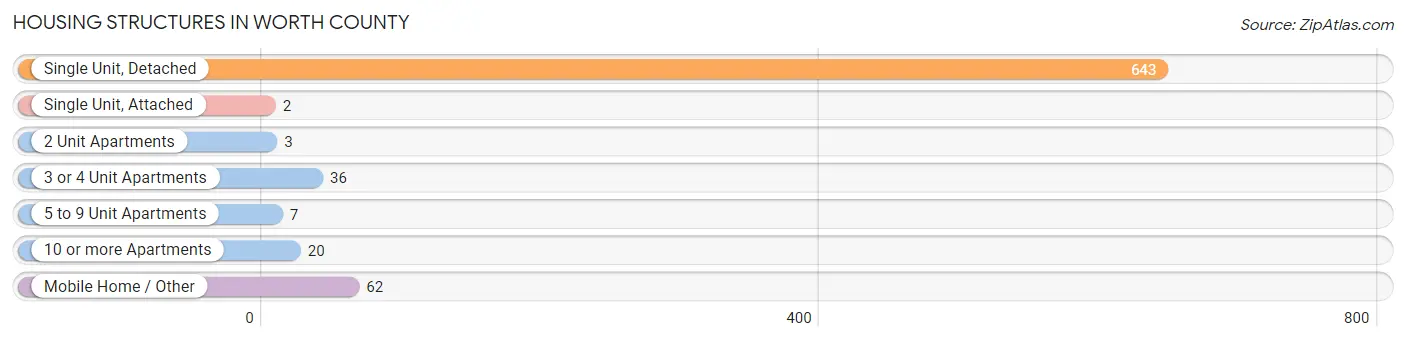
| Structure Type | # Housing Units | % Housing Units |
| Single Unit, Detached | 643 | 83.2% |
| Single Unit, Attached | 2 | 0.3% |
| 2 Unit Apartments | 3 | 0.4% |
| 3 or 4 Unit Apartments | 36 | 4.7% |
| 5 to 9 Unit Apartments | 7 | 0.9% |
| 10 or more Apartments | 20 | 2.6% |
| Mobile Home / Other | 62 | 8.0% |
| Total | 773 | 100.0% |
Housing Structures by Occupancy in Worth County
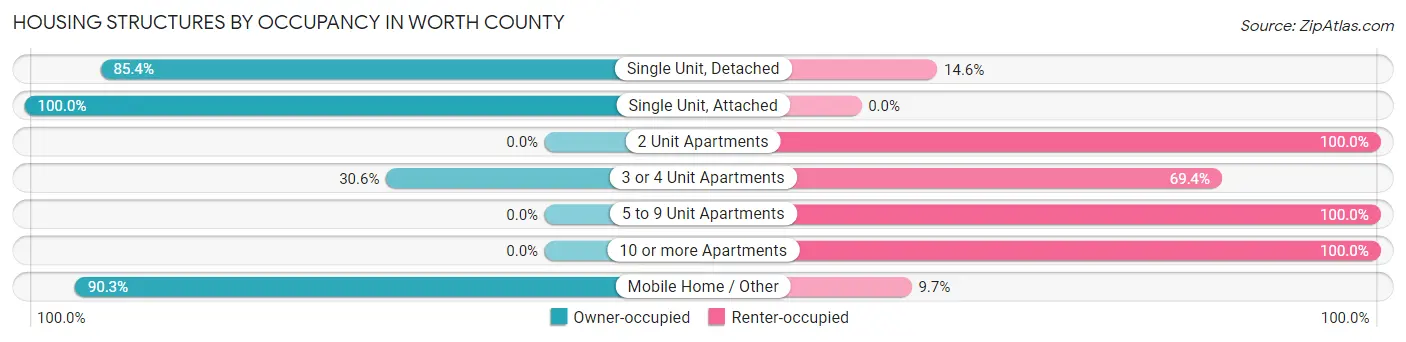
| Structure Type | Owner-occupied | Renter-occupied |
| Single Unit, Detached | 549 (85.4%) | 94 (14.6%) |
| Single Unit, Attached | 2 (100.0%) | 0 (0.0%) |
| 2 Unit Apartments | 0 (0.0%) | 3 (100.0%) |
| 3 or 4 Unit Apartments | 11 (30.6%) | 25 (69.4%) |
| 5 to 9 Unit Apartments | 0 (0.0%) | 7 (100.0%) |
| 10 or more Apartments | 0 (0.0%) | 20 (100.0%) |
| Mobile Home / Other | 56 (90.3%) | 6 (9.7%) |
| Total | 618 (79.9%) | 155 (20.1%) |
Housing Structures by Number of Rooms in Worth County
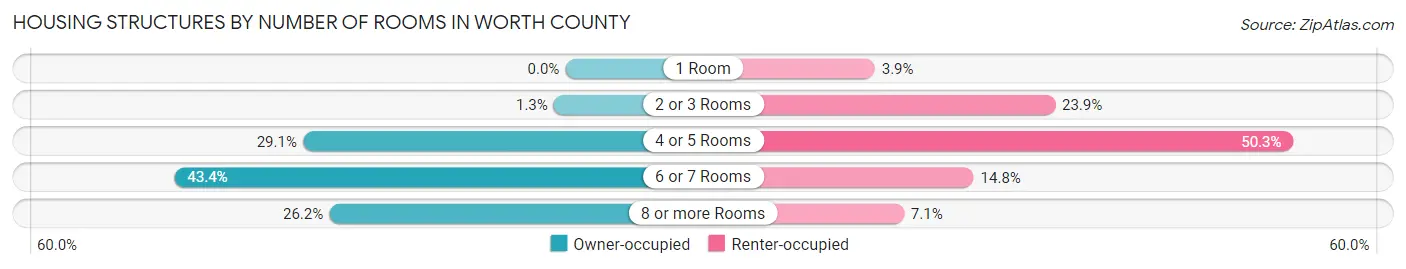
| Number of Rooms | Owner-occupied | Renter-occupied |
| 1 Room | 0 (0.0%) | 6 (3.9%) |
| 2 or 3 Rooms | 8 (1.3%) | 37 (23.9%) |
| 4 or 5 Rooms | 180 (29.1%) | 78 (50.3%) |
| 6 or 7 Rooms | 268 (43.4%) | 23 (14.8%) |
| 8 or more Rooms | 162 (26.2%) | 11 (7.1%) |
| Total | 618 (100.0%) | 155 (100.0%) |
Housing Structure by Heating Type in Worth County
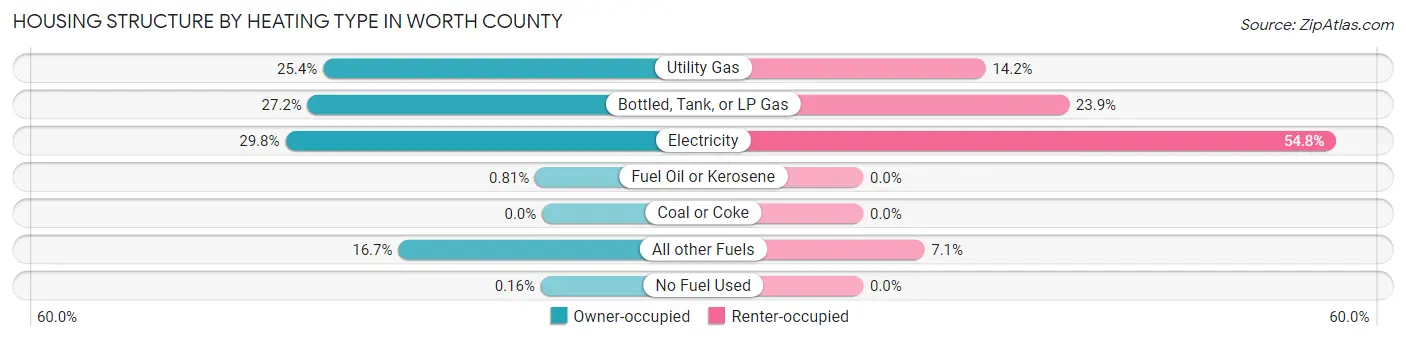
| Heating Type | Owner-occupied | Renter-occupied |
| Utility Gas | 157 (25.4%) | 22 (14.2%) |
| Bottled, Tank, or LP Gas | 168 (27.2%) | 37 (23.9%) |
| Electricity | 184 (29.8%) | 85 (54.8%) |
| Fuel Oil or Kerosene | 5 (0.8%) | 0 (0.0%) |
| Coal or Coke | 0 (0.0%) | 0 (0.0%) |
| All other Fuels | 103 (16.7%) | 11 (7.1%) |
| No Fuel Used | 1 (0.2%) | 0 (0.0%) |
| Total | 618 (100.0%) | 155 (100.0%) |
Household Vehicle Usage in Worth County
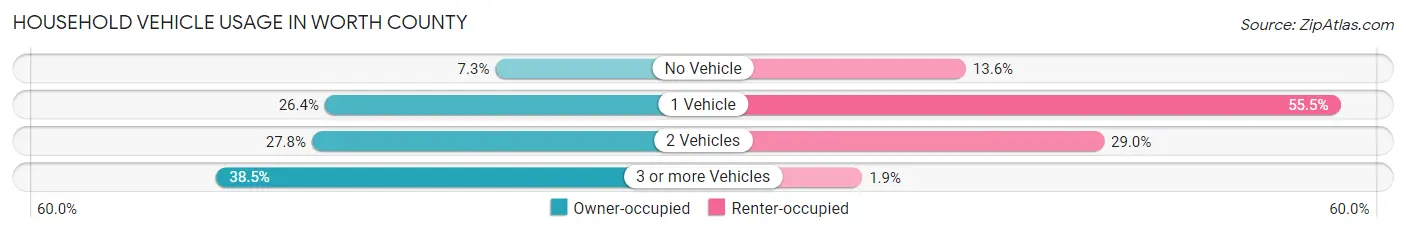
| Vehicles per Household | Owner-occupied | Renter-occupied |
| No Vehicle | 45 (7.3%) | 21 (13.6%) |
| 1 Vehicle | 163 (26.4%) | 86 (55.5%) |
| 2 Vehicles | 172 (27.8%) | 45 (29.0%) |
| 3 or more Vehicles | 238 (38.5%) | 3 (1.9%) |
| Total | 618 (100.0%) | 155 (100.0%) |
Real Estate & Mortgages in Worth County
Real Estate and Mortgage Overview in Worth County
| Characteristic | Without Mortgage | With Mortgage |
| Housing Units | 408 | 210 |
| Median Property Value | $87,600 | $88,800 |
| Median Household Income | $39,286 | $9 |
| Monthly Housing Costs | $414 | $6 |
| Real Estate Taxes | $655 | $0 |
Property Value by Mortgage Status in Worth County
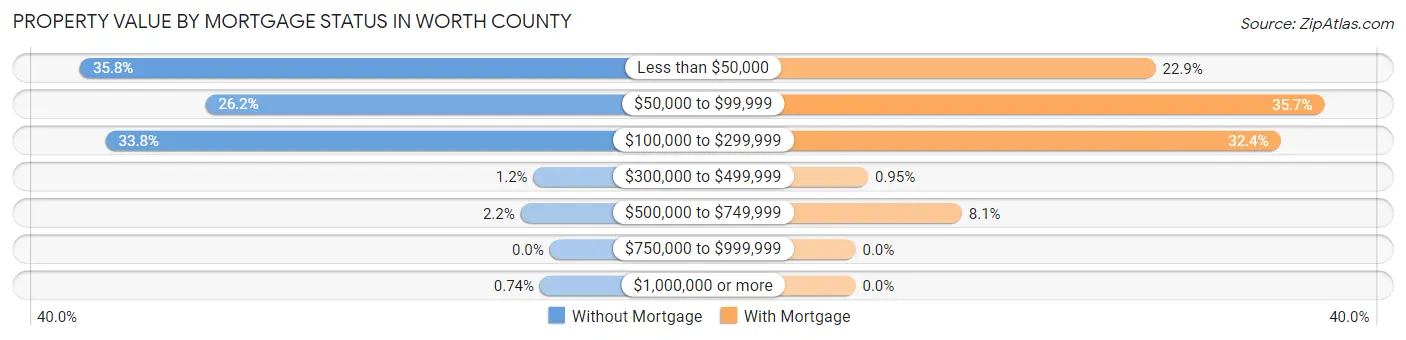
| Property Value | Without Mortgage | With Mortgage |
| Less than $50,000 | 146 (35.8%) | 48 (22.9%) |
| $50,000 to $99,999 | 107 (26.2%) | 75 (35.7%) |
| $100,000 to $299,999 | 138 (33.8%) | 68 (32.4%) |
| $300,000 to $499,999 | 5 (1.2%) | 2 (0.9%) |
| $500,000 to $749,999 | 9 (2.2%) | 17 (8.1%) |
| $750,000 to $999,999 | 0 (0.0%) | 0 (0.0%) |
| $1,000,000 or more | 3 (0.7%) | 0 (0.0%) |
| Total | 408 (100.0%) | 210 (100.0%) |
Household Income by Mortgage Status in Worth County
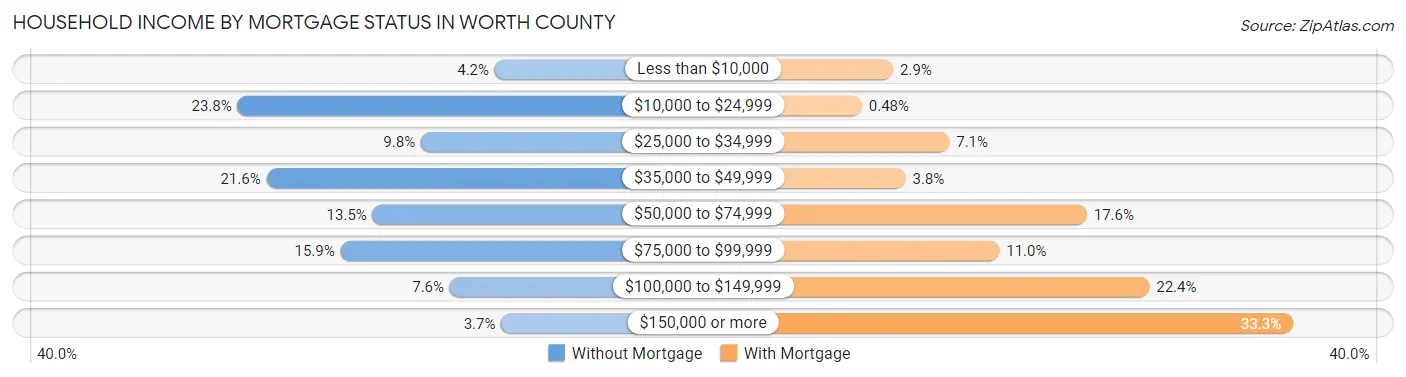
| Household Income | Without Mortgage | With Mortgage |
| Less than $10,000 | 17 (4.2%) | 6 (2.9%) |
| $10,000 to $24,999 | 97 (23.8%) | 1 (0.5%) |
| $25,000 to $34,999 | 40 (9.8%) | 15 (7.1%) |
| $35,000 to $49,999 | 88 (21.6%) | 8 (3.8%) |
| $50,000 to $74,999 | 55 (13.5%) | 37 (17.6%) |
| $75,000 to $99,999 | 65 (15.9%) | 23 (11.0%) |
| $100,000 to $149,999 | 31 (7.6%) | 47 (22.4%) |
| $150,000 or more | 15 (3.7%) | 70 (33.3%) |
| Total | 408 (100.0%) | 210 (100.0%) |
Property Value to Household Income Ratio in Worth County
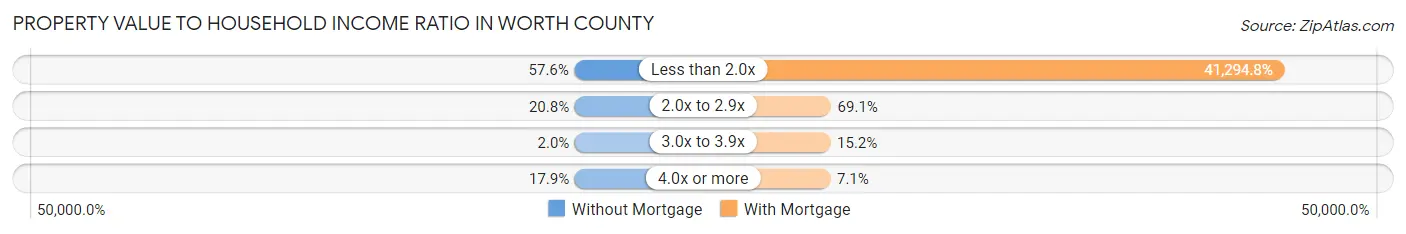
| Value-to-Income Ratio | Without Mortgage | With Mortgage |
| Less than 2.0x | 235 (57.6%) | 86,719 (41,294.8%) |
| 2.0x to 2.9x | 85 (20.8%) | 145 (69.1%) |
| 3.0x to 3.9x | 8 (2.0%) | 32 (15.2%) |
| 4.0x or more | 73 (17.9%) | 15 (7.1%) |
| Total | 408 (100.0%) | 210 (100.0%) |
Real Estate Taxes by Mortgage Status in Worth County
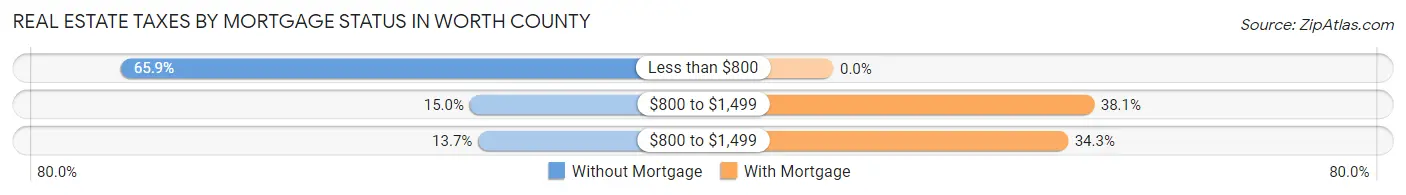
| Property Taxes | Without Mortgage | With Mortgage |
| Less than $800 | 269 (65.9%) | 0 (0.0%) |
| $800 to $1,499 | 61 (14.9%) | 80 (38.1%) |
| $800 to $1,499 | 56 (13.7%) | 72 (34.3%) |
| Total | 408 (100.0%) | 210 (100.0%) |
Health & Disability in Worth County
Health Insurance Coverage by Age in Worth County
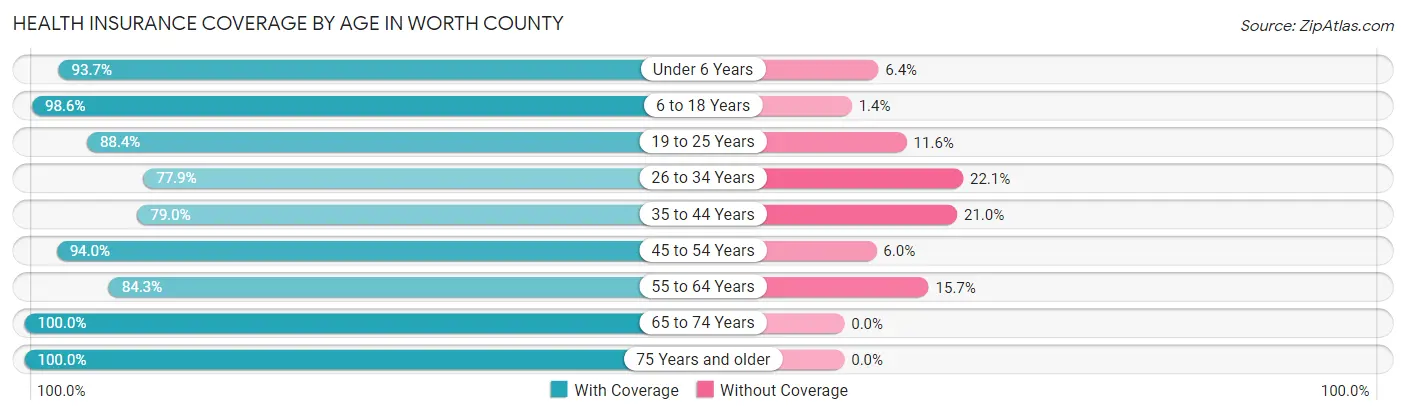
| Age Bracket | With Coverage | Without Coverage |
| Under 6 Years | 118 (93.6%) | 8 (6.4%) |
| 6 to 18 Years | 283 (98.6%) | 4 (1.4%) |
| 19 to 25 Years | 152 (88.4%) | 20 (11.6%) |
| 26 to 34 Years | 109 (77.9%) | 31 (22.1%) |
| 35 to 44 Years | 169 (79.0%) | 45 (21.0%) |
| 45 to 54 Years | 204 (94.0%) | 13 (6.0%) |
| 55 to 64 Years | 268 (84.3%) | 50 (15.7%) |
| 65 to 74 Years | 260 (100.0%) | 0 (0.0%) |
| 75 Years and older | 223 (100.0%) | 0 (0.0%) |
| Total | 1,786 (91.3%) | 171 (8.7%) |
Health Insurance Coverage by Citizenship Status in Worth County
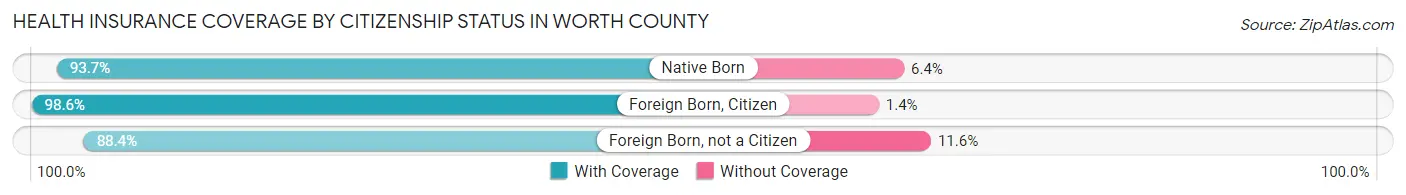
| Citizenship Status | With Coverage | Without Coverage |
| Native Born | 118 (93.6%) | 8 (6.4%) |
| Foreign Born, Citizen | 283 (98.6%) | 4 (1.4%) |
| Foreign Born, not a Citizen | 152 (88.4%) | 20 (11.6%) |
Health Insurance Coverage by Household Income in Worth County
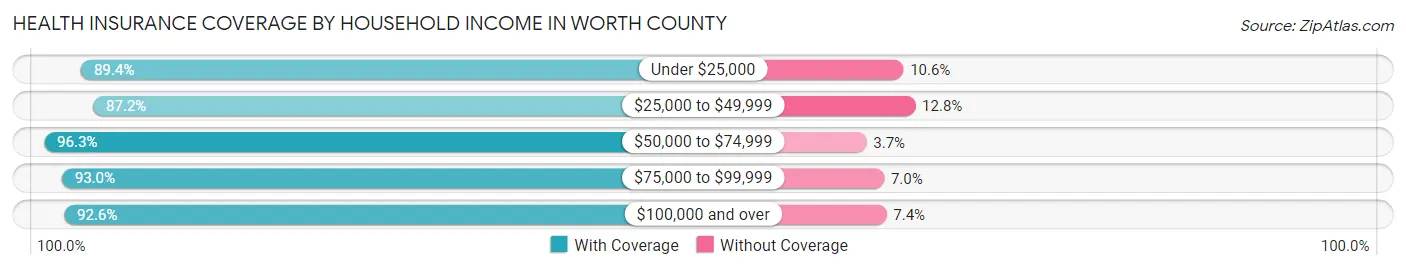
| Household Income | With Coverage | Without Coverage |
| Under $25,000 | 364 (89.4%) | 43 (10.6%) |
| $25,000 to $49,999 | 388 (87.2%) | 57 (12.8%) |
| $50,000 to $74,999 | 236 (96.3%) | 9 (3.7%) |
| $75,000 to $99,999 | 347 (93.0%) | 26 (7.0%) |
| $100,000 and over | 450 (92.6%) | 36 (7.4%) |
Public vs Private Health Insurance Coverage by Age in Worth County
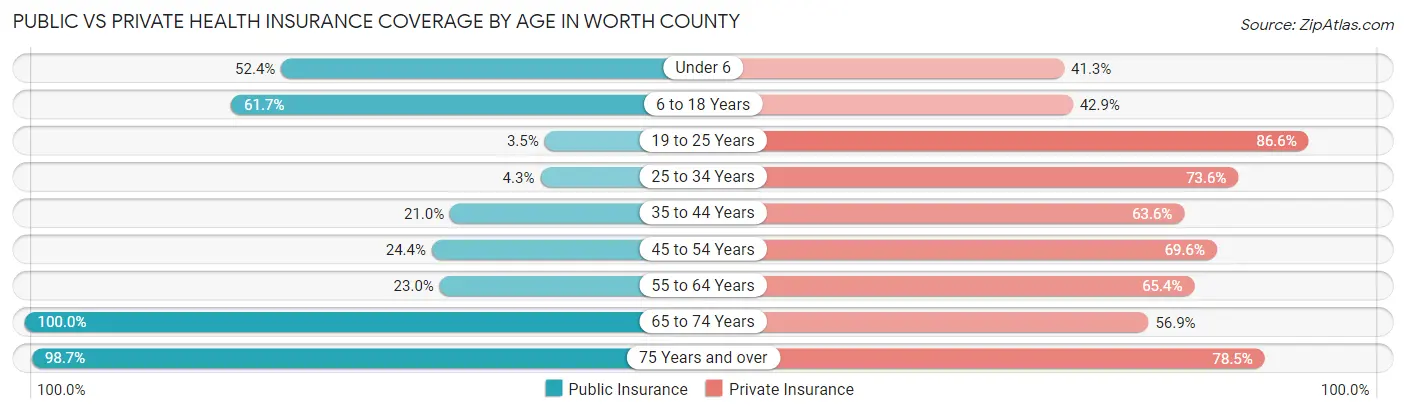
| Age Bracket | Public Insurance | Private Insurance |
| Under 6 | 66 (52.4%) | 52 (41.3%) |
| 6 to 18 Years | 177 (61.7%) | 123 (42.9%) |
| 19 to 25 Years | 6 (3.5%) | 149 (86.6%) |
| 25 to 34 Years | 6 (4.3%) | 103 (73.6%) |
| 35 to 44 Years | 45 (21.0%) | 136 (63.5%) |
| 45 to 54 Years | 53 (24.4%) | 151 (69.6%) |
| 55 to 64 Years | 73 (23.0%) | 208 (65.4%) |
| 65 to 74 Years | 260 (100.0%) | 148 (56.9%) |
| 75 Years and over | 220 (98.7%) | 175 (78.5%) |
| Total | 906 (46.3%) | 1,245 (63.6%) |
Disability Status by Sex by Age in Worth County
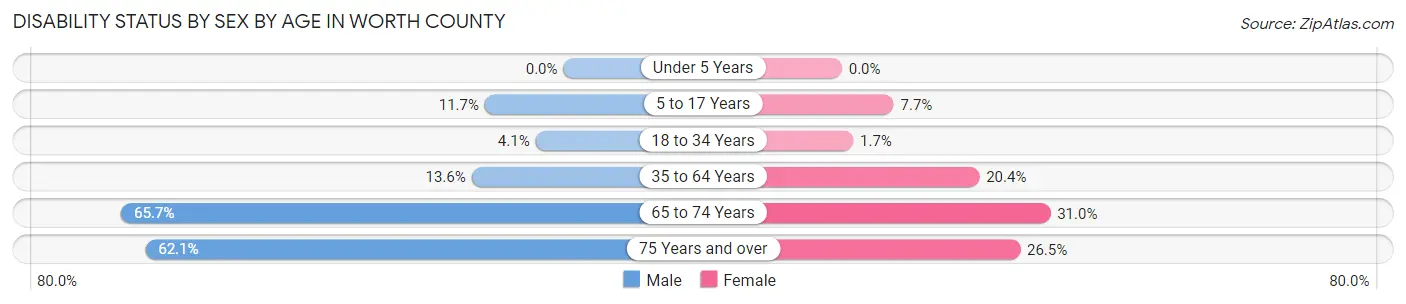
| Age Bracket | Male | Female |
| Under 5 Years | 0 (0.0%) | 0 (0.0%) |
| 5 to 17 Years | 19 (11.7%) | 10 (7.7%) |
| 18 to 34 Years | 6 (4.1%) | 3 (1.7%) |
| 35 to 64 Years | 56 (13.6%) | 69 (20.4%) |
| 65 to 74 Years | 88 (65.7%) | 39 (30.9%) |
| 75 Years and over | 54 (62.1%) | 36 (26.5%) |
Disability Class by Sex by Age in Worth County
Disability Class: Hearing Difficulty
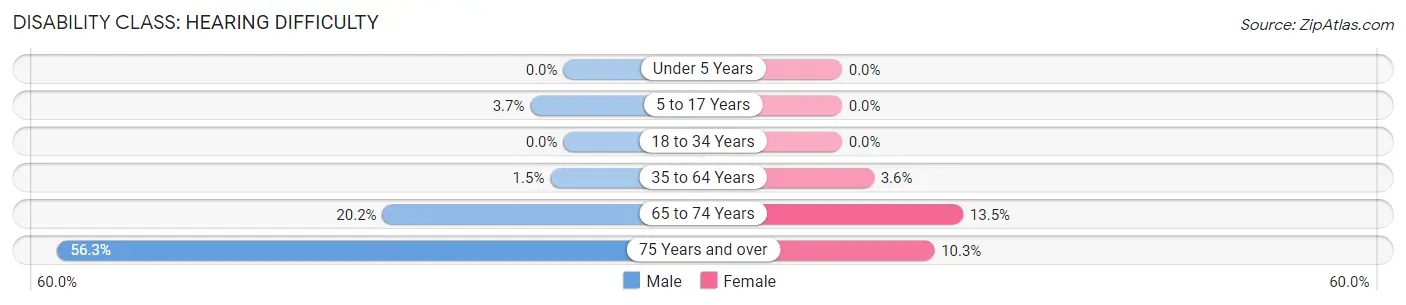
| Age Bracket | Male | Female |
| Under 5 Years | 0 (0.0%) | 0 (0.0%) |
| 5 to 17 Years | 6 (3.7%) | 0 (0.0%) |
| 18 to 34 Years | 0 (0.0%) | 0 (0.0%) |
| 35 to 64 Years | 6 (1.5%) | 12 (3.5%) |
| 65 to 74 Years | 27 (20.2%) | 17 (13.5%) |
| 75 Years and over | 49 (56.3%) | 14 (10.3%) |
Disability Class: Vision Difficulty
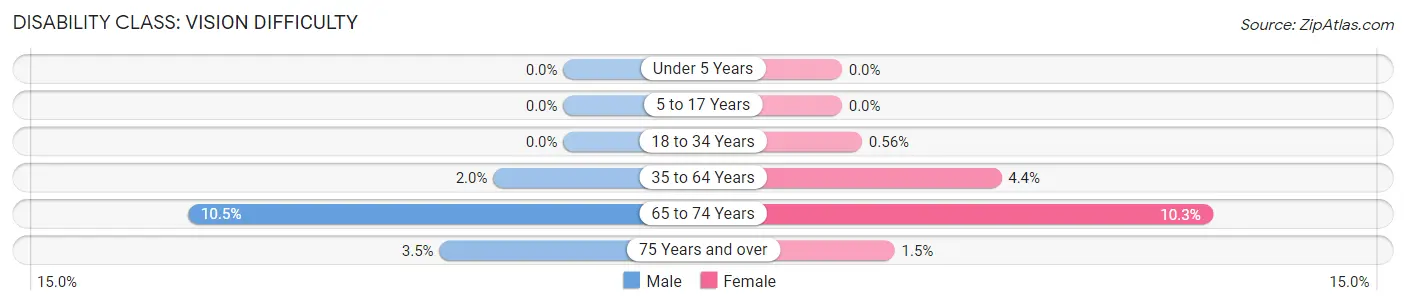
| Age Bracket | Male | Female |
| Under 5 Years | 0 (0.0%) | 0 (0.0%) |
| 5 to 17 Years | 0 (0.0%) | 0 (0.0%) |
| 18 to 34 Years | 0 (0.0%) | 1 (0.6%) |
| 35 to 64 Years | 8 (1.9%) | 15 (4.4%) |
| 65 to 74 Years | 14 (10.4%) | 13 (10.3%) |
| 75 Years and over | 3 (3.5%) | 2 (1.5%) |
Disability Class: Cognitive Difficulty
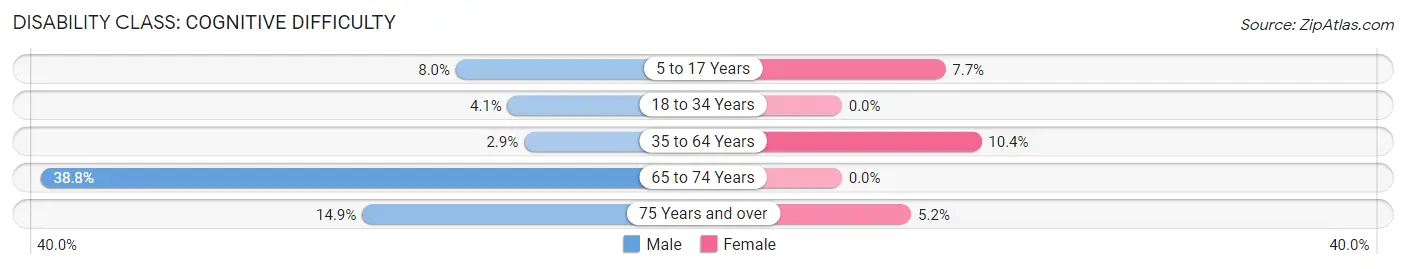
| Age Bracket | Male | Female |
| 5 to 17 Years | 13 (8.0%) | 10 (7.7%) |
| 18 to 34 Years | 6 (4.1%) | 0 (0.0%) |
| 35 to 64 Years | 12 (2.9%) | 35 (10.4%) |
| 65 to 74 Years | 52 (38.8%) | 0 (0.0%) |
| 75 Years and over | 13 (14.9%) | 7 (5.1%) |
Disability Class: Ambulatory Difficulty
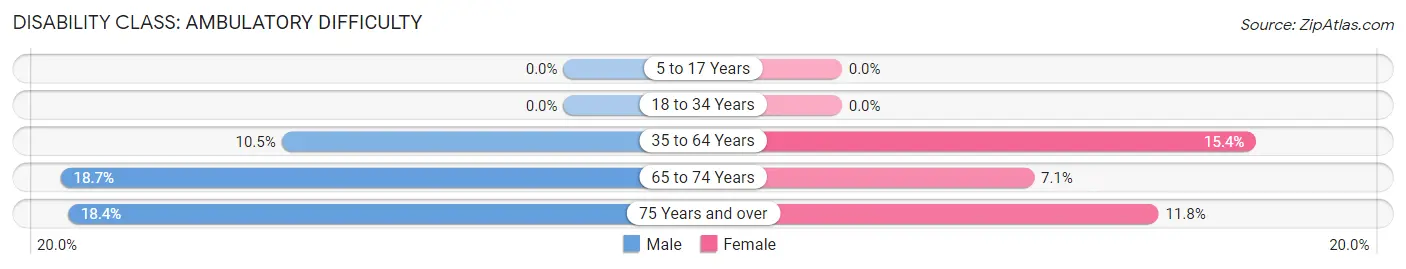
| Age Bracket | Male | Female |
| 5 to 17 Years | 0 (0.0%) | 0 (0.0%) |
| 18 to 34 Years | 0 (0.0%) | 0 (0.0%) |
| 35 to 64 Years | 43 (10.5%) | 52 (15.4%) |
| 65 to 74 Years | 25 (18.7%) | 9 (7.1%) |
| 75 Years and over | 16 (18.4%) | 16 (11.8%) |
Disability Class: Self-Care Difficulty
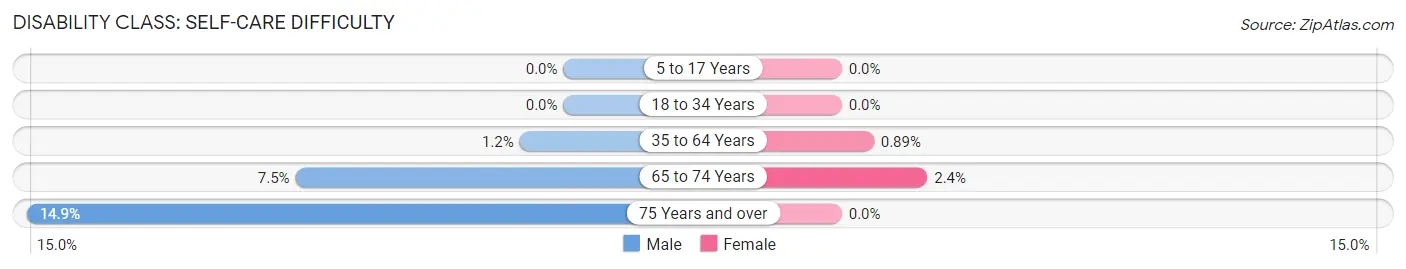
| Age Bracket | Male | Female |
| 5 to 17 Years | 0 (0.0%) | 0 (0.0%) |
| 18 to 34 Years | 0 (0.0%) | 0 (0.0%) |
| 35 to 64 Years | 5 (1.2%) | 3 (0.9%) |
| 65 to 74 Years | 10 (7.5%) | 3 (2.4%) |
| 75 Years and over | 13 (14.9%) | 0 (0.0%) |
Technology Access in Worth County
Computing Device Access in Worth County
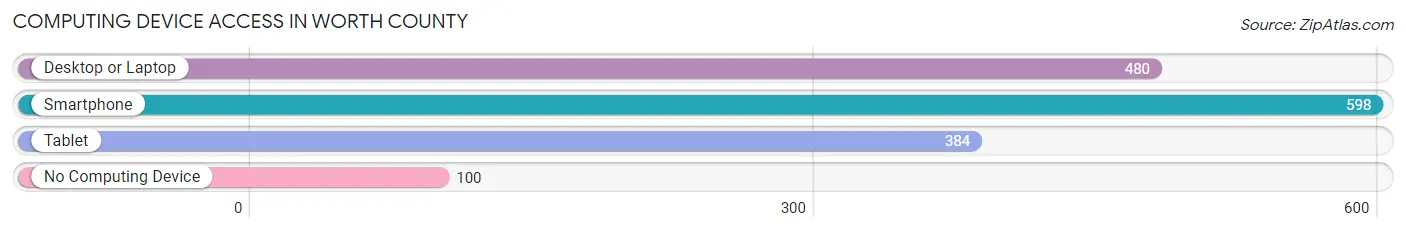
| Device Type | # Households | % Households |
| Desktop or Laptop | 480 | 62.1% |
| Smartphone | 598 | 77.4% |
| Tablet | 384 | 49.7% |
| No Computing Device | 100 | 12.9% |
| Total | 773 | 100.0% |
Internet Access in Worth County
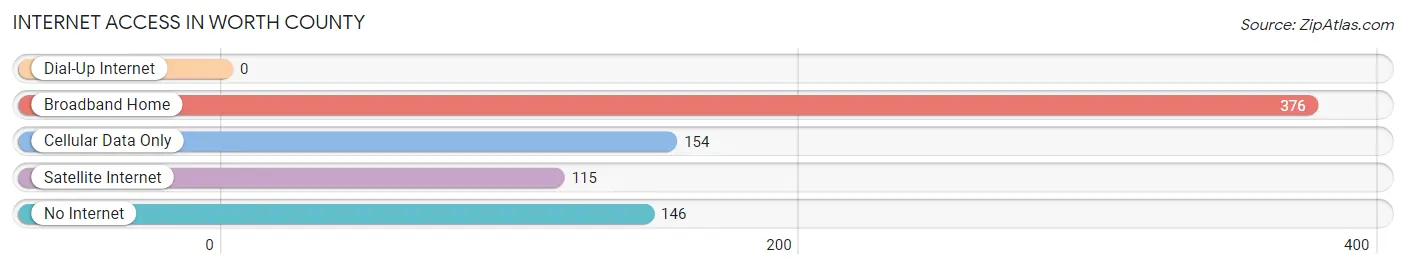
| Internet Type | # Households | % Households |
| Dial-Up Internet | 0 | 0.0% |
| Broadband Home | 376 | 48.6% |
| Cellular Data Only | 154 | 19.9% |
| Satellite Internet | 115 | 14.9% |
| No Internet | 146 | 18.9% |
| Total | 773 | 100.0% |
Worth County Summary
Worth County is located in the northwest corner of Missouri, bordered by Iowa to the north and Nebraska to the west. It is part of the St. Joseph, MO-KS Metropolitan Statistical Area. The county was established in 1841 and named after Major General William J. Worth, a hero of the Mexican-American War. As of the 2010 census, the population was 2,171, making it the second least populous county in Missouri.
Geography
Worth County is located in the northwest corner of Missouri, bordered by Iowa to the north and Nebraska to the west. It is part of the St. Joseph, MO-KS Metropolitan Statistical Area. The county has a total area of 517 square miles, of which 514 square miles is land and 3 square miles (0.6%) is water. The terrain is mostly rolling hills, with some flat areas in the north and south. The highest point in the county is located in the northwest corner, at an elevation of 1,068 feet. The county is drained by the East Fork of the Grand River, which flows through the center of the county.
Demographics
As of the 2010 census, there were 2,171 people, 845 households, and 590 families residing in the county. The population density was 4.2 people per square mile. There were 945 housing units at an average density of 1.8 per square mile. The racial makeup of the county was 97.7% White, 0.2% African American, 0.2% Native American, 0.2% Asian, 0.1% Pacific Islander, 0.5% from other races, and 1.1% from two or more races. Hispanic or Latino of any race were 1.3% of the population.
There were 845 households, out of which 28.2% had children under the age of 18 living with them, 57.2% were married couples living together, 7.7% had a female householder with no husband present, and 31.2% were non-families. 27.2% of all households were made up of individuals, and 14.2% had someone living alone who was 65 years of age or older. The average household size was 2.45 and the average family size was 2.97.
The median age in the county was 43.3 years. 24.2% of residents were under the age of 18; 6.7% were between the ages of 18 and 24; 22.2% were from 25 to 44; 28.2% were from 45 to 64; and 18.7% were 65 years of age or older. The gender makeup of the county was 49.2% male and 50.8% female.
Economy
The economy of Worth County is largely based on agriculture. The county is home to several large farms, as well as smaller family-owned operations. The main crops grown in the county are corn, soybeans, and wheat. Livestock production is also important, with cattle, hogs, and poultry being the main animals raised.
The county also has a small manufacturing sector, with several small businesses producing a variety of products. The largest employer in the county is the Worth County R-III School District, which employs over 200 people.
The median household income in Worth County was $41,944 in 2018, and the median family income was $50,938. The per capita income was $20,945. About 11.2% of families and 14.2% of the population were below the poverty line, including 19.2% of those under age 18 and 8.2% of those age 65 or over.
Conclusion
Worth County is a rural county located in the northwest corner of Missouri. It is home to a population of just over 2,000 people, and the economy is largely based on agriculture. The county has a small manufacturing sector, and the largest employer is the Worth County R-III School District. The median household income in the county is slightly below the state average, and there is a higher than average poverty rate.
Common Questions
What is Per Capita Income in Worth County?
Per Capita income in Worth County is $30,800.
What is the Median Family Income in Worth County?
Median Family Income in Worth County is $65,000.
What is the Median Household income in Worth County?
Median Household Income in Worth County is $43,536.
What is Income or Wage Gap in Worth County?
Income or Wage Gap in Worth County is 62.9%.
Women in Worth County earn 37.1 cents for every dollar earned by a man.
What is Inequality or Gini Index in Worth County?
Inequality or Gini Index in Worth County is 0.43.
What is the Total Population of Worth County?
Total Population of Worth County is 1,982.
What is the Total Male Population of Worth County?
Total Male Population of Worth County is 991.
What is the Total Female Population of Worth County?
Total Female Population of Worth County is 991.
What is the Ratio of Males per 100 Females in Worth County?
There are 100.00 Males per 100 Females in Worth County.
What is the Ratio of Females per 100 Males in Worth County?
There are 100.00 Females per 100 Males in Worth County.
What is the Median Population Age in Worth County?
Median Population Age in Worth County is 48.7 Years.
What is the Average Family Size in Worth County
Average Family Size in Worth County is 3.4 People.
What is the Average Household Size in Worth County
Average Household Size in Worth County is 2.5 People.
How Large is the Labor Force in Worth County?
There are 939 People in the Labor Forcein in Worth County.
What is the Percentage of People in the Labor Force in Worth County?
58.2% of People are in the Labor Force in Worth County.
What is the Unemployment Rate in Worth County?
Unemployment Rate in Worth County is 0.9%.