Vernon County, MO Map & Demographics
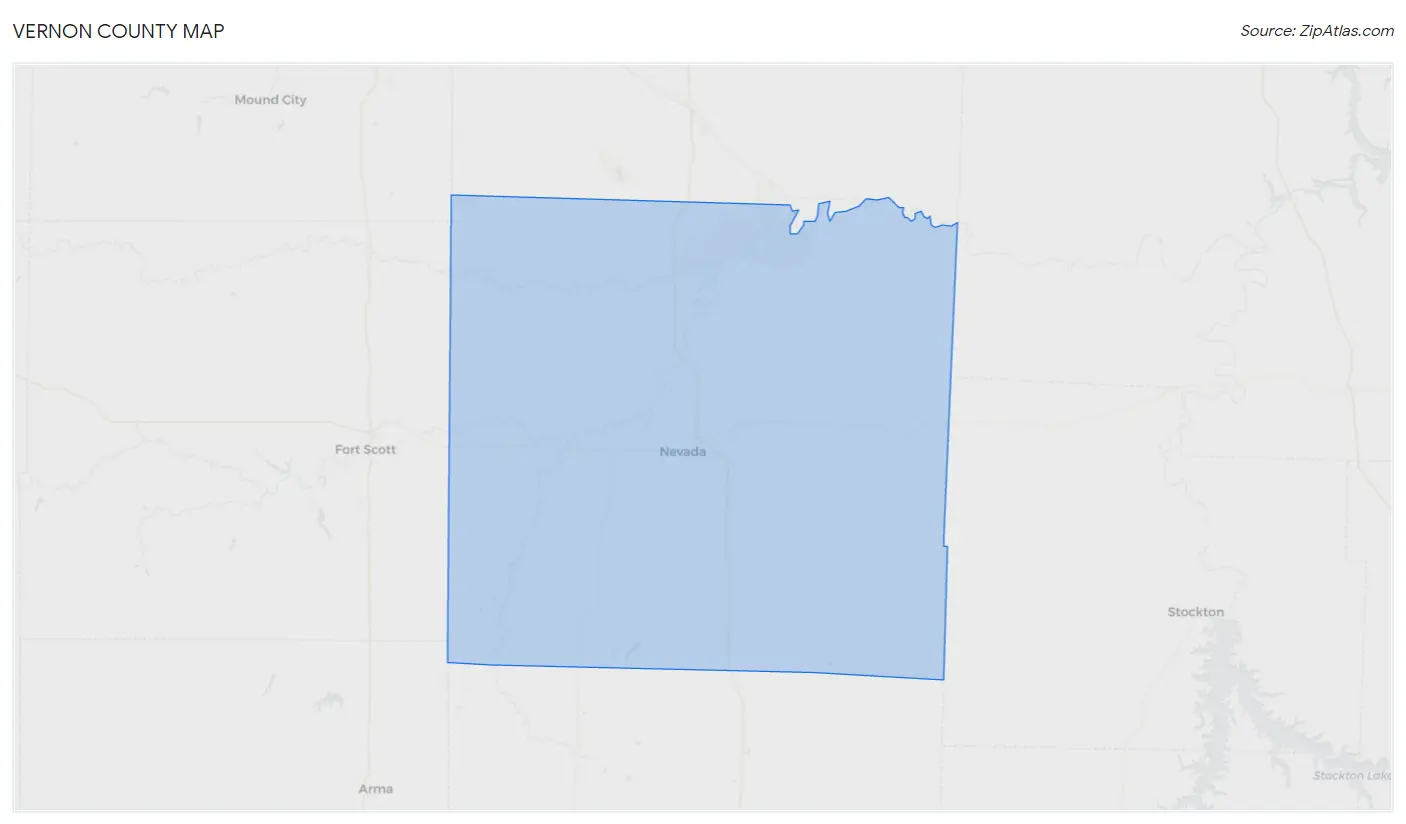
Vernon County Map
Vernon County Overview
$26,515
PER CAPITA INCOME
$68,266
AVG FAMILY INCOME
$53,318
AVG HOUSEHOLD INCOME
9.5%
WAGE / INCOME GAP [ % ]
90.5¢/ $1
WAGE / INCOME GAP [ $ ]
$11,049
FAMILY INCOME DEFICIT
0.41
INEQUALITY / GINI INDEX
19,777
TOTAL POPULATION
9,763
MALE POPULATION
10,014
FEMALE POPULATION
97.49
MALES / 100 FEMALES
102.57
FEMALES / 100 MALES
41.8
MEDIAN AGE
3.1
AVG FAMILY SIZE
2.5
AVG HOUSEHOLD SIZE
8,856
LABOR FORCE [ PEOPLE ]
56.7%
PERCENT IN LABOR FORCE
4.0%
UNEMPLOYMENT RATE
Income in Vernon County
Income Overview in Vernon County
Per Capita Income in Vernon County is $26,515, while median incomes of families and households are $68,266 and $53,318 respectively.
| Characteristic | Number | Measure |
| Per Capita Income | 19,777 | $26,515 |
| Median Family Income | 4,644 | $68,266 |
| Mean Family Income | 4,644 | $83,205 |
| Median Household Income | 7,776 | $53,318 |
| Mean Household Income | 7,776 | $66,607 |
| Income Deficit | 4,644 | $11,049 |
| Wage / Income Gap (%) | 19,777 | 9.53% |
| Wage / Income Gap ($) | 19,777 | 90.47¢ per $1 |
| Gini / Inequality Index | 19,777 | 0.41 |
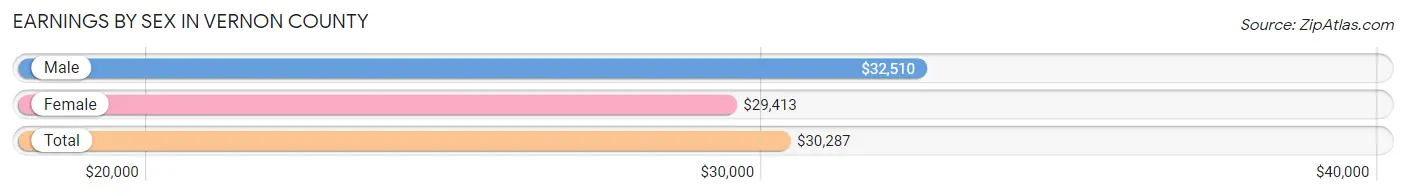
Earnings by Sex in Vernon County
Average Earnings in Vernon County are $30,287, $32,510 for men and $29,413 for women, a difference of 9.5%.
| Sex | Number | Average Earnings |
| Male | 4,963 (51.9%) | $32,510 |
| Female | 4,601 (48.1%) | $29,413 |
| Total | 9,564 (100.0%) | $30,287 |
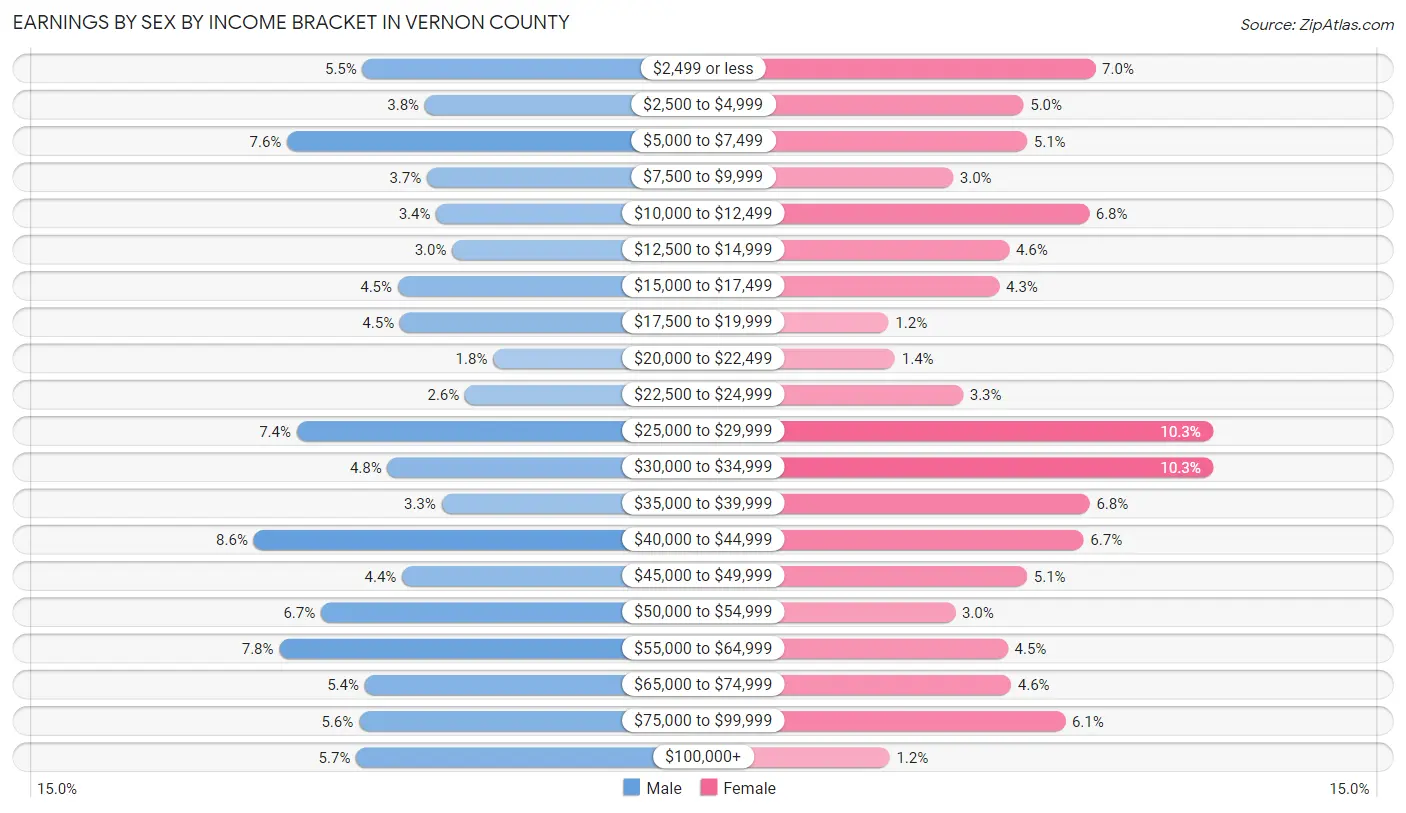
Earnings by Sex by Income Bracket in Vernon County
The most common earnings brackets in Vernon County are $40,000 to $44,999 for men (425 | 8.6%) and $25,000 to $29,999 for women (473 | 10.3%).
| Income | Male | Female |
| $2,499 or less | 273 (5.5%) | 321 (7.0%) |
| $2,500 to $4,999 | 186 (3.7%) | 228 (5.0%) |
| $5,000 to $7,499 | 378 (7.6%) | 233 (5.1%) |
| $7,500 to $9,999 | 183 (3.7%) | 137 (3.0%) |
| $10,000 to $12,499 | 170 (3.4%) | 313 (6.8%) |
| $12,500 to $14,999 | 148 (3.0%) | 210 (4.6%) |
| $15,000 to $17,499 | 224 (4.5%) | 197 (4.3%) |
| $17,500 to $19,999 | 221 (4.4%) | 54 (1.2%) |
| $20,000 to $22,499 | 91 (1.8%) | 62 (1.3%) |
| $22,500 to $24,999 | 130 (2.6%) | 150 (3.3%) |
| $25,000 to $29,999 | 365 (7.3%) | 473 (10.3%) |
| $30,000 to $34,999 | 238 (4.8%) | 473 (10.3%) |
| $35,000 to $39,999 | 163 (3.3%) | 314 (6.8%) |
| $40,000 to $44,999 | 425 (8.6%) | 306 (6.7%) |
| $45,000 to $49,999 | 218 (4.4%) | 233 (5.1%) |
| $50,000 to $54,999 | 331 (6.7%) | 140 (3.0%) |
| $55,000 to $64,999 | 389 (7.8%) | 208 (4.5%) |
| $65,000 to $74,999 | 270 (5.4%) | 212 (4.6%) |
| $75,000 to $99,999 | 278 (5.6%) | 282 (6.1%) |
| $100,000+ | 282 (5.7%) | 55 (1.2%) |
| Total | 4,963 (100.0%) | 4,601 (100.0%) |
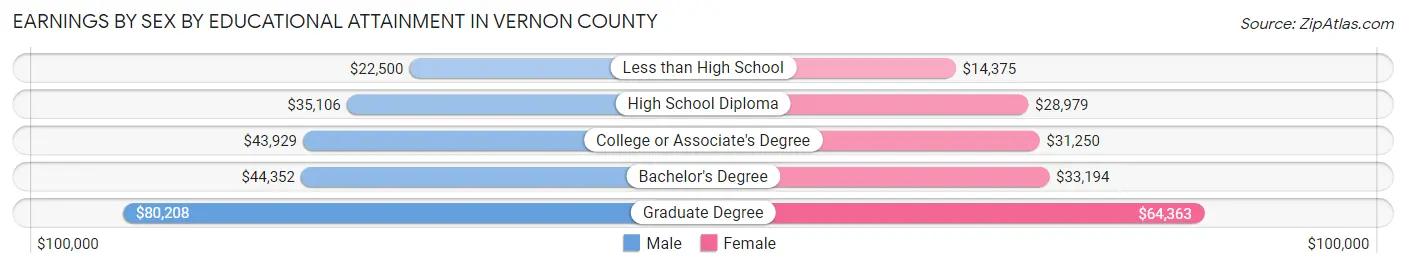
Earnings by Sex by Educational Attainment in Vernon County
Average earnings in Vernon County are $41,526 for men and $32,568 for women, a difference of 21.6%. Men with an educational attainment of graduate degree enjoy the highest average annual earnings of $80,208, while those with less than high school education earn the least with $22,500. Women with an educational attainment of graduate degree earn the most with the average annual earnings of $64,363, while those with less than high school education have the smallest earnings of $14,375.
| Educational Attainment | Male Income | Female Income |
| Less than High School | $22,500 | $14,375 |
| High School Diploma | $35,106 | $28,979 |
| College or Associate's Degree | $43,929 | $31,250 |
| Bachelor's Degree | $44,352 | $33,194 |
| Graduate Degree | $80,208 | $64,363 |
| Total | $41,526 | $32,568 |
Family Income in Vernon County
Family Income Brackets in Vernon County
According to the Vernon County family income data, there are 1,115 families falling into the $50,000 to $74,999 income range, which is the most common income bracket and makes up 24.0% of all families. Conversely, the $10,000 to $14,999 income bracket is the least frequent group with only 37 families (0.8%) belonging to this category.
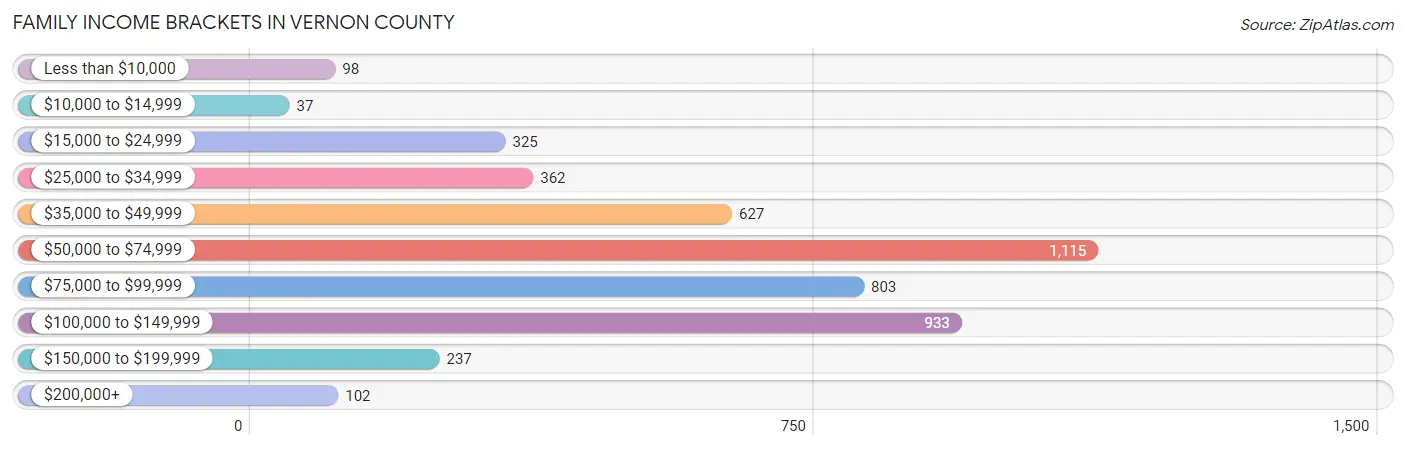
| Income Bracket | # Families | % Families |
| Less than $10,000 | 98 | 2.1% |
| $10,000 to $14,999 | 37 | 0.8% |
| $15,000 to $24,999 | 325 | 7.0% |
| $25,000 to $34,999 | 362 | 7.8% |
| $35,000 to $49,999 | 627 | 13.5% |
| $50,000 to $74,999 | 1,115 | 24.0% |
| $75,000 to $99,999 | 803 | 17.3% |
| $100,000 to $149,999 | 933 | 20.1% |
| $150,000 to $199,999 | 237 | 5.1% |
| $200,000+ | 102 | 2.2% |
Family Income by Famaliy Size in Vernon County
2-person families (2,647 | 57.0%) account for the highest median family income in Vernon County with $71,701 per family, while 2-person families (2,647 | 57.0%) have the highest median income of $35,850 per family member.
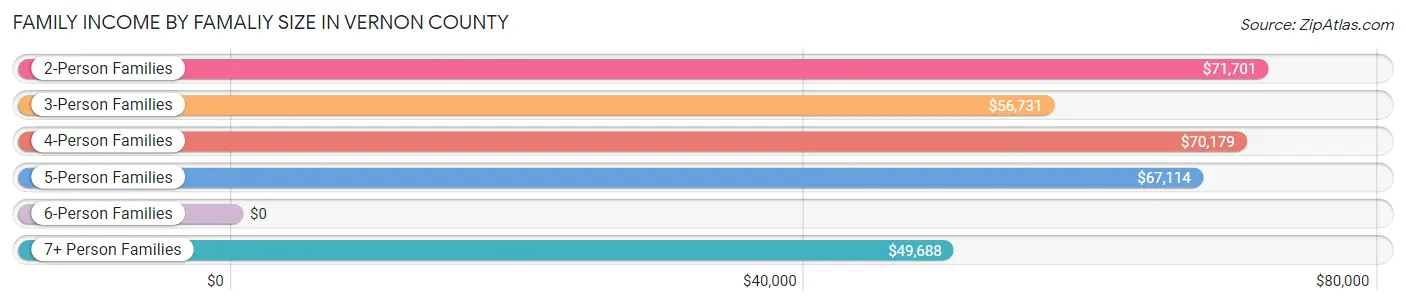
| Income Bracket | # Families | Median Income |
| 2-Person Families | 2,647 (57.0%) | $71,701 |
| 3-Person Families | 668 (14.4%) | $56,731 |
| 4-Person Families | 599 (12.9%) | $70,179 |
| 5-Person Families | 393 (8.5%) | $67,114 |
| 6-Person Families | 184 (4.0%) | $0 |
| 7+ Person Families | 153 (3.3%) | $49,688 |
| Total | 4,644 (100.0%) | $68,266 |
Family Income by Number of Earners in Vernon County
The median family income in Vernon County is $68,266, with families comprising 2 earners (2,013) having the highest median family income of $87,786, while families with no earners (740) have the lowest median family income of $44,615, accounting for 43.3% and 15.9% of families, respectively.
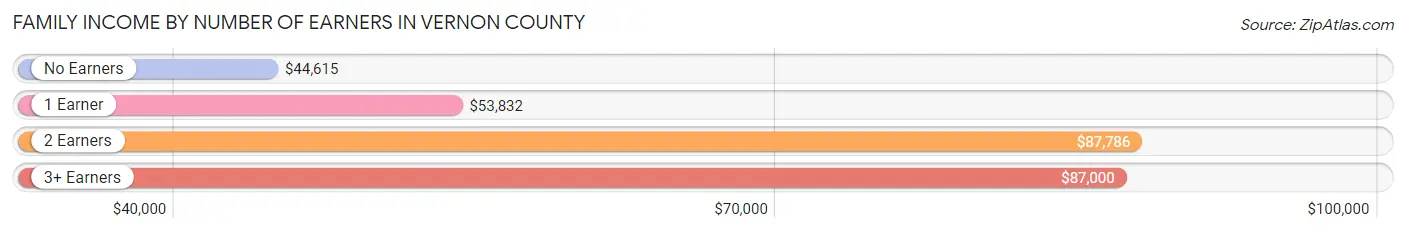
| Number of Earners | # Families | Median Income |
| No Earners | 740 (15.9%) | $44,615 |
| 1 Earner | 1,527 (32.9%) | $53,832 |
| 2 Earners | 2,013 (43.3%) | $87,786 |
| 3+ Earners | 364 (7.8%) | $87,000 |
| Total | 4,644 (100.0%) | $68,266 |
Household Income in Vernon County
Household Income Brackets in Vernon County
With 1,649 households falling in the category, the $50,000 to $74,999 income range is the most frequent in Vernon County, accounting for 21.2% of all households. In contrast, only 109 households (1.4%) fall into the $200,000+ income bracket, making it the least populous group.
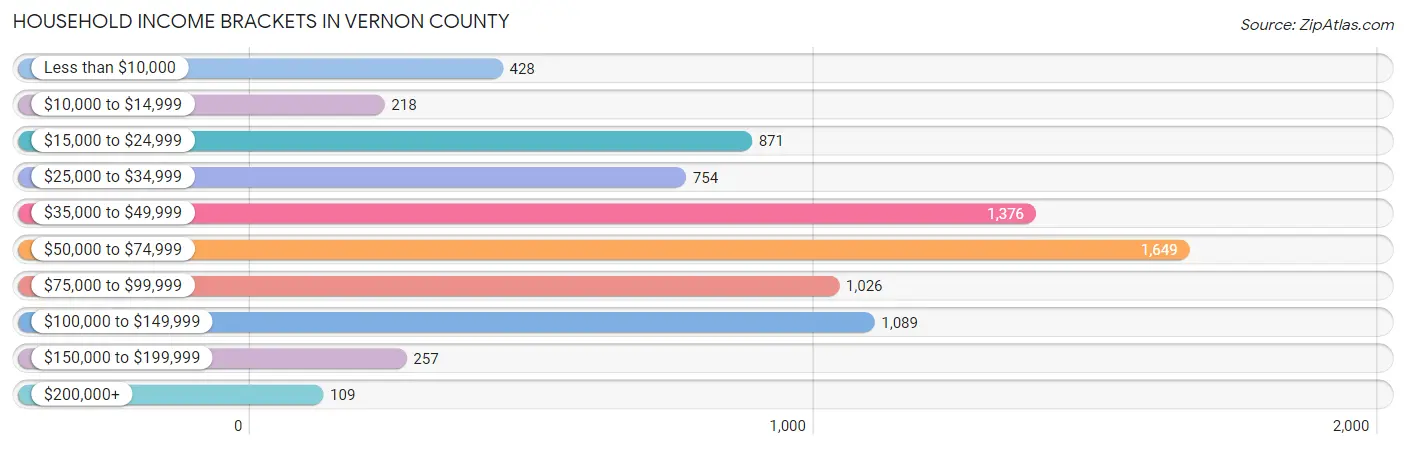
| Income Bracket | # Households | % Households |
| Less than $10,000 | 428 | 5.5% |
| $10,000 to $14,999 | 218 | 2.8% |
| $15,000 to $24,999 | 871 | 11.2% |
| $25,000 to $34,999 | 754 | 9.7% |
| $35,000 to $49,999 | 1,376 | 17.7% |
| $50,000 to $74,999 | 1,649 | 21.2% |
| $75,000 to $99,999 | 1,026 | 13.2% |
| $100,000 to $149,999 | 1,089 | 14.0% |
| $150,000 to $199,999 | 257 | 3.3% |
| $200,000+ | 109 | 1.4% |
Household Income by Householder Age in Vernon County
The median household income in Vernon County is $53,318, with the highest median household income of $62,156 found in the 25 to 44 years age bracket for the primary householder. A total of 2,128 households (27.4%) fall into this category. Meanwhile, the 15 to 24 years age bracket for the primary householder has the lowest median household income of $39,028, with 368 households (4.7%) in this group.
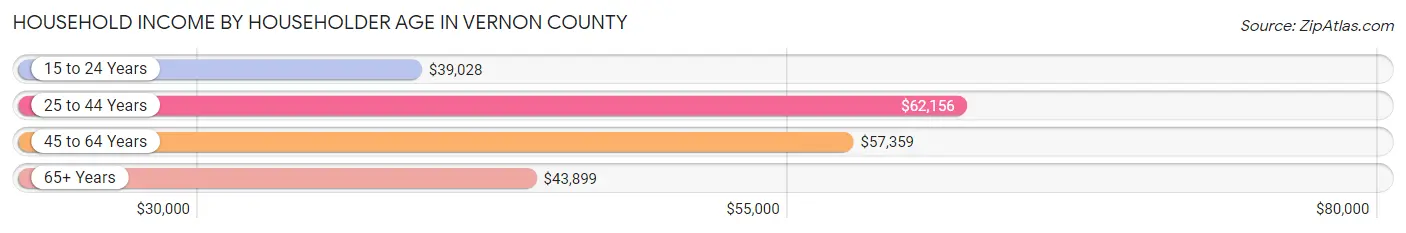
| Income Bracket | # Households | Median Income |
| 15 to 24 Years | 368 (4.7%) | $39,028 |
| 25 to 44 Years | 2,128 (27.4%) | $62,156 |
| 45 to 64 Years | 2,680 (34.5%) | $57,359 |
| 65+ Years | 2,600 (33.4%) | $43,899 |
| Total | 7,776 (100.0%) | $53,318 |
Poverty in Vernon County
Income Below Poverty by Sex and Age in Vernon County
With 17.6% poverty level for males and 18.6% for females among the residents of Vernon County, 15 year old males and 18 to 24 year old females are the most vulnerable to poverty, with 73 males (53.7%) and 263 females (37.8%) in their respective age groups living below the poverty level.
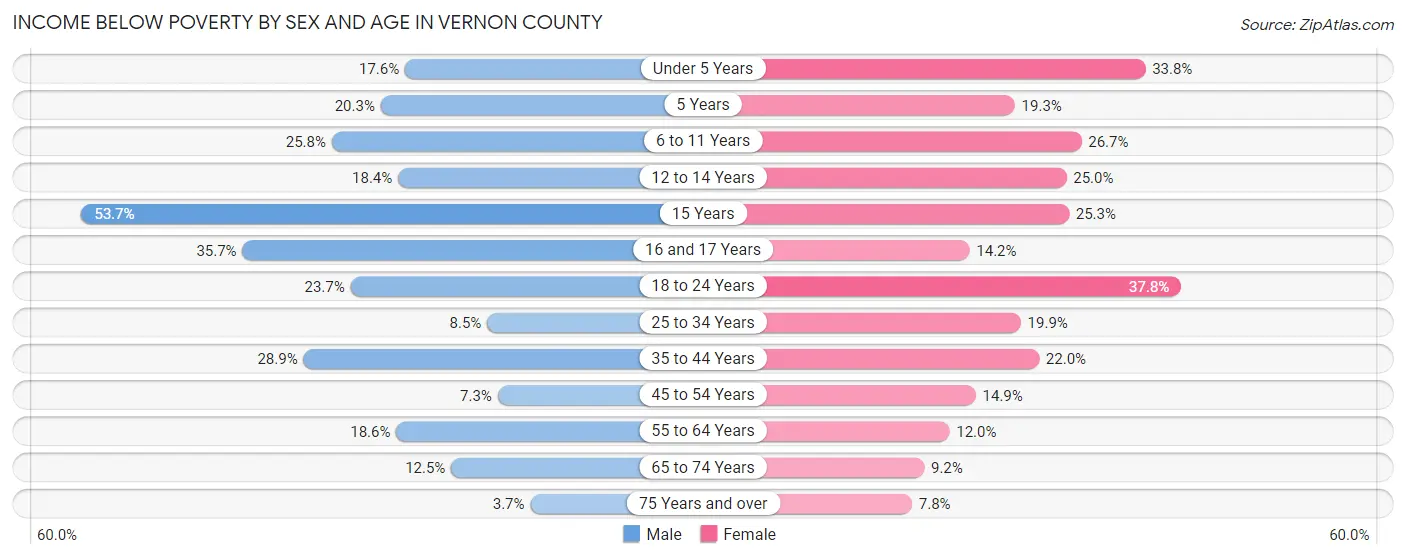
| Age Bracket | Male | Female |
| Under 5 Years | 104 (17.6%) | 172 (33.8%) |
| 5 Years | 12 (20.3%) | 31 (19.3%) |
| 6 to 11 Years | 244 (25.8%) | 180 (26.7%) |
| 12 to 14 Years | 69 (18.4%) | 96 (25.0%) |
| 15 Years | 73 (53.7%) | 45 (25.3%) |
| 16 and 17 Years | 114 (35.7%) | 28 (14.2%) |
| 18 to 24 Years | 187 (23.7%) | 263 (37.8%) |
| 25 to 34 Years | 91 (8.5%) | 212 (19.9%) |
| 35 to 44 Years | 303 (28.9%) | 230 (22.0%) |
| 45 to 54 Years | 85 (7.3%) | 173 (14.9%) |
| 55 to 64 Years | 248 (18.6%) | 165 (12.0%) |
| 65 to 74 Years | 130 (12.5%) | 105 (9.2%) |
| 75 Years and over | 25 (3.7%) | 69 (7.8%) |
| Total | 1,685 (17.6%) | 1,769 (18.6%) |
Income Above Poverty by Sex and Age in Vernon County
According to the poverty statistics in Vernon County, males aged 75 years and over and females aged 75 years and over are the age groups that are most secure financially, with 96.3% of males and 92.2% of females in these age groups living above the poverty line.
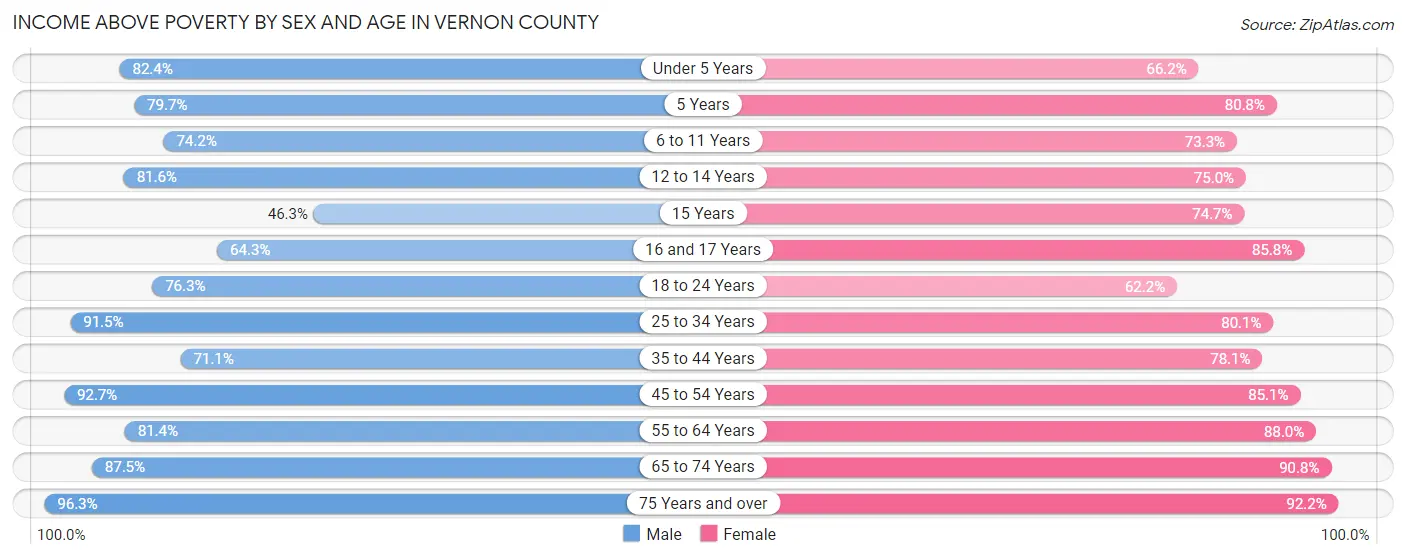
| Age Bracket | Male | Female |
| Under 5 Years | 486 (82.4%) | 337 (66.2%) |
| 5 Years | 47 (79.7%) | 130 (80.7%) |
| 6 to 11 Years | 702 (74.2%) | 495 (73.3%) |
| 12 to 14 Years | 306 (81.6%) | 288 (75.0%) |
| 15 Years | 63 (46.3%) | 133 (74.7%) |
| 16 and 17 Years | 205 (64.3%) | 169 (85.8%) |
| 18 to 24 Years | 602 (76.3%) | 433 (62.2%) |
| 25 to 34 Years | 982 (91.5%) | 852 (80.1%) |
| 35 to 44 Years | 744 (71.1%) | 818 (78.0%) |
| 45 to 54 Years | 1,078 (92.7%) | 988 (85.1%) |
| 55 to 64 Years | 1,085 (81.4%) | 1,214 (88.0%) |
| 65 to 74 Years | 911 (87.5%) | 1,041 (90.8%) |
| 75 Years and over | 657 (96.3%) | 816 (92.2%) |
| Total | 7,868 (82.4%) | 7,714 (81.4%) |
Income Below Poverty Among Married-Couple Families in Vernon County
The poverty statistics for married-couple families in Vernon County show that 6.5% or 237 of the total 3,666 families live below the poverty line. Families with 5 or more children have the highest poverty rate of 54.5%, comprising of 60 families. On the other hand, families with no children have the lowest poverty rate of 3.5%, which includes 83 families.
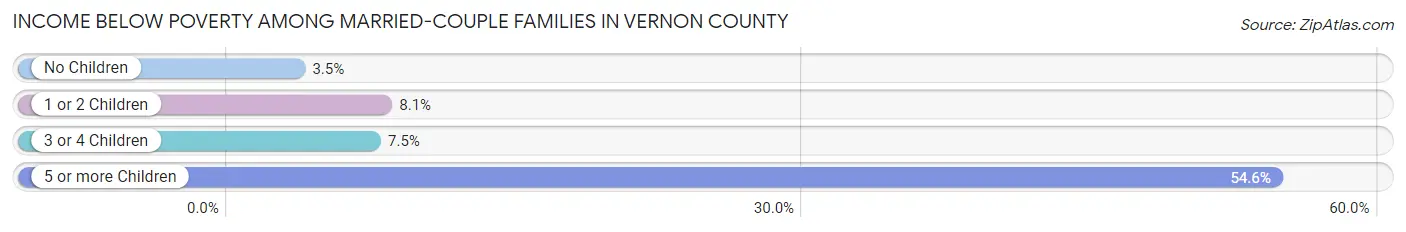
| Children | Above Poverty | Below Poverty |
| No Children | 2,276 (96.5%) | 83 (3.5%) |
| 1 or 2 Children | 719 (91.9%) | 63 (8.1%) |
| 3 or 4 Children | 384 (92.5%) | 31 (7.5%) |
| 5 or more Children | 50 (45.5%) | 60 (54.5%) |
| Total | 3,429 (93.5%) | 237 (6.5%) |
Income Below Poverty Among Single-Parent Households in Vernon County
According to the poverty data in Vernon County, 11.5% or 38 single-father households and 20.1% or 130 single-mother households are living below the poverty line. Among single-father households, those with 3 or 4 children have the highest poverty rate, with 19 households (29.7%) experiencing poverty. Likewise, among single-mother households, those with 5 or more children have the highest poverty rate, with 4 households (100.0%) falling below the poverty line.
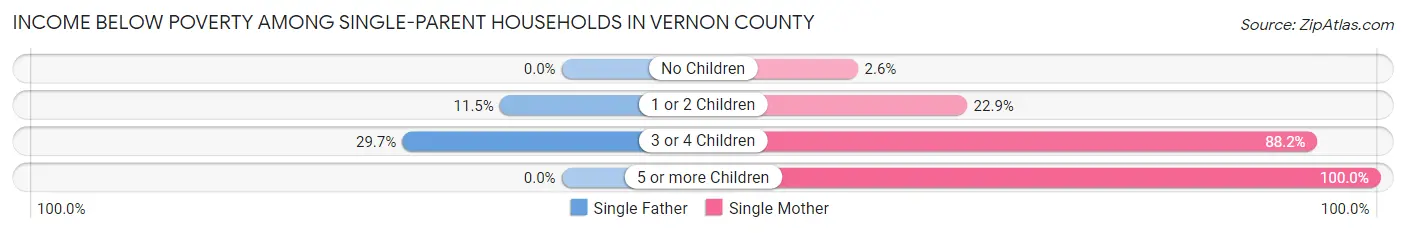
| Children | Single Father | Single Mother |
| No Children | 0 (0.0%) | 7 (2.6%) |
| 1 or 2 Children | 19 (11.5%) | 74 (22.9%) |
| 3 or 4 Children | 19 (29.7%) | 45 (88.2%) |
| 5 or more Children | 0 (0.0%) | 4 (100.0%) |
| Total | 38 (11.5%) | 130 (20.1%) |
Income Below Poverty Among Married-Couple vs Single-Parent Households in Vernon County
The poverty data for Vernon County shows that 237 of the married-couple family households (6.5%) and 168 of the single-parent households (17.2%) are living below the poverty level. Within the married-couple family households, those with 5 or more children have the highest poverty rate, with 60 households (54.5%) falling below the poverty line. Among the single-parent households, those with 3 or 4 children have the highest poverty rate, with 64 household (55.6%) living below poverty.
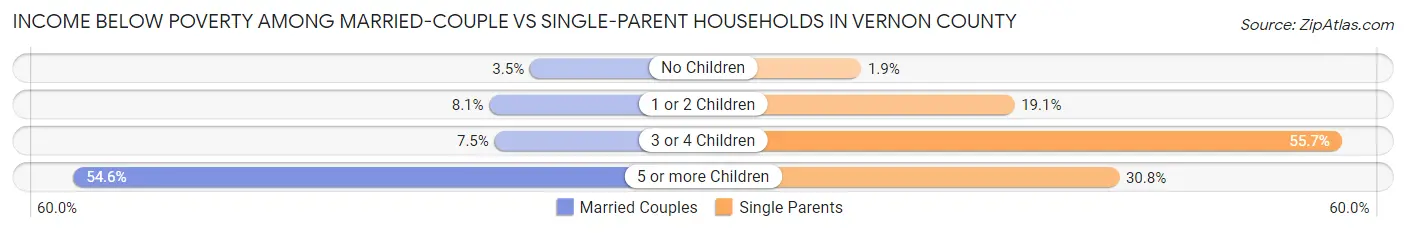
| Children | Married-Couple Families | Single-Parent Households |
| No Children | 83 (3.5%) | 7 (1.9%) |
| 1 or 2 Children | 63 (8.1%) | 93 (19.1%) |
| 3 or 4 Children | 31 (7.5%) | 64 (55.6%) |
| 5 or more Children | 60 (54.5%) | 4 (30.8%) |
| Total | 237 (6.5%) | 168 (17.2%) |
Race in Vernon County
The most populous races in Vernon County are White / Caucasian (18,820 | 95.2%), Two or more Races (642 | 3.3%), and Hispanic or Latino (493 | 2.5%).
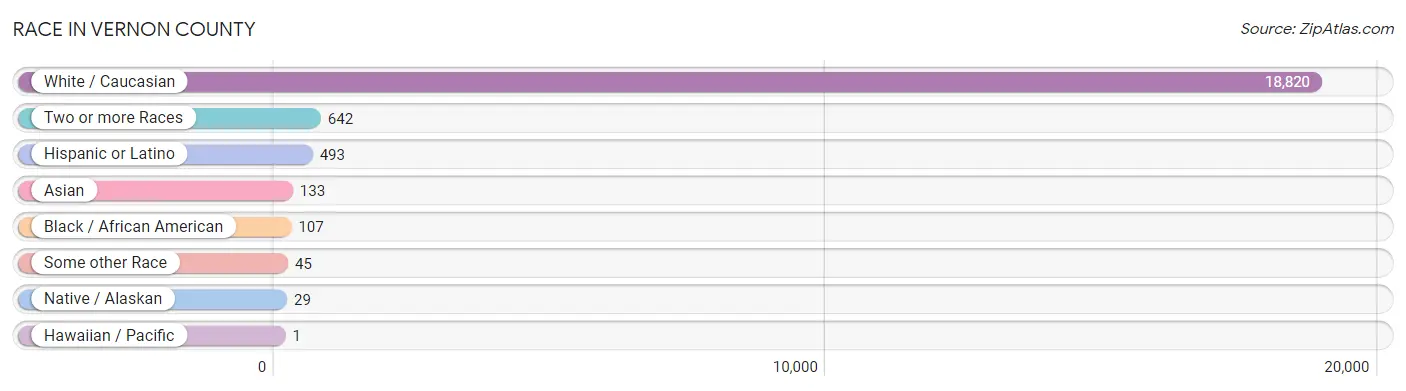
| Race | # Population | % Population |
| Asian | 133 | 0.7% |
| Black / African American | 107 | 0.5% |
| Hawaiian / Pacific | 1 | 0.0% |
| Hispanic or Latino | 493 | 2.5% |
| Native / Alaskan | 29 | 0.2% |
| White / Caucasian | 18,820 | 95.2% |
| Two or more Races | 642 | 3.3% |
| Some other Race | 45 | 0.2% |
| Total | 19,777 | 100.0% |
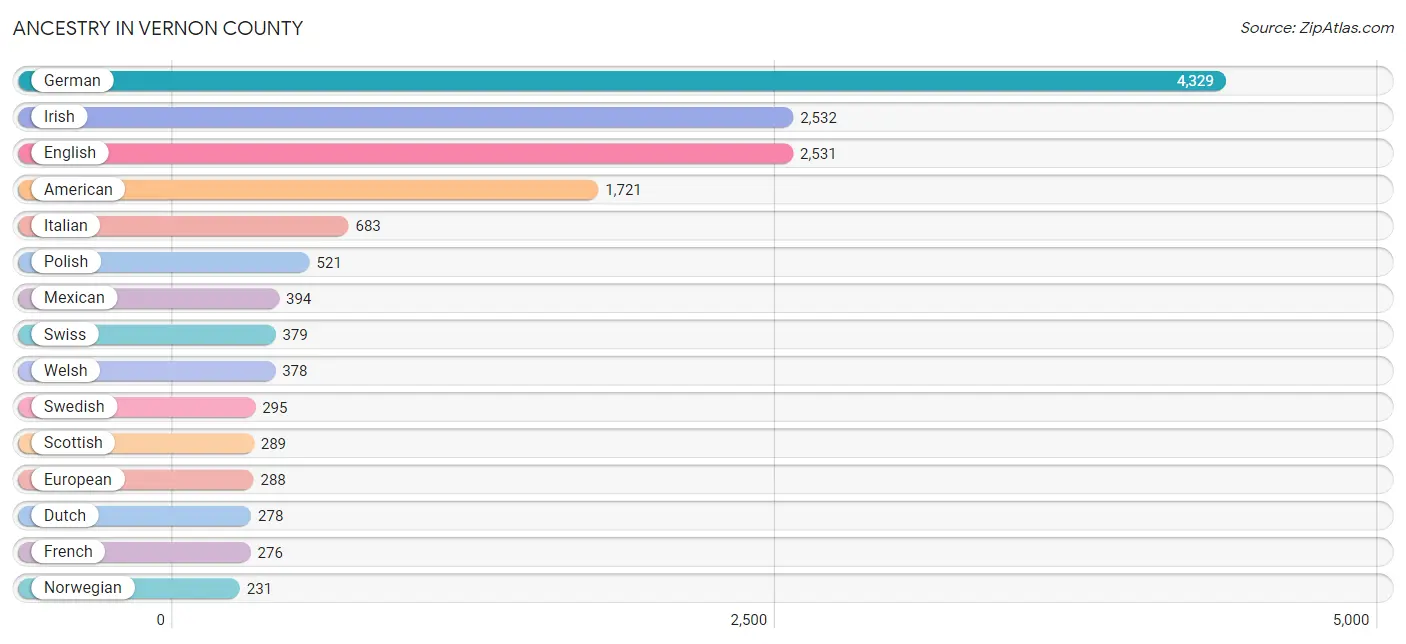
Ancestry in Vernon County
The most populous ancestries reported in Vernon County are German (4,329 | 21.9%), Irish (2,532 | 12.8%), English (2,531 | 12.8%), American (1,721 | 8.7%), and Italian (683 | 3.5%), together accounting for 59.6% of all Vernon County residents.
| Ancestry | # Population | % Population |
| American | 1,721 | 8.7% |
| Apache | 2 | 0.0% |
| Arab | 5 | 0.0% |
| Belgian | 20 | 0.1% |
| Bhutanese | 30 | 0.2% |
| Blackfeet | 23 | 0.1% |
| Brazilian | 31 | 0.2% |
| British | 23 | 0.1% |
| Cambodian | 19 | 0.1% |
| Canadian | 18 | 0.1% |
| Cherokee | 182 | 0.9% |
| Chickasaw | 5 | 0.0% |
| Choctaw | 34 | 0.2% |
| Comanche | 20 | 0.1% |
| Czech | 52 | 0.3% |
| Czechoslovakian | 19 | 0.1% |
| Danish | 36 | 0.2% |
| Dutch | 278 | 1.4% |
| Eastern European | 21 | 0.1% |
| English | 2,531 | 12.8% |
| European | 288 | 1.5% |
| French | 276 | 1.4% |
| French Canadian | 65 | 0.3% |
| German | 4,329 | 21.9% |
| Greek | 43 | 0.2% |
| Guamanian / Chamorro | 4 | 0.0% |
| Hungarian | 49 | 0.3% |
| Indian (Asian) | 12 | 0.1% |
| Irish | 2,532 | 12.8% |
| Italian | 683 | 3.5% |
| Korean | 112 | 0.6% |
| Malaysian | 1 | 0.0% |
| Mexican | 394 | 2.0% |
| Mexican American Indian | 40 | 0.2% |
| New Zealander | 3 | 0.0% |
| Norwegian | 231 | 1.2% |
| Osage | 18 | 0.1% |
| Pennsylvania German | 45 | 0.2% |
| Polish | 521 | 2.6% |
| Portuguese | 33 | 0.2% |
| Potawatomi | 3 | 0.0% |
| Pueblo | 6 | 0.0% |
| Puerto Rican | 34 | 0.2% |
| Russian | 53 | 0.3% |
| Scandinavian | 39 | 0.2% |
| Scotch-Irish | 116 | 0.6% |
| Scottish | 289 | 1.5% |
| Shoshone | 4 | 0.0% |
| Spaniard | 33 | 0.2% |
| Swedish | 295 | 1.5% |
| Swiss | 379 | 1.9% |
| Syrian | 5 | 0.0% |
| Tlingit-Haida | 7 | 0.0% |
| Ukrainian | 7 | 0.0% |
| Welsh | 378 | 1.9% | View All 55 Rows |
Immigrants in Vernon County
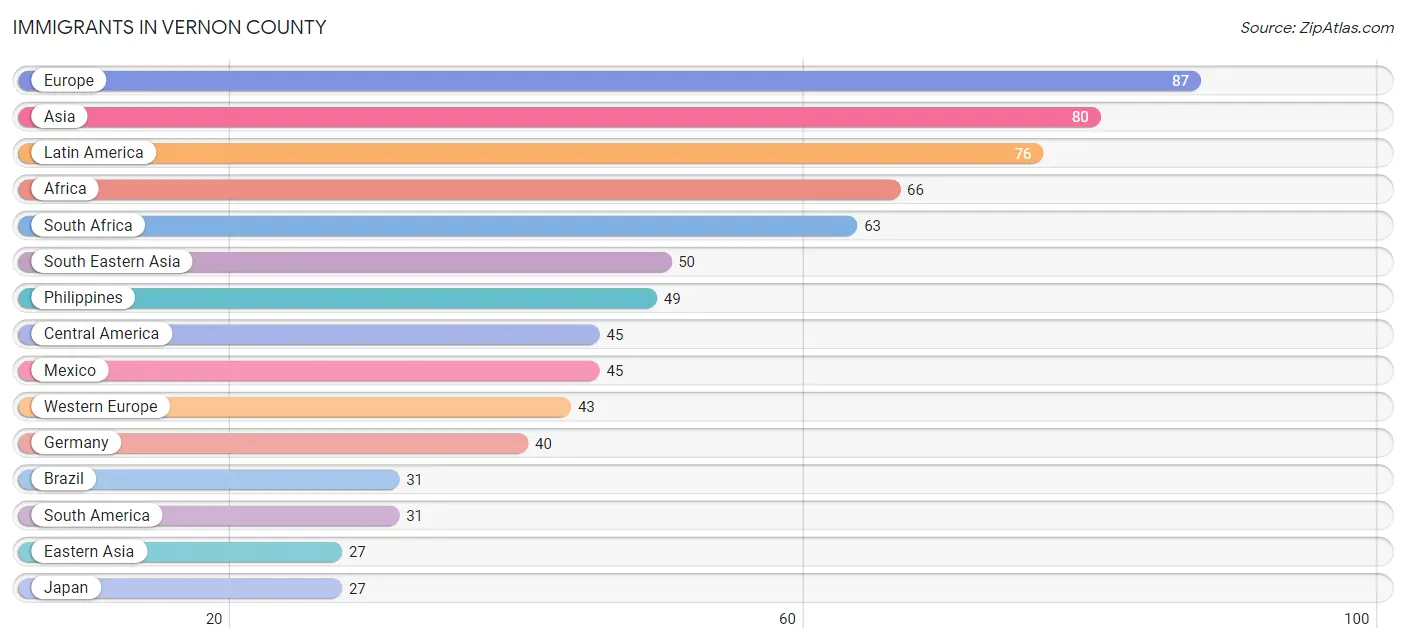
The most numerous immigrant groups reported in Vernon County came from Europe (87 | 0.4%), Asia (80 | 0.4%), Latin America (76 | 0.4%), Africa (66 | 0.3%), and South Africa (63 | 0.3%), together accounting for 1.9% of all Vernon County residents.
| Immigration Origin | # Population | % Population |
| Africa | 66 | 0.3% |
| Asia | 80 | 0.4% |
| Brazil | 31 | 0.2% |
| Canada | 4 | 0.0% |
| Central America | 45 | 0.2% |
| Eastern Africa | 3 | 0.0% |
| Eastern Asia | 27 | 0.1% |
| Eastern Europe | 7 | 0.0% |
| England | 19 | 0.1% |
| Europe | 87 | 0.4% |
| France | 3 | 0.0% |
| Germany | 40 | 0.2% |
| Japan | 27 | 0.1% |
| Laos | 1 | 0.0% |
| Latin America | 76 | 0.4% |
| Mexico | 45 | 0.2% |
| Nepal | 3 | 0.0% |
| Northern Europe | 21 | 0.1% |
| Oceania | 5 | 0.0% |
| Philippines | 49 | 0.3% |
| Poland | 7 | 0.0% |
| South Africa | 63 | 0.3% |
| South America | 31 | 0.2% |
| South Central Asia | 3 | 0.0% |
| South Eastern Asia | 50 | 0.3% |
| Western Europe | 43 | 0.2% |
| Zimbabwe | 3 | 0.0% | View All 27 Rows |
Sex and Age in Vernon County
Sex and Age in Vernon County
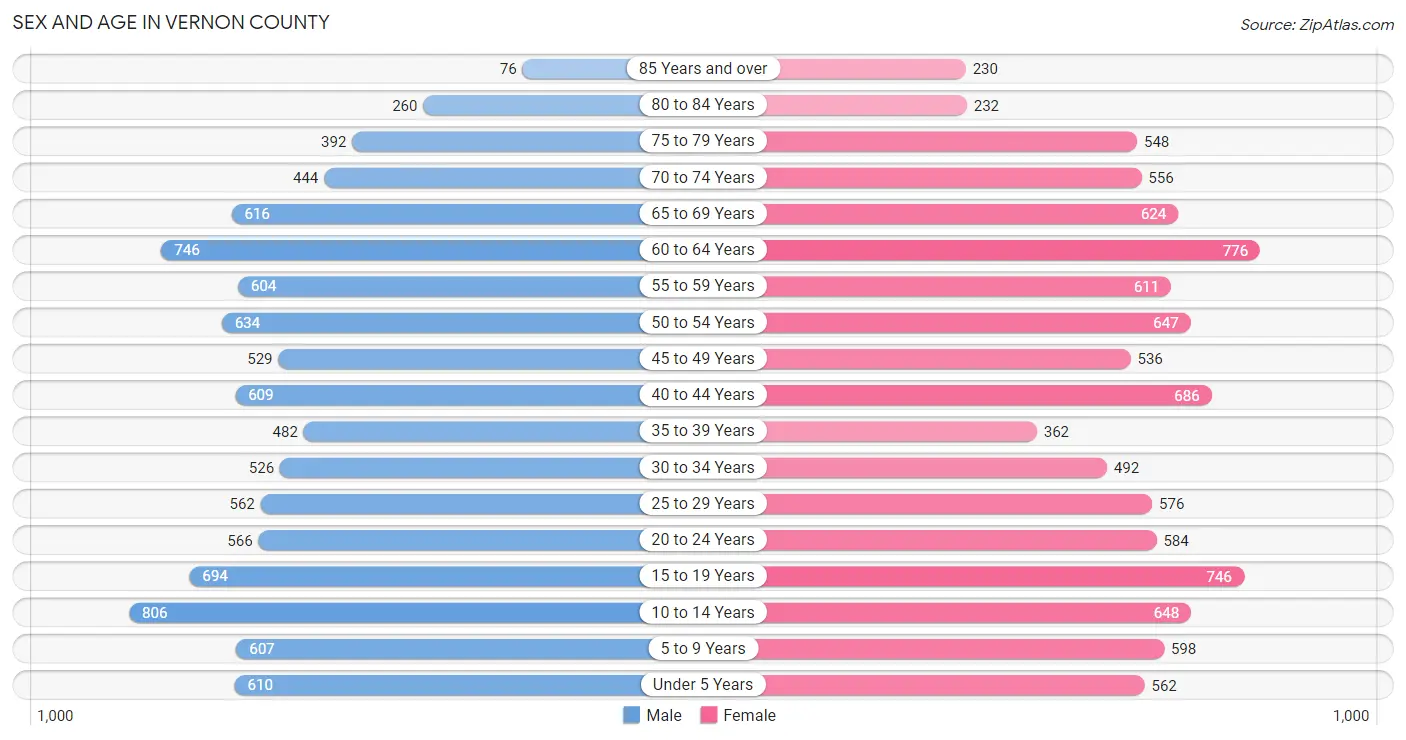
The most populous age groups in Vernon County are 10 to 14 Years (806 | 8.3%) for men and 60 to 64 Years (776 | 7.7%) for women.
| Age Bracket | Male | Female |
| Under 5 Years | 610 (6.2%) | 562 (5.6%) |
| 5 to 9 Years | 607 (6.2%) | 598 (6.0%) |
| 10 to 14 Years | 806 (8.3%) | 648 (6.5%) |
| 15 to 19 Years | 694 (7.1%) | 746 (7.4%) |
| 20 to 24 Years | 566 (5.8%) | 584 (5.8%) |
| 25 to 29 Years | 562 (5.8%) | 576 (5.8%) |
| 30 to 34 Years | 526 (5.4%) | 492 (4.9%) |
| 35 to 39 Years | 482 (4.9%) | 362 (3.6%) |
| 40 to 44 Years | 609 (6.2%) | 686 (6.9%) |
| 45 to 49 Years | 529 (5.4%) | 536 (5.3%) |
| 50 to 54 Years | 634 (6.5%) | 647 (6.5%) |
| 55 to 59 Years | 604 (6.2%) | 611 (6.1%) |
| 60 to 64 Years | 746 (7.6%) | 776 (7.7%) |
| 65 to 69 Years | 616 (6.3%) | 624 (6.2%) |
| 70 to 74 Years | 444 (4.5%) | 556 (5.6%) |
| 75 to 79 Years | 392 (4.0%) | 548 (5.5%) |
| 80 to 84 Years | 260 (2.7%) | 232 (2.3%) |
| 85 Years and over | 76 (0.8%) | 230 (2.3%) |
| Total | 9,763 (100.0%) | 10,014 (100.0%) |
Families and Households in Vernon County
Median Family Size in Vernon County
The median family size in Vernon County is 3.15 persons per family, with single male/father families (330 | 7.1%) accounting for the largest median family size of 3.42 persons per family. On the other hand, married-couple families (3,666 | 78.9%) represent the smallest median family size with 3.12 persons per family.

| Family Type | # Families | Family Size |
| Married-Couple | 3,666 (78.9%) | 3.12 |
| Single Male/Father | 330 (7.1%) | 3.42 |
| Single Female/Mother | 648 (14.0%) | 3.21 |
| Total Families | 4,644 (100.0%) | 3.15 |
Median Household Size in Vernon County
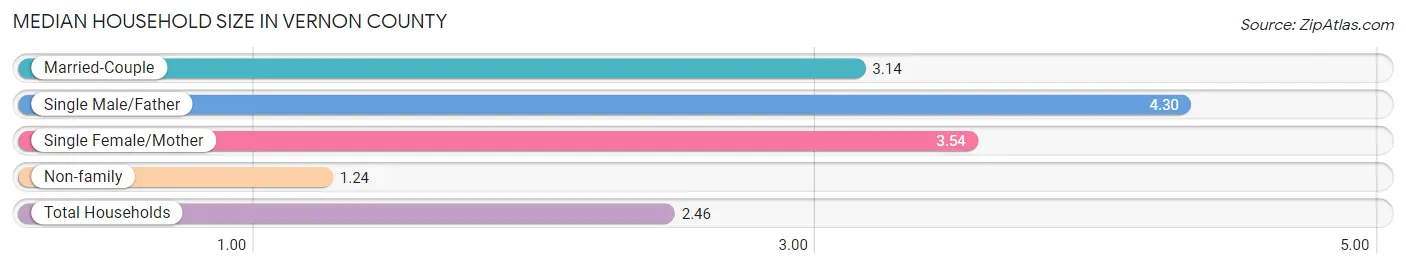
The median household size in Vernon County is 2.46 persons per household, with single male/father households (330 | 4.2%) accounting for the largest median household size of 4.3 persons per household. non-family households (3,132 | 40.3%) represent the smallest median household size with 1.24 persons per household.
| Household Type | # Households | Household Size |
| Married-Couple | 3,666 (47.1%) | 3.14 |
| Single Male/Father | 330 (4.2%) | 4.30 |
| Single Female/Mother | 648 (8.3%) | 3.54 |
| Non-family | 3,132 (40.3%) | 1.24 |
| Total Households | 7,776 (100.0%) | 2.46 |
Household Size by Marriage Status in Vernon County
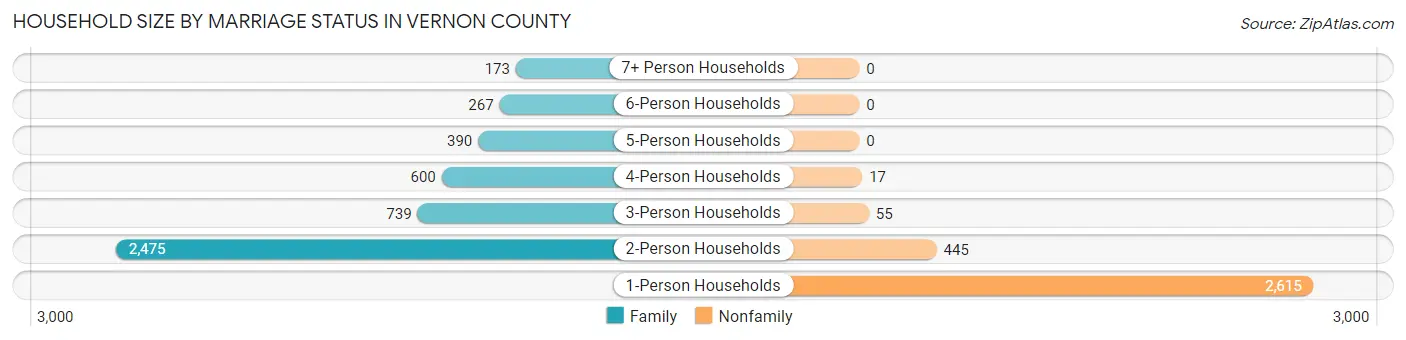
Out of a total of 7,776 households in Vernon County, 4,644 (59.7%) are family households, while 3,132 (40.3%) are nonfamily households. The most numerous type of family households are 2-person households, comprising 2,475, and the most common type of nonfamily households are 1-person households, comprising 2,615.
| Household Size | Family Households | Nonfamily Households |
| 1-Person Households | - | 2,615 (33.6%) |
| 2-Person Households | 2,475 (31.8%) | 445 (5.7%) |
| 3-Person Households | 739 (9.5%) | 55 (0.7%) |
| 4-Person Households | 600 (7.7%) | 17 (0.2%) |
| 5-Person Households | 390 (5.0%) | 0 (0.0%) |
| 6-Person Households | 267 (3.4%) | 0 (0.0%) |
| 7+ Person Households | 173 (2.2%) | 0 (0.0%) |
| Total | 4,644 (59.7%) | 3,132 (40.3%) |
Female Fertility in Vernon County
Fertility by Age in Vernon County
Average fertility rate in Vernon County is 72.0 births per 1,000 women. Women in the age bracket of 20 to 34 years have the highest fertility rate with 159.0 births per 1,000 women. Women in the age bracket of 20 to 34 years acount for 89.1% of all women with births.
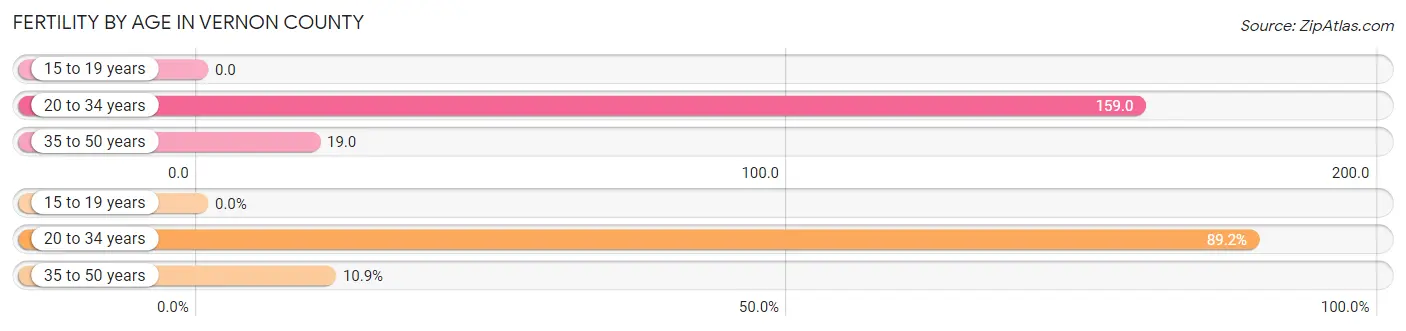
| Age Bracket | Women with Births | Births / 1,000 Women |
| 15 to 19 years | 0 (0.0%) | 0.0 |
| 20 to 34 years | 263 (89.1%) | 159.0 |
| 35 to 50 years | 32 (10.8%) | 19.0 |
| Total | 295 (100.0%) | 72.0 |
Fertility by Age by Marriage Status in Vernon County
69.8% of women with births (295) in Vernon County are married. The highest percentage of unmarried women with births falls into 20 to 34 years age bracket with 33.8% of them unmarried at the time of birth, while the lowest percentage of unmarried women with births belong to 35 to 50 years age bracket with 0.0% of them unmarried.
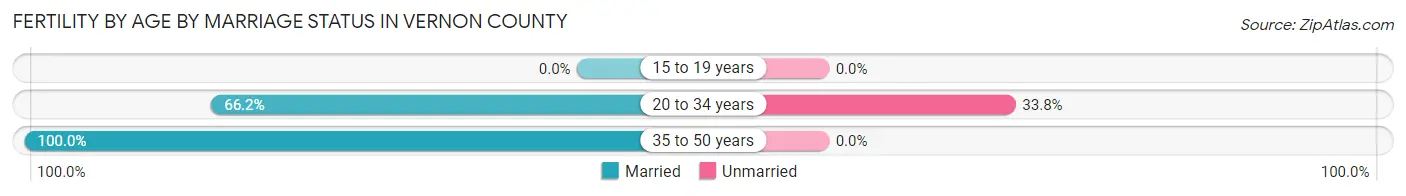
| Age Bracket | Married | Unmarried |
| 15 to 19 years | 0 (0.0%) | 0 (0.0%) |
| 20 to 34 years | 174 (66.2%) | 89 (33.8%) |
| 35 to 50 years | 32 (100.0%) | 0 (0.0%) |
| Total | 206 (69.8%) | 89 (30.2%) |
Fertility by Education in Vernon County
Average fertility rate in Vernon County is 72.0 births per 1,000 women. Women with the education attainment of bachelor's degree have the highest fertility rate of 113.0 births per 1,000 women, while women with the education attainment of graduate degree have the lowest fertility at 18.0 births per 1,000 women. Women with the education attainment of college or associate's degree represent 42.4% of all women with births.
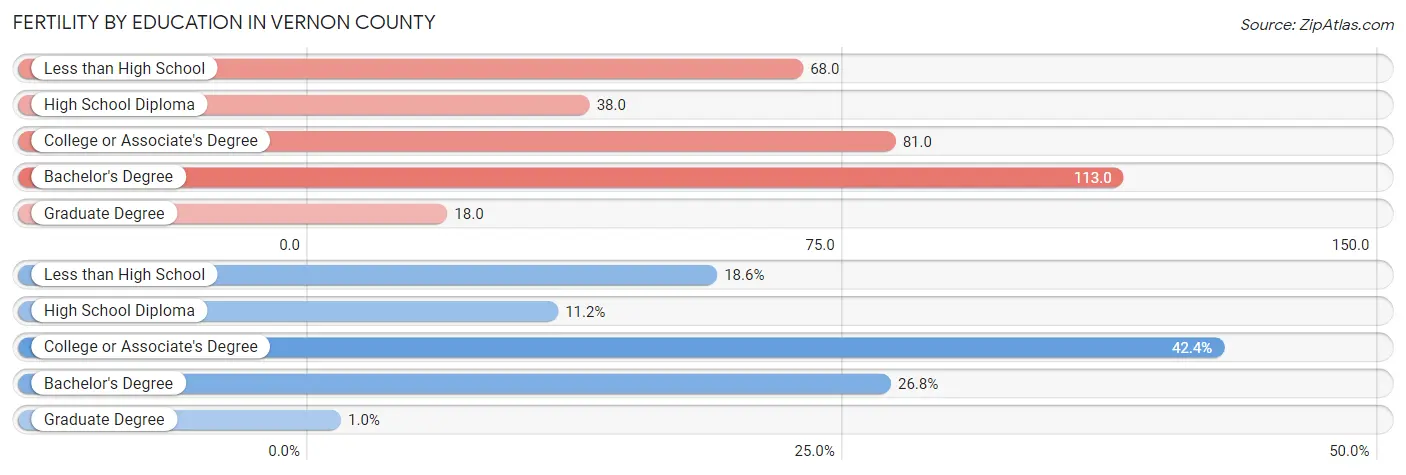
| Educational Attainment | Women with Births | Births / 1,000 Women |
| Less than High School | 55 (18.6%) | 68.0 |
| High School Diploma | 33 (11.2%) | 38.0 |
| College or Associate's Degree | 125 (42.4%) | 81.0 |
| Bachelor's Degree | 79 (26.8%) | 113.0 |
| Graduate Degree | 3 (1.0%) | 18.0 |
| Total | 295 (100.0%) | 72.0 |
Fertility by Education by Marriage Status in Vernon County
30.2% of women with births in Vernon County are unmarried. Women with the educational attainment of less than high school are most likely to be married with 100.0% of them married at childbirth, while women with the educational attainment of high school diploma are least likely to be married with 100.0% of them unmarried at childbirth.
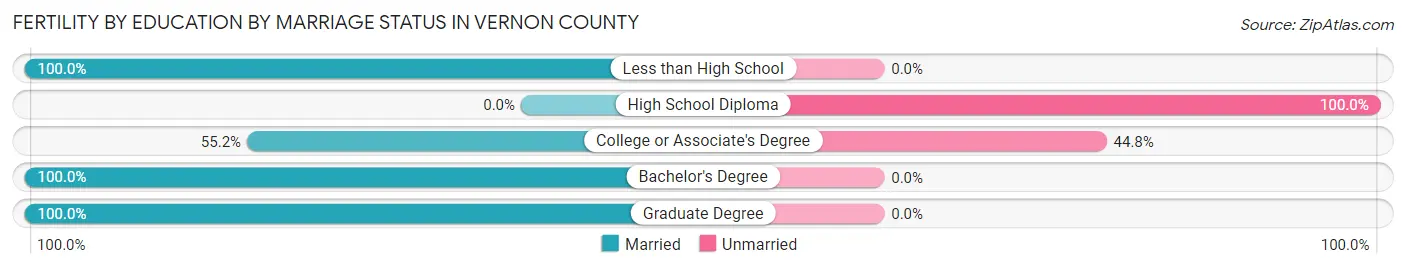
| Educational Attainment | Married | Unmarried |
| Less than High School | 55 (100.0%) | 0 (0.0%) |
| High School Diploma | 0 (0.0%) | 33 (100.0%) |
| College or Associate's Degree | 69 (55.2%) | 56 (44.8%) |
| Bachelor's Degree | 79 (100.0%) | 0 (0.0%) |
| Graduate Degree | 3 (100.0%) | 0 (0.0%) |
| Total | 206 (69.8%) | 89 (30.2%) |
Employment Characteristics in Vernon County
Employment by Class of Employer in Vernon County
Among the 8,229 employed individuals in Vernon County, private company employees (4,650 | 56.5%), not-for-profit organizations (1,015 | 12.3%), and self-employed (not incorporated) (946 | 11.5%) make up the most common classes of employment.
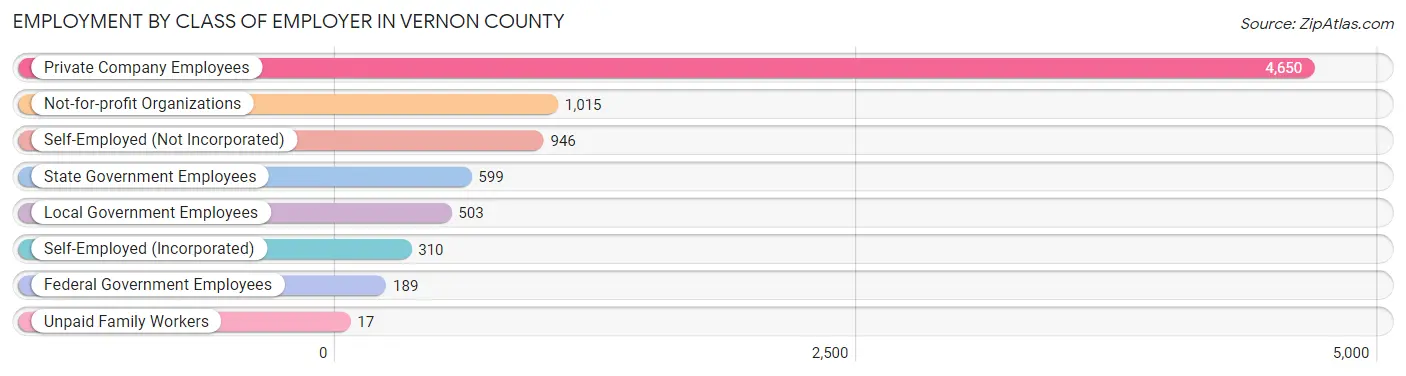
| Employer Class | # Employees | % Employees |
| Private Company Employees | 4,650 | 56.5% |
| Self-Employed (Incorporated) | 310 | 3.8% |
| Self-Employed (Not Incorporated) | 946 | 11.5% |
| Not-for-profit Organizations | 1,015 | 12.3% |
| Local Government Employees | 503 | 6.1% |
| State Government Employees | 599 | 7.3% |
| Federal Government Employees | 189 | 2.3% |
| Unpaid Family Workers | 17 | 0.2% |
| Total | 8,229 | 100.0% |
Employment Status by Age in Vernon County
According to the labor force statistics for Vernon County, out of the total population over 16 years of age (15,619), 56.7% or 8,856 individuals are in the labor force, with 4.0% or 354 of them unemployed. The age group with the highest labor force participation rate is 35 to 44 years, with 80.1% or 1,713 individuals in the labor force. Within the labor force, the 16 to 19 years age range has the highest percentage of unemployed individuals, with 24.0% or 120 of them being unemployed.
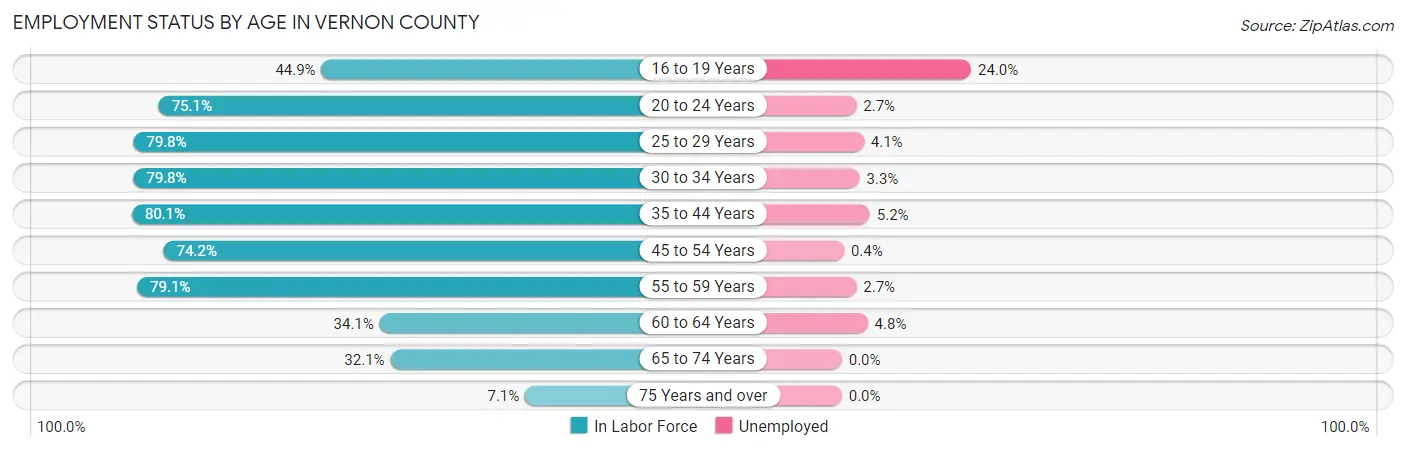
| Age Bracket | In Labor Force | Unemployed |
| 16 to 19 Years | 500 (44.9%) | 120 (24.0%) |
| 20 to 24 Years | 864 (75.1%) | 23 (2.7%) |
| 25 to 29 Years | 908 (79.8%) | 37 (4.1%) |
| 30 to 34 Years | 812 (79.8%) | 27 (3.3%) |
| 35 to 44 Years | 1,713 (80.1%) | 89 (5.2%) |
| 45 to 54 Years | 1,741 (74.2%) | 7 (0.4%) |
| 55 to 59 Years | 961 (79.1%) | 26 (2.7%) |
| 60 to 64 Years | 519 (34.1%) | 25 (4.8%) |
| 65 to 74 Years | 719 (32.1%) | 0 (0.0%) |
| 75 Years and over | 123 (7.1%) | 0 (0.0%) |
| Total | 8,856 (56.7%) | 354 (4.0%) |
Employment Status by Educational Attainment in Vernon County
According to labor force statistics for Vernon County, 71.0% of individuals (6,658) out of the total population between 25 and 64 years of age (9,378) are in the labor force, with 3.2% or 213 of them being unemployed. The group with the highest labor force participation rate are those with the educational attainment of bachelor's degree or higher, with 87.9% or 1,537 individuals in the labor force. Within the labor force, individuals with college / associate degree education have the highest percentage of unemployment, with 4.5% or 99 of them being unemployed.
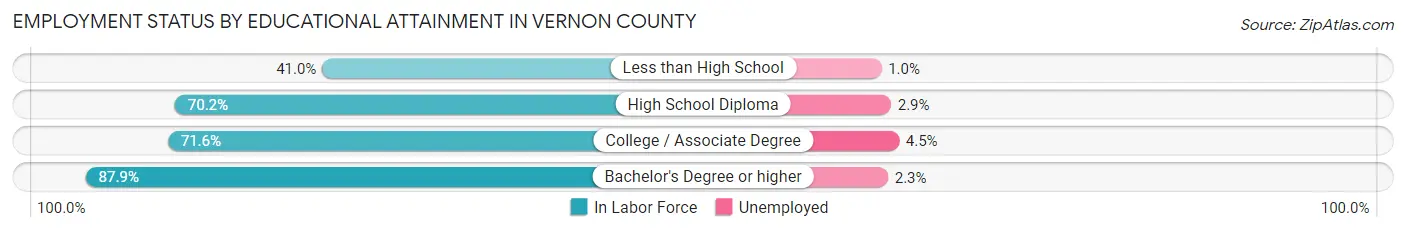
| Educational Attainment | In Labor Force | Unemployed |
| Less than High School | 396 (41.0%) | 10 (1.0%) |
| High School Diploma | 2,517 (70.2%) | 104 (2.9%) |
| College / Associate Degree | 2,204 (71.6%) | 139 (4.5%) |
| Bachelor's Degree or higher | 1,537 (87.9%) | 40 (2.3%) |
| Total | 6,658 (71.0%) | 300 (3.2%) |
Employment Occupations by Sex in Vernon County
Management, Business, Science and Arts Occupations
The most common Management, Business, Science and Arts occupations in Vernon County are Management (1,061 | 12.5%), Community & Social Service (909 | 10.7%), Health Diagnosing & Treating (658 | 7.7%), Education Instruction & Library (590 | 7.0%), and Business & Financial (346 | 4.1%).
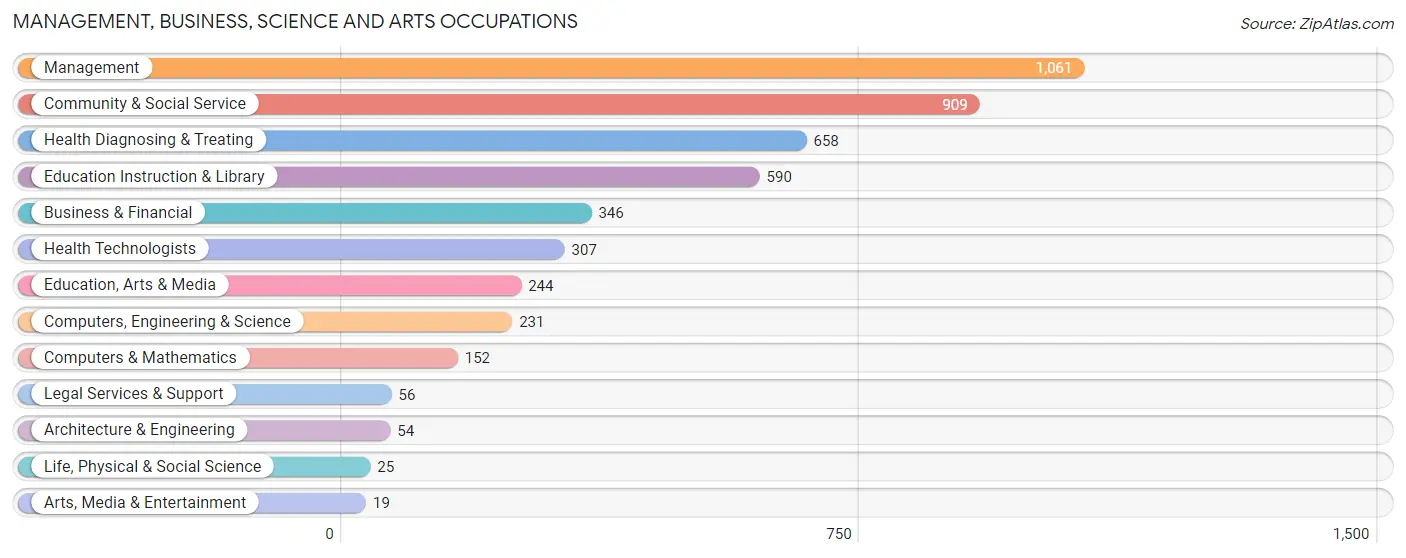
Management, Business, Science and Arts Occupations by Sex
Within the Management, Business, Science and Arts occupations in Vernon County, the most male-oriented occupations are Computers & Mathematics (100.0%), Computers, Engineering & Science (83.6%), and Management (70.6%), while the most female-oriented occupations are Health Technologists (87.0%), Education, Arts & Media (84.0%), and Community & Social Service (77.6%).
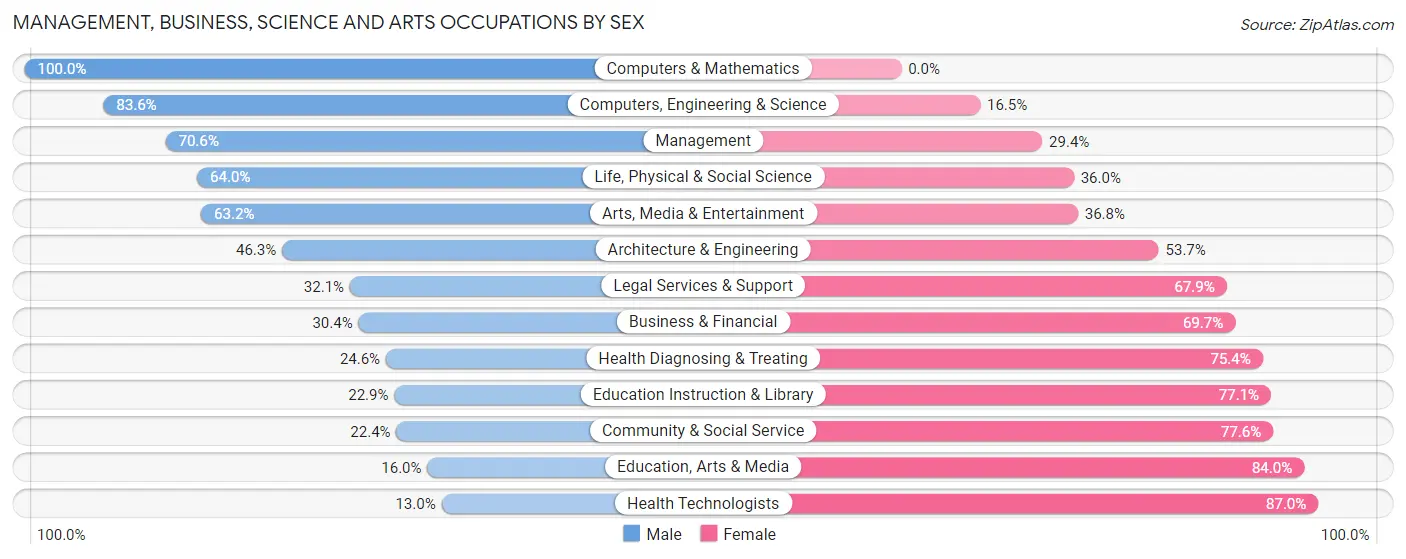
| Occupation | Male | Female |
| Management | 749 (70.6%) | 312 (29.4%) |
| Business & Financial | 105 (30.3%) | 241 (69.7%) |
| Computers, Engineering & Science | 193 (83.6%) | 38 (16.5%) |
| Computers & Mathematics | 152 (100.0%) | 0 (0.0%) |
| Architecture & Engineering | 25 (46.3%) | 29 (53.7%) |
| Life, Physical & Social Science | 16 (64.0%) | 9 (36.0%) |
| Community & Social Service | 204 (22.4%) | 705 (77.6%) |
| Education, Arts & Media | 39 (16.0%) | 205 (84.0%) |
| Legal Services & Support | 18 (32.1%) | 38 (67.9%) |
| Education Instruction & Library | 135 (22.9%) | 455 (77.1%) |
| Arts, Media & Entertainment | 12 (63.2%) | 7 (36.8%) |
| Health Diagnosing & Treating | 162 (24.6%) | 496 (75.4%) |
| Health Technologists | 40 (13.0%) | 267 (87.0%) |
| Total (Category) | 1,413 (44.1%) | 1,792 (55.9%) |
| Total (Overall) | 4,451 (52.4%) | 4,041 (47.6%) |
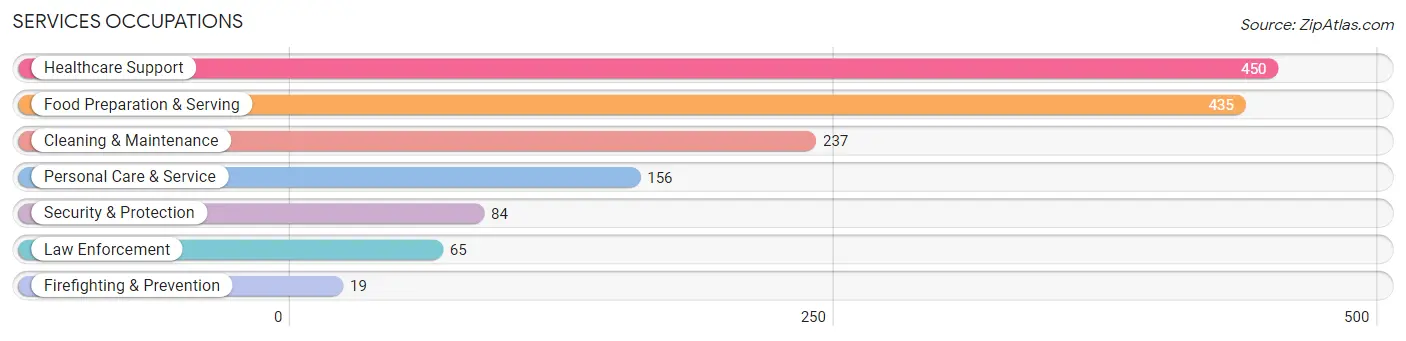
Services Occupations
The most common Services occupations in Vernon County are Healthcare Support (450 | 5.3%), Food Preparation & Serving (435 | 5.1%), Cleaning & Maintenance (237 | 2.8%), Personal Care & Service (156 | 1.8%), and Security & Protection (84 | 1.0%).
Services Occupations by Sex
Within the Services occupations in Vernon County, the most male-oriented occupations are Security & Protection (100.0%), Firefighting & Prevention (100.0%), and Law Enforcement (100.0%), while the most female-oriented occupations are Personal Care & Service (94.9%), Healthcare Support (85.3%), and Food Preparation & Serving (44.4%).
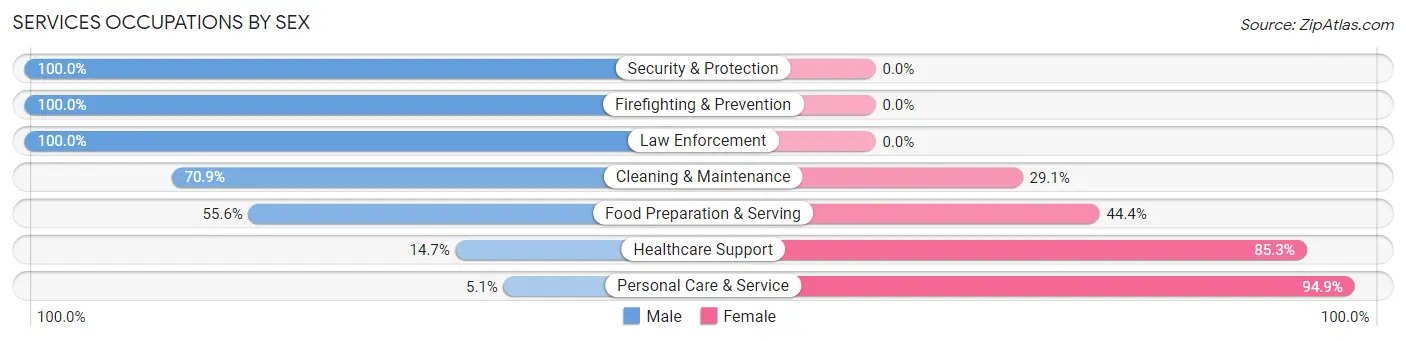
| Occupation | Male | Female |
| Healthcare Support | 66 (14.7%) | 384 (85.3%) |
| Security & Protection | 84 (100.0%) | 0 (0.0%) |
| Firefighting & Prevention | 19 (100.0%) | 0 (0.0%) |
| Law Enforcement | 65 (100.0%) | 0 (0.0%) |
| Food Preparation & Serving | 242 (55.6%) | 193 (44.4%) |
| Cleaning & Maintenance | 168 (70.9%) | 69 (29.1%) |
| Personal Care & Service | 8 (5.1%) | 148 (94.9%) |
| Total (Category) | 568 (41.7%) | 794 (58.3%) |
| Total (Overall) | 4,451 (52.4%) | 4,041 (47.6%) |
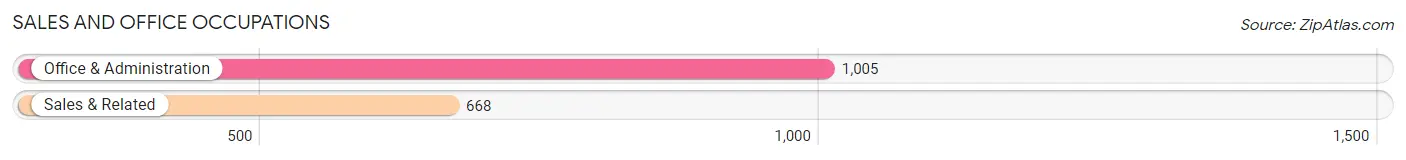
Sales and Office Occupations
The most common Sales and Office occupations in Vernon County are Office & Administration (1,005 | 11.8%), and Sales & Related (668 | 7.9%).
Sales and Office Occupations by Sex

| Occupation | Male | Female |
| Sales & Related | 341 (51.0%) | 327 (48.9%) |
| Office & Administration | 114 (11.3%) | 891 (88.7%) |
| Total (Category) | 455 (27.2%) | 1,218 (72.8%) |
| Total (Overall) | 4,451 (52.4%) | 4,041 (47.6%) |
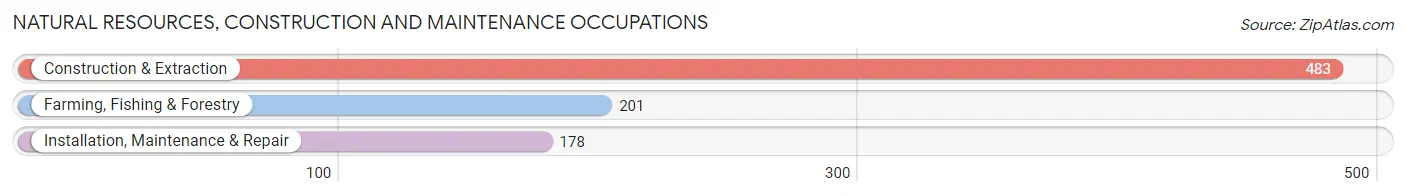
Natural Resources, Construction and Maintenance Occupations
The most common Natural Resources, Construction and Maintenance occupations in Vernon County are Construction & Extraction (483 | 5.7%), Farming, Fishing & Forestry (201 | 2.4%), and Installation, Maintenance & Repair (178 | 2.1%).
Natural Resources, Construction and Maintenance Occupations by Sex
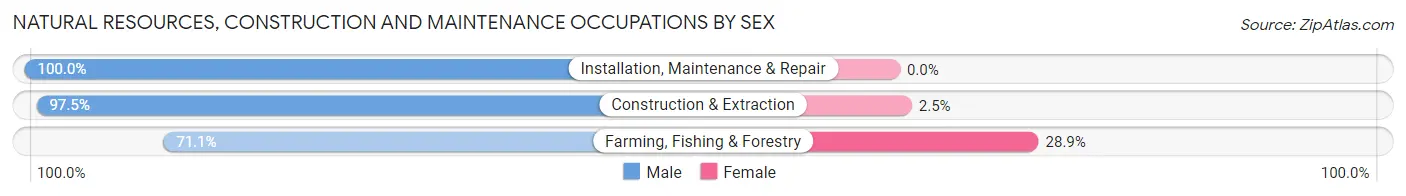
| Occupation | Male | Female |
| Farming, Fishing & Forestry | 143 (71.1%) | 58 (28.9%) |
| Construction & Extraction | 471 (97.5%) | 12 (2.5%) |
| Installation, Maintenance & Repair | 178 (100.0%) | 0 (0.0%) |
| Total (Category) | 792 (91.9%) | 70 (8.1%) |
| Total (Overall) | 4,451 (52.4%) | 4,041 (47.6%) |
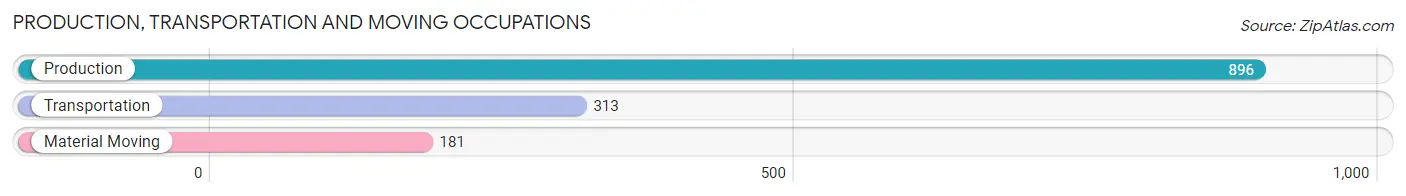
Production, Transportation and Moving Occupations
The most common Production, Transportation and Moving occupations in Vernon County are Production (896 | 10.5%), Transportation (313 | 3.7%), and Material Moving (181 | 2.1%).
Production, Transportation and Moving Occupations by Sex
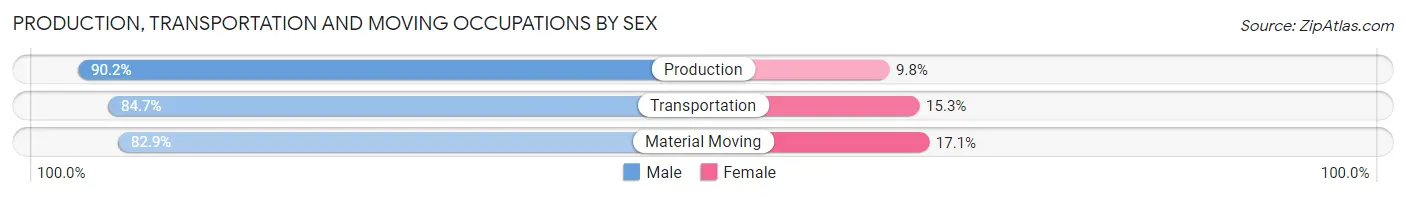
| Occupation | Male | Female |
| Production | 808 (90.2%) | 88 (9.8%) |
| Transportation | 265 (84.7%) | 48 (15.3%) |
| Material Moving | 150 (82.9%) | 31 (17.1%) |
| Total (Category) | 1,223 (88.0%) | 167 (12.0%) |
| Total (Overall) | 4,451 (52.4%) | 4,041 (47.6%) |
Employment Industries by Sex in Vernon County
Employment Industries in Vernon County
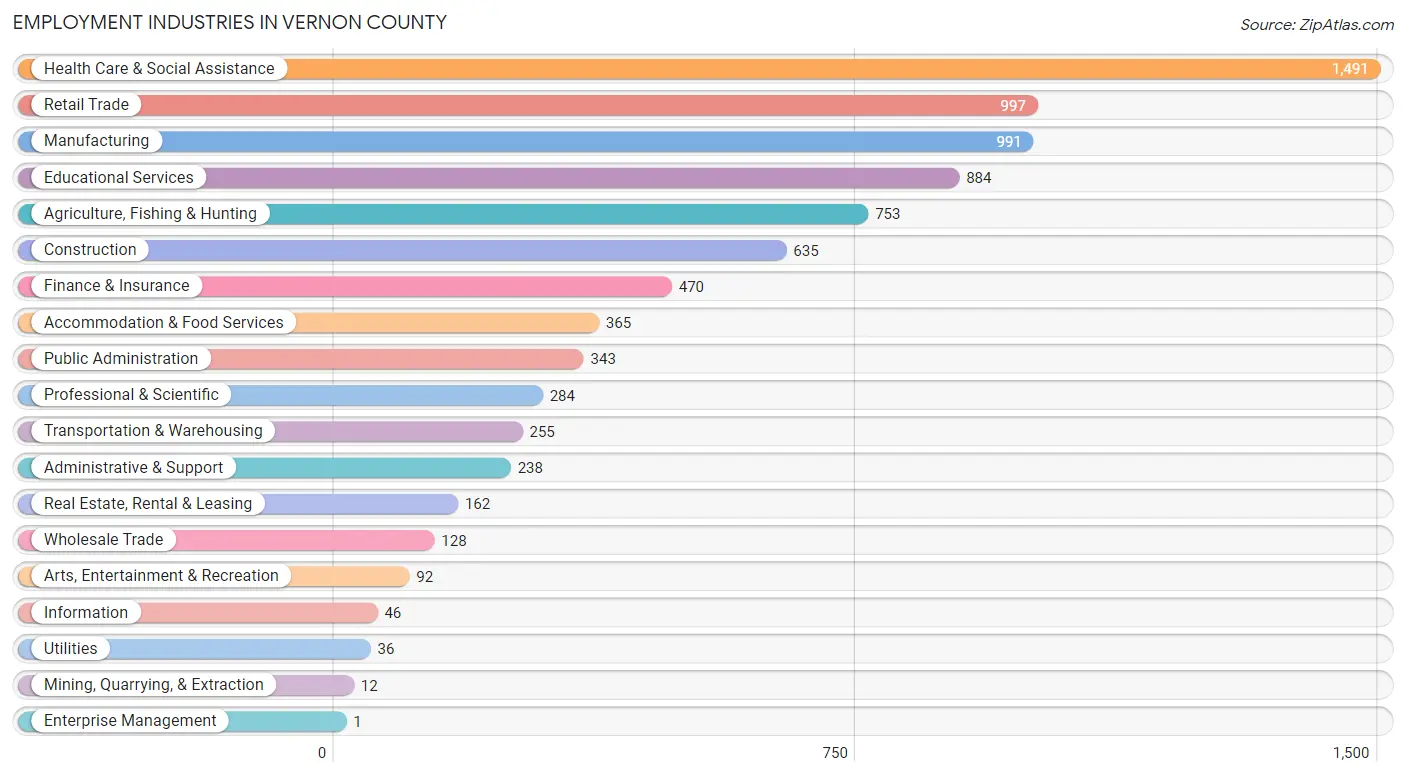
The major employment industries in Vernon County include Health Care & Social Assistance (1,491 | 17.6%), Retail Trade (997 | 11.7%), Manufacturing (991 | 11.7%), Educational Services (884 | 10.4%), and Agriculture, Fishing & Hunting (753 | 8.9%).
Employment Industries by Sex in Vernon County
The Vernon County industries that see more men than women are Mining, Quarrying, & Extraction (100.0%), Enterprise Management (100.0%), and Construction (93.7%), whereas the industries that tend to have a higher number of women are Health Care & Social Assistance (81.6%), Educational Services (77.5%), and Finance & Insurance (76.0%).
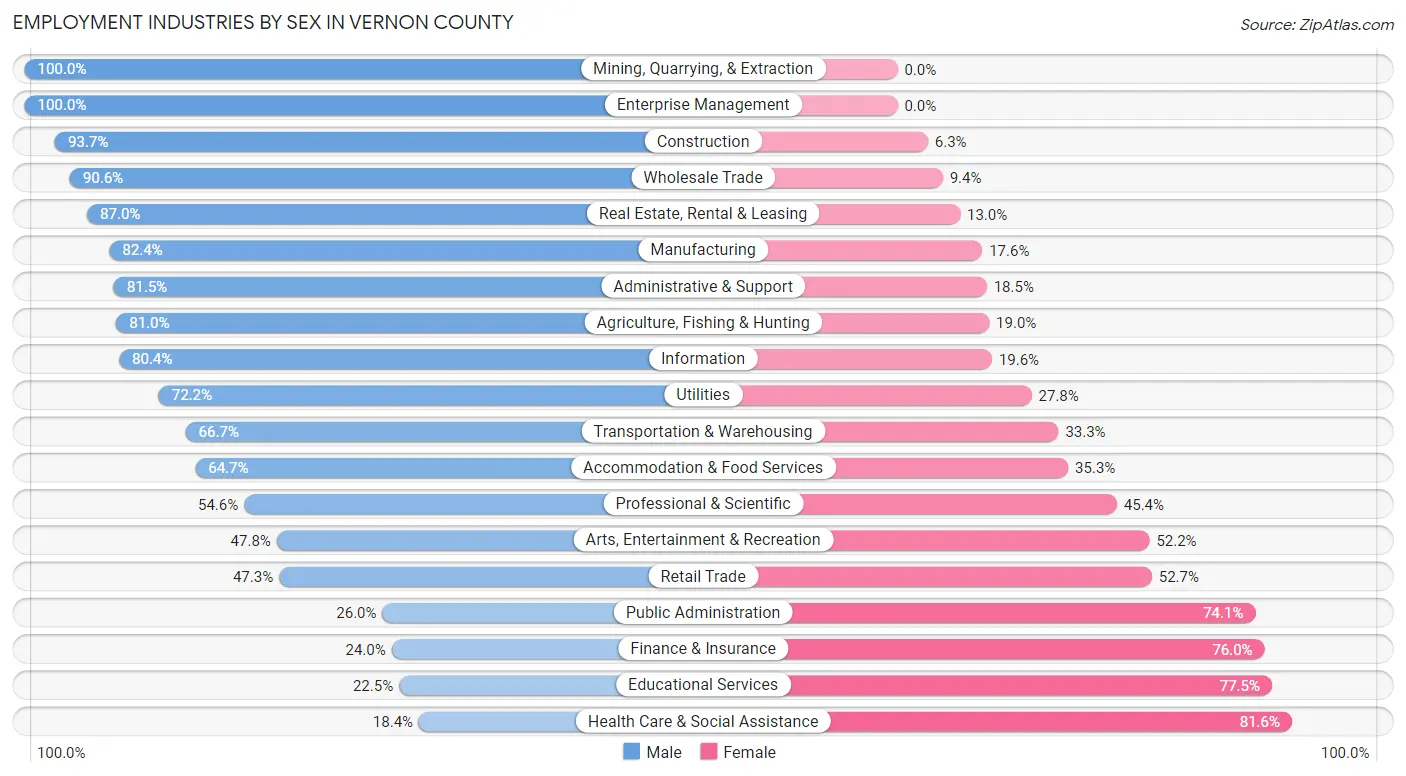
| Industry | Male | Female |
| Agriculture, Fishing & Hunting | 610 (81.0%) | 143 (19.0%) |
| Mining, Quarrying, & Extraction | 12 (100.0%) | 0 (0.0%) |
| Construction | 595 (93.7%) | 40 (6.3%) |
| Manufacturing | 817 (82.4%) | 174 (17.6%) |
| Wholesale Trade | 116 (90.6%) | 12 (9.4%) |
| Retail Trade | 472 (47.3%) | 525 (52.7%) |
| Transportation & Warehousing | 170 (66.7%) | 85 (33.3%) |
| Utilities | 26 (72.2%) | 10 (27.8%) |
| Information | 37 (80.4%) | 9 (19.6%) |
| Finance & Insurance | 113 (24.0%) | 357 (76.0%) |
| Real Estate, Rental & Leasing | 141 (87.0%) | 21 (13.0%) |
| Professional & Scientific | 155 (54.6%) | 129 (45.4%) |
| Enterprise Management | 1 (100.0%) | 0 (0.0%) |
| Administrative & Support | 194 (81.5%) | 44 (18.5%) |
| Educational Services | 199 (22.5%) | 685 (77.5%) |
| Health Care & Social Assistance | 274 (18.4%) | 1,217 (81.6%) |
| Arts, Entertainment & Recreation | 44 (47.8%) | 48 (52.2%) |
| Accommodation & Food Services | 236 (64.7%) | 129 (35.3%) |
| Public Administration | 89 (26.0%) | 254 (74.1%) |
| Total | 4,451 (52.4%) | 4,041 (47.6%) |
Education in Vernon County
School Enrollment in Vernon County
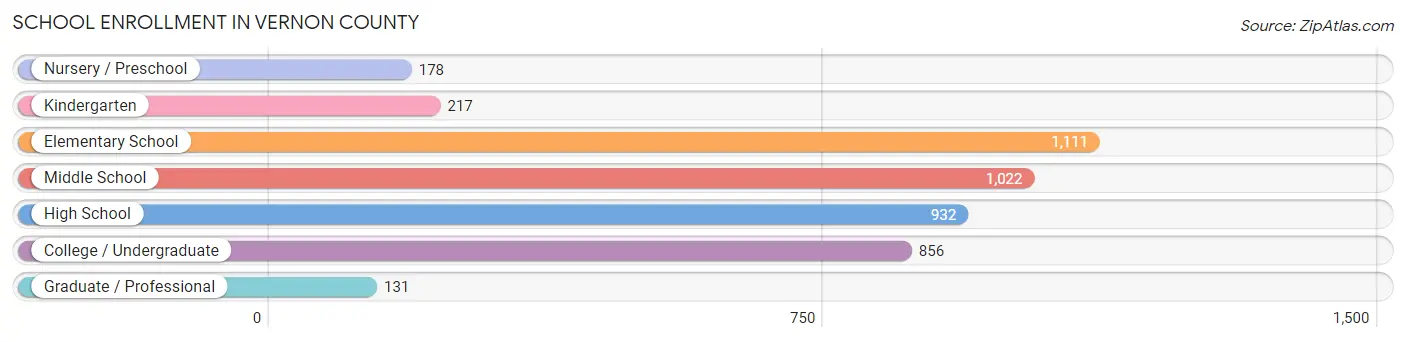
The most common levels of schooling among the 4,447 students in Vernon County are elementary school (1,111 | 25.0%), middle school (1,022 | 23.0%), and high school (932 | 21.0%).
| School Level | # Students | % Students |
| Nursery / Preschool | 178 | 4.0% |
| Kindergarten | 217 | 4.9% |
| Elementary School | 1,111 | 25.0% |
| Middle School | 1,022 | 23.0% |
| High School | 932 | 21.0% |
| College / Undergraduate | 856 | 19.3% |
| Graduate / Professional | 131 | 2.9% |
| Total | 4,447 | 100.0% |
School Enrollment by Age by Funding Source in Vernon County
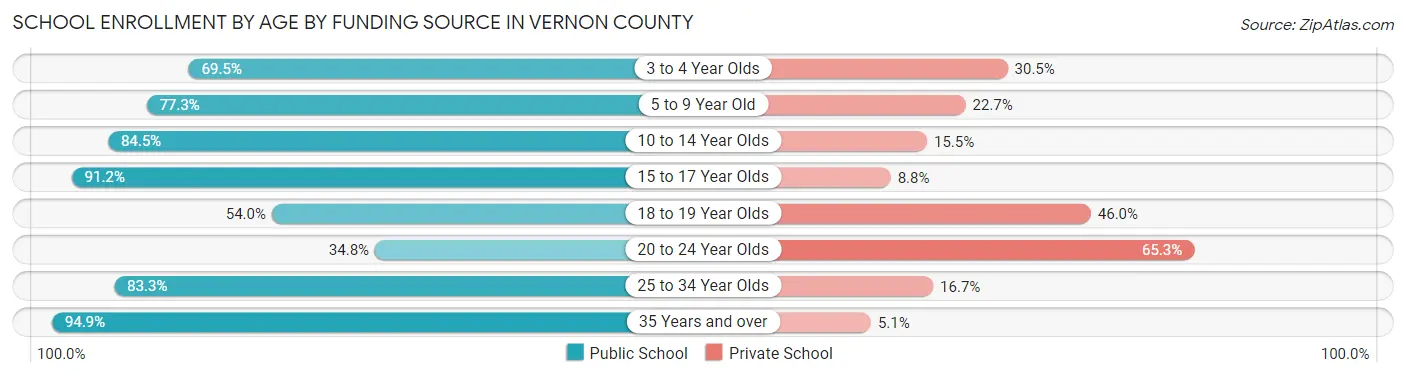
Out of a total of 4,447 students who are enrolled in schools in Vernon County, 1,009 (22.7%) attend a private institution, while the remaining 3,438 (77.3%) are enrolled in public schools. The age group of 20 to 24 year olds has the highest likelihood of being enrolled in private schools, with 246 (65.2% in the age bracket) enrolled. Conversely, the age group of 35 years and over has the lowest likelihood of being enrolled in a private school, with 168 (94.9% in the age bracket) attending a public institution.
| Age Bracket | Public School | Private School |
| 3 to 4 Year Olds | 91 (69.5%) | 40 (30.5%) |
| 5 to 9 Year Old | 831 (77.3%) | 244 (22.7%) |
| 10 to 14 Year Olds | 1,164 (84.5%) | 214 (15.5%) |
| 15 to 17 Year Olds | 687 (91.2%) | 66 (8.8%) |
| 18 to 19 Year Olds | 177 (54.0%) | 151 (46.0%) |
| 20 to 24 Year Olds | 131 (34.7%) | 246 (65.2%) |
| 25 to 34 Year Olds | 190 (83.3%) | 38 (16.7%) |
| 35 Years and over | 168 (94.9%) | 9 (5.1%) |
| Total | 3,438 (77.3%) | 1,009 (22.7%) |
Educational Attainment by Field of Study in Vernon County
Education (543 | 21.9%), science & technology (382 | 15.4%), business (332 | 13.4%), arts & humanities (223 | 9.0%), and bio, nature & agricultural (210 | 8.5%) are the most common fields of study among 2,480 individuals in Vernon County who have obtained a bachelor's degree or higher.
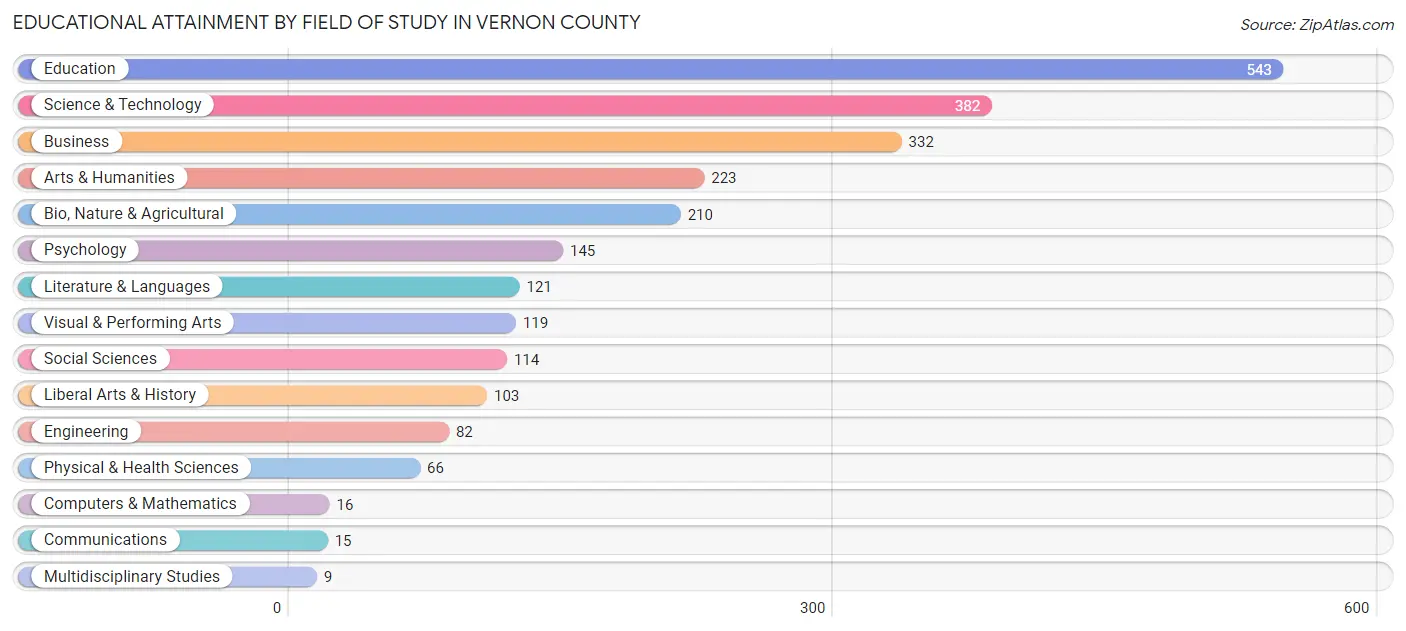
| Field of Study | # Graduates | % Graduates |
| Computers & Mathematics | 16 | 0.6% |
| Bio, Nature & Agricultural | 210 | 8.5% |
| Physical & Health Sciences | 66 | 2.7% |
| Psychology | 145 | 5.9% |
| Social Sciences | 114 | 4.6% |
| Engineering | 82 | 3.3% |
| Multidisciplinary Studies | 9 | 0.4% |
| Science & Technology | 382 | 15.4% |
| Business | 332 | 13.4% |
| Education | 543 | 21.9% |
| Literature & Languages | 121 | 4.9% |
| Liberal Arts & History | 103 | 4.2% |
| Visual & Performing Arts | 119 | 4.8% |
| Communications | 15 | 0.6% |
| Arts & Humanities | 223 | 9.0% |
| Total | 2,480 | 100.0% |
Transportation & Commute in Vernon County
Vehicle Availability by Sex in Vernon County
The most prevalent vehicle ownership categories in Vernon County are males with 2 vehicles (1,507, accounting for 34.9%) and females with 2 vehicles (1,494, making up 39.7%).
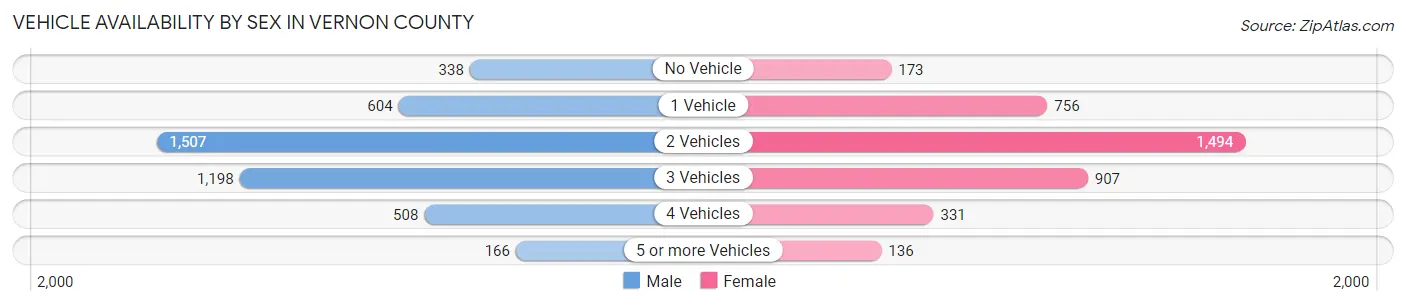
| Vehicles Available | Male | Female |
| No Vehicle | 338 (7.8%) | 173 (4.6%) |
| 1 Vehicle | 604 (14.0%) | 756 (19.9%) |
| 2 Vehicles | 1,507 (34.9%) | 1,494 (39.4%) |
| 3 Vehicles | 1,198 (27.7%) | 907 (23.9%) |
| 4 Vehicles | 508 (11.8%) | 331 (8.7%) |
| 5 or more Vehicles | 166 (3.8%) | 136 (3.6%) |
| Total | 4,321 (100.0%) | 3,797 (100.0%) |
Commute Time in Vernon County
The most frequently occuring commute durations in Vernon County are 5 to 9 minutes (1,567 commuters, 21.8%), 10 to 14 minutes (1,289 commuters, 17.9%), and 15 to 19 minutes (1,019 commuters, 14.2%).
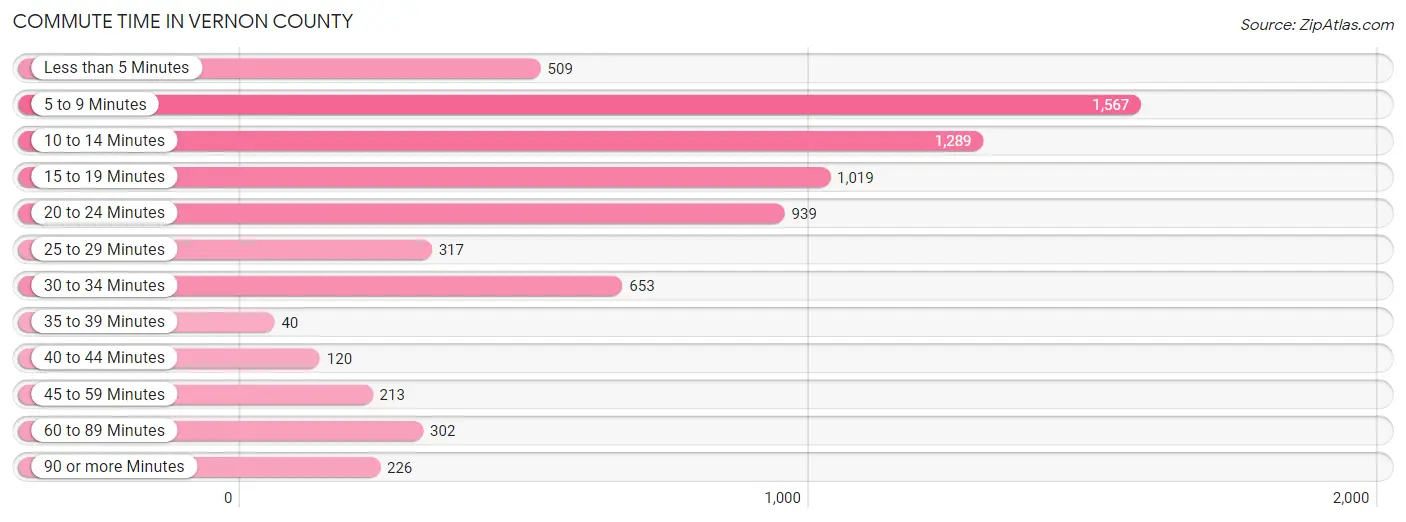
| Commute Time | # Commuters | % Commuters |
| Less than 5 Minutes | 509 | 7.1% |
| 5 to 9 Minutes | 1,567 | 21.8% |
| 10 to 14 Minutes | 1,289 | 17.9% |
| 15 to 19 Minutes | 1,019 | 14.2% |
| 20 to 24 Minutes | 939 | 13.1% |
| 25 to 29 Minutes | 317 | 4.4% |
| 30 to 34 Minutes | 653 | 9.1% |
| 35 to 39 Minutes | 40 | 0.6% |
| 40 to 44 Minutes | 120 | 1.7% |
| 45 to 59 Minutes | 213 | 3.0% |
| 60 to 89 Minutes | 302 | 4.2% |
| 90 or more Minutes | 226 | 3.1% |
Commute Time by Sex in Vernon County
The most common commute times in Vernon County are 5 to 9 minutes (625 commuters, 17.6%) for males and 5 to 9 minutes (942 commuters, 25.9%) for females.
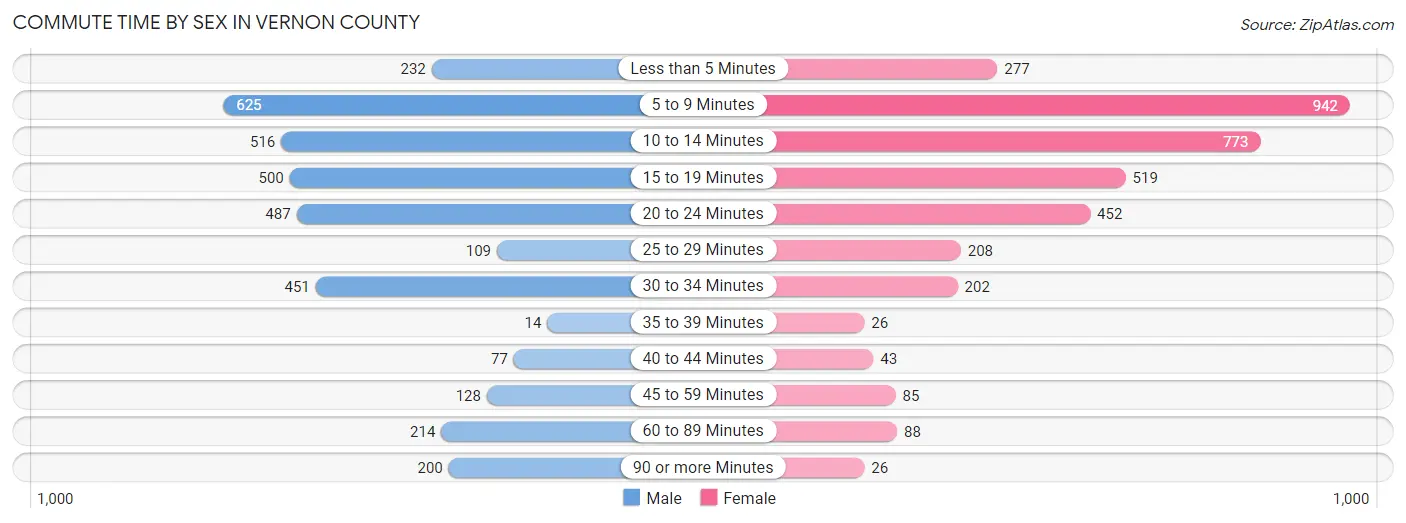
| Commute Time | Male | Female |
| Less than 5 Minutes | 232 (6.5%) | 277 (7.6%) |
| 5 to 9 Minutes | 625 (17.6%) | 942 (25.9%) |
| 10 to 14 Minutes | 516 (14.5%) | 773 (21.2%) |
| 15 to 19 Minutes | 500 (14.1%) | 519 (14.2%) |
| 20 to 24 Minutes | 487 (13.7%) | 452 (12.4%) |
| 25 to 29 Minutes | 109 (3.1%) | 208 (5.7%) |
| 30 to 34 Minutes | 451 (12.7%) | 202 (5.6%) |
| 35 to 39 Minutes | 14 (0.4%) | 26 (0.7%) |
| 40 to 44 Minutes | 77 (2.2%) | 43 (1.2%) |
| 45 to 59 Minutes | 128 (3.6%) | 85 (2.3%) |
| 60 to 89 Minutes | 214 (6.0%) | 88 (2.4%) |
| 90 or more Minutes | 200 (5.6%) | 26 (0.7%) |
Time of Departure to Work by Sex in Vernon County
The most frequent times of departure to work in Vernon County are 7:30 AM to 7:59 AM (564, 15.9%) for males and 7:00 AM to 7:29 AM (770, 21.1%) for females.
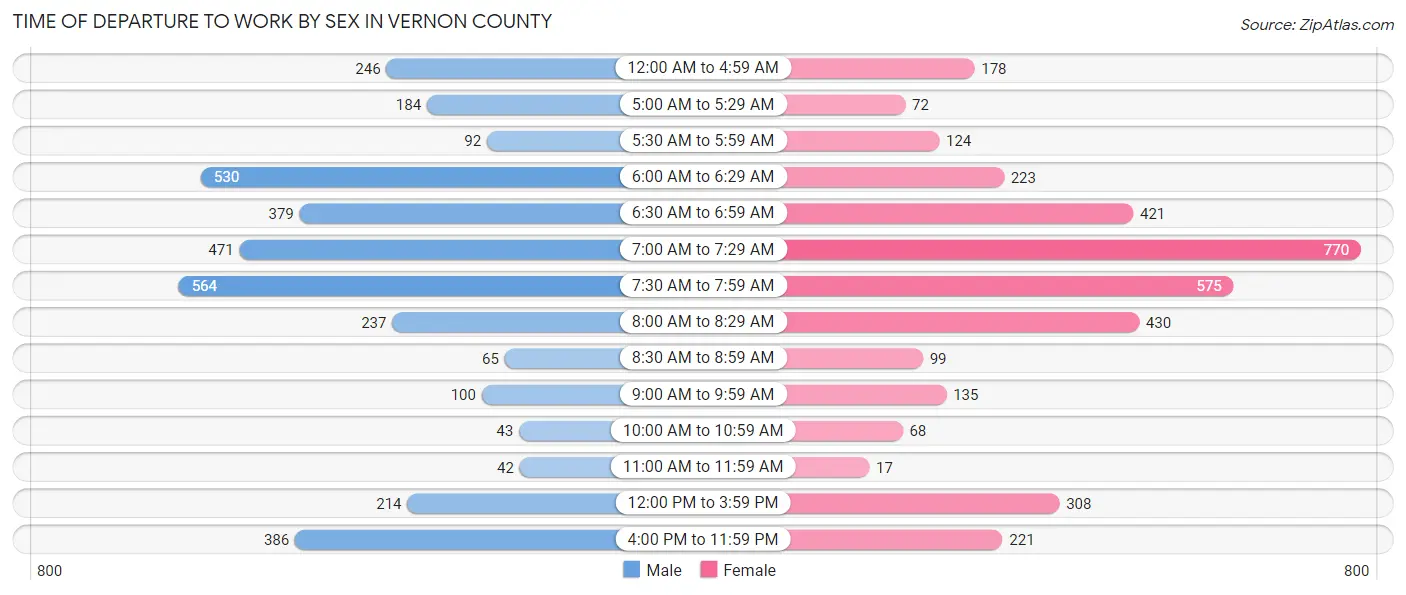
| Time of Departure | Male | Female |
| 12:00 AM to 4:59 AM | 246 (6.9%) | 178 (4.9%) |
| 5:00 AM to 5:29 AM | 184 (5.2%) | 72 (2.0%) |
| 5:30 AM to 5:59 AM | 92 (2.6%) | 124 (3.4%) |
| 6:00 AM to 6:29 AM | 530 (14.9%) | 223 (6.1%) |
| 6:30 AM to 6:59 AM | 379 (10.7%) | 421 (11.6%) |
| 7:00 AM to 7:29 AM | 471 (13.3%) | 770 (21.1%) |
| 7:30 AM to 7:59 AM | 564 (15.9%) | 575 (15.8%) |
| 8:00 AM to 8:29 AM | 237 (6.7%) | 430 (11.8%) |
| 8:30 AM to 8:59 AM | 65 (1.8%) | 99 (2.7%) |
| 9:00 AM to 9:59 AM | 100 (2.8%) | 135 (3.7%) |
| 10:00 AM to 10:59 AM | 43 (1.2%) | 68 (1.9%) |
| 11:00 AM to 11:59 AM | 42 (1.2%) | 17 (0.5%) |
| 12:00 PM to 3:59 PM | 214 (6.0%) | 308 (8.5%) |
| 4:00 PM to 11:59 PM | 386 (10.9%) | 221 (6.1%) |
| Total | 3,553 (100.0%) | 3,641 (100.0%) |
Housing Occupancy in Vernon County
Occupancy by Ownership in Vernon County
Of the total 7,776 dwellings in Vernon County, owner-occupied units account for 5,526 (71.1%), while renter-occupied units make up 2,250 (28.9%).
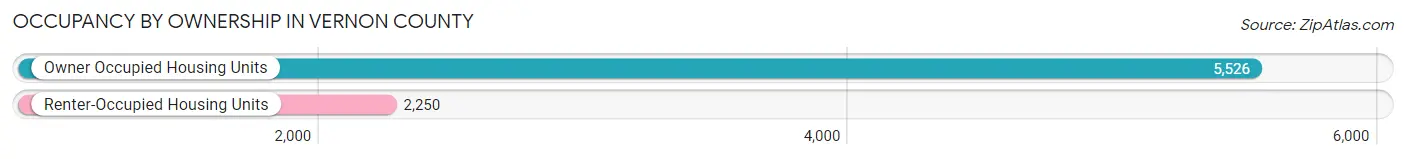
| Occupancy | # Housing Units | % Housing Units |
| Owner Occupied Housing Units | 5,526 | 71.1% |
| Renter-Occupied Housing Units | 2,250 | 28.9% |
| Total Occupied Housing Units | 7,776 | 100.0% |
Occupancy by Household Size in Vernon County
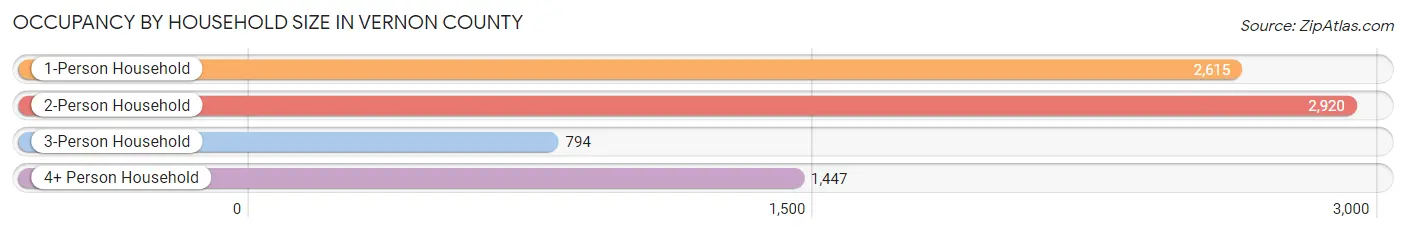
| Household Size | # Housing Units | % Housing Units |
| 1-Person Household | 2,615 | 33.6% |
| 2-Person Household | 2,920 | 37.6% |
| 3-Person Household | 794 | 10.2% |
| 4+ Person Household | 1,447 | 18.6% |
| Total Housing Units | 7,776 | 100.0% |
Occupancy by Ownership by Household Size in Vernon County
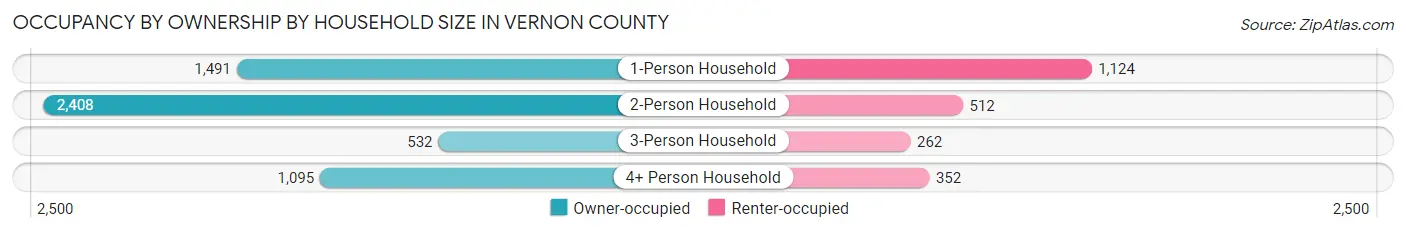
| Household Size | Owner-occupied | Renter-occupied |
| 1-Person Household | 1,491 (57.0%) | 1,124 (43.0%) |
| 2-Person Household | 2,408 (82.5%) | 512 (17.5%) |
| 3-Person Household | 532 (67.0%) | 262 (33.0%) |
| 4+ Person Household | 1,095 (75.7%) | 352 (24.3%) |
| Total Housing Units | 5,526 (71.1%) | 2,250 (28.9%) |
Occupancy by Educational Attainment in Vernon County
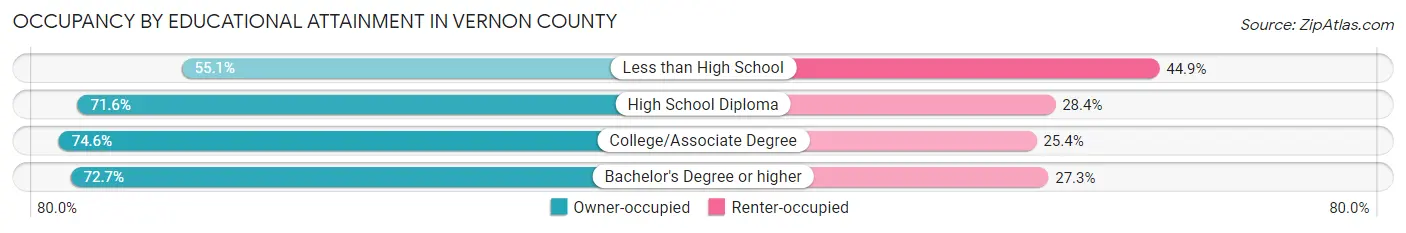
| Household Size | Owner-occupied | Renter-occupied |
| Less than High School | 471 (55.1%) | 384 (44.9%) |
| High School Diploma | 1,853 (71.6%) | 735 (28.4%) |
| College/Associate Degree | 2,073 (74.6%) | 707 (25.4%) |
| Bachelor's Degree or higher | 1,129 (72.7%) | 424 (27.3%) |
Occupancy by Age of Householder in Vernon County
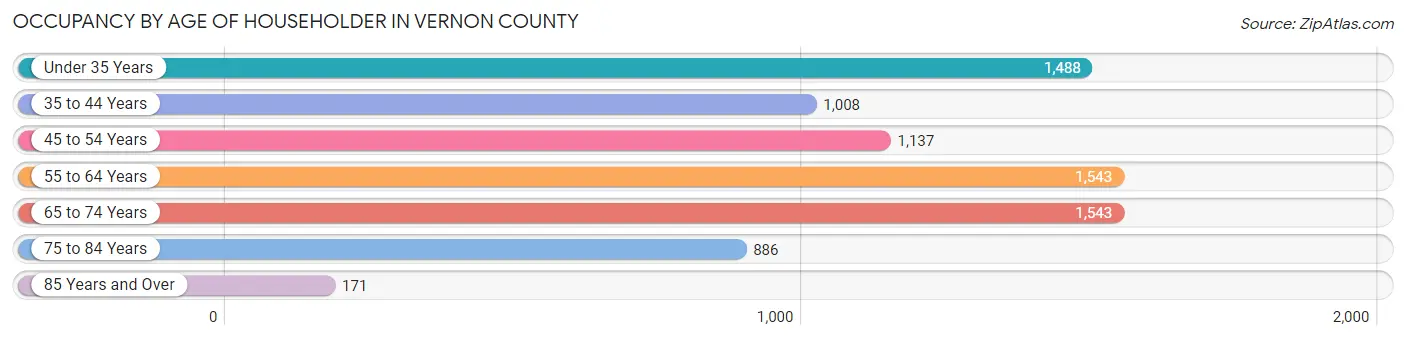
| Age Bracket | # Households | % Households |
| Under 35 Years | 1,488 | 19.1% |
| 35 to 44 Years | 1,008 | 13.0% |
| 45 to 54 Years | 1,137 | 14.6% |
| 55 to 64 Years | 1,543 | 19.8% |
| 65 to 74 Years | 1,543 | 19.8% |
| 75 to 84 Years | 886 | 11.4% |
| 85 Years and Over | 171 | 2.2% |
| Total | 7,776 | 100.0% |
Housing Finances in Vernon County
Median Income by Occupancy in Vernon County
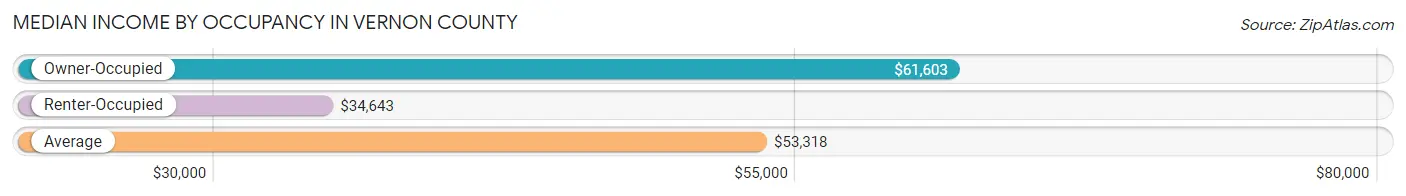
| Occupancy Type | # Households | Median Income |
| Owner-Occupied | 5,526 (71.1%) | $61,603 |
| Renter-Occupied | 2,250 (28.9%) | $34,643 |
| Average | 7,776 (100.0%) | $53,318 |
Occupancy by Householder Income Bracket in Vernon County
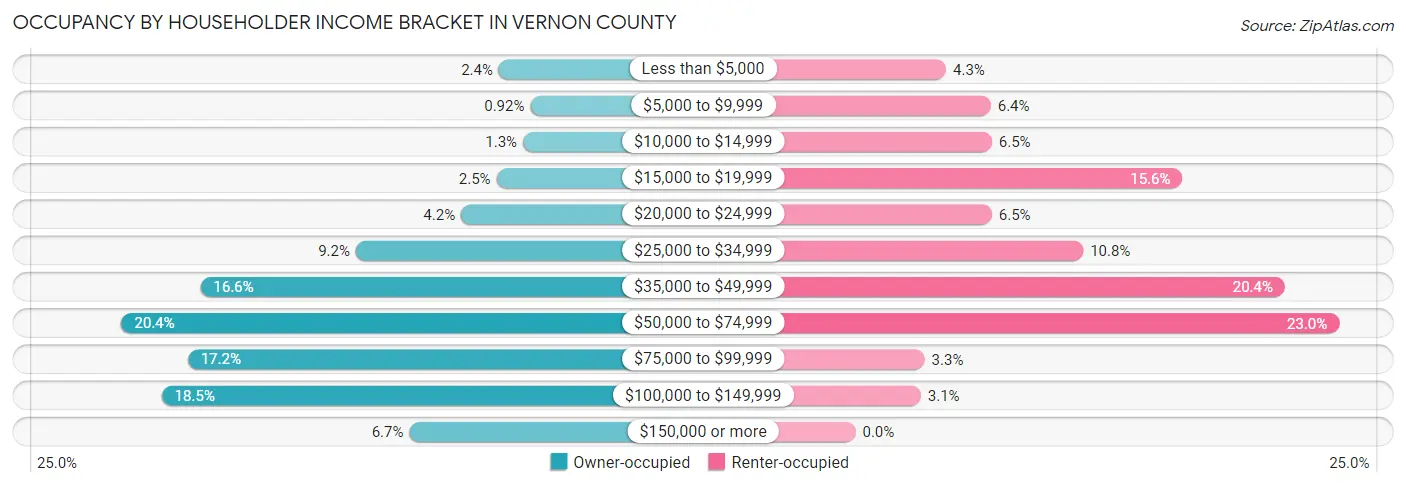
| Income Bracket | Owner-occupied | Renter-occupied |
| Less than $5,000 | 134 (2.4%) | 97 (4.3%) |
| $5,000 to $9,999 | 51 (0.9%) | 145 (6.4%) |
| $10,000 to $14,999 | 70 (1.3%) | 146 (6.5%) |
| $15,000 to $19,999 | 140 (2.5%) | 350 (15.6%) |
| $20,000 to $24,999 | 233 (4.2%) | 146 (6.5%) |
| $25,000 to $34,999 | 510 (9.2%) | 244 (10.8%) |
| $35,000 to $49,999 | 919 (16.6%) | 460 (20.4%) |
| $50,000 to $74,999 | 1,127 (20.4%) | 518 (23.0%) |
| $75,000 to $99,999 | 952 (17.2%) | 74 (3.3%) |
| $100,000 to $149,999 | 1,021 (18.5%) | 70 (3.1%) |
| $150,000 or more | 369 (6.7%) | 0 (0.0%) |
| Total | 5,526 (100.0%) | 2,250 (100.0%) |
Monthly Housing Cost Tiers in Vernon County
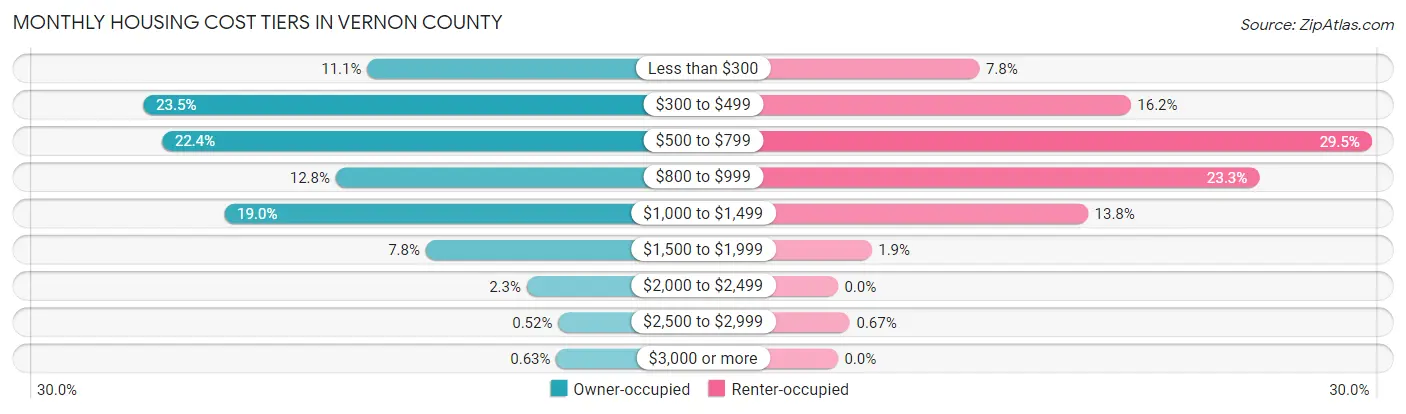
| Monthly Cost | Owner-occupied | Renter-occupied |
| Less than $300 | 612 (11.1%) | 176 (7.8%) |
| $300 to $499 | 1,296 (23.4%) | 364 (16.2%) |
| $500 to $799 | 1,239 (22.4%) | 664 (29.5%) |
| $800 to $999 | 708 (12.8%) | 524 (23.3%) |
| $1,000 to $1,499 | 1,049 (19.0%) | 311 (13.8%) |
| $1,500 to $1,999 | 433 (7.8%) | 42 (1.9%) |
| $2,000 to $2,499 | 125 (2.3%) | 0 (0.0%) |
| $2,500 to $2,999 | 29 (0.5%) | 15 (0.7%) |
| $3,000 or more | 35 (0.6%) | 0 (0.0%) |
| Total | 5,526 (100.0%) | 2,250 (100.0%) |
Physical Housing Characteristics in Vernon County
Housing Structures in Vernon County
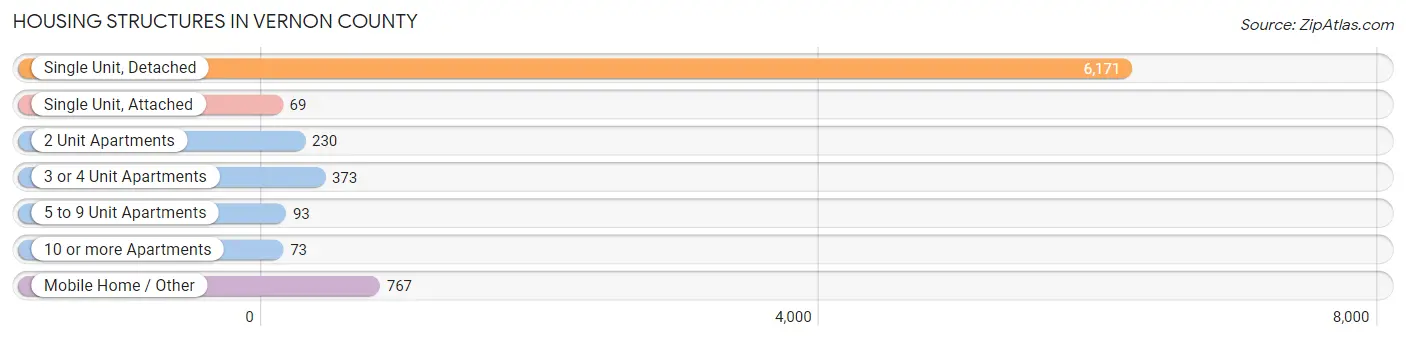
| Structure Type | # Housing Units | % Housing Units |
| Single Unit, Detached | 6,171 | 79.4% |
| Single Unit, Attached | 69 | 0.9% |
| 2 Unit Apartments | 230 | 3.0% |
| 3 or 4 Unit Apartments | 373 | 4.8% |
| 5 to 9 Unit Apartments | 93 | 1.2% |
| 10 or more Apartments | 73 | 0.9% |
| Mobile Home / Other | 767 | 9.9% |
| Total | 7,776 | 100.0% |
Housing Structures by Occupancy in Vernon County
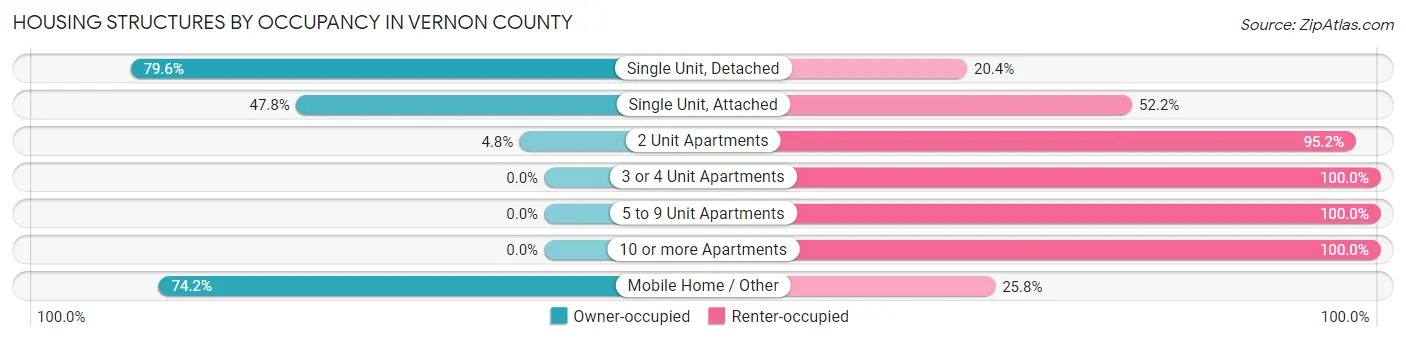
| Structure Type | Owner-occupied | Renter-occupied |
| Single Unit, Detached | 4,913 (79.6%) | 1,258 (20.4%) |
| Single Unit, Attached | 33 (47.8%) | 36 (52.2%) |
| 2 Unit Apartments | 11 (4.8%) | 219 (95.2%) |
| 3 or 4 Unit Apartments | 0 (0.0%) | 373 (100.0%) |
| 5 to 9 Unit Apartments | 0 (0.0%) | 93 (100.0%) |
| 10 or more Apartments | 0 (0.0%) | 73 (100.0%) |
| Mobile Home / Other | 569 (74.2%) | 198 (25.8%) |
| Total | 5,526 (71.1%) | 2,250 (28.9%) |
Housing Structures by Number of Rooms in Vernon County
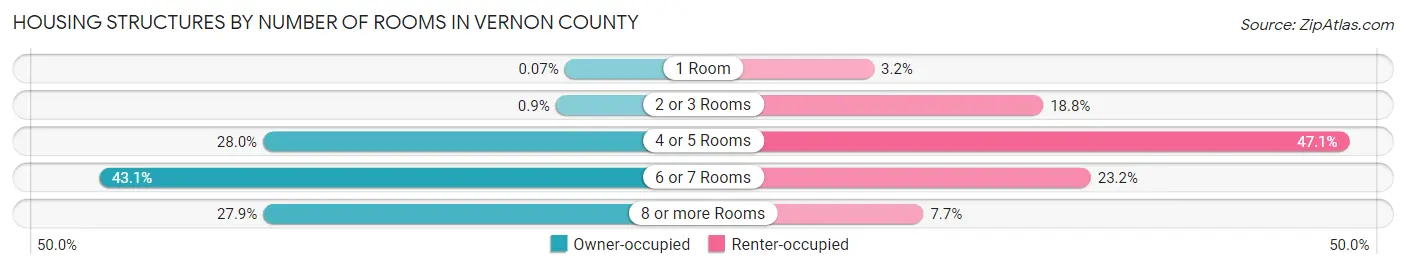
| Number of Rooms | Owner-occupied | Renter-occupied |
| 1 Room | 4 (0.1%) | 71 (3.2%) |
| 2 or 3 Rooms | 50 (0.9%) | 423 (18.8%) |
| 4 or 5 Rooms | 1,545 (28.0%) | 1,060 (47.1%) |
| 6 or 7 Rooms | 2,383 (43.1%) | 522 (23.2%) |
| 8 or more Rooms | 1,544 (27.9%) | 174 (7.7%) |
| Total | 5,526 (100.0%) | 2,250 (100.0%) |
Housing Structure by Heating Type in Vernon County
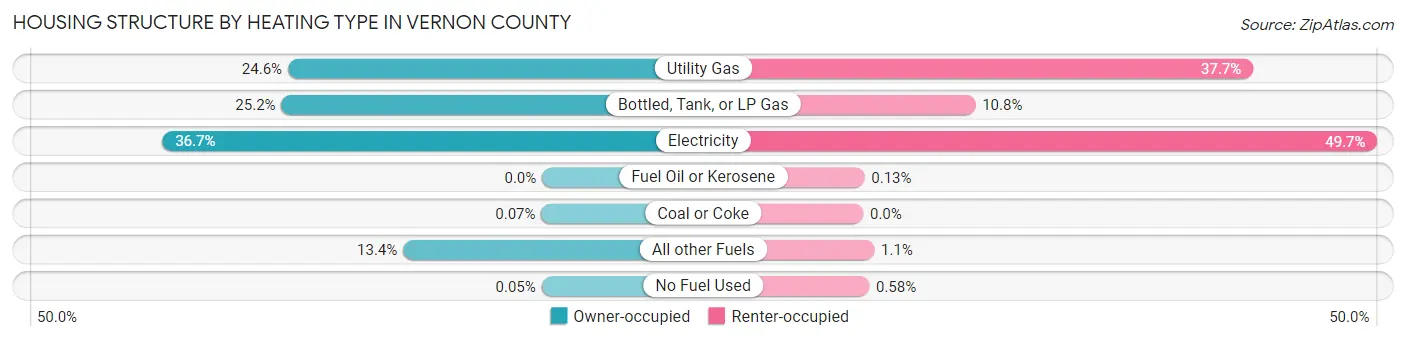
| Heating Type | Owner-occupied | Renter-occupied |
| Utility Gas | 1,357 (24.6%) | 848 (37.7%) |
| Bottled, Tank, or LP Gas | 1,392 (25.2%) | 244 (10.8%) |
| Electricity | 2,028 (36.7%) | 1,118 (49.7%) |
| Fuel Oil or Kerosene | 0 (0.0%) | 3 (0.1%) |
| Coal or Coke | 4 (0.1%) | 0 (0.0%) |
| All other Fuels | 742 (13.4%) | 24 (1.1%) |
| No Fuel Used | 3 (0.1%) | 13 (0.6%) |
| Total | 5,526 (100.0%) | 2,250 (100.0%) |
Household Vehicle Usage in Vernon County
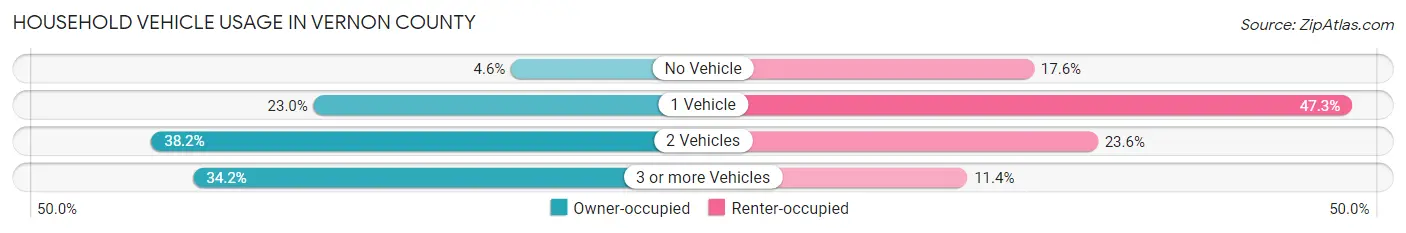
| Vehicles per Household | Owner-occupied | Renter-occupied |
| No Vehicle | 253 (4.6%) | 397 (17.6%) |
| 1 Vehicle | 1,272 (23.0%) | 1,065 (47.3%) |
| 2 Vehicles | 2,109 (38.2%) | 531 (23.6%) |
| 3 or more Vehicles | 1,892 (34.2%) | 257 (11.4%) |
| Total | 5,526 (100.0%) | 2,250 (100.0%) |
Real Estate & Mortgages in Vernon County
Real Estate and Mortgage Overview in Vernon County
| Characteristic | Without Mortgage | With Mortgage |
| Housing Units | 2,942 | 2,584 |
| Median Property Value | $128,700 | $126,900 |
| Median Household Income | $55,213 | $208 |
| Monthly Housing Costs | $432 | $26 |
| Real Estate Taxes | $877 | $25 |
Property Value by Mortgage Status in Vernon County
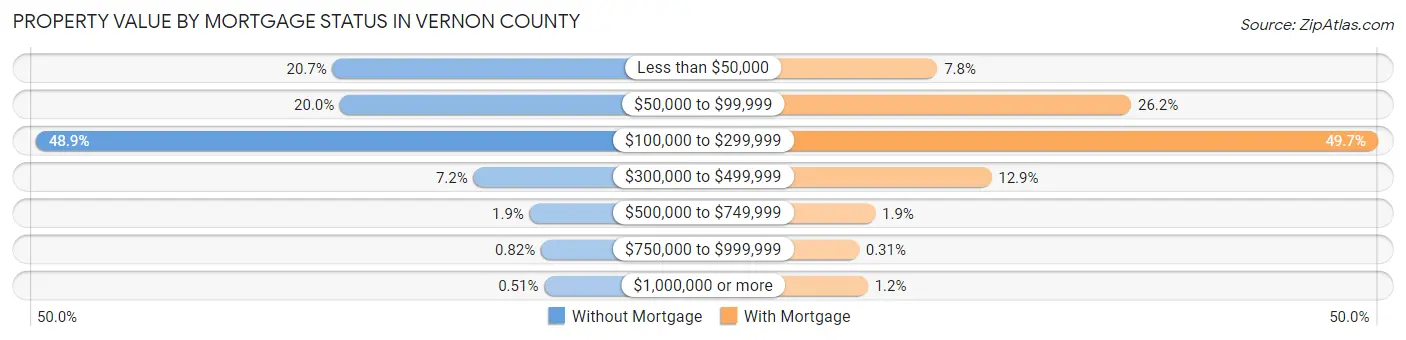
| Property Value | Without Mortgage | With Mortgage |
| Less than $50,000 | 608 (20.7%) | 201 (7.8%) |
| $50,000 to $99,999 | 587 (20.0%) | 678 (26.2%) |
| $100,000 to $299,999 | 1,439 (48.9%) | 1,285 (49.7%) |
| $300,000 to $499,999 | 213 (7.2%) | 334 (12.9%) |
| $500,000 to $749,999 | 56 (1.9%) | 48 (1.9%) |
| $750,000 to $999,999 | 24 (0.8%) | 8 (0.3%) |
| $1,000,000 or more | 15 (0.5%) | 30 (1.2%) |
| Total | 2,942 (100.0%) | 2,584 (100.0%) |
Household Income by Mortgage Status in Vernon County
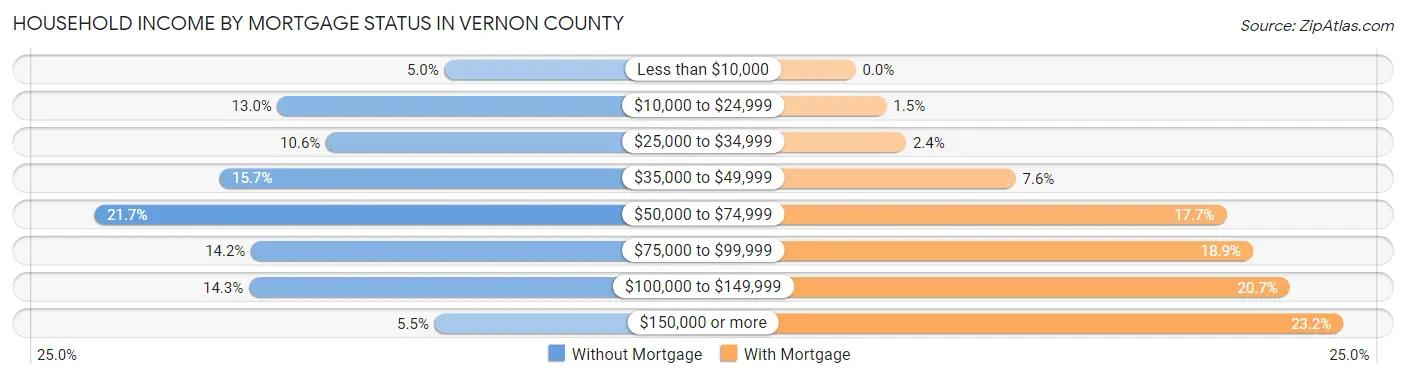
| Household Income | Without Mortgage | With Mortgage |
| Less than $10,000 | 147 (5.0%) | 0 (0.0%) |
| $10,000 to $24,999 | 381 (13.0%) | 38 (1.5%) |
| $25,000 to $34,999 | 313 (10.6%) | 62 (2.4%) |
| $35,000 to $49,999 | 463 (15.7%) | 197 (7.6%) |
| $50,000 to $74,999 | 638 (21.7%) | 456 (17.6%) |
| $75,000 to $99,999 | 418 (14.2%) | 489 (18.9%) |
| $100,000 to $149,999 | 421 (14.3%) | 534 (20.7%) |
| $150,000 or more | 161 (5.5%) | 600 (23.2%) |
| Total | 2,942 (100.0%) | 2,584 (100.0%) |
Property Value to Household Income Ratio in Vernon County
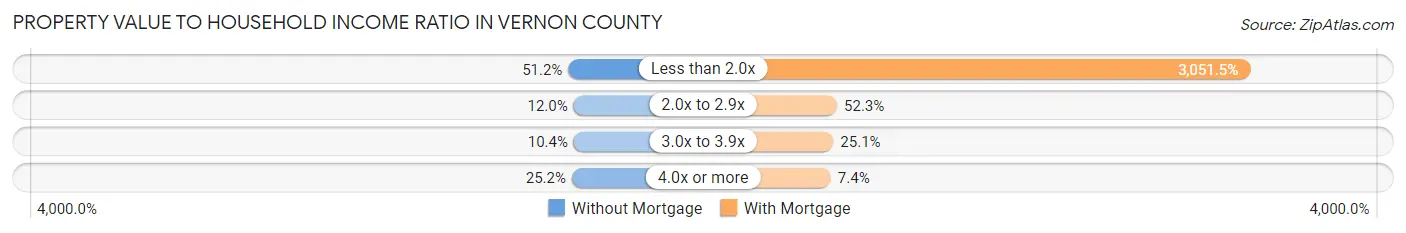
| Value-to-Income Ratio | Without Mortgage | With Mortgage |
| Less than 2.0x | 1,507 (51.2%) | 78,850 (3,051.5%) |
| 2.0x to 2.9x | 352 (12.0%) | 1,352 (52.3%) |
| 3.0x to 3.9x | 305 (10.4%) | 649 (25.1%) |
| 4.0x or more | 740 (25.2%) | 190 (7.3%) |
| Total | 2,942 (100.0%) | 2,584 (100.0%) |
Real Estate Taxes by Mortgage Status in Vernon County
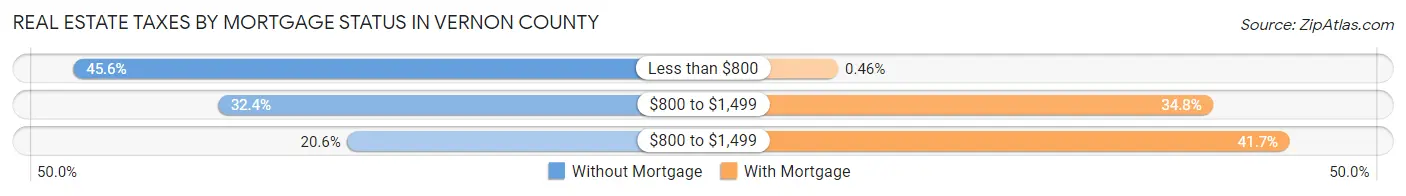
| Property Taxes | Without Mortgage | With Mortgage |
| Less than $800 | 1,340 (45.6%) | 12 (0.5%) |
| $800 to $1,499 | 952 (32.4%) | 898 (34.7%) |
| $800 to $1,499 | 606 (20.6%) | 1,078 (41.7%) |
| Total | 2,942 (100.0%) | 2,584 (100.0%) |
Health & Disability in Vernon County
Health Insurance Coverage by Age in Vernon County
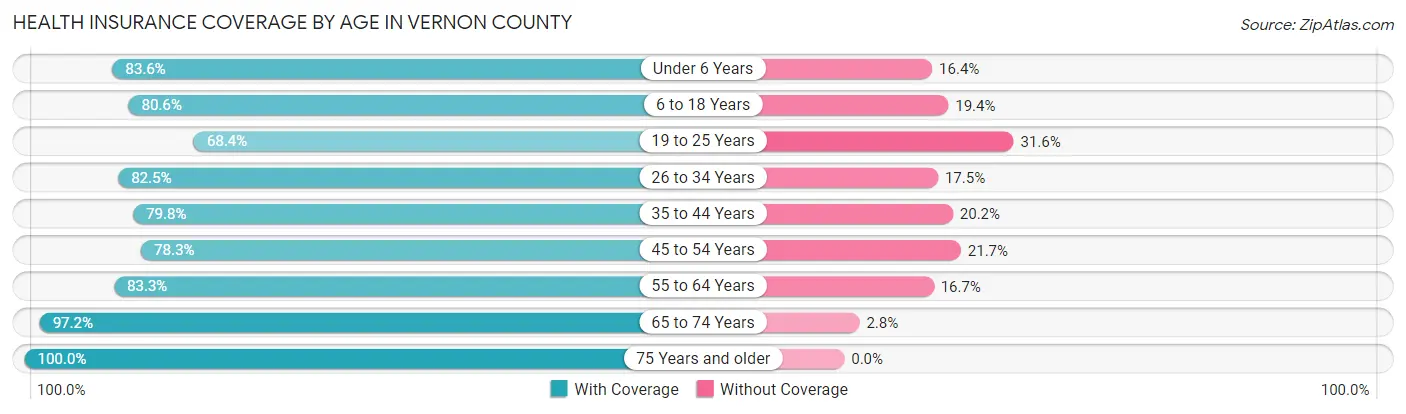
| Age Bracket | With Coverage | Without Coverage |
| Under 6 Years | 1,169 (83.6%) | 229 (16.4%) |
| 6 to 18 Years | 2,893 (80.6%) | 696 (19.4%) |
| 19 to 25 Years | 1,075 (68.4%) | 496 (31.6%) |
| 26 to 34 Years | 1,597 (82.5%) | 338 (17.5%) |
| 35 to 44 Years | 1,671 (79.8%) | 424 (20.2%) |
| 45 to 54 Years | 1,807 (78.3%) | 502 (21.7%) |
| 55 to 64 Years | 2,260 (83.3%) | 452 (16.7%) |
| 65 to 74 Years | 2,125 (97.2%) | 62 (2.8%) |
| 75 Years and older | 1,567 (100.0%) | 0 (0.0%) |
| Total | 16,164 (83.5%) | 3,199 (16.5%) |
Health Insurance Coverage by Citizenship Status in Vernon County
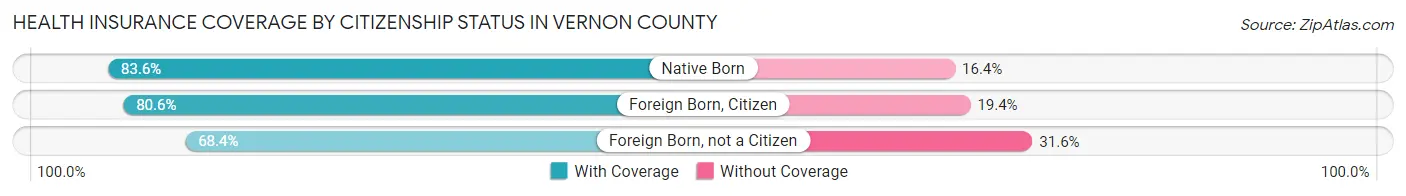
| Citizenship Status | With Coverage | Without Coverage |
| Native Born | 1,169 (83.6%) | 229 (16.4%) |
| Foreign Born, Citizen | 2,893 (80.6%) | 696 (19.4%) |
| Foreign Born, not a Citizen | 1,075 (68.4%) | 496 (31.6%) |
Health Insurance Coverage by Household Income in Vernon County
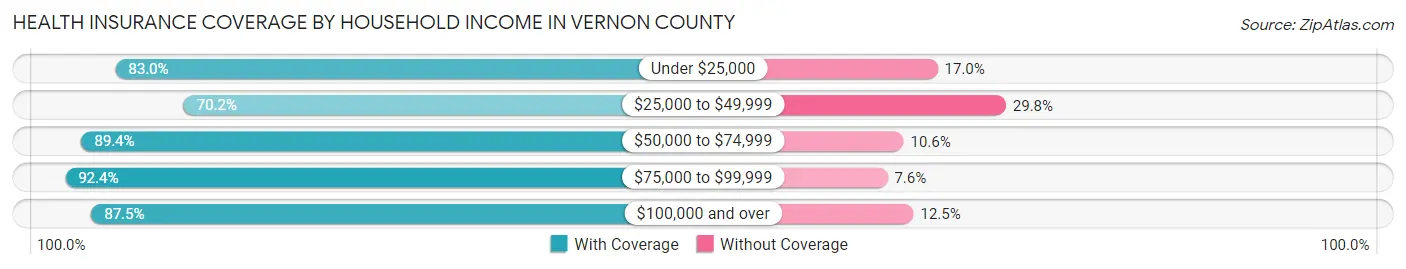
| Household Income | With Coverage | Without Coverage |
| Under $25,000 | 2,073 (83.0%) | 425 (17.0%) |
| $25,000 to $49,999 | 3,534 (70.2%) | 1,500 (29.8%) |
| $50,000 to $74,999 | 4,117 (89.4%) | 490 (10.6%) |
| $75,000 to $99,999 | 2,436 (92.4%) | 201 (7.6%) |
| $100,000 and over | 3,788 (87.5%) | 541 (12.5%) |
Public vs Private Health Insurance Coverage by Age in Vernon County
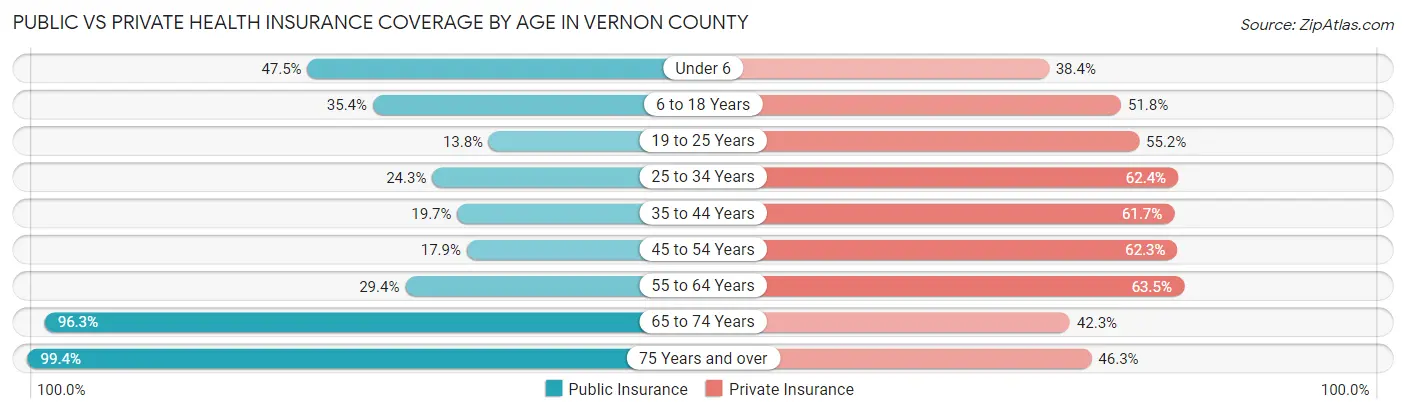
| Age Bracket | Public Insurance | Private Insurance |
| Under 6 | 664 (47.5%) | 537 (38.4%) |
| 6 to 18 Years | 1,269 (35.4%) | 1,860 (51.8%) |
| 19 to 25 Years | 217 (13.8%) | 867 (55.2%) |
| 25 to 34 Years | 471 (24.3%) | 1,207 (62.4%) |
| 35 to 44 Years | 412 (19.7%) | 1,292 (61.7%) |
| 45 to 54 Years | 414 (17.9%) | 1,438 (62.3%) |
| 55 to 64 Years | 796 (29.3%) | 1,721 (63.5%) |
| 65 to 74 Years | 2,105 (96.3%) | 926 (42.3%) |
| 75 Years and over | 1,558 (99.4%) | 726 (46.3%) |
| Total | 7,906 (40.8%) | 10,574 (54.6%) |
Disability Status by Sex by Age in Vernon County
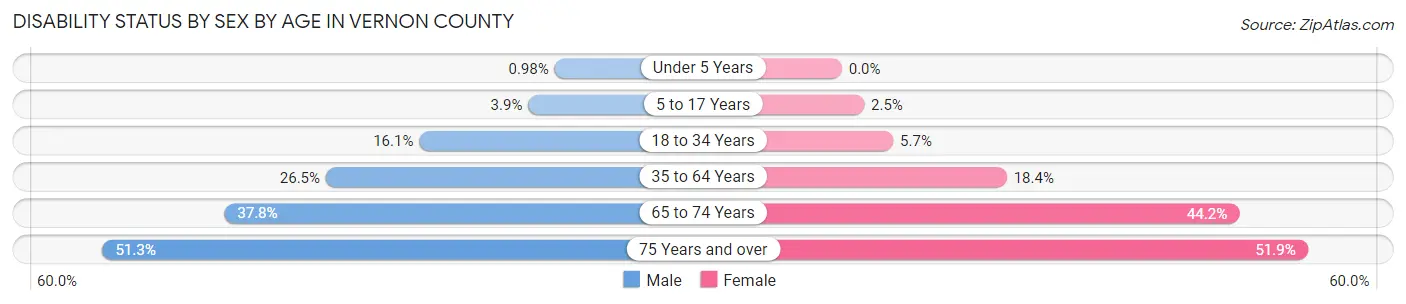
| Age Bracket | Male | Female |
| Under 5 Years | 6 (1.0%) | 0 (0.0%) |
| 5 to 17 Years | 73 (3.9%) | 40 (2.5%) |
| 18 to 34 Years | 299 (16.1%) | 113 (5.7%) |
| 35 to 64 Years | 933 (26.5%) | 659 (18.4%) |
| 65 to 74 Years | 393 (37.8%) | 507 (44.2%) |
| 75 Years and over | 350 (51.3%) | 459 (51.9%) |
Disability Class by Sex by Age in Vernon County
Disability Class: Hearing Difficulty
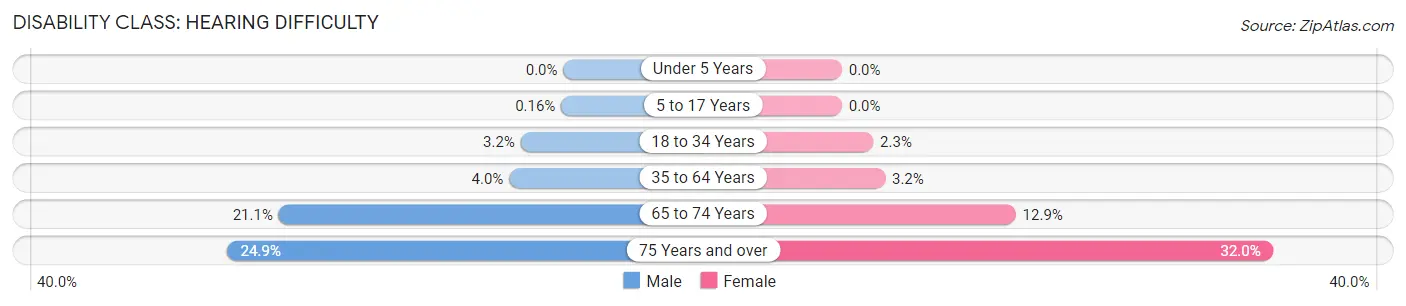
| Age Bracket | Male | Female |
| Under 5 Years | 0 (0.0%) | 0 (0.0%) |
| 5 to 17 Years | 3 (0.2%) | 0 (0.0%) |
| 18 to 34 Years | 59 (3.2%) | 46 (2.3%) |
| 35 to 64 Years | 142 (4.0%) | 115 (3.2%) |
| 65 to 74 Years | 220 (21.1%) | 148 (12.9%) |
| 75 Years and over | 170 (24.9%) | 283 (32.0%) |
Disability Class: Vision Difficulty
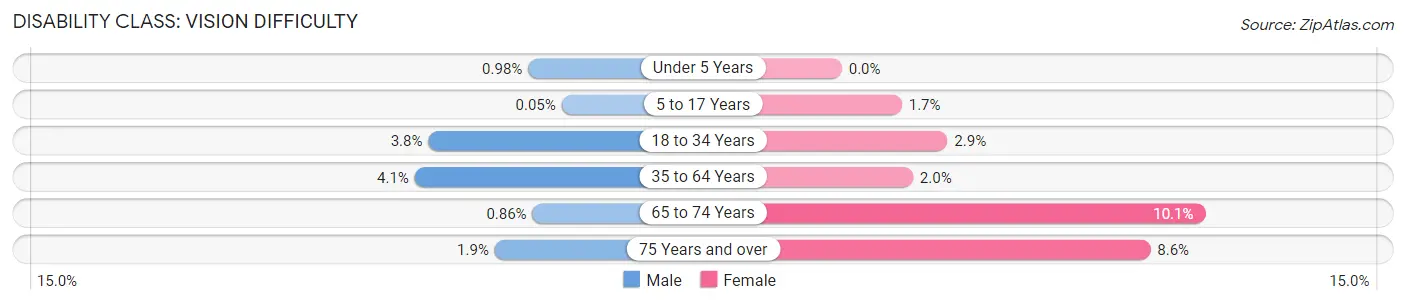
| Age Bracket | Male | Female |
| Under 5 Years | 6 (1.0%) | 0 (0.0%) |
| 5 to 17 Years | 1 (0.1%) | 27 (1.7%) |
| 18 to 34 Years | 70 (3.8%) | 58 (2.9%) |
| 35 to 64 Years | 146 (4.1%) | 71 (2.0%) |
| 65 to 74 Years | 9 (0.9%) | 116 (10.1%) |
| 75 Years and over | 13 (1.9%) | 76 (8.6%) |
Disability Class: Cognitive Difficulty
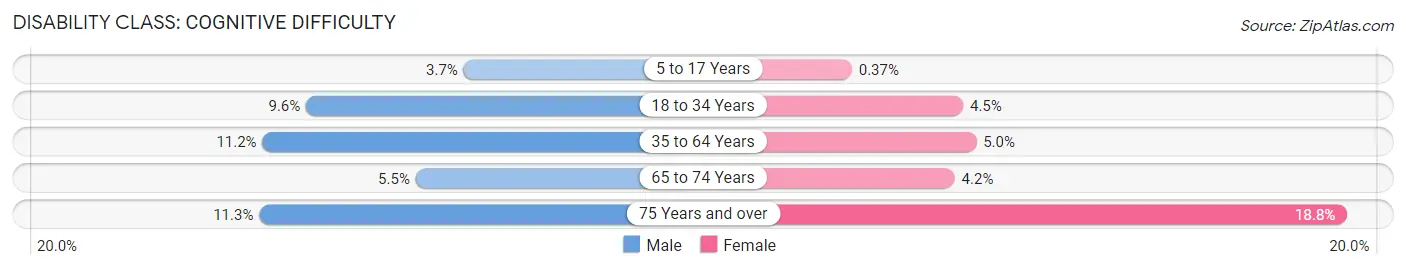
| Age Bracket | Male | Female |
| 5 to 17 Years | 69 (3.7%) | 6 (0.4%) |
| 18 to 34 Years | 178 (9.6%) | 89 (4.5%) |
| 35 to 64 Years | 394 (11.2%) | 179 (5.0%) |
| 65 to 74 Years | 57 (5.5%) | 48 (4.2%) |
| 75 Years and over | 77 (11.3%) | 166 (18.8%) |
Disability Class: Ambulatory Difficulty
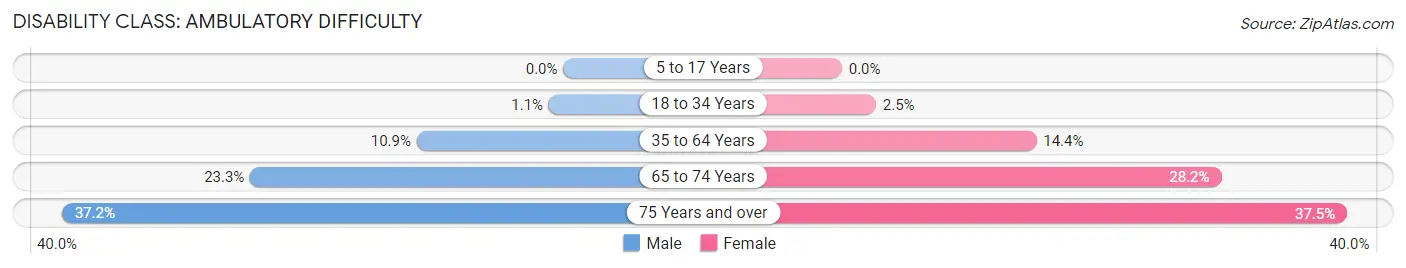
| Age Bracket | Male | Female |
| 5 to 17 Years | 0 (0.0%) | 0 (0.0%) |
| 18 to 34 Years | 20 (1.1%) | 50 (2.5%) |
| 35 to 64 Years | 384 (10.9%) | 518 (14.4%) |
| 65 to 74 Years | 242 (23.3%) | 323 (28.2%) |
| 75 Years and over | 254 (37.2%) | 332 (37.5%) |
Disability Class: Self-Care Difficulty
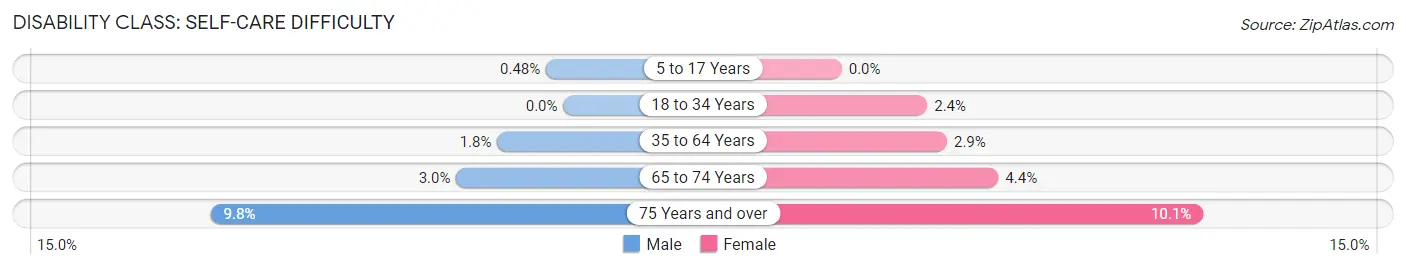
| Age Bracket | Male | Female |
| 5 to 17 Years | 9 (0.5%) | 0 (0.0%) |
| 18 to 34 Years | 0 (0.0%) | 47 (2.4%) |
| 35 to 64 Years | 65 (1.8%) | 105 (2.9%) |
| 65 to 74 Years | 31 (3.0%) | 50 (4.4%) |
| 75 Years and over | 67 (9.8%) | 89 (10.1%) |
Technology Access in Vernon County
Computing Device Access in Vernon County
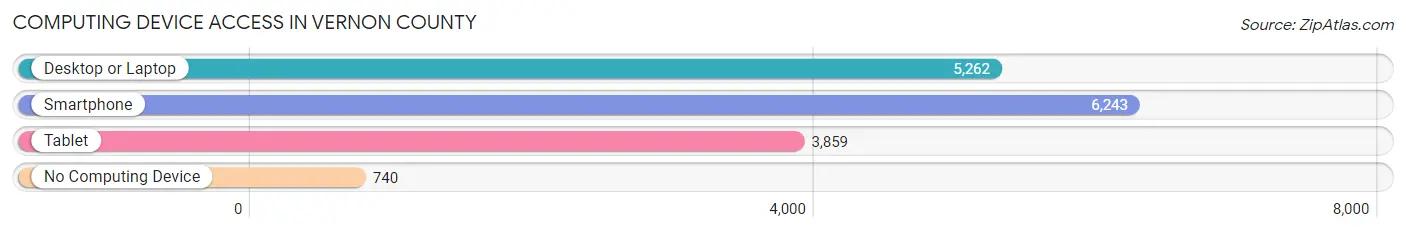
| Device Type | # Households | % Households |
| Desktop or Laptop | 5,262 | 67.7% |
| Smartphone | 6,243 | 80.3% |
| Tablet | 3,859 | 49.6% |
| No Computing Device | 740 | 9.5% |
| Total | 7,776 | 100.0% |
Internet Access in Vernon County
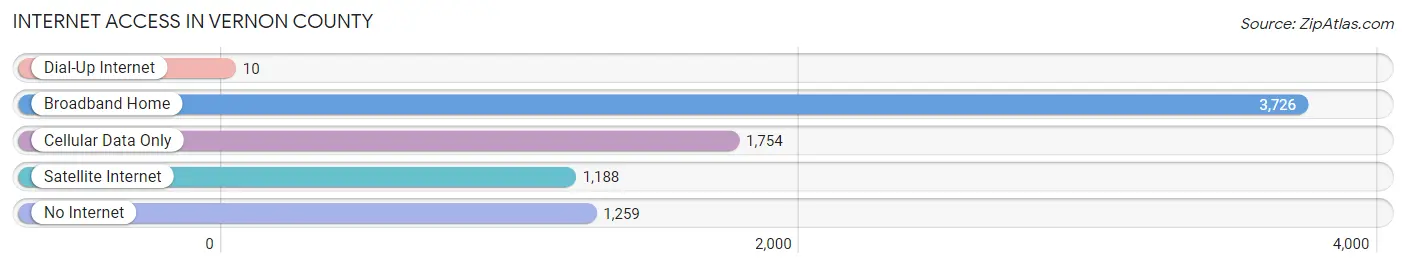
| Internet Type | # Households | % Households |
| Dial-Up Internet | 10 | 0.1% |
| Broadband Home | 3,726 | 47.9% |
| Cellular Data Only | 1,754 | 22.6% |
| Satellite Internet | 1,188 | 15.3% |
| No Internet | 1,259 | 16.2% |
| Total | 7,776 | 100.0% |
Vernon County Summary
Vernon County is located in the southwestern corner of Missouri, and is bordered by the states of Kansas and Oklahoma. It is part of the Ozark Plateau region, and is known for its rolling hills and wooded areas. The county was established in 1855 and named after Edward Vernon, a British naval hero. The county seat is Nevada, and the largest city is Nevada.
Geography
Vernon County covers an area of 576 square miles, and is located in the southwestern corner of Missouri. It is bordered by the states of Kansas and Oklahoma, and is part of the Ozark Plateau region. The county is characterized by rolling hills and wooded areas, with the highest point being the summit of Mount Vernon at 1,068 feet. The county is drained by the Osage River, which flows through the center of the county.
The climate of Vernon County is humid subtropical, with hot, humid summers and mild winters. The average annual temperature is around 60 degrees Fahrenheit, and the average annual precipitation is around 40 inches.
Demographics
As of the 2010 census, Vernon County had a population of 21,159. The population density was 36.5 people per square mile. The racial makeup of the county was 95.2% White, 0.7% African American, 0.5% Native American, 0.3% Asian, 0.1% Pacific Islander, 1.7% from other races, and 1.5% from two or more races. Hispanic or Latino of any race were 3.3% of the population.
The median income for a household in the county was $37,945, and the median income for a family was $45,945. The per capita income for the county was $18,945. About 11.2% of families and 14.3% of the population were below the poverty line, including 19.2% of those under age 18 and 10.2% of those age 65 or over.
Economy
The economy of Vernon County is largely based on agriculture, with the main crops being corn, soybeans, wheat, and hay. Livestock production is also important, with cattle, hogs, and poultry being the main animals raised. Manufacturing is also an important part of the economy, with the main industries being food processing, metal fabrication, and wood products.
The county is also home to several tourist attractions, including the Nevada State Park, the Nevada Historical Society Museum, and the Nevada National Wildlife Refuge.
Conclusion
Vernon County is located in the southwestern corner of Missouri, and is part of the Ozark Plateau region. It is characterized by rolling hills and wooded areas, and is drained by the Osage River. The county has a population of 21,159, and the economy is largely based on agriculture and manufacturing. Tourism is also an important part of the economy, with several attractions located in the county.
Common Questions
What is Per Capita Income in Vernon County?
Per Capita income in Vernon County is $26,515.
What is the Median Family Income in Vernon County?
Median Family Income in Vernon County is $68,266.
What is the Median Household income in Vernon County?
Median Household Income in Vernon County is $53,318.
What is Income or Wage Gap in Vernon County?
Income or Wage Gap in Vernon County is 9.5%.
Women in Vernon County earn 90.5 cents for every dollar earned by a man.
What is Family Income Deficit in Vernon County?
Family Income Deficit in Vernon County is $11,049.
Families that are below poverty line in Vernon County earn $11,049 less on average than the poverty threshold level.
What is Inequality or Gini Index in Vernon County?
Inequality or Gini Index in Vernon County is 0.41.
What is the Total Population of Vernon County?
Total Population of Vernon County is 19,777.
What is the Total Male Population of Vernon County?
Total Male Population of Vernon County is 9,763.
What is the Total Female Population of Vernon County?
Total Female Population of Vernon County is 10,014.
What is the Ratio of Males per 100 Females in Vernon County?
There are 97.49 Males per 100 Females in Vernon County.
What is the Ratio of Females per 100 Males in Vernon County?
There are 102.57 Females per 100 Males in Vernon County.
What is the Median Population Age in Vernon County?
Median Population Age in Vernon County is 41.8 Years.
What is the Average Family Size in Vernon County
Average Family Size in Vernon County is 3.1 People.
What is the Average Household Size in Vernon County
Average Household Size in Vernon County is 2.5 People.
How Large is the Labor Force in Vernon County?
There are 8,856 People in the Labor Forcein in Vernon County.
What is the Percentage of People in the Labor Force in Vernon County?
56.7% of People are in the Labor Force in Vernon County.
What is the Unemployment Rate in Vernon County?
Unemployment Rate in Vernon County is 4.0%.