Taney County, MO Map & Demographics
Taney County Map
Taney County Overview
$28,267
PER CAPITA INCOME
$63,399
AVG FAMILY INCOME
$54,467
AVG HOUSEHOLD INCOME
20.6%
WAGE / INCOME GAP [ % ]
79.4¢/ $1
WAGE / INCOME GAP [ $ ]
$7,279
FAMILY INCOME DEFICIT
0.44
INEQUALITY / GINI INDEX
56,202
TOTAL POPULATION
26,873
MALE POPULATION
29,329
FEMALE POPULATION
91.63
MALES / 100 FEMALES
109.14
FEMALES / 100 MALES
42.3
MEDIAN AGE
3.1
AVG FAMILY SIZE
2.5
AVG HOUSEHOLD SIZE
26,872
LABOR FORCE [ PEOPLE ]
58.2%
PERCENT IN LABOR FORCE
5.1%
UNEMPLOYMENT RATE
Taney County Area Codes
Income in Taney County
Income Overview in Taney County
Per Capita Income in Taney County is $28,267, while median incomes of families and households are $63,399 and $54,467 respectively.
| Characteristic | Number | Measure |
| Per Capita Income | 56,202 | $28,267 |
| Median Family Income | 14,245 | $63,399 |
| Mean Family Income | 14,245 | $84,174 |
| Median Household Income | 21,595 | $54,467 |
| Mean Household Income | 21,595 | $70,099 |
| Income Deficit | 14,245 | $7,279 |
| Wage / Income Gap (%) | 56,202 | 20.60% |
| Wage / Income Gap ($) | 56,202 | 79.40¢ per $1 |
| Gini / Inequality Index | 56,202 | 0.44 |
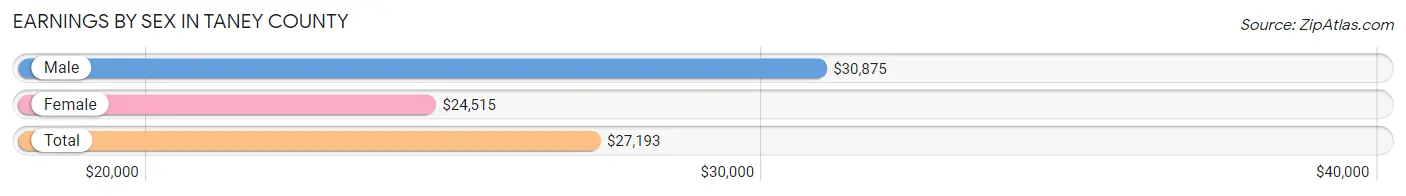
Earnings by Sex in Taney County
Average Earnings in Taney County are $27,193, $30,875 for men and $24,515 for women, a difference of 20.6%.
| Sex | Number | Average Earnings |
| Male | 14,713 (51.0%) | $30,875 |
| Female | 14,141 (49.0%) | $24,515 |
| Total | 28,854 (100.0%) | $27,193 |
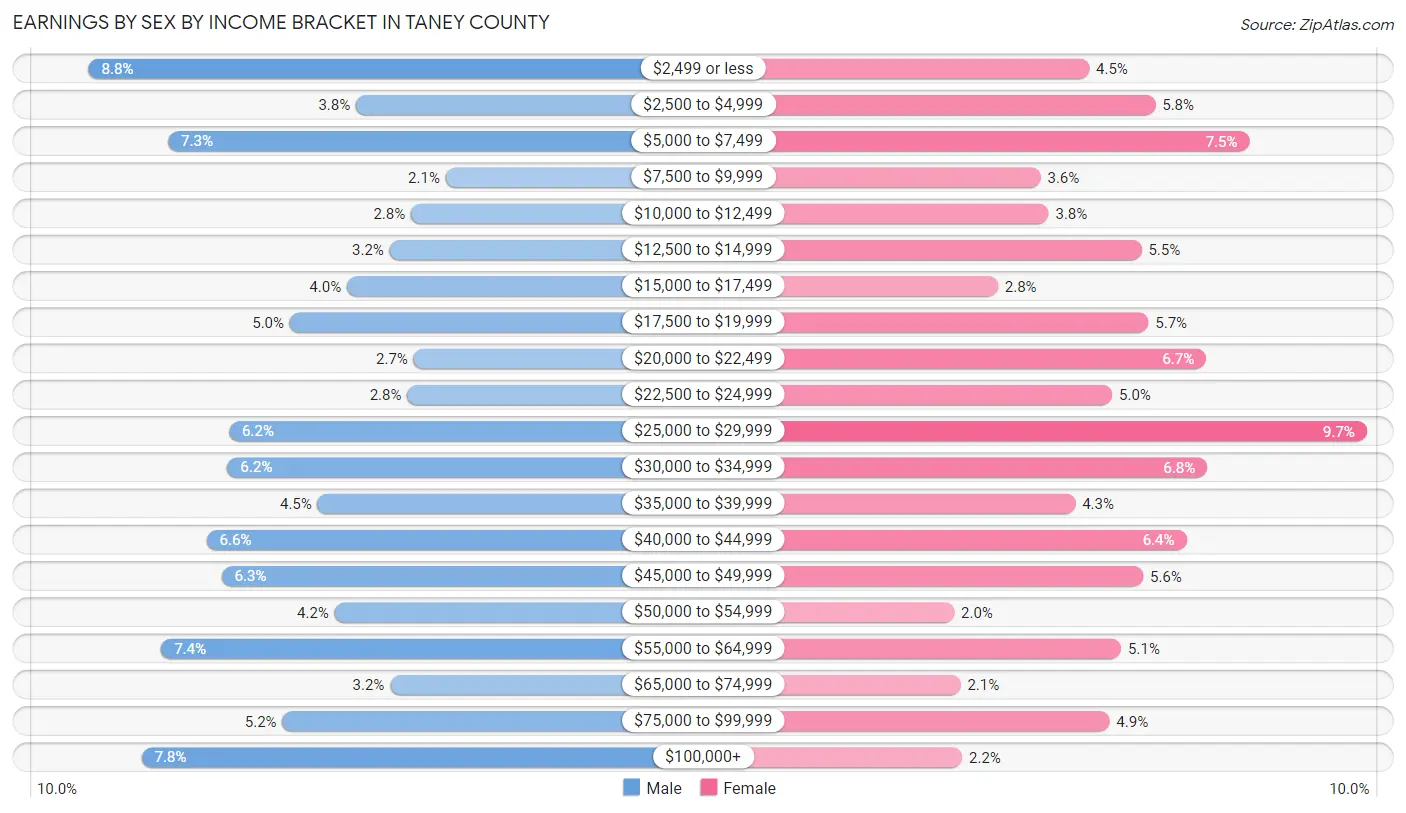
Earnings by Sex by Income Bracket in Taney County
The most common earnings brackets in Taney County are $2,499 or less for men (1,295 | 8.8%) and $25,000 to $29,999 for women (1,377 | 9.7%).
| Income | Male | Female |
| $2,499 or less | 1,295 (8.8%) | 642 (4.5%) |
| $2,500 to $4,999 | 558 (3.8%) | 817 (5.8%) |
| $5,000 to $7,499 | 1,075 (7.3%) | 1,066 (7.5%) |
| $7,500 to $9,999 | 311 (2.1%) | 513 (3.6%) |
| $10,000 to $12,499 | 406 (2.8%) | 534 (3.8%) |
| $12,500 to $14,999 | 465 (3.2%) | 781 (5.5%) |
| $15,000 to $17,499 | 582 (4.0%) | 400 (2.8%) |
| $17,500 to $19,999 | 740 (5.0%) | 799 (5.7%) |
| $20,000 to $22,499 | 398 (2.7%) | 952 (6.7%) |
| $22,500 to $24,999 | 417 (2.8%) | 703 (5.0%) |
| $25,000 to $29,999 | 908 (6.2%) | 1,377 (9.7%) |
| $30,000 to $34,999 | 912 (6.2%) | 954 (6.8%) |
| $35,000 to $39,999 | 664 (4.5%) | 605 (4.3%) |
| $40,000 to $44,999 | 970 (6.6%) | 899 (6.4%) |
| $45,000 to $49,999 | 929 (6.3%) | 785 (5.6%) |
| $50,000 to $54,999 | 616 (4.2%) | 284 (2.0%) |
| $55,000 to $64,999 | 1,095 (7.4%) | 727 (5.1%) |
| $65,000 to $74,999 | 463 (3.2%) | 301 (2.1%) |
| $75,000 to $99,999 | 760 (5.2%) | 696 (4.9%) |
| $100,000+ | 1,149 (7.8%) | 306 (2.2%) |
| Total | 14,713 (100.0%) | 14,141 (100.0%) |
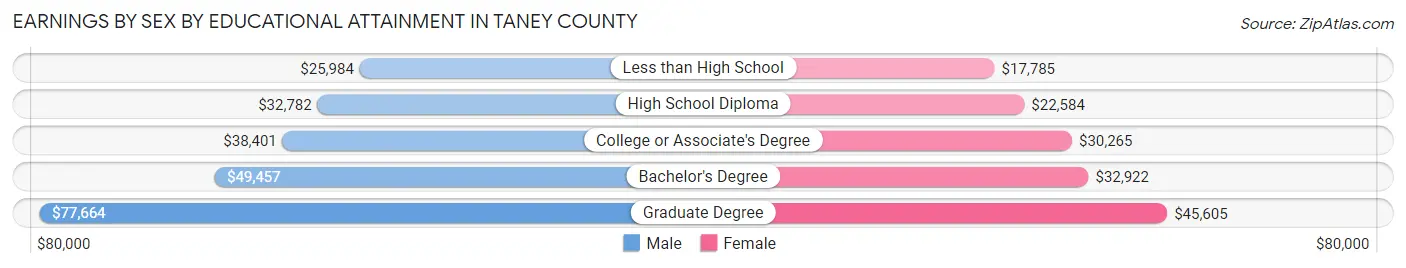
Earnings by Sex by Educational Attainment in Taney County
Average earnings in Taney County are $39,037 for men and $27,658 for women, a difference of 29.1%. Men with an educational attainment of graduate degree enjoy the highest average annual earnings of $77,664, while those with less than high school education earn the least with $25,984. Women with an educational attainment of graduate degree earn the most with the average annual earnings of $45,605, while those with less than high school education have the smallest earnings of $17,785.
| Educational Attainment | Male Income | Female Income |
| Less than High School | $25,984 | $17,785 |
| High School Diploma | $32,782 | $22,584 |
| College or Associate's Degree | $38,401 | $30,265 |
| Bachelor's Degree | $49,457 | $32,922 |
| Graduate Degree | $77,664 | $45,605 |
| Total | $39,037 | $27,658 |
Family Income in Taney County
Family Income Brackets in Taney County
According to the Taney County family income data, there are 3,547 families falling into the $50,000 to $74,999 income range, which is the most common income bracket and makes up 24.9% of all families. Conversely, the less than $10,000 income bracket is the least frequent group with only 299 families (2.1%) belonging to this category.
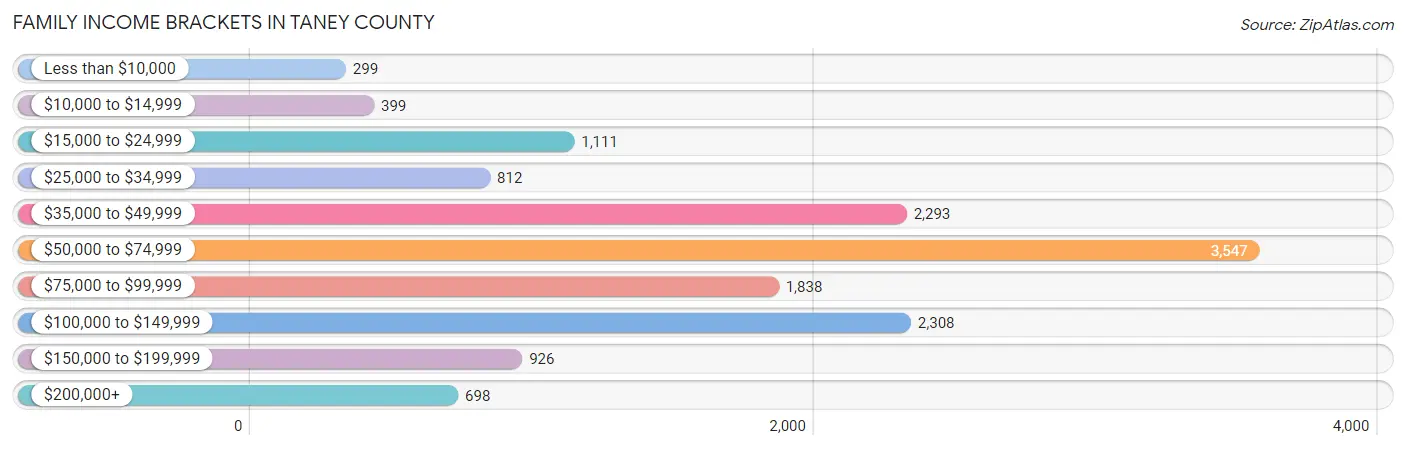
| Income Bracket | # Families | % Families |
| Less than $10,000 | 299 | 2.1% |
| $10,000 to $14,999 | 399 | 2.8% |
| $15,000 to $24,999 | 1,111 | 7.8% |
| $25,000 to $34,999 | 812 | 5.7% |
| $35,000 to $49,999 | 2,293 | 16.1% |
| $50,000 to $74,999 | 3,547 | 24.9% |
| $75,000 to $99,999 | 1,838 | 12.9% |
| $100,000 to $149,999 | 2,308 | 16.2% |
| $150,000 to $199,999 | 926 | 6.5% |
| $200,000+ | 698 | 4.9% |
Family Income by Famaliy Size in Taney County
7+ person families (102 | 0.7%) account for the highest median family income in Taney County with $90,455 per family, while 2-person families (7,951 | 55.8%) have the highest median income of $30,846 per family member.
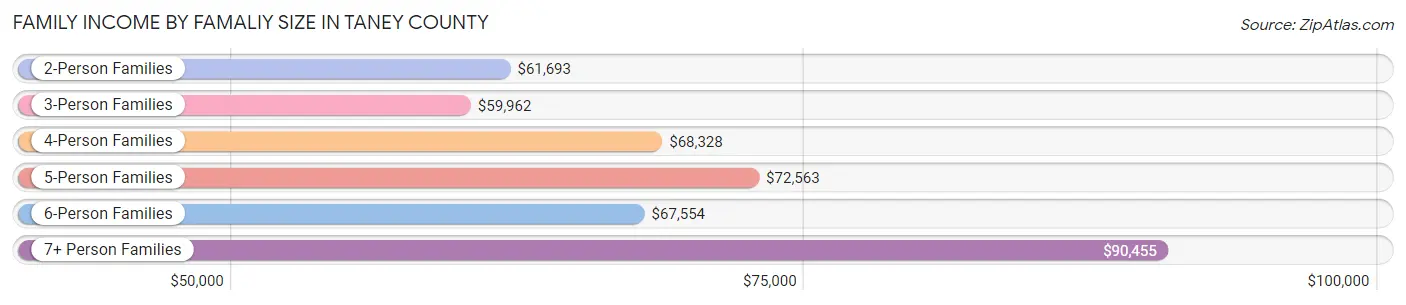
| Income Bracket | # Families | Median Income |
| 2-Person Families | 7,951 (55.8%) | $61,693 |
| 3-Person Families | 2,817 (19.8%) | $59,962 |
| 4-Person Families | 2,005 (14.1%) | $68,328 |
| 5-Person Families | 907 (6.4%) | $72,563 |
| 6-Person Families | 463 (3.3%) | $67,554 |
| 7+ Person Families | 102 (0.7%) | $90,455 |
| Total | 14,245 (100.0%) | $63,399 |
Family Income by Number of Earners in Taney County
The median family income in Taney County is $63,399, with families comprising 3+ earners (1,365) having the highest median family income of $108,997, while families with 1 earner (4,046) have the lowest median family income of $51,349, accounting for 9.6% and 28.4% of families, respectively.
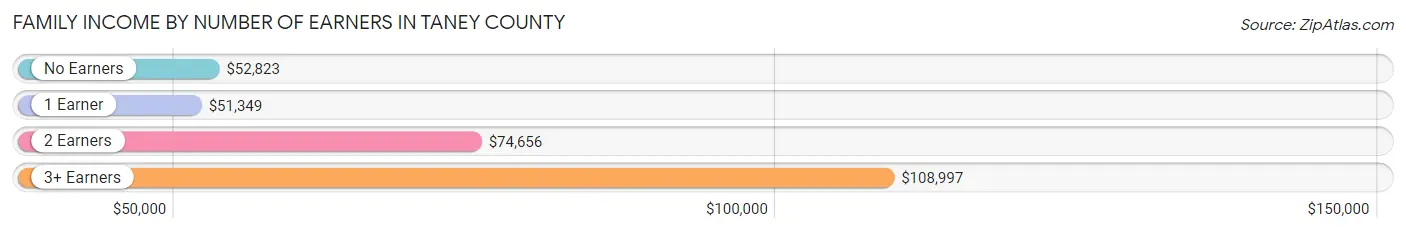
| Number of Earners | # Families | Median Income |
| No Earners | 3,252 (22.8%) | $52,823 |
| 1 Earner | 4,046 (28.4%) | $51,349 |
| 2 Earners | 5,582 (39.2%) | $74,656 |
| 3+ Earners | 1,365 (9.6%) | $108,997 |
| Total | 14,245 (100.0%) | $63,399 |
Household Income in Taney County
Household Income Brackets in Taney County
With 4,600 households falling in the category, the $50,000 to $74,999 income range is the most frequent in Taney County, accounting for 21.3% of all households. In contrast, only 756 households (3.5%) fall into the $200,000+ income bracket, making it the least populous group.
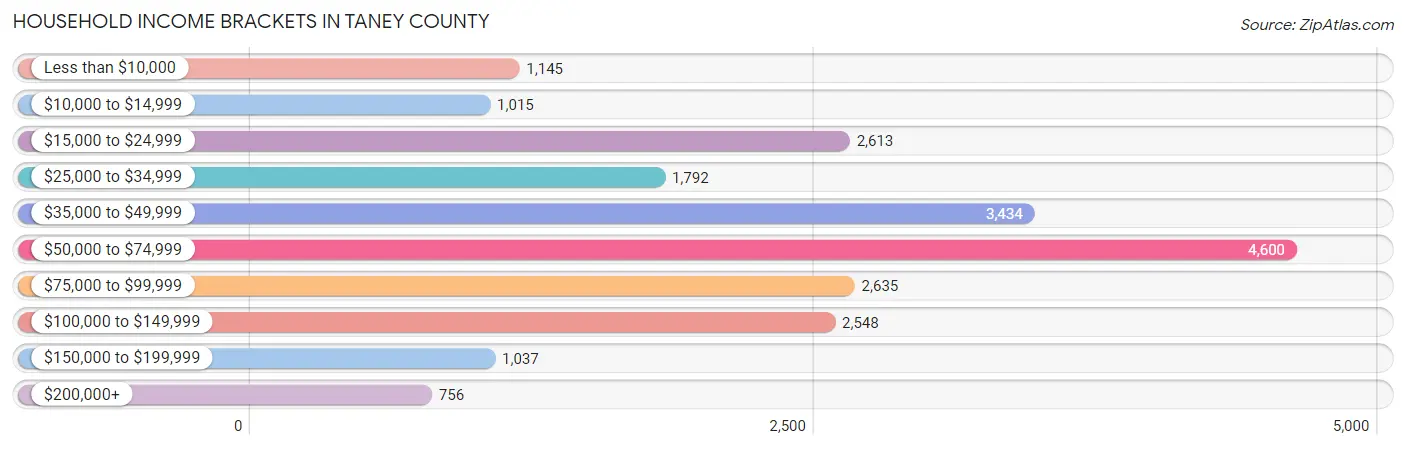
| Income Bracket | # Households | % Households |
| Less than $10,000 | 1,145 | 5.3% |
| $10,000 to $14,999 | 1,015 | 4.7% |
| $15,000 to $24,999 | 2,613 | 12.1% |
| $25,000 to $34,999 | 1,792 | 8.3% |
| $35,000 to $49,999 | 3,434 | 15.9% |
| $50,000 to $74,999 | 4,600 | 21.3% |
| $75,000 to $99,999 | 2,635 | 12.2% |
| $100,000 to $149,999 | 2,548 | 11.8% |
| $150,000 to $199,999 | 1,037 | 4.8% |
| $200,000+ | 756 | 3.5% |
Household Income by Householder Age in Taney County
The median household income in Taney County is $54,467, with the highest median household income of $61,036 found in the 45 to 64 years age bracket for the primary householder. A total of 7,456 households (34.5%) fall into this category. Meanwhile, the 65+ years age bracket for the primary householder has the lowest median household income of $45,684, with 7,705 households (35.7%) in this group.
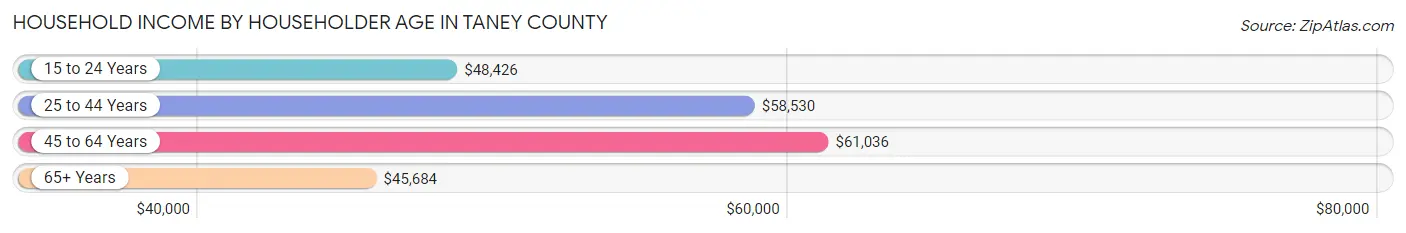
| Income Bracket | # Households | Median Income |
| 15 to 24 Years | 914 (4.2%) | $48,426 |
| 25 to 44 Years | 5,520 (25.6%) | $58,530 |
| 45 to 64 Years | 7,456 (34.5%) | $61,036 |
| 65+ Years | 7,705 (35.7%) | $45,684 |
| Total | 21,595 (100.0%) | $54,467 |
Poverty in Taney County
Income Below Poverty by Sex and Age in Taney County
With 13.9% poverty level for males and 18.8% for females among the residents of Taney County, 16 and 17 year old males and 16 and 17 year old females are the most vulnerable to poverty, with 363 males (43.3%) and 284 females (37.9%) in their respective age groups living below the poverty level.
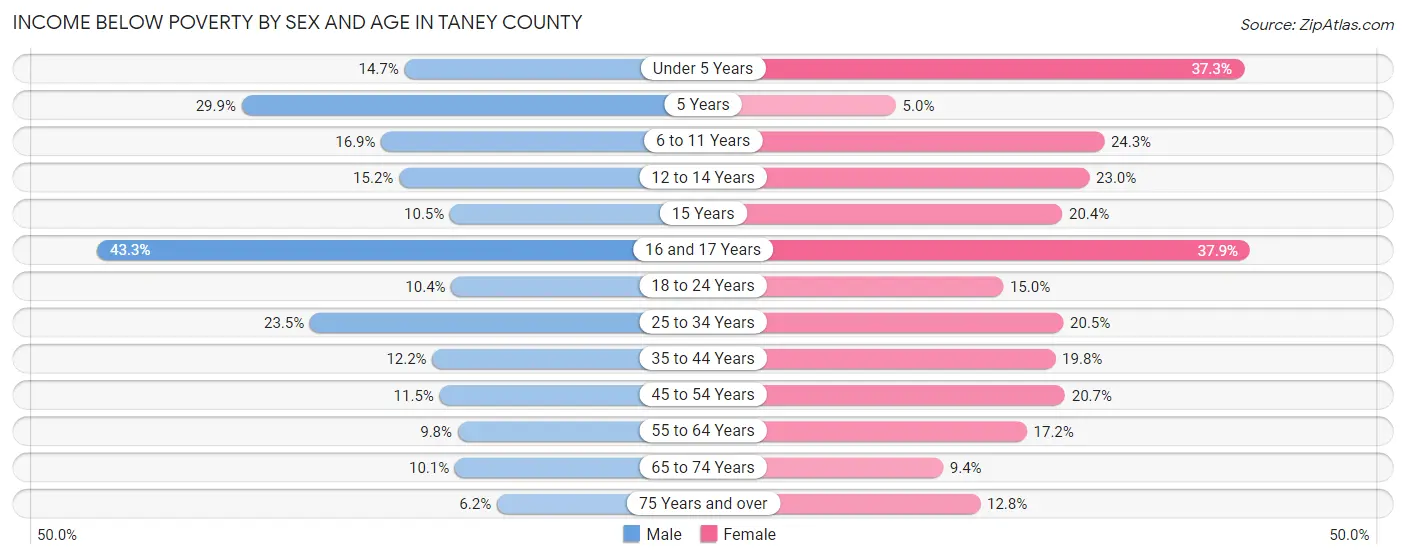
| Age Bracket | Male | Female |
| Under 5 Years | 189 (14.7%) | 567 (37.3%) |
| 5 Years | 80 (29.8%) | 20 (5.0%) |
| 6 to 11 Years | 326 (16.9%) | 411 (24.3%) |
| 12 to 14 Years | 144 (15.2%) | 241 (23.0%) |
| 15 Years | 33 (10.5%) | 56 (20.4%) |
| 16 and 17 Years | 363 (43.3%) | 284 (37.9%) |
| 18 to 24 Years | 248 (10.4%) | 324 (15.0%) |
| 25 to 34 Years | 718 (23.5%) | 669 (20.5%) |
| 35 to 44 Years | 336 (12.1%) | 625 (19.8%) |
| 45 to 54 Years | 365 (11.5%) | 707 (20.7%) |
| 55 to 64 Years | 342 (9.8%) | 665 (17.2%) |
| 65 to 74 Years | 336 (10.1%) | 362 (9.4%) |
| 75 Years and over | 143 (6.2%) | 352 (12.8%) |
| Total | 3,623 (13.9%) | 5,283 (18.8%) |
Income Above Poverty by Sex and Age in Taney County
According to the poverty statistics in Taney County, males aged 75 years and over and females aged 5 years are the age groups that are most secure financially, with 93.8% of males and 95.0% of females in these age groups living above the poverty line.
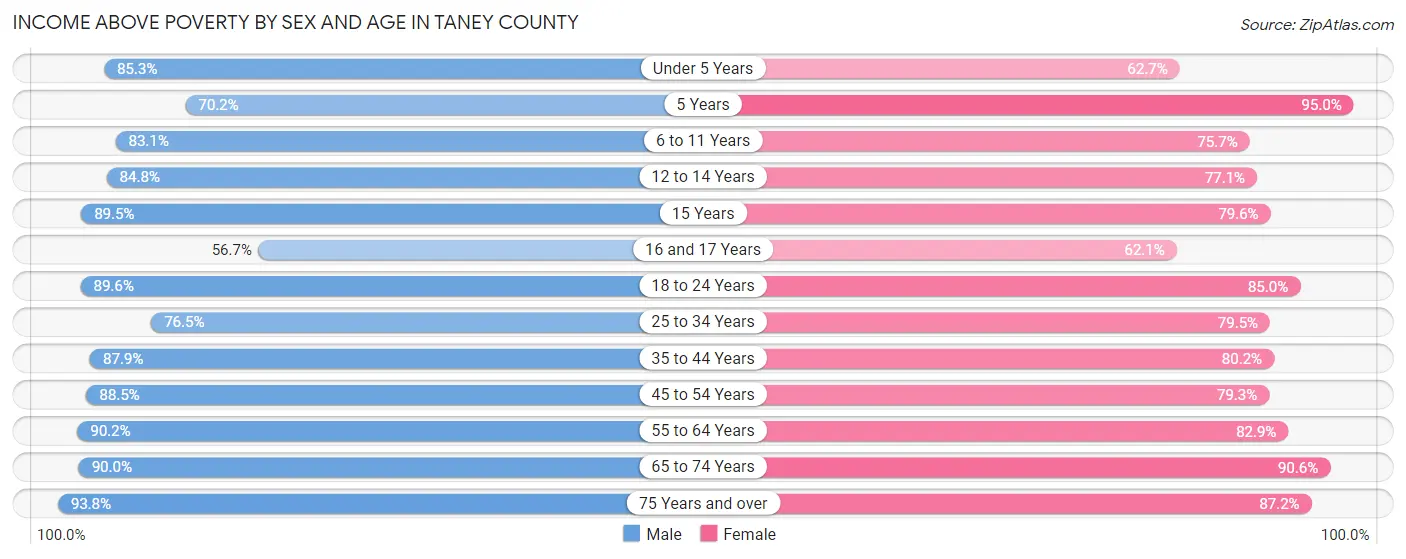
| Age Bracket | Male | Female |
| Under 5 Years | 1,093 (85.3%) | 953 (62.7%) |
| 5 Years | 188 (70.2%) | 380 (95.0%) |
| 6 to 11 Years | 1,604 (83.1%) | 1,278 (75.7%) |
| 12 to 14 Years | 801 (84.8%) | 809 (77.0%) |
| 15 Years | 281 (89.5%) | 218 (79.6%) |
| 16 and 17 Years | 476 (56.7%) | 466 (62.1%) |
| 18 to 24 Years | 2,140 (89.6%) | 1,842 (85.0%) |
| 25 to 34 Years | 2,336 (76.5%) | 2,588 (79.5%) |
| 35 to 44 Years | 2,429 (87.8%) | 2,532 (80.2%) |
| 45 to 54 Years | 2,815 (88.5%) | 2,708 (79.3%) |
| 55 to 64 Years | 3,151 (90.2%) | 3,213 (82.9%) |
| 65 to 74 Years | 3,008 (89.9%) | 3,499 (90.6%) |
| 75 Years and over | 2,177 (93.8%) | 2,391 (87.2%) |
| Total | 22,499 (86.1%) | 22,877 (81.2%) |
Income Below Poverty Among Married-Couple Families in Taney County
The poverty statistics for married-couple families in Taney County show that 8.4% or 992 of the total 11,852 families live below the poverty line. Families with 3 or 4 children have the highest poverty rate of 23.2%, comprising of 191 families. On the other hand, families with no children have the lowest poverty rate of 6.5%, which includes 514 families.
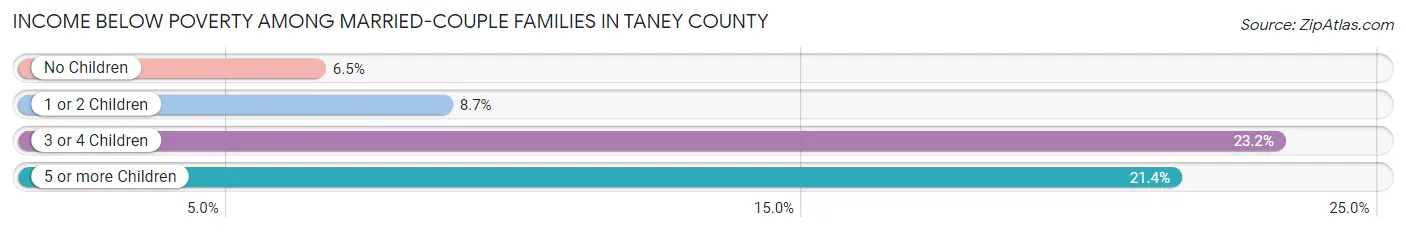
| Children | Above Poverty | Below Poverty |
| No Children | 7,354 (93.5%) | 514 (6.5%) |
| 1 or 2 Children | 2,809 (91.3%) | 269 (8.7%) |
| 3 or 4 Children | 631 (76.8%) | 191 (23.2%) |
| 5 or more Children | 66 (78.6%) | 18 (21.4%) |
| Total | 10,860 (91.6%) | 992 (8.4%) |
Income Below Poverty Among Single-Parent Households in Taney County
According to the poverty data in Taney County, 8.1% or 57 single-father households and 34.7% or 587 single-mother households are living below the poverty line. Among single-father households, those with 3 or 4 children have the highest poverty rate, with 5 households (16.7%) experiencing poverty. Likewise, among single-mother households, those with 1 or 2 children have the highest poverty rate, with 400 households (47.3%) falling below the poverty line.
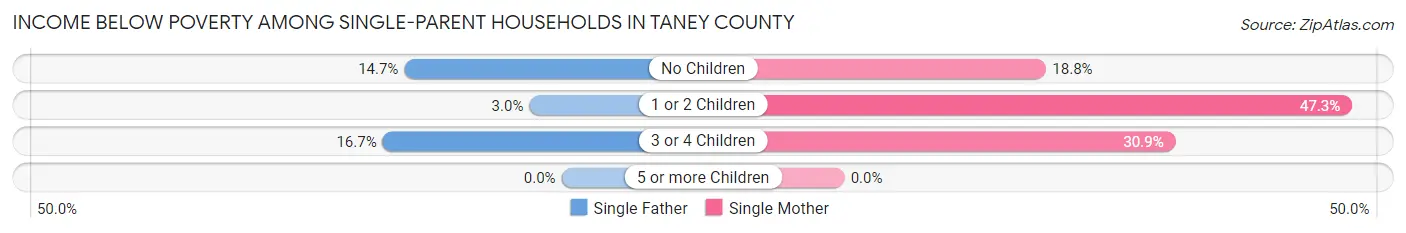
| Children | Single Father | Single Mother |
| No Children | 40 (14.6%) | 115 (18.8%) |
| 1 or 2 Children | 12 (3.0%) | 400 (47.3%) |
| 3 or 4 Children | 5 (16.7%) | 72 (30.9%) |
| 5 or more Children | 0 (0.0%) | 0 (0.0%) |
| Total | 57 (8.1%) | 587 (34.7%) |
Income Below Poverty Among Married-Couple vs Single-Parent Households in Taney County
The poverty data for Taney County shows that 992 of the married-couple family households (8.4%) and 644 of the single-parent households (26.9%) are living below the poverty level. Within the married-couple family households, those with 3 or 4 children have the highest poverty rate, with 191 households (23.2%) falling below the poverty line. Among the single-parent households, those with 1 or 2 children have the highest poverty rate, with 412 household (33.1%) living below poverty.
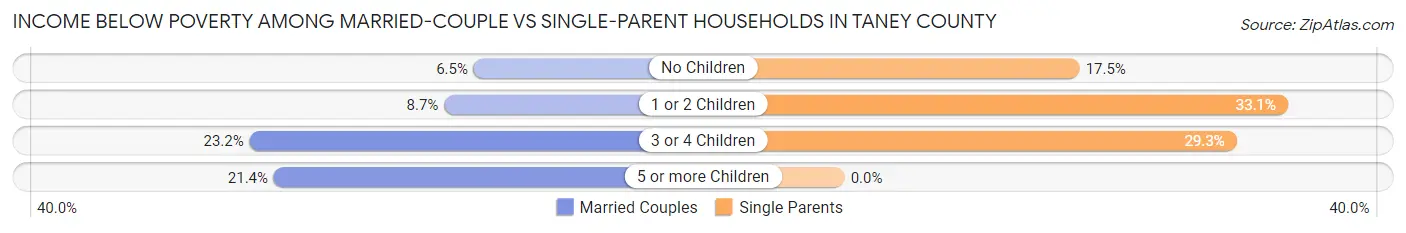
| Children | Married-Couple Families | Single-Parent Households |
| No Children | 514 (6.5%) | 155 (17.5%) |
| 1 or 2 Children | 269 (8.7%) | 412 (33.1%) |
| 3 or 4 Children | 191 (23.2%) | 77 (29.3%) |
| 5 or more Children | 18 (21.4%) | 0 (0.0%) |
| Total | 992 (8.4%) | 644 (26.9%) |
Race in Taney County
The most populous races in Taney County are White / Caucasian (50,055 | 89.1%), Hispanic or Latino (3,563 | 6.3%), and Two or more Races (3,161 | 5.6%).
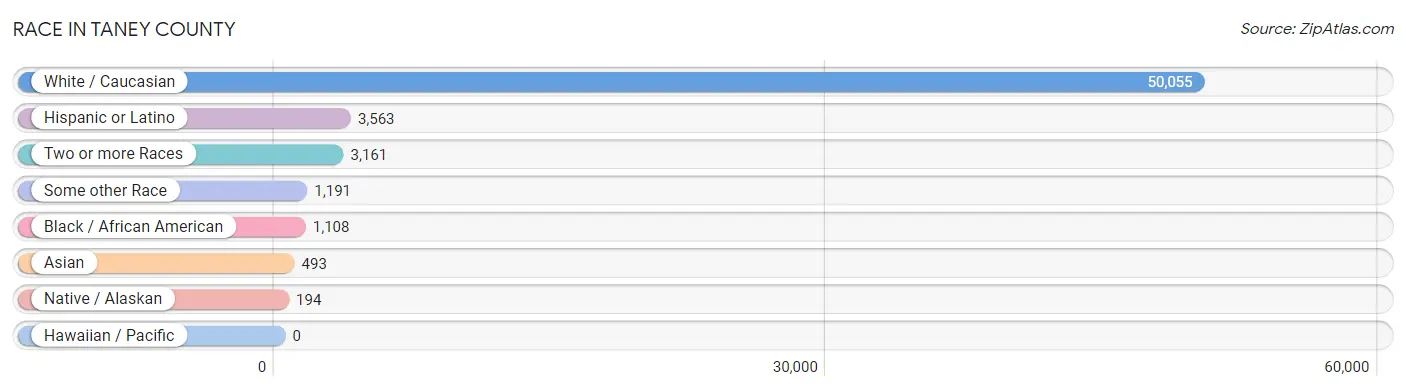
| Race | # Population | % Population |
| Asian | 493 | 0.9% |
| Black / African American | 1,108 | 2.0% |
| Hawaiian / Pacific | 0 | 0.0% |
| Hispanic or Latino | 3,563 | 6.3% |
| Native / Alaskan | 194 | 0.4% |
| White / Caucasian | 50,055 | 89.1% |
| Two or more Races | 3,161 | 5.6% |
| Some other Race | 1,191 | 2.1% |
| Total | 56,202 | 100.0% |
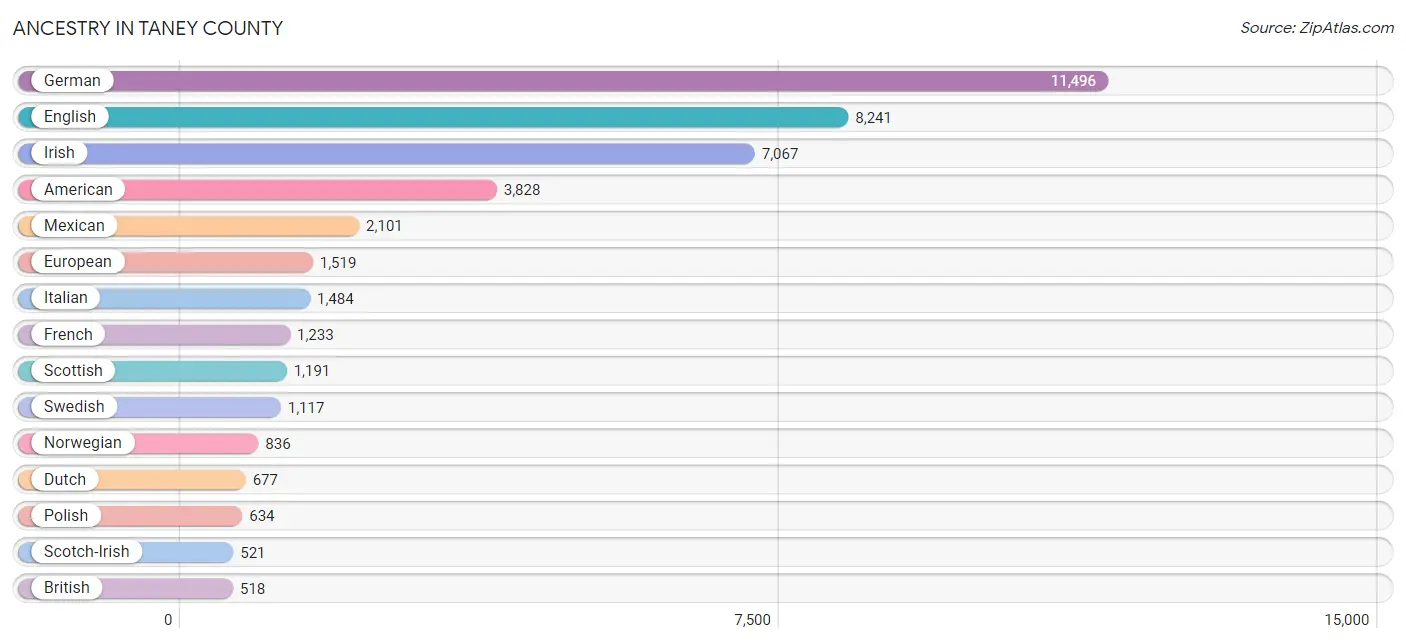
Ancestry in Taney County
The most populous ancestries reported in Taney County are German (11,496 | 20.4%), English (8,241 | 14.7%), Irish (7,067 | 12.6%), American (3,828 | 6.8%), and Mexican (2,101 | 3.7%), together accounting for 58.2% of all Taney County residents.
| Ancestry | # Population | % Population |
| African | 127 | 0.2% |
| American | 3,828 | 6.8% |
| Arab | 185 | 0.3% |
| Armenian | 4 | 0.0% |
| Assyrian / Chaldean / Syriac | 11 | 0.0% |
| Austrian | 39 | 0.1% |
| Belgian | 85 | 0.2% |
| Belizean | 230 | 0.4% |
| Bhutanese | 48 | 0.1% |
| Blackfeet | 13 | 0.0% |
| Brazilian | 41 | 0.1% |
| British | 518 | 0.9% |
| Burmese | 25 | 0.0% |
| Cajun | 5 | 0.0% |
| Canadian | 59 | 0.1% |
| Celtic | 5 | 0.0% |
| Central American | 304 | 0.5% |
| Central American Indian | 10 | 0.0% |
| Cherokee | 513 | 0.9% |
| Cheyenne | 9 | 0.0% |
| Chickasaw | 5 | 0.0% |
| Chippewa | 82 | 0.2% |
| Choctaw | 32 | 0.1% |
| Colombian | 4 | 0.0% |
| Costa Rican | 88 | 0.2% |
| Creek | 12 | 0.0% |
| Croatian | 8 | 0.0% |
| Crow | 4 | 0.0% |
| Cuban | 194 | 0.4% |
| Czech | 167 | 0.3% |
| Czechoslovakian | 34 | 0.1% |
| Danish | 103 | 0.2% |
| Dominican | 51 | 0.1% |
| Dutch | 677 | 1.2% |
| Eastern European | 4 | 0.0% |
| English | 8,241 | 14.7% |
| Estonian | 21 | 0.0% |
| Ethiopian | 106 | 0.2% |
| European | 1,519 | 2.7% |
| French | 1,233 | 2.2% |
| French American Indian | 139 | 0.3% |
| French Canadian | 158 | 0.3% |
| German | 11,496 | 20.4% |
| Greek | 27 | 0.1% |
| Guatemalan | 84 | 0.2% |
| Honduran | 18 | 0.0% |
| Hungarian | 39 | 0.1% |
| Indian (Asian) | 139 | 0.3% |
| Iranian | 1 | 0.0% |
| Irish | 7,067 | 12.6% |
| Italian | 1,484 | 2.6% |
| Jamaican | 109 | 0.2% |
| Jordanian | 4 | 0.0% |
| Korean | 263 | 0.5% |
| Lebanese | 177 | 0.3% |
| Lithuanian | 38 | 0.1% |
| Lumbee | 3 | 0.0% |
| Luxembourger | 1 | 0.0% |
| Mexican | 2,101 | 3.7% |
| Mexican American Indian | 18 | 0.0% |
| Nigerian | 16 | 0.0% |
| Northern European | 49 | 0.1% |
| Norwegian | 836 | 1.5% |
| Osage | 4 | 0.0% |
| Pakistani | 119 | 0.2% |
| Pennsylvania German | 11 | 0.0% |
| Polish | 634 | 1.1% |
| Portuguese | 174 | 0.3% |
| Potawatomi | 4 | 0.0% |
| Puerto Rican | 420 | 0.7% |
| Romanian | 131 | 0.2% |
| Russian | 350 | 0.6% |
| Salvadoran | 114 | 0.2% |
| Scandinavian | 266 | 0.5% |
| Scotch-Irish | 521 | 0.9% |
| Scottish | 1,191 | 2.1% |
| Shoshone | 9 | 0.0% |
| Sioux | 28 | 0.1% |
| Slovak | 10 | 0.0% |
| South American | 4 | 0.0% |
| Spaniard | 166 | 0.3% |
| Spanish | 42 | 0.1% |
| Sri Lankan | 18 | 0.0% |
| Subsaharan African | 249 | 0.4% |
| Swedish | 1,117 | 2.0% |
| Swiss | 174 | 0.3% |
| Thai | 170 | 0.3% |
| Ukrainian | 66 | 0.1% |
| Welsh | 463 | 0.8% |
| West Indian | 11 | 0.0% | View All 90 Rows |
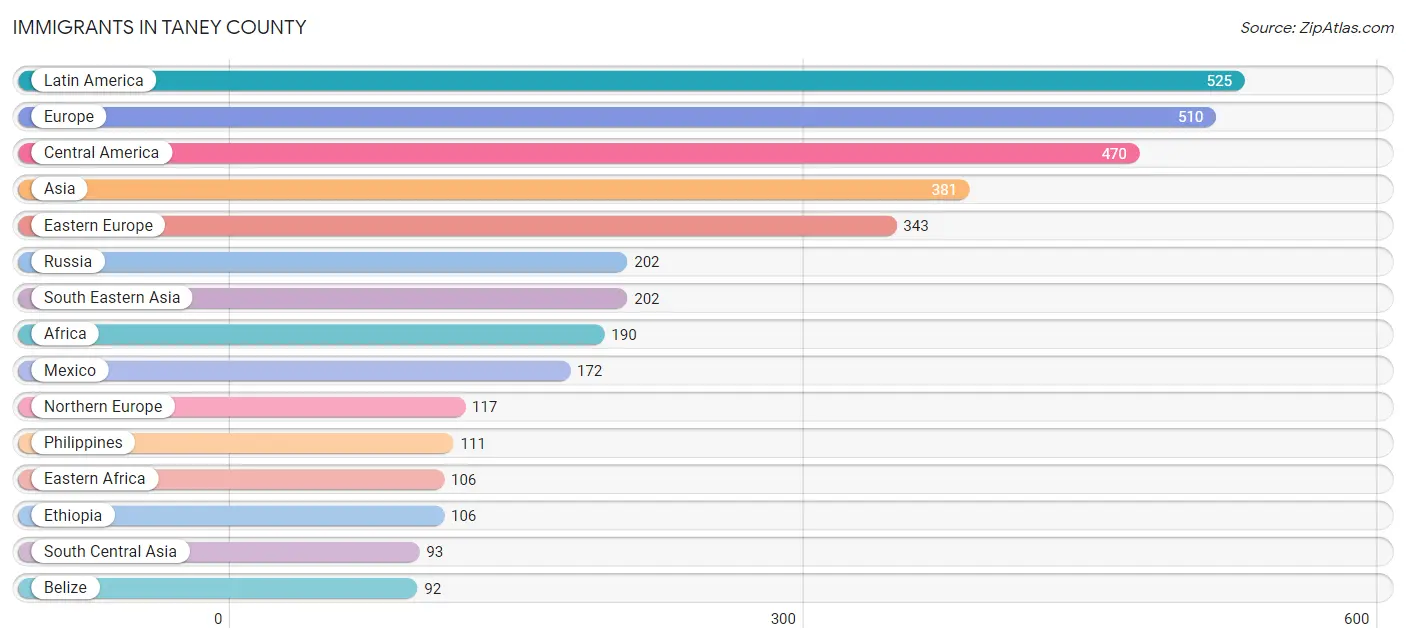
Immigrants in Taney County
The most numerous immigrant groups reported in Taney County came from Latin America (525 | 0.9%), Europe (510 | 0.9%), Central America (470 | 0.8%), Asia (381 | 0.7%), and Eastern Europe (343 | 0.6%), together accounting for 4.0% of all Taney County residents.
| Immigration Origin | # Population | % Population |
| Africa | 190 | 0.3% |
| Asia | 381 | 0.7% |
| Bangladesh | 5 | 0.0% |
| Belize | 92 | 0.2% |
| Brazil | 4 | 0.0% |
| Canada | 2 | 0.0% |
| Caribbean | 51 | 0.1% |
| Central America | 470 | 0.8% |
| China | 76 | 0.1% |
| Costa Rica | 27 | 0.1% |
| Denmark | 12 | 0.0% |
| Dominican Republic | 51 | 0.1% |
| Eastern Africa | 106 | 0.2% |
| Eastern Asia | 86 | 0.2% |
| Eastern Europe | 343 | 0.6% |
| El Salvador | 77 | 0.1% |
| England | 71 | 0.1% |
| Ethiopia | 106 | 0.2% |
| Europe | 510 | 0.9% |
| Germany | 34 | 0.1% |
| Guatemala | 84 | 0.2% |
| Honduras | 18 | 0.0% |
| India | 78 | 0.1% |
| Indonesia | 5 | 0.0% |
| Kazakhstan | 10 | 0.0% |
| Korea | 10 | 0.0% |
| Latin America | 525 | 0.9% |
| Mexico | 172 | 0.3% |
| Middle Africa | 1 | 0.0% |
| Netherlands | 16 | 0.0% |
| Nigeria | 9 | 0.0% |
| Northern Europe | 117 | 0.2% |
| Philippines | 111 | 0.2% |
| Poland | 69 | 0.1% |
| Romania | 25 | 0.0% |
| Russia | 202 | 0.4% |
| Scotland | 17 | 0.0% |
| South America | 4 | 0.0% |
| South Central Asia | 93 | 0.2% |
| South Eastern Asia | 202 | 0.4% |
| Thailand | 70 | 0.1% |
| Ukraine | 26 | 0.1% |
| Vietnam | 16 | 0.0% |
| Western Africa | 83 | 0.2% |
| Western Europe | 50 | 0.1% |
| Zaire | 1 | 0.0% | View All 46 Rows |
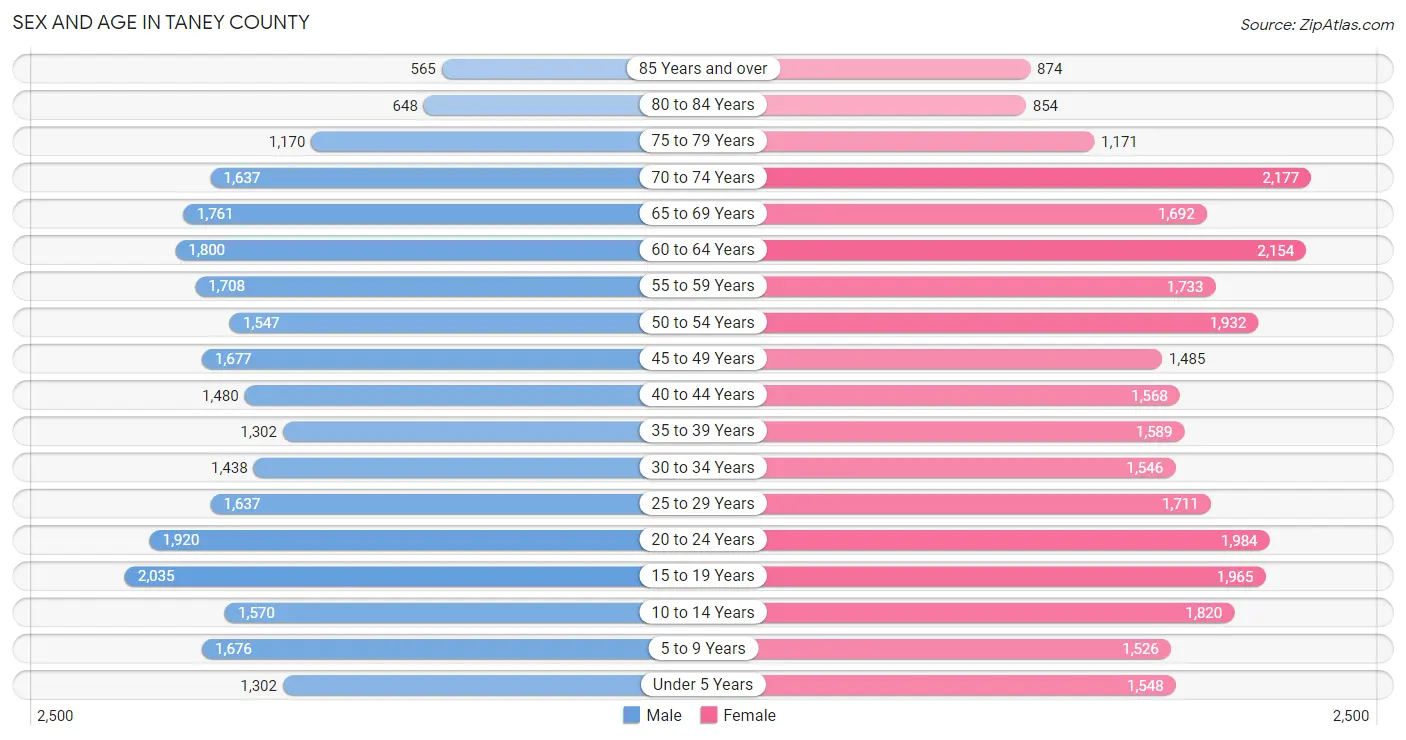
Sex and Age in Taney County
Sex and Age in Taney County
The most populous age groups in Taney County are 15 to 19 Years (2,035 | 7.6%) for men and 70 to 74 Years (2,177 | 7.4%) for women.
| Age Bracket | Male | Female |
| Under 5 Years | 1,302 (4.9%) | 1,548 (5.3%) |
| 5 to 9 Years | 1,676 (6.2%) | 1,526 (5.2%) |
| 10 to 14 Years | 1,570 (5.8%) | 1,820 (6.2%) |
| 15 to 19 Years | 2,035 (7.6%) | 1,965 (6.7%) |
| 20 to 24 Years | 1,920 (7.1%) | 1,984 (6.8%) |
| 25 to 29 Years | 1,637 (6.1%) | 1,711 (5.8%) |
| 30 to 34 Years | 1,438 (5.3%) | 1,546 (5.3%) |
| 35 to 39 Years | 1,302 (4.9%) | 1,589 (5.4%) |
| 40 to 44 Years | 1,480 (5.5%) | 1,568 (5.3%) |
| 45 to 49 Years | 1,677 (6.2%) | 1,485 (5.1%) |
| 50 to 54 Years | 1,547 (5.8%) | 1,932 (6.6%) |
| 55 to 59 Years | 1,708 (6.4%) | 1,733 (5.9%) |
| 60 to 64 Years | 1,800 (6.7%) | 2,154 (7.3%) |
| 65 to 69 Years | 1,761 (6.6%) | 1,692 (5.8%) |
| 70 to 74 Years | 1,637 (6.1%) | 2,177 (7.4%) |
| 75 to 79 Years | 1,170 (4.3%) | 1,171 (4.0%) |
| 80 to 84 Years | 648 (2.4%) | 854 (2.9%) |
| 85 Years and over | 565 (2.1%) | 874 (3.0%) |
| Total | 26,873 (100.0%) | 29,329 (100.0%) |
Families and Households in Taney County
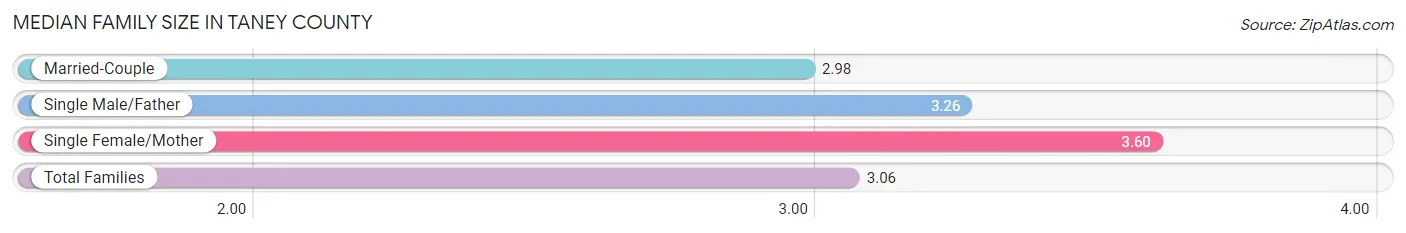
Median Family Size in Taney County
The median family size in Taney County is 3.06 persons per family, with single female/mother families (1,690 | 11.9%) accounting for the largest median family size of 3.6 persons per family. On the other hand, married-couple families (11,852 | 83.2%) represent the smallest median family size with 2.98 persons per family.
| Family Type | # Families | Family Size |
| Married-Couple | 11,852 (83.2%) | 2.98 |
| Single Male/Father | 703 (4.9%) | 3.26 |
| Single Female/Mother | 1,690 (11.9%) | 3.60 |
| Total Families | 14,245 (100.0%) | 3.06 |
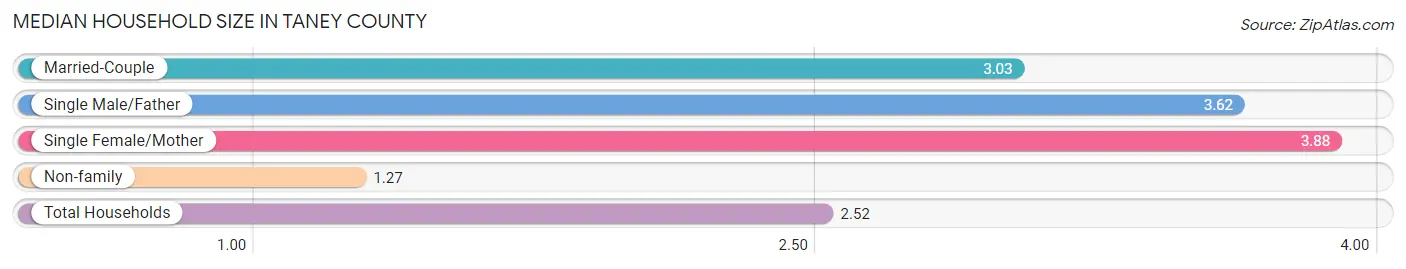
Median Household Size in Taney County
The median household size in Taney County is 2.52 persons per household, with single female/mother households (1,690 | 7.8%) accounting for the largest median household size of 3.88 persons per household. non-family households (7,350 | 34.0%) represent the smallest median household size with 1.27 persons per household.
| Household Type | # Households | Household Size |
| Married-Couple | 11,852 (54.9%) | 3.03 |
| Single Male/Father | 703 (3.3%) | 3.62 |
| Single Female/Mother | 1,690 (7.8%) | 3.88 |
| Non-family | 7,350 (34.0%) | 1.27 |
| Total Households | 21,595 (100.0%) | 2.52 |
Household Size by Marriage Status in Taney County
Out of a total of 21,595 households in Taney County, 14,245 (66.0%) are family households, while 7,350 (34.0%) are nonfamily households. The most numerous type of family households are 2-person households, comprising 7,561, and the most common type of nonfamily households are 1-person households, comprising 6,122.
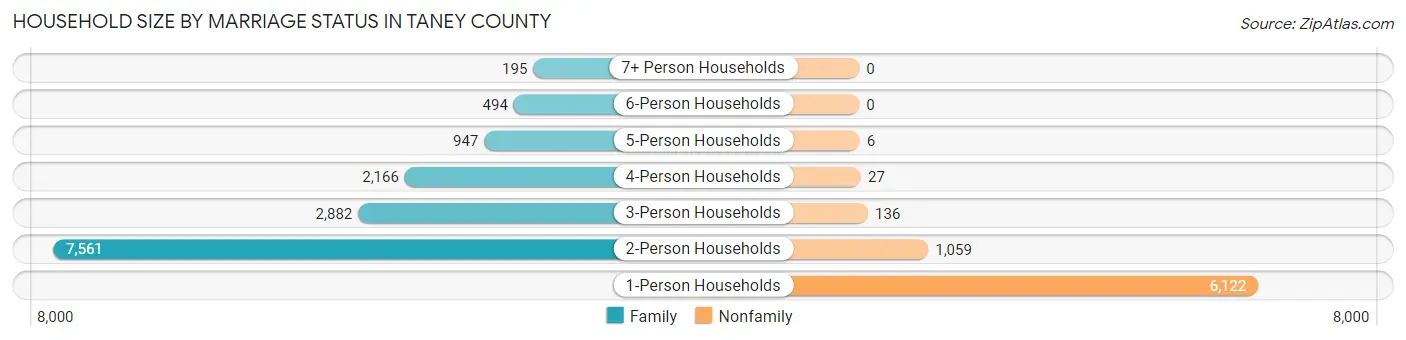
| Household Size | Family Households | Nonfamily Households |
| 1-Person Households | - | 6,122 (28.3%) |
| 2-Person Households | 7,561 (35.0%) | 1,059 (4.9%) |
| 3-Person Households | 2,882 (13.4%) | 136 (0.6%) |
| 4-Person Households | 2,166 (10.0%) | 27 (0.1%) |
| 5-Person Households | 947 (4.4%) | 6 (0.0%) |
| 6-Person Households | 494 (2.3%) | 0 (0.0%) |
| 7+ Person Households | 195 (0.9%) | 0 (0.0%) |
| Total | 14,245 (66.0%) | 7,350 (34.0%) |
Female Fertility in Taney County
Fertility by Age in Taney County
Average fertility rate in Taney County is 73.0 births per 1,000 women. Women in the age bracket of 20 to 34 years have the highest fertility rate with 108.0 births per 1,000 women. Women in the age bracket of 20 to 34 years acount for 63.9% of all women with births.
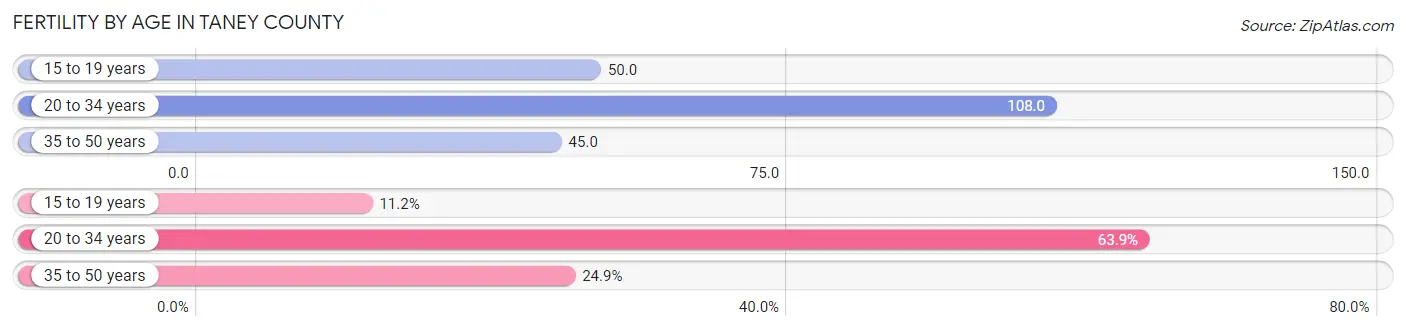
| Age Bracket | Women with Births | Births / 1,000 Women |
| 15 to 19 years | 99 (11.2%) | 50.0 |
| 20 to 34 years | 567 (63.9%) | 108.0 |
| 35 to 50 years | 221 (24.9%) | 45.0 |
| Total | 887 (100.0%) | 73.0 |
Fertility by Age by Marriage Status in Taney County
70.6% of women with births (887) in Taney County are married. The highest percentage of unmarried women with births falls into 15 to 19 years age bracket with 100.0% of them unmarried at the time of birth, while the lowest percentage of unmarried women with births belong to 20 to 34 years age bracket with 13.8% of them unmarried.
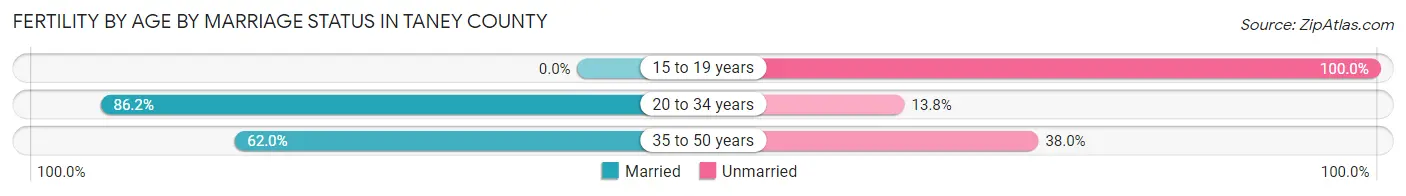
| Age Bracket | Married | Unmarried |
| 15 to 19 years | 0 (0.0%) | 99 (100.0%) |
| 20 to 34 years | 489 (86.2%) | 78 (13.8%) |
| 35 to 50 years | 137 (62.0%) | 84 (38.0%) |
| Total | 626 (70.6%) | 261 (29.4%) |
Fertility by Education in Taney County
Average fertility rate in Taney County is 73.0 births per 1,000 women. Women with the education attainment of graduate degree have the highest fertility rate of 207.0 births per 1,000 women, while women with the education attainment of bachelor's degree have the lowest fertility at 24.0 births per 1,000 women. Women with the education attainment of college or associate's degree represent 33.5% of all women with births.
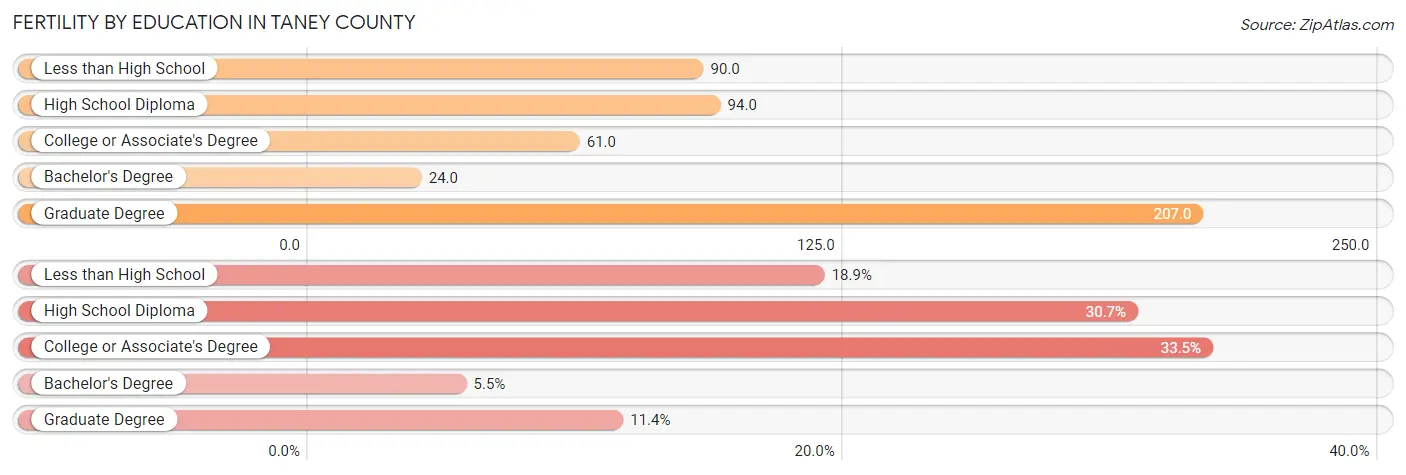
| Educational Attainment | Women with Births | Births / 1,000 Women |
| Less than High School | 168 (18.9%) | 90.0 |
| High School Diploma | 272 (30.7%) | 94.0 |
| College or Associate's Degree | 297 (33.5%) | 61.0 |
| Bachelor's Degree | 49 (5.5%) | 24.0 |
| Graduate Degree | 101 (11.4%) | 207.0 |
| Total | 887 (100.0%) | 73.0 |
Fertility by Education by Marriage Status in Taney County
29.4% of women with births in Taney County are unmarried. Women with the educational attainment of bachelor's degree are most likely to be married with 100.0% of them married at childbirth, while women with the educational attainment of less than high school are least likely to be married with 58.3% of them unmarried at childbirth.
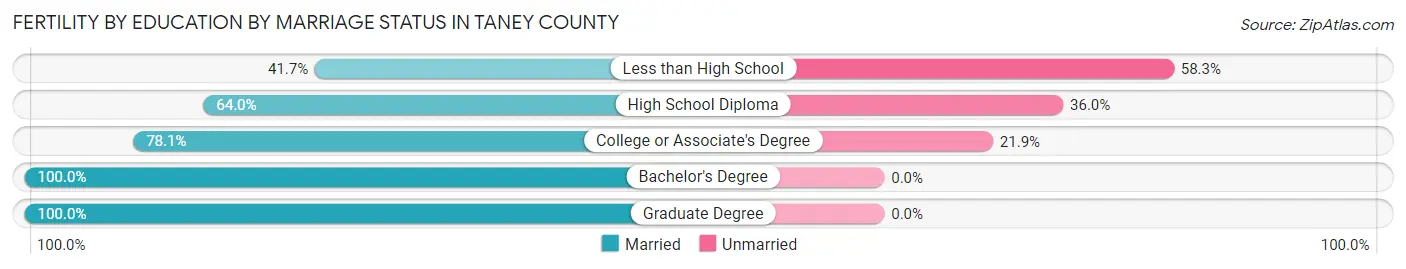
| Educational Attainment | Married | Unmarried |
| Less than High School | 70 (41.7%) | 98 (58.3%) |
| High School Diploma | 174 (64.0%) | 98 (36.0%) |
| College or Associate's Degree | 232 (78.1%) | 65 (21.9%) |
| Bachelor's Degree | 49 (100.0%) | 0 (0.0%) |
| Graduate Degree | 101 (100.0%) | 0 (0.0%) |
| Total | 626 (70.6%) | 261 (29.4%) |
Employment Characteristics in Taney County
Employment by Class of Employer in Taney County
Among the 24,653 employed individuals in Taney County, private company employees (16,718 | 67.8%), not-for-profit organizations (2,203 | 8.9%), and local government employees (1,926 | 7.8%) make up the most common classes of employment.
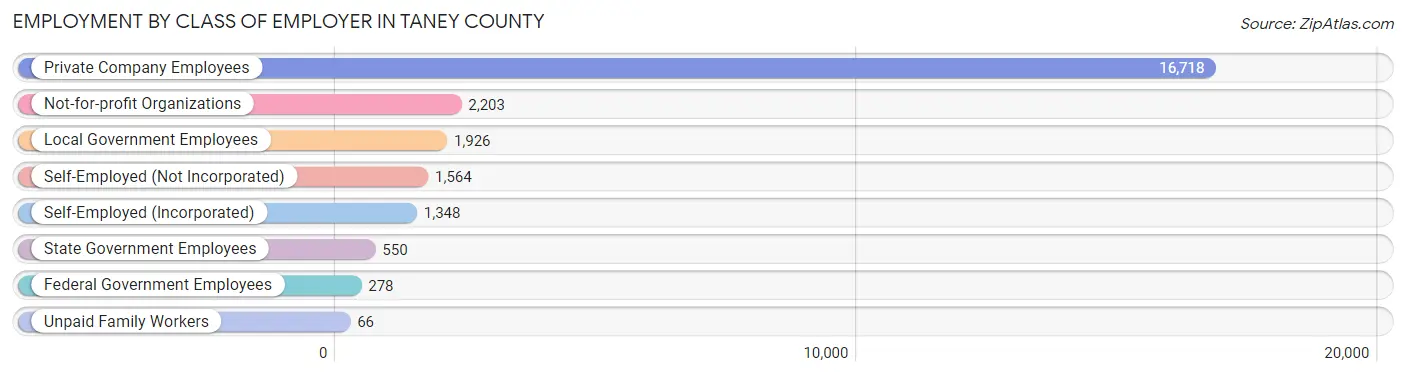
| Employer Class | # Employees | % Employees |
| Private Company Employees | 16,718 | 67.8% |
| Self-Employed (Incorporated) | 1,348 | 5.5% |
| Self-Employed (Not Incorporated) | 1,564 | 6.3% |
| Not-for-profit Organizations | 2,203 | 8.9% |
| Local Government Employees | 1,926 | 7.8% |
| State Government Employees | 550 | 2.2% |
| Federal Government Employees | 278 | 1.1% |
| Unpaid Family Workers | 66 | 0.3% |
| Total | 24,653 | 100.0% |
Employment Status by Age in Taney County
According to the labor force statistics for Taney County, out of the total population over 16 years of age (46,171), 58.2% or 26,872 individuals are in the labor force, with 5.1% or 1,370 of them unemployed. The age group with the highest labor force participation rate is 35 to 44 years, with 85.9% or 5,102 individuals in the labor force. Within the labor force, the 65 to 74 years age range has the highest percentage of unemployed individuals, with 10.4% or 179 of them being unemployed.
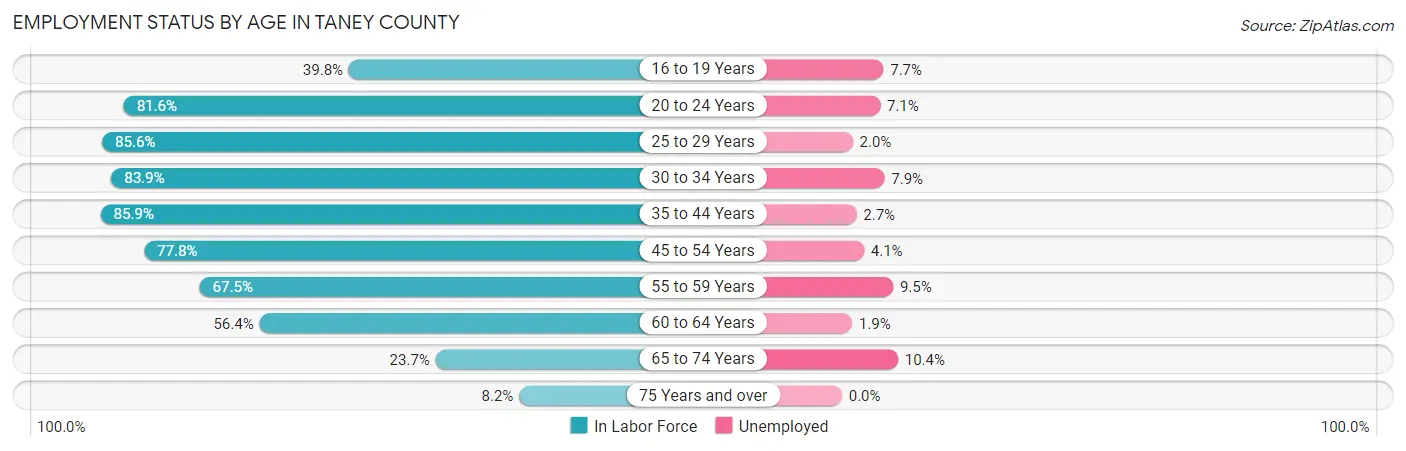
| Age Bracket | In Labor Force | Unemployed |
| 16 to 19 Years | 1,358 (39.8%) | 105 (7.7%) |
| 20 to 24 Years | 3,186 (81.6%) | 226 (7.1%) |
| 25 to 29 Years | 2,866 (85.6%) | 57 (2.0%) |
| 30 to 34 Years | 2,504 (83.9%) | 198 (7.9%) |
| 35 to 44 Years | 5,102 (85.9%) | 138 (2.7%) |
| 45 to 54 Years | 5,167 (77.8%) | 212 (4.1%) |
| 55 to 59 Years | 2,323 (67.5%) | 221 (9.5%) |
| 60 to 64 Years | 2,230 (56.4%) | 42 (1.9%) |
| 65 to 74 Years | 1,722 (23.7%) | 179 (10.4%) |
| 75 Years and over | 433 (8.2%) | 0 (0.0%) |
| Total | 26,872 (58.2%) | 1,370 (5.1%) |
Employment Status by Educational Attainment in Taney County
According to labor force statistics for Taney County, 76.7% of individuals (20,177) out of the total population between 25 and 64 years of age (26,307) are in the labor force, with 4.3% or 868 of them being unemployed. The group with the highest labor force participation rate are those with the educational attainment of bachelor's degree or higher, with 89.6% or 5,857 individuals in the labor force. Within the labor force, individuals with less than high school education have the highest percentage of unemployment, with 10.6% or 169 of them being unemployed.
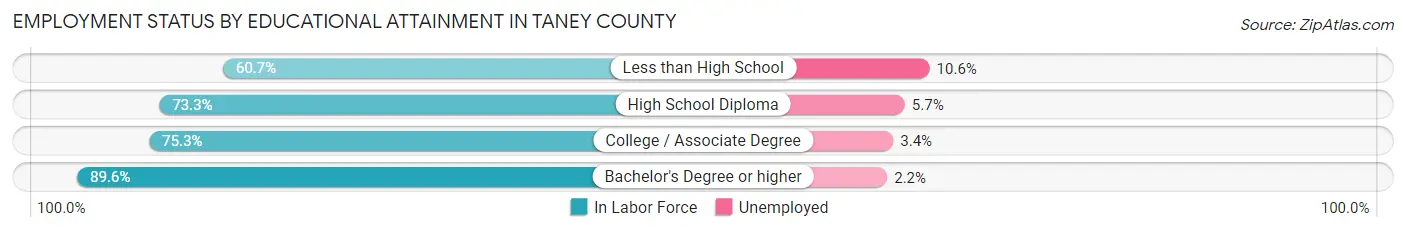
| Educational Attainment | In Labor Force | Unemployed |
| Less than High School | 1,598 (60.7%) | 279 (10.6%) |
| High School Diploma | 6,278 (73.3%) | 488 (5.7%) |
| College / Associate Degree | 6,455 (75.3%) | 291 (3.4%) |
| Bachelor's Degree or higher | 5,857 (89.6%) | 144 (2.2%) |
| Total | 20,177 (76.7%) | 1,131 (4.3%) |
Employment Occupations by Sex in Taney County
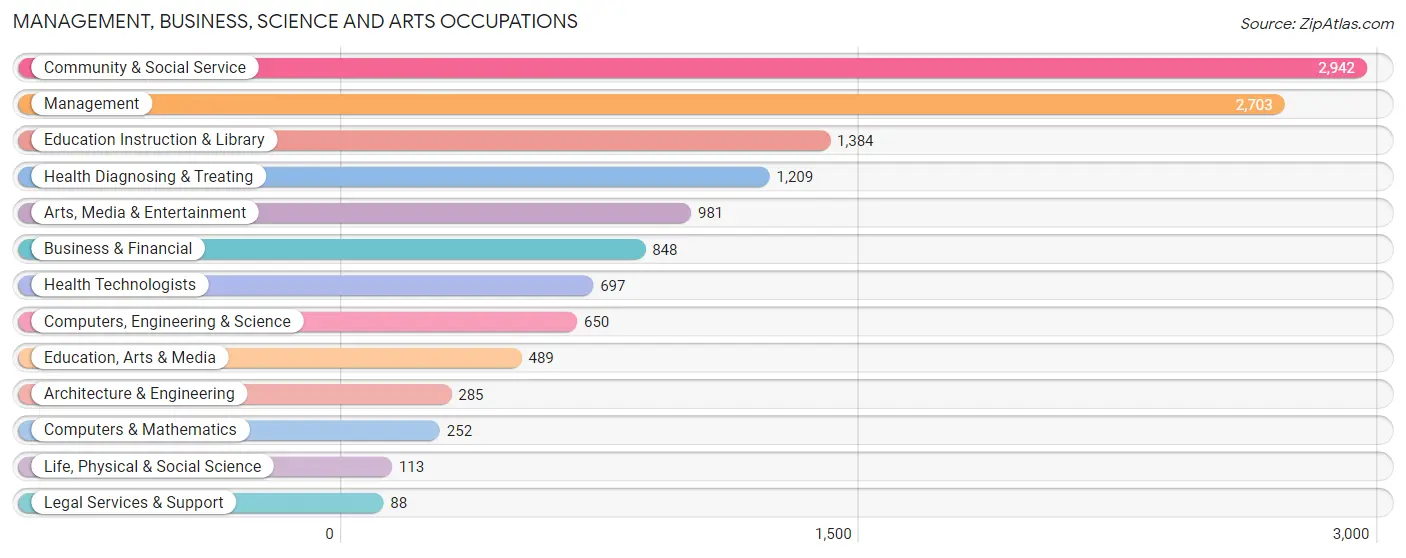
Management, Business, Science and Arts Occupations
The most common Management, Business, Science and Arts occupations in Taney County are Community & Social Service (2,942 | 11.5%), Management (2,703 | 10.6%), Education Instruction & Library (1,384 | 5.4%), Health Diagnosing & Treating (1,209 | 4.7%), and Arts, Media & Entertainment (981 | 3.8%).
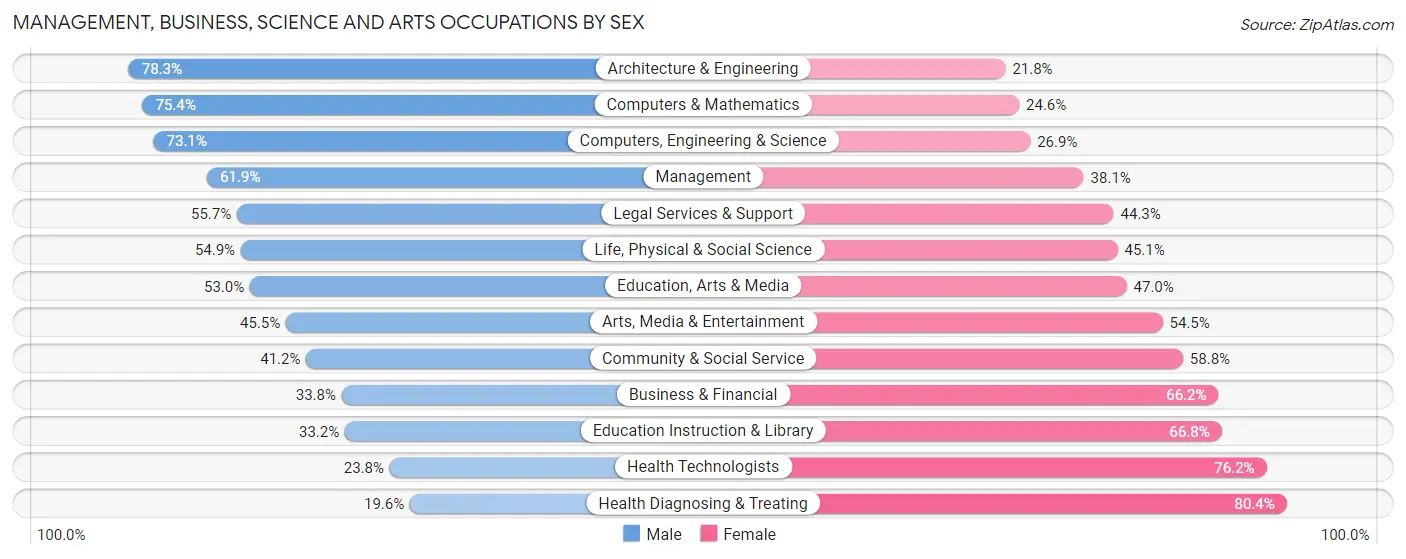
Management, Business, Science and Arts Occupations by Sex
Within the Management, Business, Science and Arts occupations in Taney County, the most male-oriented occupations are Architecture & Engineering (78.2%), Computers & Mathematics (75.4%), and Computers, Engineering & Science (73.1%), while the most female-oriented occupations are Health Diagnosing & Treating (80.4%), Health Technologists (76.2%), and Education Instruction & Library (66.8%).
| Occupation | Male | Female |
| Management | 1,674 (61.9%) | 1,029 (38.1%) |
| Business & Financial | 287 (33.8%) | 561 (66.2%) |
| Computers, Engineering & Science | 475 (73.1%) | 175 (26.9%) |
| Computers & Mathematics | 190 (75.4%) | 62 (24.6%) |
| Architecture & Engineering | 223 (78.2%) | 62 (21.7%) |
| Life, Physical & Social Science | 62 (54.9%) | 51 (45.1%) |
| Community & Social Service | 1,213 (41.2%) | 1,729 (58.8%) |
| Education, Arts & Media | 259 (53.0%) | 230 (47.0%) |
| Legal Services & Support | 49 (55.7%) | 39 (44.3%) |
| Education Instruction & Library | 459 (33.2%) | 925 (66.8%) |
| Arts, Media & Entertainment | 446 (45.5%) | 535 (54.5%) |
| Health Diagnosing & Treating | 237 (19.6%) | 972 (80.4%) |
| Health Technologists | 166 (23.8%) | 531 (76.2%) |
| Total (Category) | 3,886 (46.5%) | 4,466 (53.5%) |
| Total (Overall) | 13,187 (51.7%) | 12,312 (48.3%) |
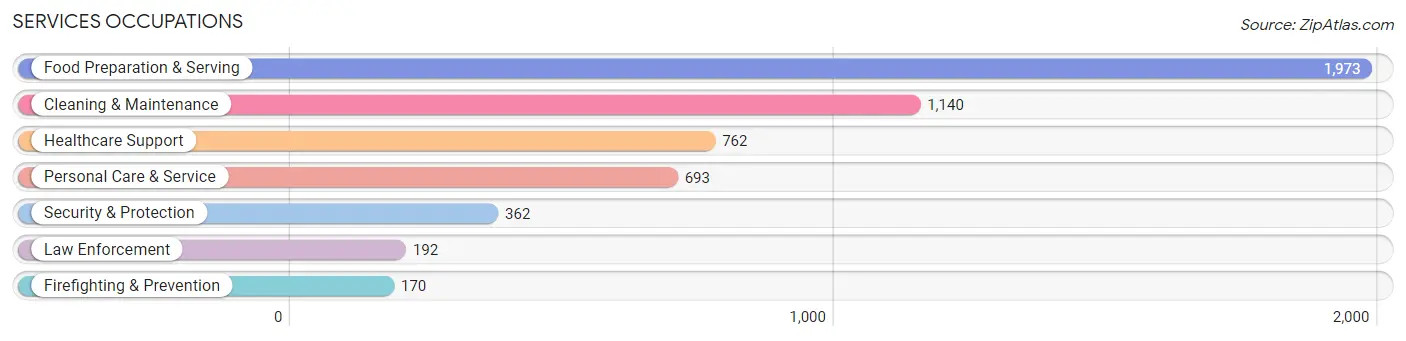
Services Occupations
The most common Services occupations in Taney County are Food Preparation & Serving (1,973 | 7.7%), Cleaning & Maintenance (1,140 | 4.5%), Healthcare Support (762 | 3.0%), Personal Care & Service (693 | 2.7%), and Security & Protection (362 | 1.4%).
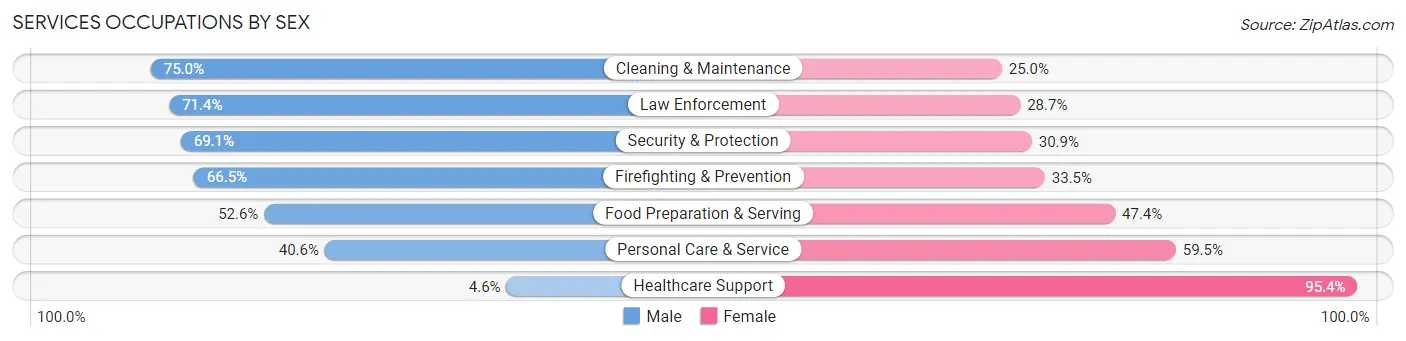
Services Occupations by Sex
Within the Services occupations in Taney County, the most male-oriented occupations are Cleaning & Maintenance (75.0%), Law Enforcement (71.4%), and Security & Protection (69.1%), while the most female-oriented occupations are Healthcare Support (95.4%), Personal Care & Service (59.5%), and Food Preparation & Serving (47.4%).
| Occupation | Male | Female |
| Healthcare Support | 35 (4.6%) | 727 (95.4%) |
| Security & Protection | 250 (69.1%) | 112 (30.9%) |
| Firefighting & Prevention | 113 (66.5%) | 57 (33.5%) |
| Law Enforcement | 137 (71.4%) | 55 (28.6%) |
| Food Preparation & Serving | 1,037 (52.6%) | 936 (47.4%) |
| Cleaning & Maintenance | 855 (75.0%) | 285 (25.0%) |
| Personal Care & Service | 281 (40.6%) | 412 (59.5%) |
| Total (Category) | 2,458 (49.9%) | 2,472 (50.1%) |
| Total (Overall) | 13,187 (51.7%) | 12,312 (48.3%) |
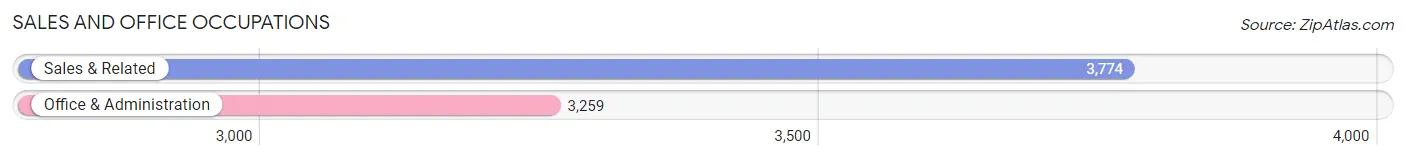
Sales and Office Occupations
The most common Sales and Office occupations in Taney County are Sales & Related (3,774 | 14.8%), and Office & Administration (3,259 | 12.8%).
Sales and Office Occupations by Sex
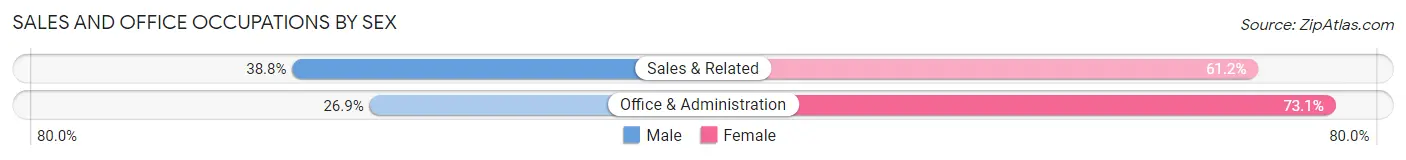
| Occupation | Male | Female |
| Sales & Related | 1,465 (38.8%) | 2,309 (61.2%) |
| Office & Administration | 878 (26.9%) | 2,381 (73.1%) |
| Total (Category) | 2,343 (33.3%) | 4,690 (66.7%) |
| Total (Overall) | 13,187 (51.7%) | 12,312 (48.3%) |
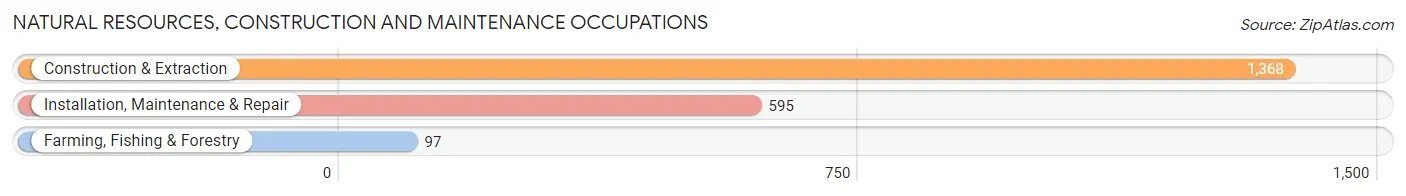
Natural Resources, Construction and Maintenance Occupations
The most common Natural Resources, Construction and Maintenance occupations in Taney County are Construction & Extraction (1,368 | 5.4%), Installation, Maintenance & Repair (595 | 2.3%), and Farming, Fishing & Forestry (97 | 0.4%).
Natural Resources, Construction and Maintenance Occupations by Sex
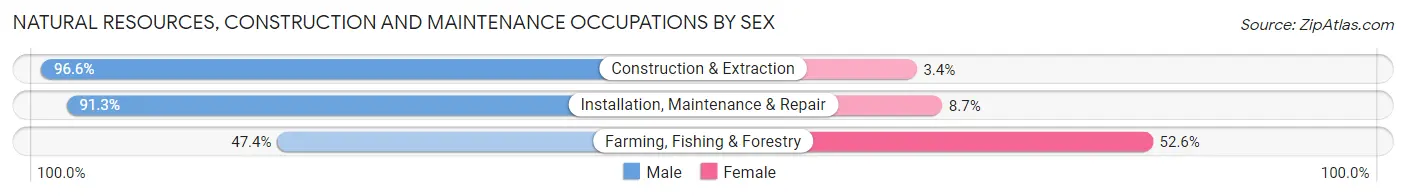
| Occupation | Male | Female |
| Farming, Fishing & Forestry | 46 (47.4%) | 51 (52.6%) |
| Construction & Extraction | 1,321 (96.6%) | 47 (3.4%) |
| Installation, Maintenance & Repair | 543 (91.3%) | 52 (8.7%) |
| Total (Category) | 1,910 (92.7%) | 150 (7.3%) |
| Total (Overall) | 13,187 (51.7%) | 12,312 (48.3%) |
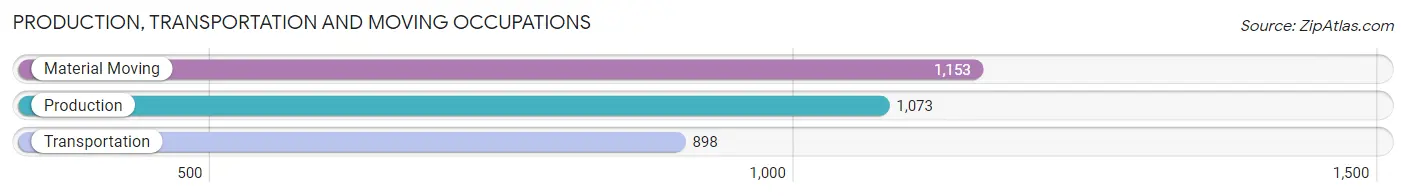
Production, Transportation and Moving Occupations
The most common Production, Transportation and Moving occupations in Taney County are Material Moving (1,153 | 4.5%), Production (1,073 | 4.2%), and Transportation (898 | 3.5%).
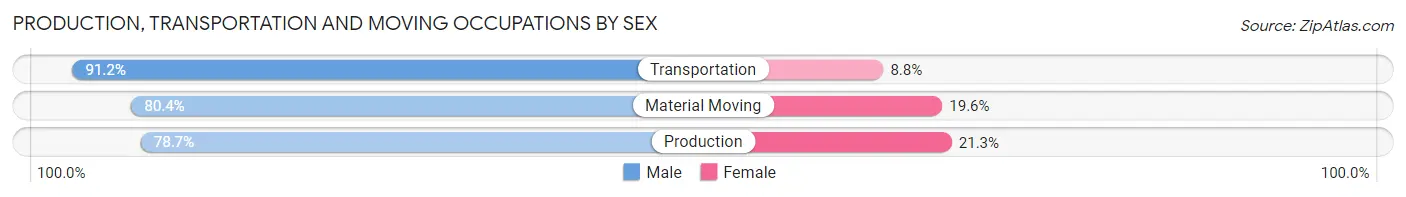
Production, Transportation and Moving Occupations by Sex
| Occupation | Male | Female |
| Production | 844 (78.7%) | 229 (21.3%) |
| Transportation | 819 (91.2%) | 79 (8.8%) |
| Material Moving | 927 (80.4%) | 226 (19.6%) |
| Total (Category) | 2,590 (82.9%) | 534 (17.1%) |
| Total (Overall) | 13,187 (51.7%) | 12,312 (48.3%) |
Employment Industries by Sex in Taney County
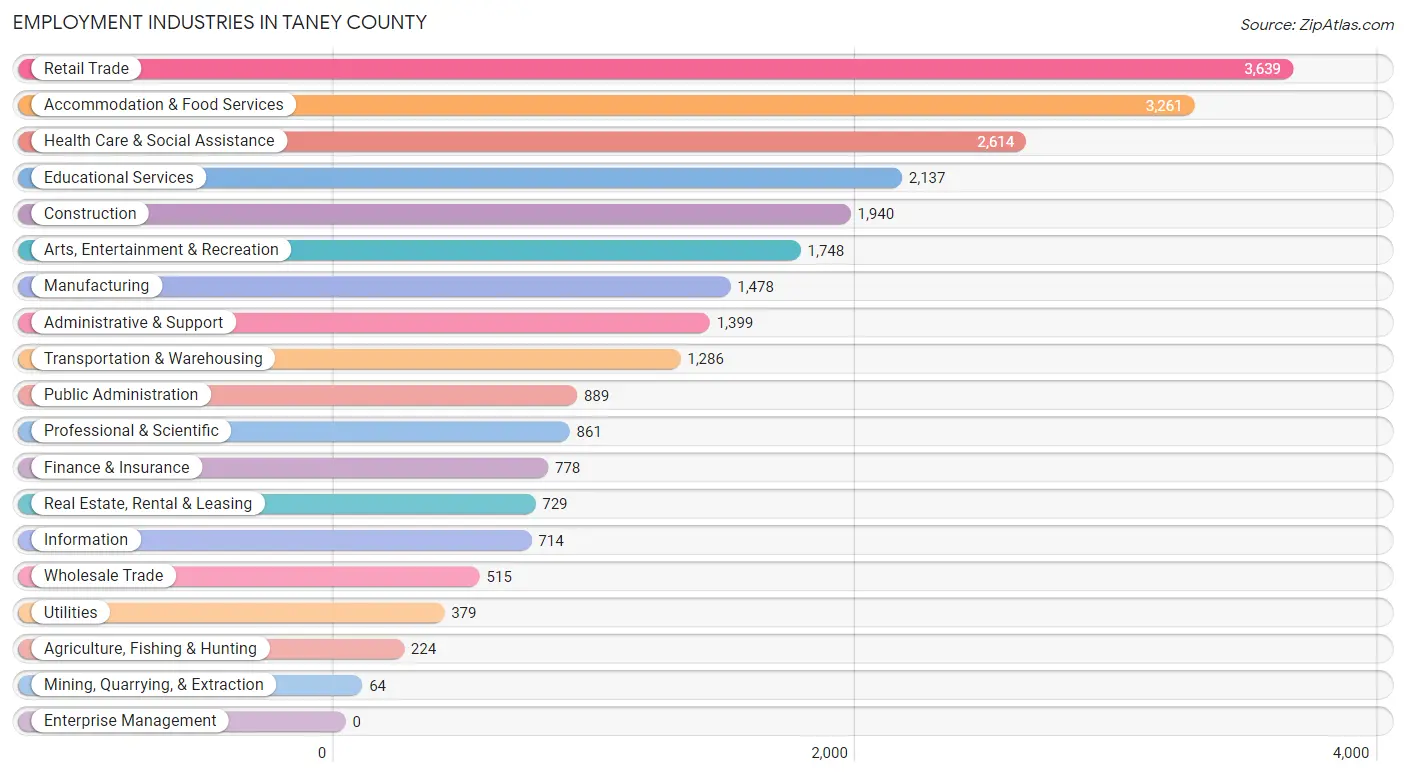
Employment Industries in Taney County
The major employment industries in Taney County include Retail Trade (3,639 | 14.3%), Accommodation & Food Services (3,261 | 12.8%), Health Care & Social Assistance (2,614 | 10.2%), Educational Services (2,137 | 8.4%), and Construction (1,940 | 7.6%).
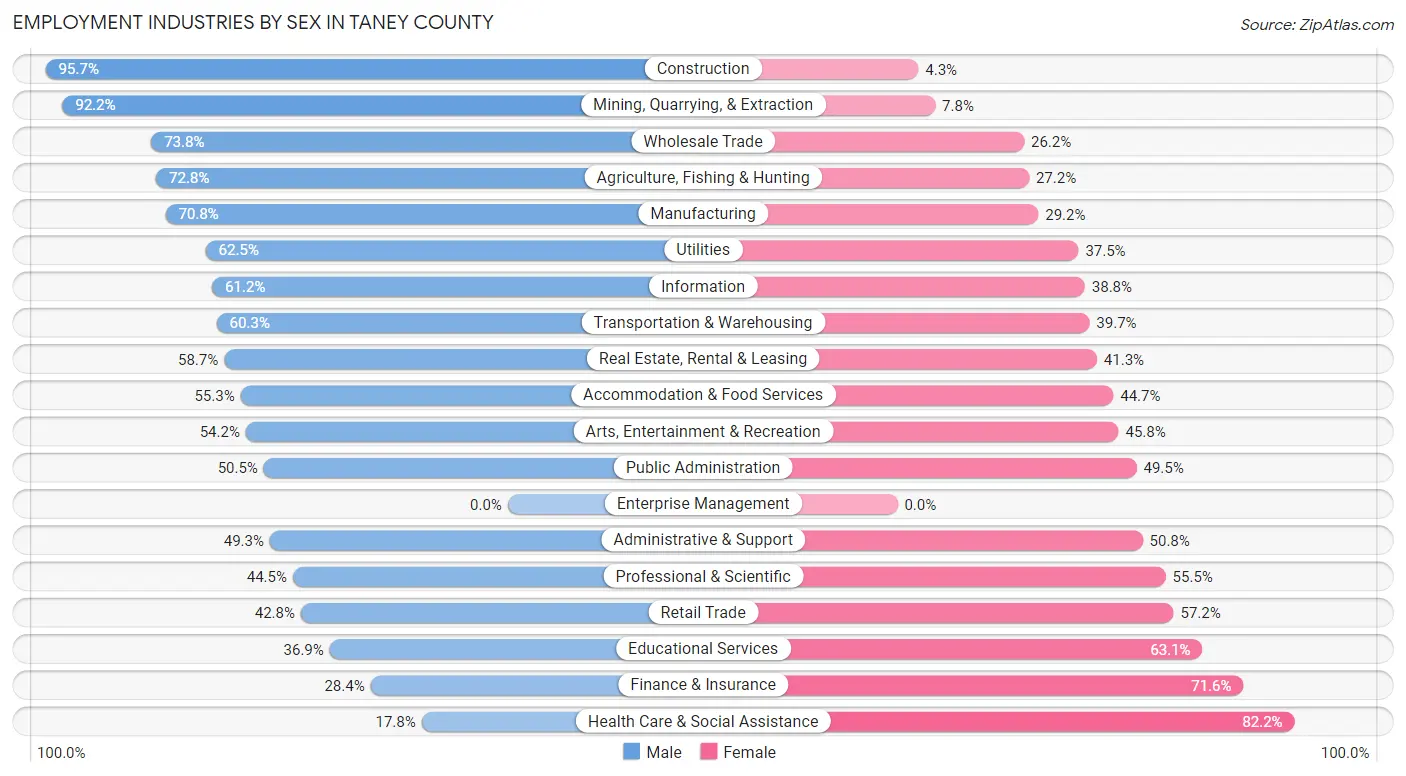
Employment Industries by Sex in Taney County
The Taney County industries that see more men than women are Construction (95.7%), Mining, Quarrying, & Extraction (92.2%), and Wholesale Trade (73.8%), whereas the industries that tend to have a higher number of women are Health Care & Social Assistance (82.2%), Finance & Insurance (71.6%), and Educational Services (63.1%).
| Industry | Male | Female |
| Agriculture, Fishing & Hunting | 163 (72.8%) | 61 (27.2%) |
| Mining, Quarrying, & Extraction | 59 (92.2%) | 5 (7.8%) |
| Construction | 1,856 (95.7%) | 84 (4.3%) |
| Manufacturing | 1,047 (70.8%) | 431 (29.2%) |
| Wholesale Trade | 380 (73.8%) | 135 (26.2%) |
| Retail Trade | 1,559 (42.8%) | 2,080 (57.2%) |
| Transportation & Warehousing | 775 (60.3%) | 511 (39.7%) |
| Utilities | 237 (62.5%) | 142 (37.5%) |
| Information | 437 (61.2%) | 277 (38.8%) |
| Finance & Insurance | 221 (28.4%) | 557 (71.6%) |
| Real Estate, Rental & Leasing | 428 (58.7%) | 301 (41.3%) |
| Professional & Scientific | 383 (44.5%) | 478 (55.5%) |
| Enterprise Management | 0 (0.0%) | 0 (0.0%) |
| Administrative & Support | 689 (49.2%) | 710 (50.7%) |
| Educational Services | 788 (36.9%) | 1,349 (63.1%) |
| Health Care & Social Assistance | 466 (17.8%) | 2,148 (82.2%) |
| Arts, Entertainment & Recreation | 948 (54.2%) | 800 (45.8%) |
| Accommodation & Food Services | 1,804 (55.3%) | 1,457 (44.7%) |
| Public Administration | 449 (50.5%) | 440 (49.5%) |
| Total | 13,187 (51.7%) | 12,312 (48.3%) |
Education in Taney County
School Enrollment in Taney County
The most common levels of schooling among the 12,185 students in Taney County are middle school (2,770 | 22.7%), college / undergraduate (2,658 | 21.8%), and high school (2,628 | 21.6%).
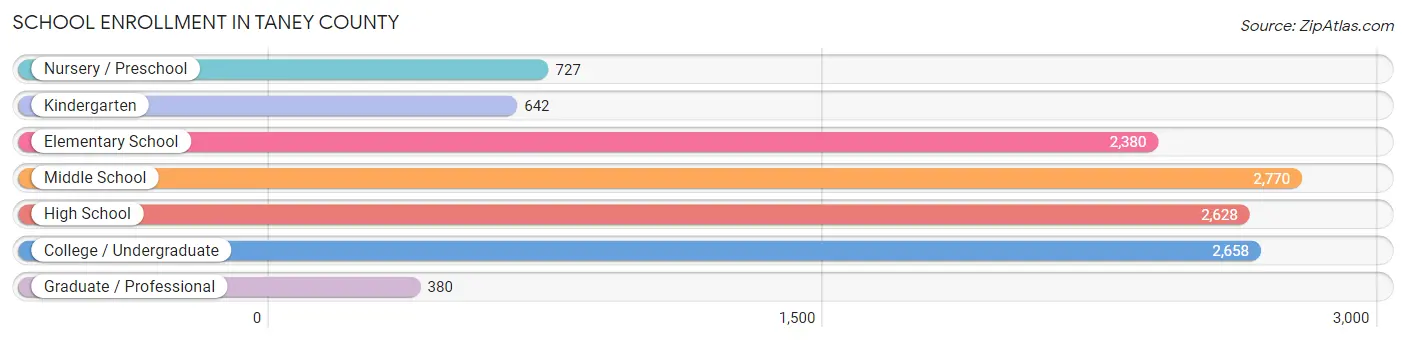
| School Level | # Students | % Students |
| Nursery / Preschool | 727 | 6.0% |
| Kindergarten | 642 | 5.3% |
| Elementary School | 2,380 | 19.5% |
| Middle School | 2,770 | 22.7% |
| High School | 2,628 | 21.6% |
| College / Undergraduate | 2,658 | 21.8% |
| Graduate / Professional | 380 | 3.1% |
| Total | 12,185 | 100.0% |
School Enrollment by Age by Funding Source in Taney County
Out of a total of 12,185 students who are enrolled in schools in Taney County, 2,790 (22.9%) attend a private institution, while the remaining 9,395 (77.1%) are enrolled in public schools. The age group of 20 to 24 year olds has the highest likelihood of being enrolled in private schools, with 649 (56.1% in the age bracket) enrolled. Conversely, the age group of 15 to 17 year olds has the lowest likelihood of being enrolled in a private school, with 1,948 (91.1% in the age bracket) attending a public institution.
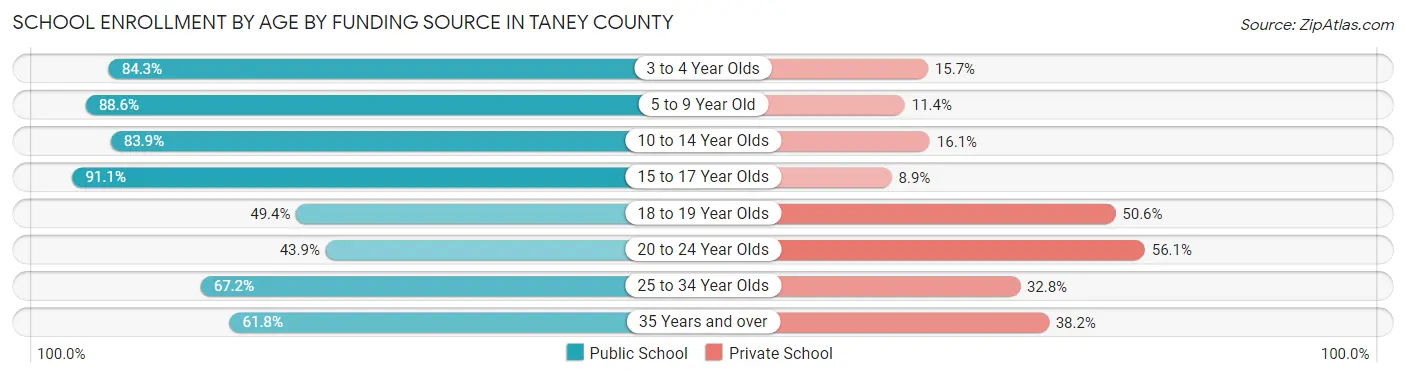
| Age Bracket | Public School | Private School |
| 3 to 4 Year Olds | 247 (84.3%) | 46 (15.7%) |
| 5 to 9 Year Old | 2,676 (88.6%) | 344 (11.4%) |
| 10 to 14 Year Olds | 2,780 (83.9%) | 532 (16.1%) |
| 15 to 17 Year Olds | 1,948 (91.1%) | 191 (8.9%) |
| 18 to 19 Year Olds | 726 (49.4%) | 744 (50.6%) |
| 20 to 24 Year Olds | 508 (43.9%) | 649 (56.1%) |
| 25 to 34 Year Olds | 266 (67.2%) | 130 (32.8%) |
| 35 Years and over | 246 (61.8%) | 152 (38.2%) |
| Total | 9,395 (77.1%) | 2,790 (22.9%) |
Educational Attainment by Field of Study in Taney County
Business (2,121 | 20.4%), education (1,970 | 19.0%), science & technology (1,063 | 10.2%), arts & humanities (894 | 8.6%), and liberal arts & history (649 | 6.2%) are the most common fields of study among 10,379 individuals in Taney County who have obtained a bachelor's degree or higher.
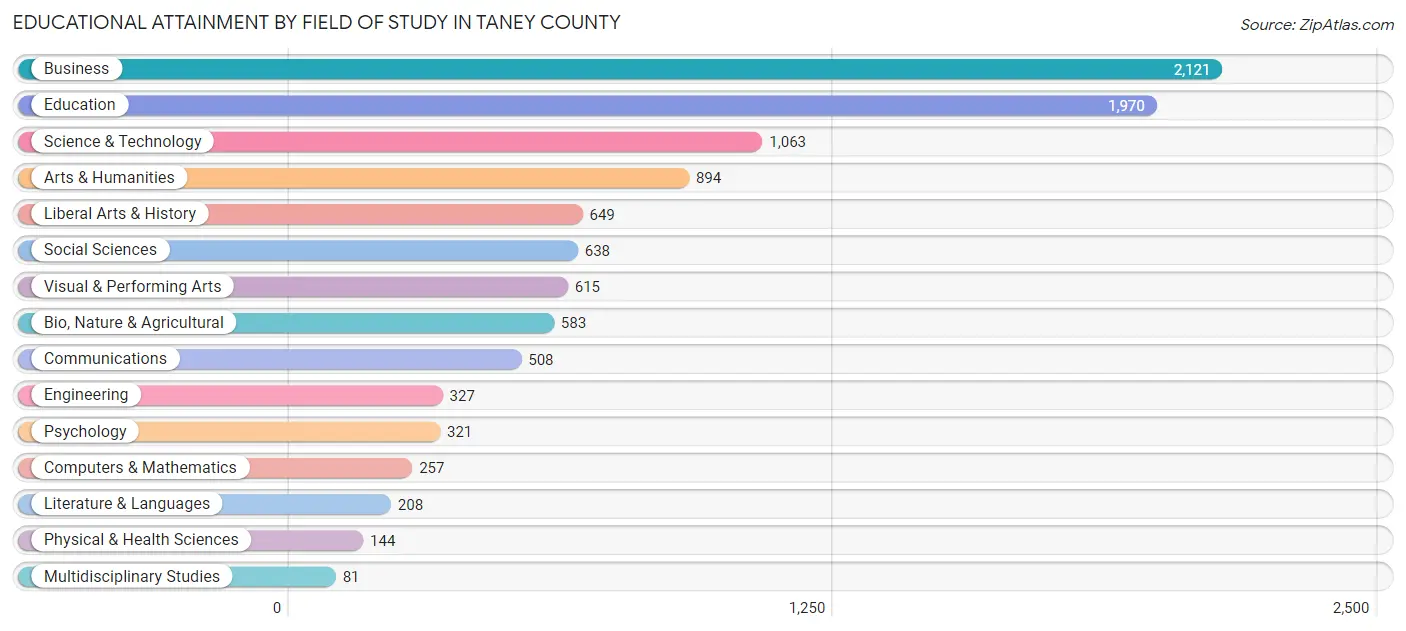
| Field of Study | # Graduates | % Graduates |
| Computers & Mathematics | 257 | 2.5% |
| Bio, Nature & Agricultural | 583 | 5.6% |
| Physical & Health Sciences | 144 | 1.4% |
| Psychology | 321 | 3.1% |
| Social Sciences | 638 | 6.1% |
| Engineering | 327 | 3.2% |
| Multidisciplinary Studies | 81 | 0.8% |
| Science & Technology | 1,063 | 10.2% |
| Business | 2,121 | 20.4% |
| Education | 1,970 | 19.0% |
| Literature & Languages | 208 | 2.0% |
| Liberal Arts & History | 649 | 6.2% |
| Visual & Performing Arts | 615 | 5.9% |
| Communications | 508 | 4.9% |
| Arts & Humanities | 894 | 8.6% |
| Total | 10,379 | 100.0% |
Transportation & Commute in Taney County
Vehicle Availability by Sex in Taney County
The most prevalent vehicle ownership categories in Taney County are males with 2 vehicles (5,935, accounting for 46.6%) and females with 2 vehicles (4,497, making up 51.6%).
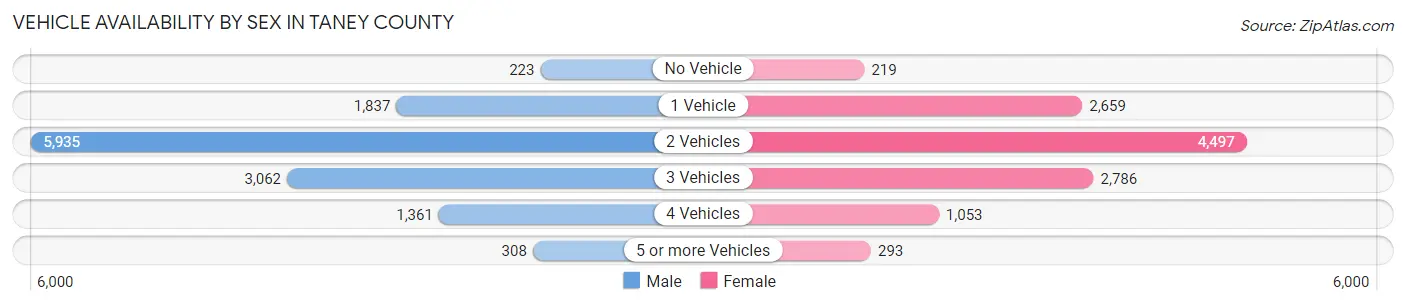
| Vehicles Available | Male | Female |
| No Vehicle | 223 (1.8%) | 219 (1.9%) |
| 1 Vehicle | 1,837 (14.4%) | 2,659 (23.1%) |
| 2 Vehicles | 5,935 (46.6%) | 4,497 (39.1%) |
| 3 Vehicles | 3,062 (24.1%) | 2,786 (24.2%) |
| 4 Vehicles | 1,361 (10.7%) | 1,053 (9.1%) |
| 5 or more Vehicles | 308 (2.4%) | 293 (2.5%) |
| Total | 12,726 (100.0%) | 11,507 (100.0%) |
Commute Time in Taney County
The most frequently occuring commute durations in Taney County are 15 to 19 minutes (5,213 commuters, 23.1%), 20 to 24 minutes (4,299 commuters, 19.1%), and 10 to 14 minutes (3,568 commuters, 15.8%).
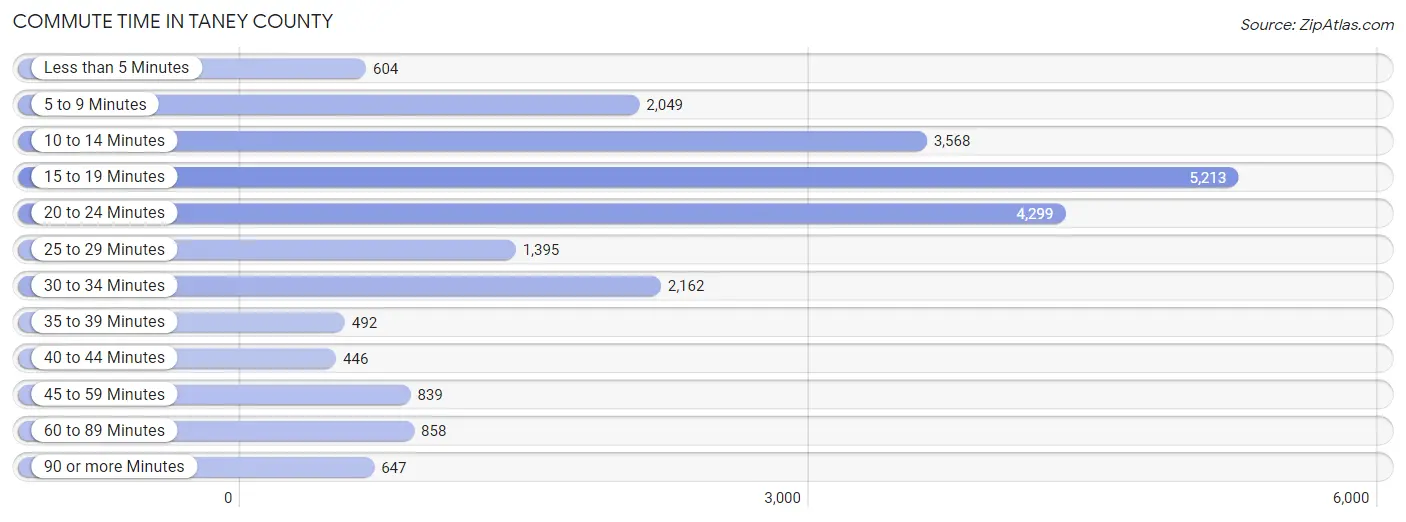
| Commute Time | # Commuters | % Commuters |
| Less than 5 Minutes | 604 | 2.7% |
| 5 to 9 Minutes | 2,049 | 9.1% |
| 10 to 14 Minutes | 3,568 | 15.8% |
| 15 to 19 Minutes | 5,213 | 23.1% |
| 20 to 24 Minutes | 4,299 | 19.1% |
| 25 to 29 Minutes | 1,395 | 6.2% |
| 30 to 34 Minutes | 2,162 | 9.6% |
| 35 to 39 Minutes | 492 | 2.2% |
| 40 to 44 Minutes | 446 | 2.0% |
| 45 to 59 Minutes | 839 | 3.7% |
| 60 to 89 Minutes | 858 | 3.8% |
| 90 or more Minutes | 647 | 2.9% |
Commute Time by Sex in Taney County
The most common commute times in Taney County are 15 to 19 minutes (2,650 commuters, 23.0%) for males and 15 to 19 minutes (2,563 commuters, 23.2%) for females.
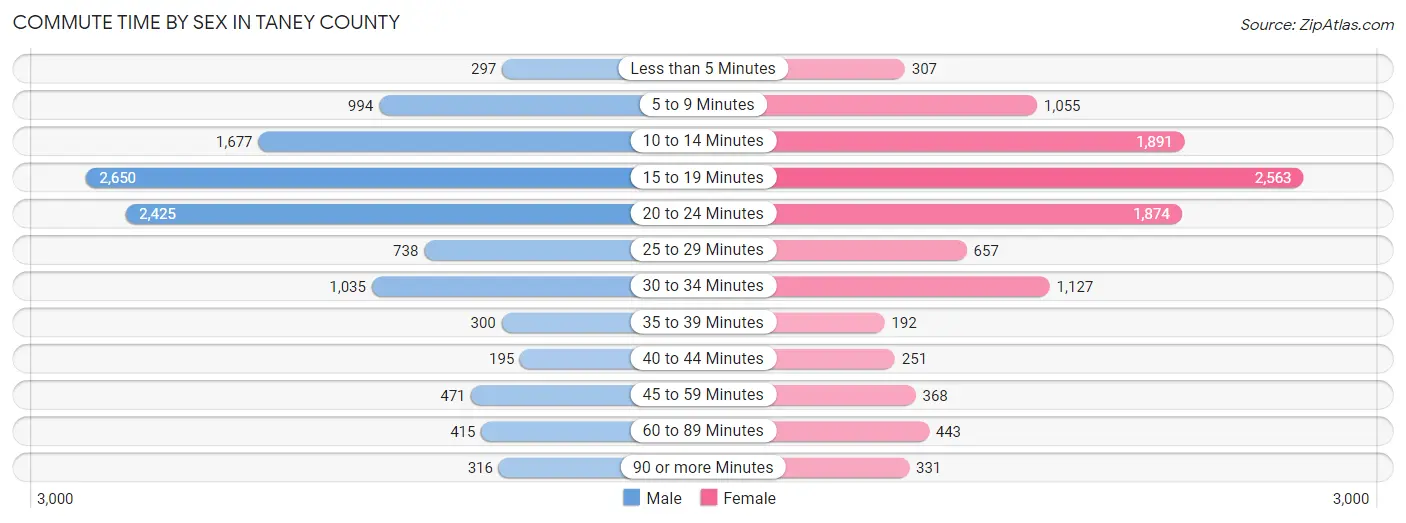
| Commute Time | Male | Female |
| Less than 5 Minutes | 297 (2.6%) | 307 (2.8%) |
| 5 to 9 Minutes | 994 (8.6%) | 1,055 (9.5%) |
| 10 to 14 Minutes | 1,677 (14.6%) | 1,891 (17.1%) |
| 15 to 19 Minutes | 2,650 (23.0%) | 2,563 (23.2%) |
| 20 to 24 Minutes | 2,425 (21.1%) | 1,874 (17.0%) |
| 25 to 29 Minutes | 738 (6.4%) | 657 (5.9%) |
| 30 to 34 Minutes | 1,035 (9.0%) | 1,127 (10.2%) |
| 35 to 39 Minutes | 300 (2.6%) | 192 (1.7%) |
| 40 to 44 Minutes | 195 (1.7%) | 251 (2.3%) |
| 45 to 59 Minutes | 471 (4.1%) | 368 (3.3%) |
| 60 to 89 Minutes | 415 (3.6%) | 443 (4.0%) |
| 90 or more Minutes | 316 (2.7%) | 331 (3.0%) |
Time of Departure to Work by Sex in Taney County
The most frequent times of departure to work in Taney County are 7:00 AM to 7:29 AM (1,768, 15.4%) for males and 7:30 AM to 7:59 AM (1,756, 15.9%) for females.
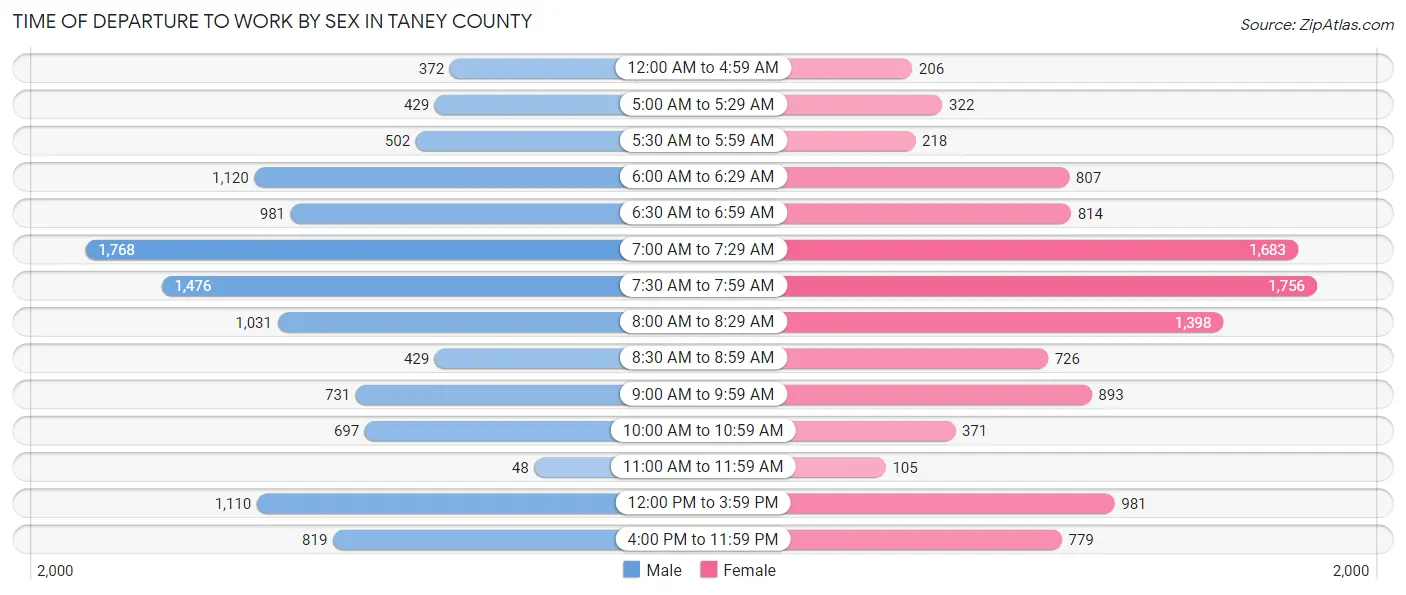
| Time of Departure | Male | Female |
| 12:00 AM to 4:59 AM | 372 (3.2%) | 206 (1.9%) |
| 5:00 AM to 5:29 AM | 429 (3.7%) | 322 (2.9%) |
| 5:30 AM to 5:59 AM | 502 (4.4%) | 218 (2.0%) |
| 6:00 AM to 6:29 AM | 1,120 (9.7%) | 807 (7.3%) |
| 6:30 AM to 6:59 AM | 981 (8.5%) | 814 (7.4%) |
| 7:00 AM to 7:29 AM | 1,768 (15.4%) | 1,683 (15.2%) |
| 7:30 AM to 7:59 AM | 1,476 (12.8%) | 1,756 (15.9%) |
| 8:00 AM to 8:29 AM | 1,031 (9.0%) | 1,398 (12.6%) |
| 8:30 AM to 8:59 AM | 429 (3.7%) | 726 (6.6%) |
| 9:00 AM to 9:59 AM | 731 (6.4%) | 893 (8.1%) |
| 10:00 AM to 10:59 AM | 697 (6.0%) | 371 (3.4%) |
| 11:00 AM to 11:59 AM | 48 (0.4%) | 105 (0.9%) |
| 12:00 PM to 3:59 PM | 1,110 (9.6%) | 981 (8.9%) |
| 4:00 PM to 11:59 PM | 819 (7.1%) | 779 (7.0%) |
| Total | 11,513 (100.0%) | 11,059 (100.0%) |
Housing Occupancy in Taney County
Occupancy by Ownership in Taney County
Of the total 21,595 dwellings in Taney County, owner-occupied units account for 14,401 (66.7%), while renter-occupied units make up 7,194 (33.3%).
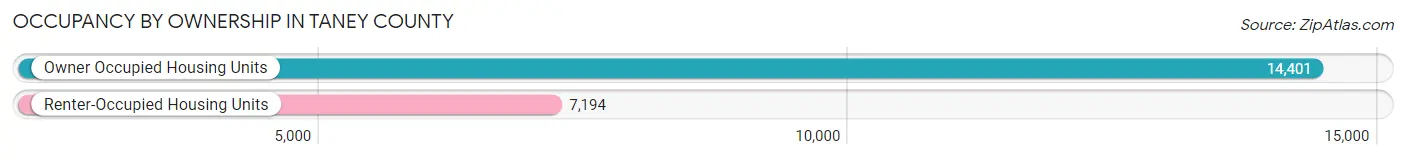
| Occupancy | # Housing Units | % Housing Units |
| Owner Occupied Housing Units | 14,401 | 66.7% |
| Renter-Occupied Housing Units | 7,194 | 33.3% |
| Total Occupied Housing Units | 21,595 | 100.0% |
Occupancy by Household Size in Taney County
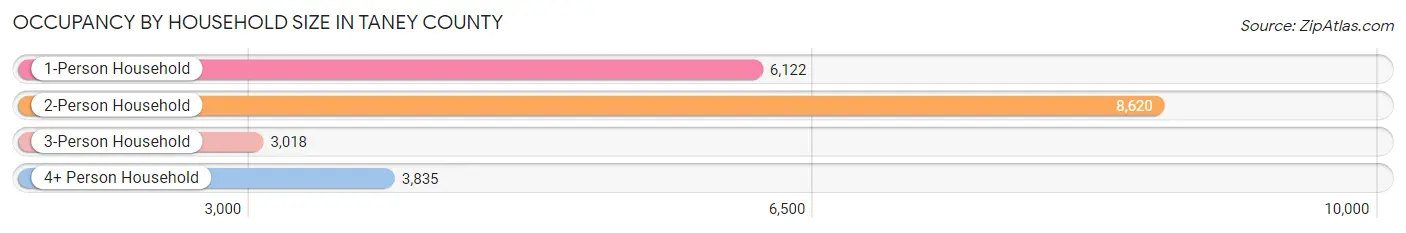
| Household Size | # Housing Units | % Housing Units |
| 1-Person Household | 6,122 | 28.3% |
| 2-Person Household | 8,620 | 39.9% |
| 3-Person Household | 3,018 | 14.0% |
| 4+ Person Household | 3,835 | 17.8% |
| Total Housing Units | 21,595 | 100.0% |
Occupancy by Ownership by Household Size in Taney County
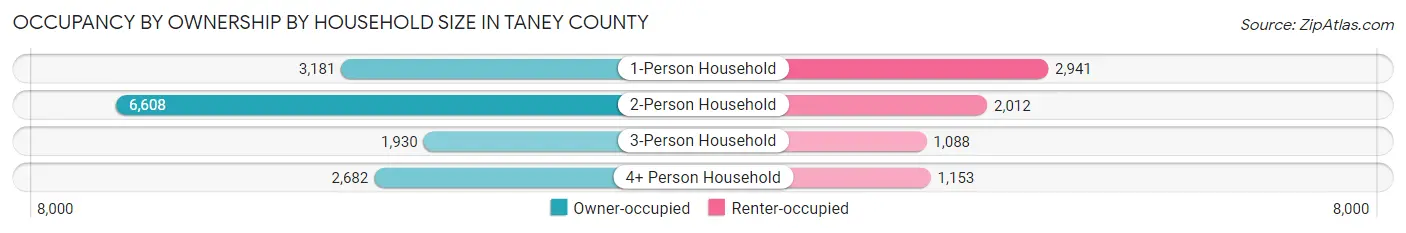
| Household Size | Owner-occupied | Renter-occupied |
| 1-Person Household | 3,181 (52.0%) | 2,941 (48.0%) |
| 2-Person Household | 6,608 (76.7%) | 2,012 (23.3%) |
| 3-Person Household | 1,930 (63.9%) | 1,088 (36.0%) |
| 4+ Person Household | 2,682 (69.9%) | 1,153 (30.1%) |
| Total Housing Units | 14,401 (66.7%) | 7,194 (33.3%) |
Occupancy by Educational Attainment in Taney County
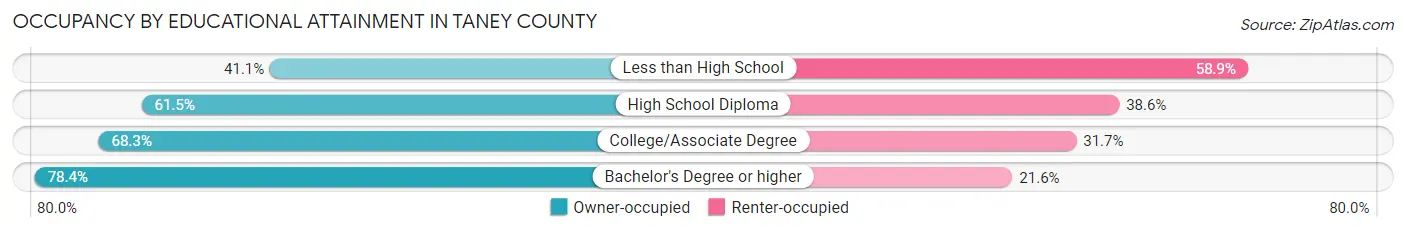
| Household Size | Owner-occupied | Renter-occupied |
| Less than High School | 710 (41.1%) | 1,019 (58.9%) |
| High School Diploma | 3,891 (61.5%) | 2,441 (38.6%) |
| College/Associate Degree | 5,453 (68.3%) | 2,536 (31.7%) |
| Bachelor's Degree or higher | 4,347 (78.4%) | 1,198 (21.6%) |
Occupancy by Age of Householder in Taney County
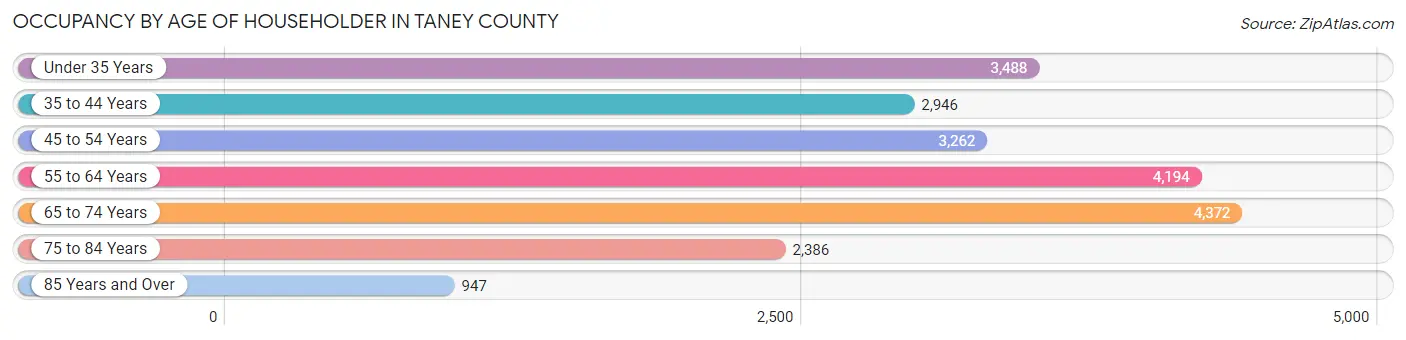
| Age Bracket | # Households | % Households |
| Under 35 Years | 3,488 | 16.2% |
| 35 to 44 Years | 2,946 | 13.6% |
| 45 to 54 Years | 3,262 | 15.1% |
| 55 to 64 Years | 4,194 | 19.4% |
| 65 to 74 Years | 4,372 | 20.3% |
| 75 to 84 Years | 2,386 | 11.1% |
| 85 Years and Over | 947 | 4.4% |
| Total | 21,595 | 100.0% |
Housing Finances in Taney County
Median Income by Occupancy in Taney County
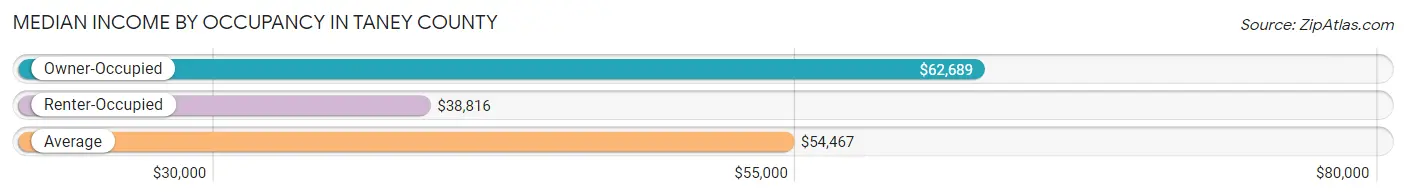
| Occupancy Type | # Households | Median Income |
| Owner-Occupied | 14,401 (66.7%) | $62,689 |
| Renter-Occupied | 7,194 (33.3%) | $38,816 |
| Average | 21,595 (100.0%) | $54,467 |
Occupancy by Householder Income Bracket in Taney County
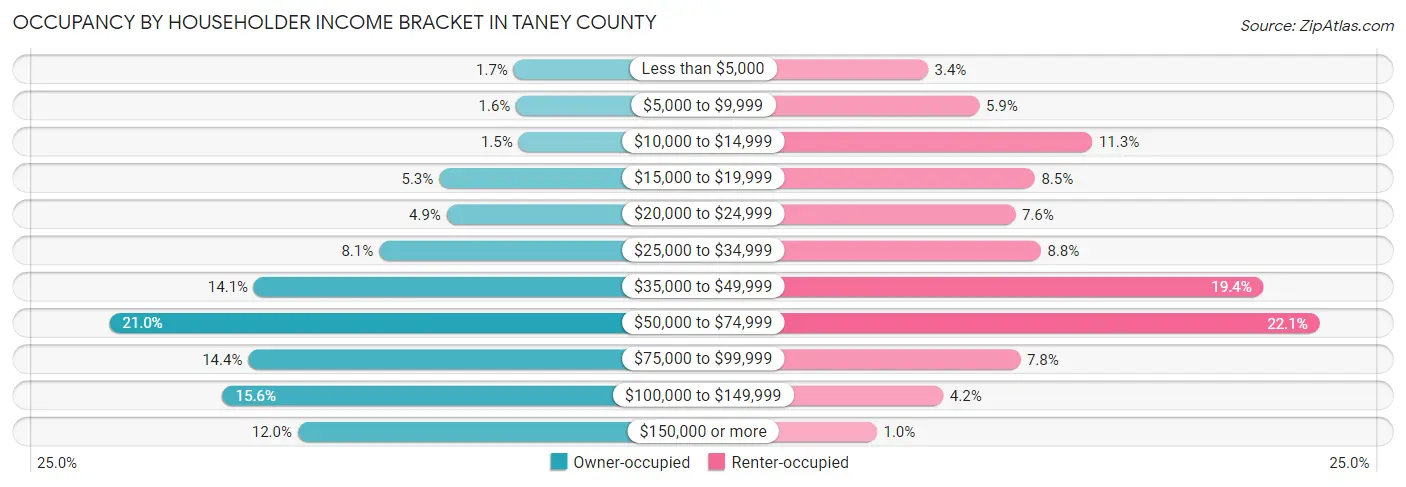
| Income Bracket | Owner-occupied | Renter-occupied |
| Less than $5,000 | 246 (1.7%) | 247 (3.4%) |
| $5,000 to $9,999 | 229 (1.6%) | 423 (5.9%) |
| $10,000 to $14,999 | 213 (1.5%) | 810 (11.3%) |
| $15,000 to $19,999 | 757 (5.3%) | 613 (8.5%) |
| $20,000 to $24,999 | 706 (4.9%) | 546 (7.6%) |
| $25,000 to $34,999 | 1,169 (8.1%) | 634 (8.8%) |
| $35,000 to $49,999 | 2,028 (14.1%) | 1,398 (19.4%) |
| $50,000 to $74,999 | 3,018 (21.0%) | 1,589 (22.1%) |
| $75,000 to $99,999 | 2,067 (14.3%) | 563 (7.8%) |
| $100,000 to $149,999 | 2,242 (15.6%) | 299 (4.2%) |
| $150,000 or more | 1,726 (12.0%) | 72 (1.0%) |
| Total | 14,401 (100.0%) | 7,194 (100.0%) |
Monthly Housing Cost Tiers in Taney County
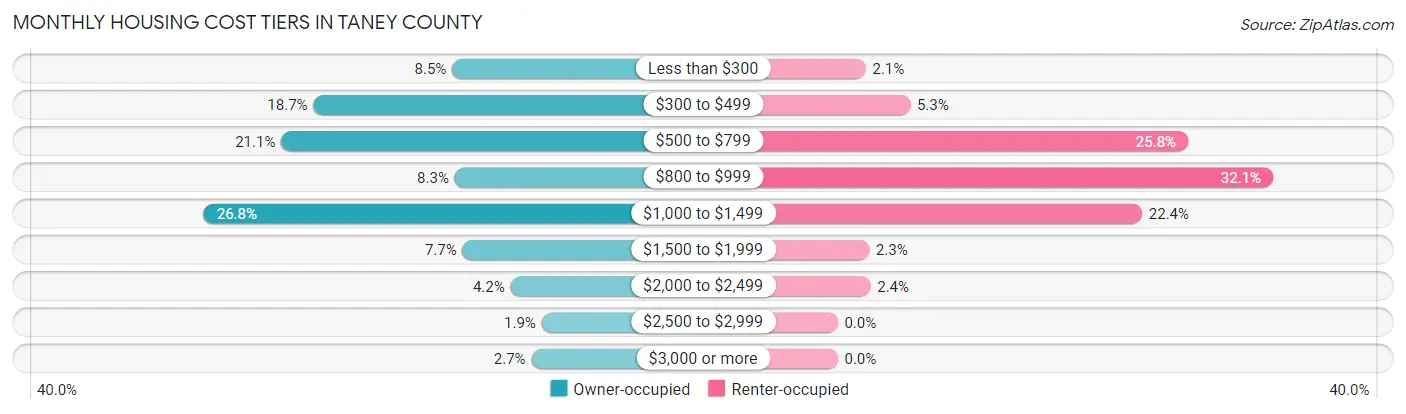
| Monthly Cost | Owner-occupied | Renter-occupied |
| Less than $300 | 1,226 (8.5%) | 149 (2.1%) |
| $300 to $499 | 2,698 (18.7%) | 384 (5.3%) |
| $500 to $799 | 3,038 (21.1%) | 1,857 (25.8%) |
| $800 to $999 | 1,198 (8.3%) | 2,307 (32.1%) |
| $1,000 to $1,499 | 3,859 (26.8%) | 1,613 (22.4%) |
| $1,500 to $1,999 | 1,115 (7.7%) | 167 (2.3%) |
| $2,000 to $2,499 | 607 (4.2%) | 174 (2.4%) |
| $2,500 to $2,999 | 276 (1.9%) | 0 (0.0%) |
| $3,000 or more | 384 (2.7%) | 0 (0.0%) |
| Total | 14,401 (100.0%) | 7,194 (100.0%) |
Physical Housing Characteristics in Taney County
Housing Structures in Taney County
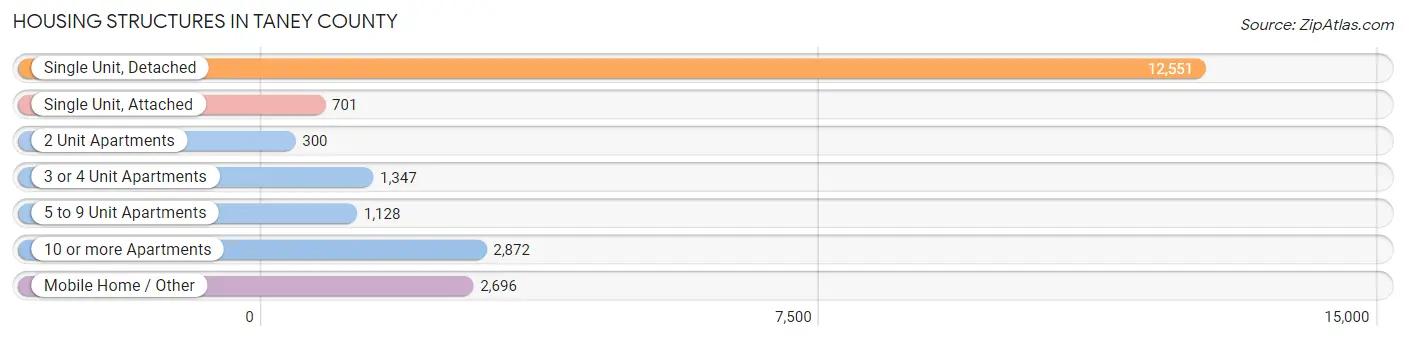
| Structure Type | # Housing Units | % Housing Units |
| Single Unit, Detached | 12,551 | 58.1% |
| Single Unit, Attached | 701 | 3.3% |
| 2 Unit Apartments | 300 | 1.4% |
| 3 or 4 Unit Apartments | 1,347 | 6.2% |
| 5 to 9 Unit Apartments | 1,128 | 5.2% |
| 10 or more Apartments | 2,872 | 13.3% |
| Mobile Home / Other | 2,696 | 12.5% |
| Total | 21,595 | 100.0% |
Housing Structures by Occupancy in Taney County
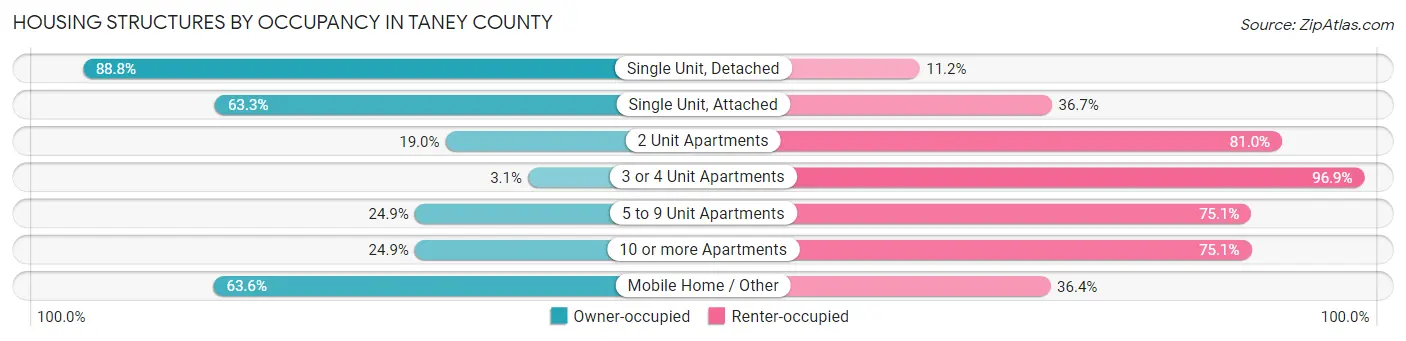
| Structure Type | Owner-occupied | Renter-occupied |
| Single Unit, Detached | 11,147 (88.8%) | 1,404 (11.2%) |
| Single Unit, Attached | 444 (63.3%) | 257 (36.7%) |
| 2 Unit Apartments | 57 (19.0%) | 243 (81.0%) |
| 3 or 4 Unit Apartments | 42 (3.1%) | 1,305 (96.9%) |
| 5 to 9 Unit Apartments | 281 (24.9%) | 847 (75.1%) |
| 10 or more Apartments | 715 (24.9%) | 2,157 (75.1%) |
| Mobile Home / Other | 1,715 (63.6%) | 981 (36.4%) |
| Total | 14,401 (66.7%) | 7,194 (33.3%) |
Housing Structures by Number of Rooms in Taney County
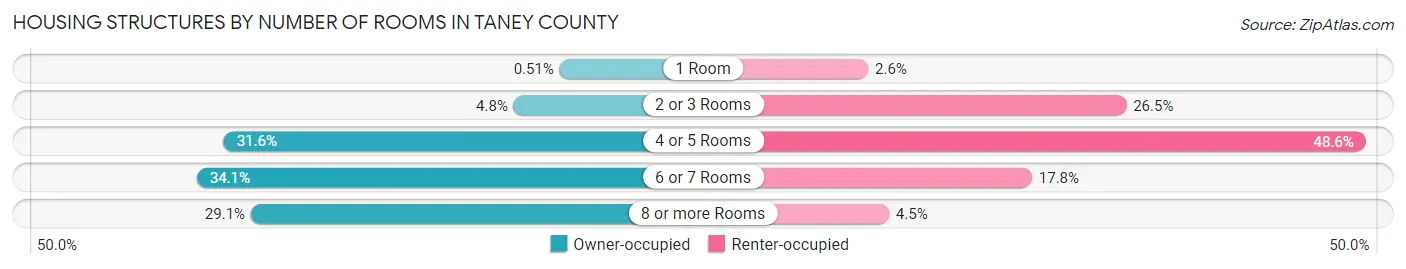
| Number of Rooms | Owner-occupied | Renter-occupied |
| 1 Room | 73 (0.5%) | 188 (2.6%) |
| 2 or 3 Rooms | 686 (4.8%) | 1,905 (26.5%) |
| 4 or 5 Rooms | 4,548 (31.6%) | 3,498 (48.6%) |
| 6 or 7 Rooms | 4,907 (34.1%) | 1,277 (17.7%) |
| 8 or more Rooms | 4,187 (29.1%) | 326 (4.5%) |
| Total | 14,401 (100.0%) | 7,194 (100.0%) |
Housing Structure by Heating Type in Taney County
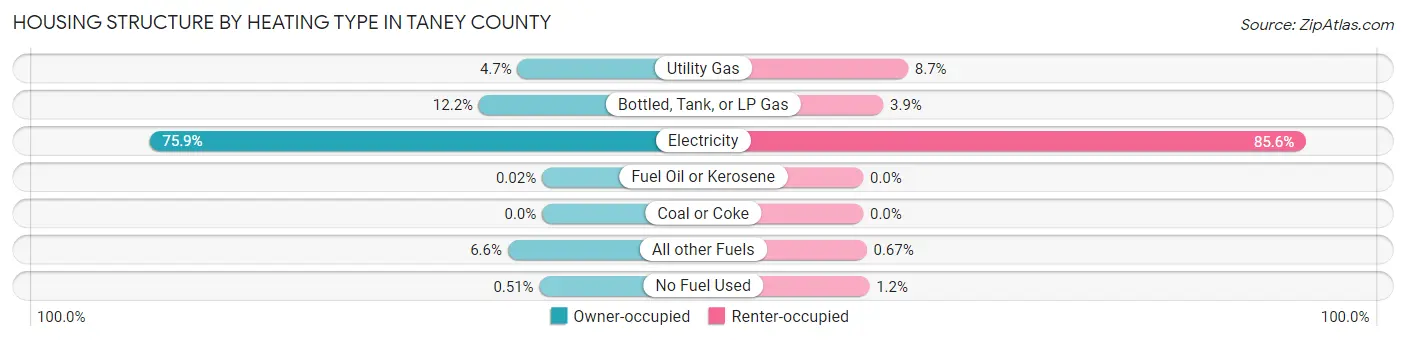
| Heating Type | Owner-occupied | Renter-occupied |
| Utility Gas | 683 (4.7%) | 623 (8.7%) |
| Bottled, Tank, or LP Gas | 1,758 (12.2%) | 279 (3.9%) |
| Electricity | 10,929 (75.9%) | 6,158 (85.6%) |
| Fuel Oil or Kerosene | 3 (0.0%) | 0 (0.0%) |
| Coal or Coke | 0 (0.0%) | 0 (0.0%) |
| All other Fuels | 954 (6.6%) | 48 (0.7%) |
| No Fuel Used | 74 (0.5%) | 86 (1.2%) |
| Total | 14,401 (100.0%) | 7,194 (100.0%) |
Household Vehicle Usage in Taney County
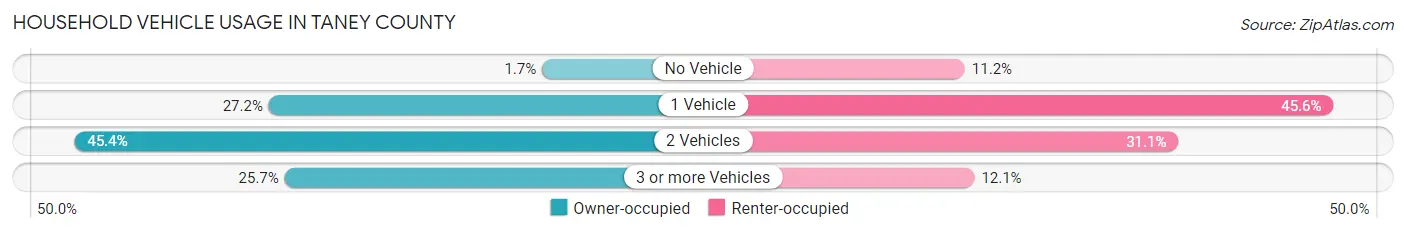
| Vehicles per Household | Owner-occupied | Renter-occupied |
| No Vehicle | 245 (1.7%) | 806 (11.2%) |
| 1 Vehicle | 3,918 (27.2%) | 3,280 (45.6%) |
| 2 Vehicles | 6,532 (45.4%) | 2,238 (31.1%) |
| 3 or more Vehicles | 3,706 (25.7%) | 870 (12.1%) |
| Total | 14,401 (100.0%) | 7,194 (100.0%) |
Real Estate & Mortgages in Taney County
Real Estate and Mortgage Overview in Taney County
| Characteristic | Without Mortgage | With Mortgage |
| Housing Units | 6,410 | 7,991 |
| Median Property Value | $166,400 | $184,600 |
| Median Household Income | $49,338 | $1,089 |
| Monthly Housing Costs | $448 | $379 |
| Real Estate Taxes | $995 | $129 |
Property Value by Mortgage Status in Taney County
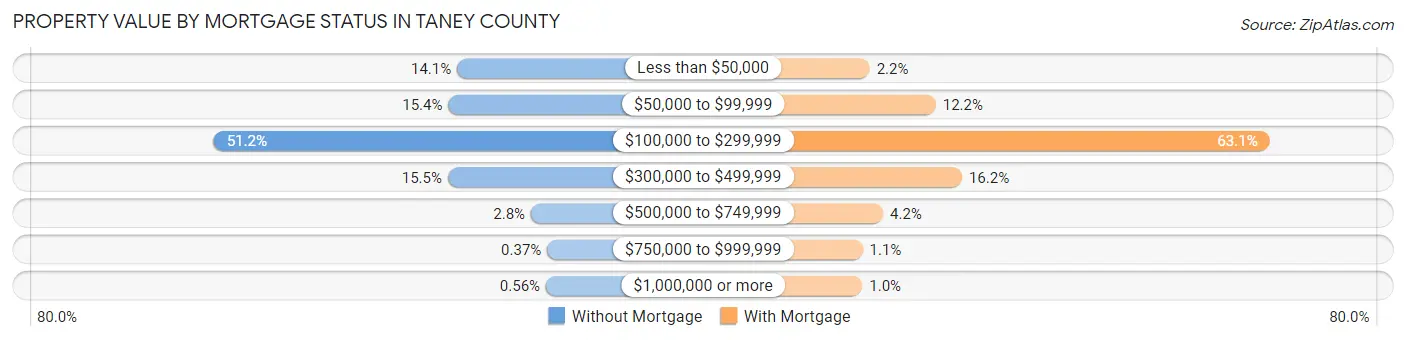
| Property Value | Without Mortgage | With Mortgage |
| Less than $50,000 | 904 (14.1%) | 173 (2.2%) |
| $50,000 to $99,999 | 990 (15.4%) | 977 (12.2%) |
| $100,000 to $299,999 | 3,280 (51.2%) | 5,040 (63.1%) |
| $300,000 to $499,999 | 994 (15.5%) | 1,296 (16.2%) |
| $500,000 to $749,999 | 182 (2.8%) | 336 (4.2%) |
| $750,000 to $999,999 | 24 (0.4%) | 86 (1.1%) |
| $1,000,000 or more | 36 (0.6%) | 83 (1.0%) |
| Total | 6,410 (100.0%) | 7,991 (100.0%) |
Household Income by Mortgage Status in Taney County
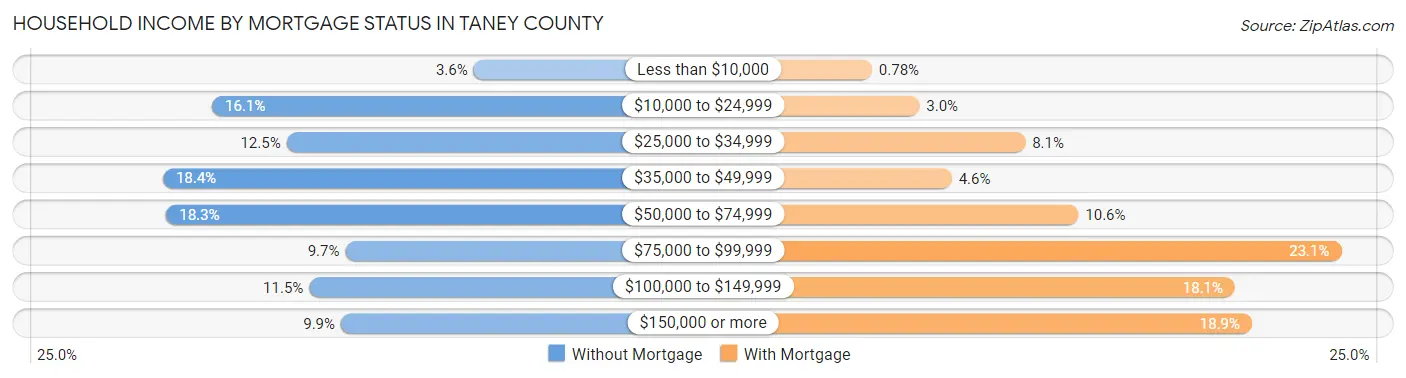
| Household Income | Without Mortgage | With Mortgage |
| Less than $10,000 | 232 (3.6%) | 62 (0.8%) |
| $10,000 to $24,999 | 1,030 (16.1%) | 243 (3.0%) |
| $25,000 to $34,999 | 803 (12.5%) | 646 (8.1%) |
| $35,000 to $49,999 | 1,180 (18.4%) | 366 (4.6%) |
| $50,000 to $74,999 | 1,170 (18.2%) | 848 (10.6%) |
| $75,000 to $99,999 | 624 (9.7%) | 1,848 (23.1%) |
| $100,000 to $149,999 | 734 (11.5%) | 1,443 (18.1%) |
| $150,000 or more | 637 (9.9%) | 1,508 (18.9%) |
| Total | 6,410 (100.0%) | 7,991 (100.0%) |
Property Value to Household Income Ratio in Taney County
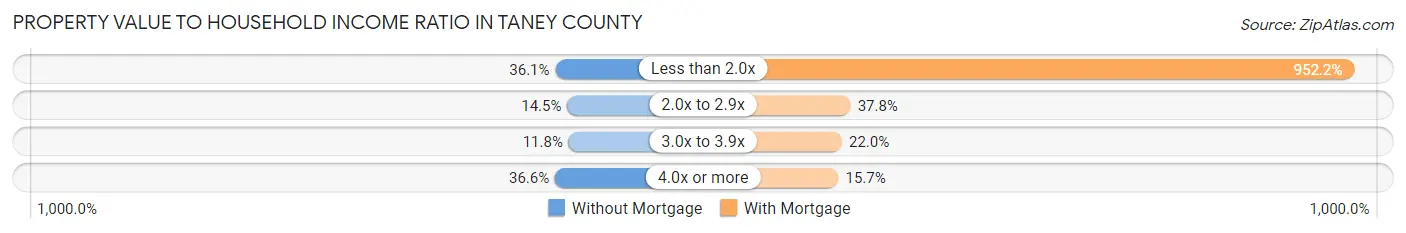
| Value-to-Income Ratio | Without Mortgage | With Mortgage |
| Less than 2.0x | 2,313 (36.1%) | 76,091 (952.2%) |
| 2.0x to 2.9x | 926 (14.4%) | 3,017 (37.8%) |
| 3.0x to 3.9x | 754 (11.8%) | 1,761 (22.0%) |
| 4.0x or more | 2,347 (36.6%) | 1,255 (15.7%) |
| Total | 6,410 (100.0%) | 7,991 (100.0%) |
Real Estate Taxes by Mortgage Status in Taney County
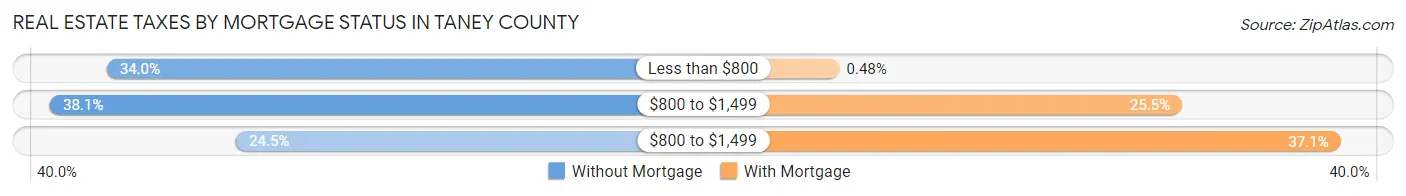
| Property Taxes | Without Mortgage | With Mortgage |
| Less than $800 | 2,179 (34.0%) | 38 (0.5%) |
| $800 to $1,499 | 2,445 (38.1%) | 2,038 (25.5%) |
| $800 to $1,499 | 1,573 (24.5%) | 2,963 (37.1%) |
| Total | 6,410 (100.0%) | 7,991 (100.0%) |
Health & Disability in Taney County
Health Insurance Coverage by Age in Taney County
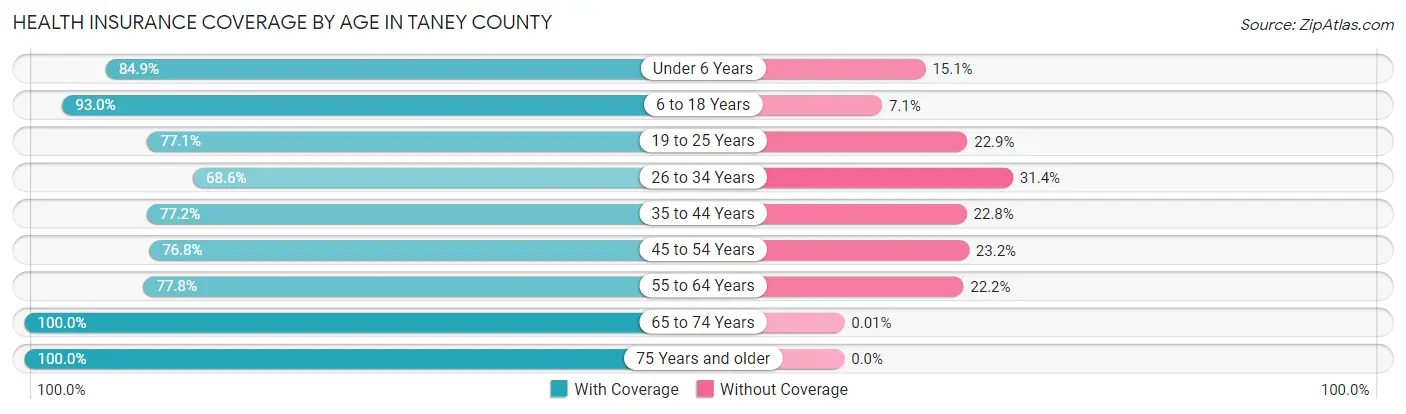
| Age Bracket | With Coverage | Without Coverage |
| Under 6 Years | 3,000 (84.9%) | 535 (15.1%) |
| 6 to 18 Years | 8,346 (92.9%) | 633 (7.0%) |
| 19 to 25 Years | 4,394 (77.1%) | 1,308 (22.9%) |
| 26 to 34 Years | 3,702 (68.6%) | 1,698 (31.4%) |
| 35 to 44 Years | 4,564 (77.2%) | 1,348 (22.8%) |
| 45 to 54 Years | 5,062 (76.8%) | 1,533 (23.2%) |
| 55 to 64 Years | 5,735 (77.8%) | 1,636 (22.2%) |
| 65 to 74 Years | 7,204 (100.0%) | 1 (0.0%) |
| 75 Years and older | 5,063 (100.0%) | 0 (0.0%) |
| Total | 47,070 (84.4%) | 8,692 (15.6%) |
Health Insurance Coverage by Citizenship Status in Taney County
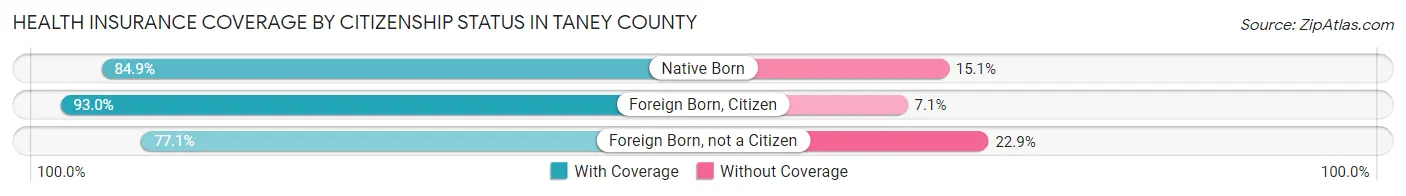
| Citizenship Status | With Coverage | Without Coverage |
| Native Born | 3,000 (84.9%) | 535 (15.1%) |
| Foreign Born, Citizen | 8,346 (92.9%) | 633 (7.0%) |
| Foreign Born, not a Citizen | 4,394 (77.1%) | 1,308 (22.9%) |
Health Insurance Coverage by Household Income in Taney County
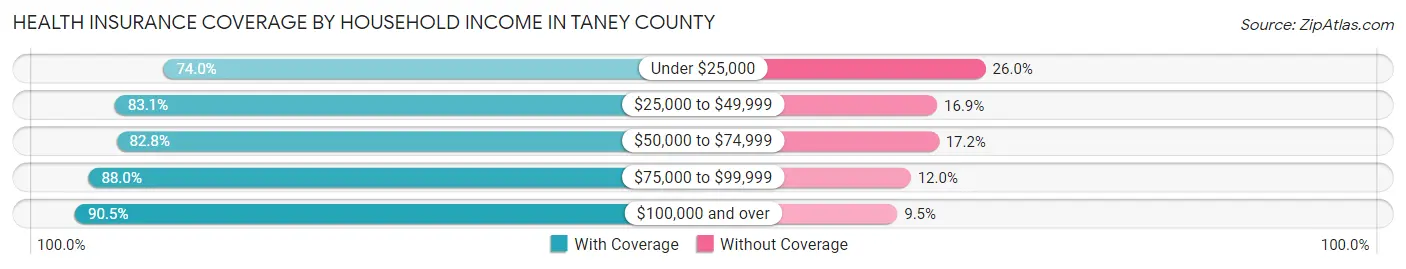
| Household Income | With Coverage | Without Coverage |
| Under $25,000 | 5,828 (74.0%) | 2,050 (26.0%) |
| $25,000 to $49,999 | 9,951 (83.1%) | 2,027 (16.9%) |
| $50,000 to $74,999 | 10,741 (82.8%) | 2,235 (17.2%) |
| $75,000 to $99,999 | 6,523 (88.0%) | 888 (12.0%) |
| $100,000 and over | 12,782 (90.5%) | 1,336 (9.5%) |
Public vs Private Health Insurance Coverage by Age in Taney County
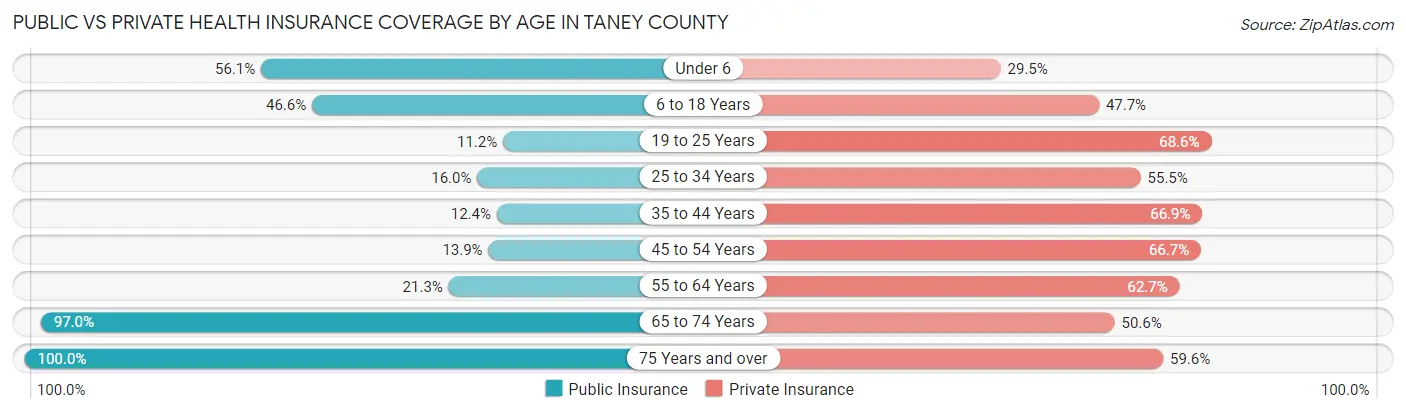
| Age Bracket | Public Insurance | Private Insurance |
| Under 6 | 1,983 (56.1%) | 1,042 (29.5%) |
| 6 to 18 Years | 4,187 (46.6%) | 4,286 (47.7%) |
| 19 to 25 Years | 638 (11.2%) | 3,911 (68.6%) |
| 25 to 34 Years | 863 (16.0%) | 2,995 (55.5%) |
| 35 to 44 Years | 731 (12.4%) | 3,956 (66.9%) |
| 45 to 54 Years | 917 (13.9%) | 4,397 (66.7%) |
| 55 to 64 Years | 1,569 (21.3%) | 4,620 (62.7%) |
| 65 to 74 Years | 6,988 (97.0%) | 3,648 (50.6%) |
| 75 Years and over | 5,063 (100.0%) | 3,019 (59.6%) |
| Total | 22,939 (41.1%) | 31,874 (57.2%) |
Disability Status by Sex by Age in Taney County
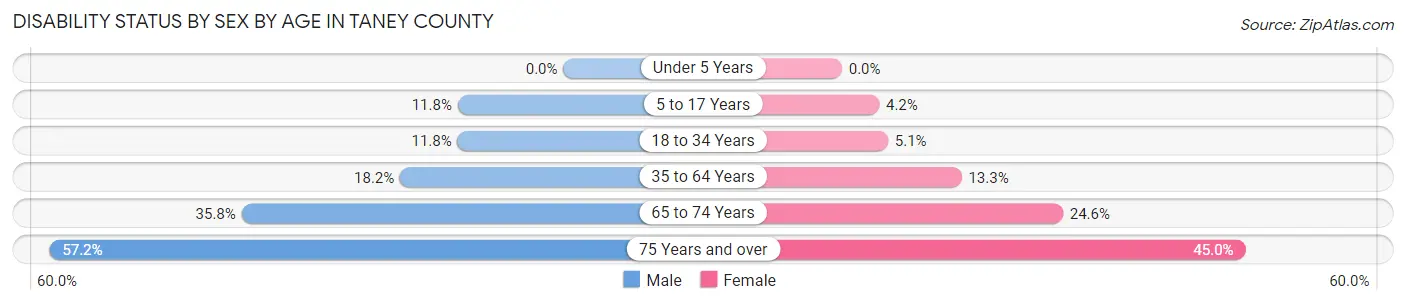
| Age Bracket | Male | Female |
| Under 5 Years | 0 (0.0%) | 0 (0.0%) |
| 5 to 17 Years | 517 (11.8%) | 181 (4.2%) |
| 18 to 34 Years | 687 (11.8%) | 317 (5.1%) |
| 35 to 64 Years | 1,714 (18.2%) | 1,393 (13.3%) |
| 65 to 74 Years | 1,198 (35.8%) | 950 (24.6%) |
| 75 Years and over | 1,328 (57.2%) | 1,233 (45.0%) |
Disability Class by Sex by Age in Taney County
Disability Class: Hearing Difficulty
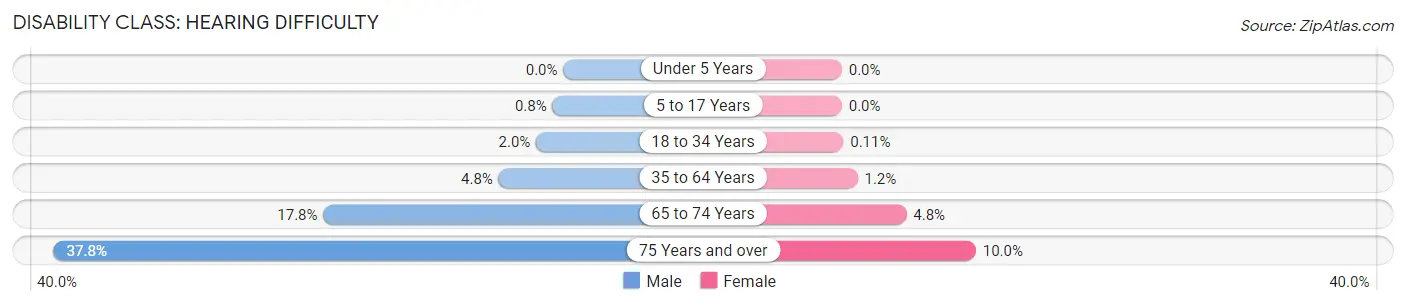
| Age Bracket | Male | Female |
| Under 5 Years | 0 (0.0%) | 0 (0.0%) |
| 5 to 17 Years | 35 (0.8%) | 0 (0.0%) |
| 18 to 34 Years | 118 (2.0%) | 7 (0.1%) |
| 35 to 64 Years | 453 (4.8%) | 122 (1.2%) |
| 65 to 74 Years | 596 (17.8%) | 185 (4.8%) |
| 75 Years and over | 878 (37.8%) | 273 (10.0%) |
Disability Class: Vision Difficulty
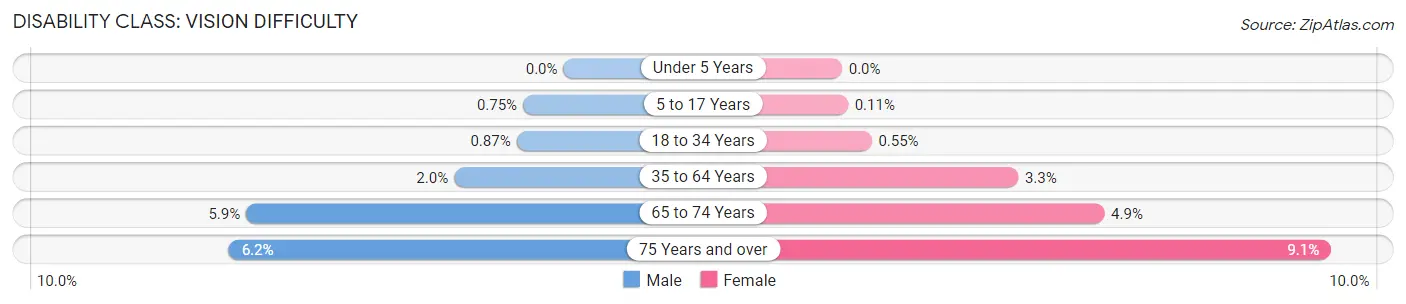
| Age Bracket | Male | Female |
| Under 5 Years | 0 (0.0%) | 0 (0.0%) |
| 5 to 17 Years | 33 (0.7%) | 5 (0.1%) |
| 18 to 34 Years | 51 (0.9%) | 34 (0.5%) |
| 35 to 64 Years | 191 (2.0%) | 342 (3.3%) |
| 65 to 74 Years | 197 (5.9%) | 188 (4.9%) |
| 75 Years and over | 144 (6.2%) | 249 (9.1%) |
Disability Class: Cognitive Difficulty
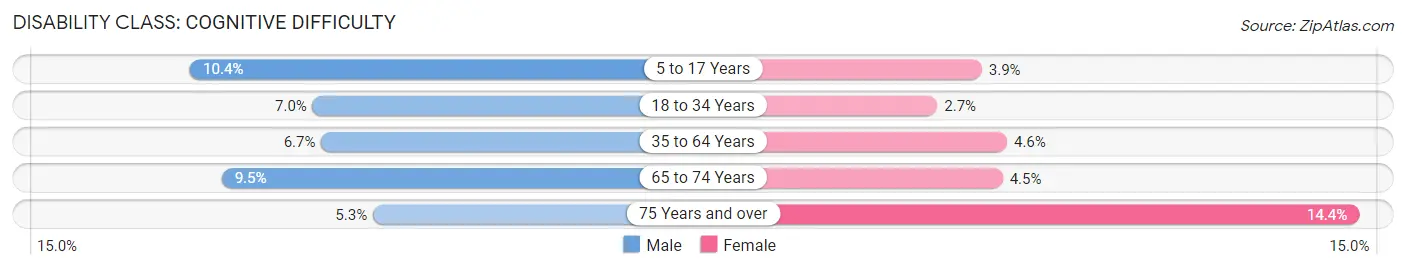
| Age Bracket | Male | Female |
| 5 to 17 Years | 457 (10.4%) | 170 (3.9%) |
| 18 to 34 Years | 407 (7.0%) | 164 (2.7%) |
| 35 to 64 Years | 635 (6.7%) | 481 (4.6%) |
| 65 to 74 Years | 318 (9.5%) | 173 (4.5%) |
| 75 Years and over | 123 (5.3%) | 395 (14.4%) |
Disability Class: Ambulatory Difficulty
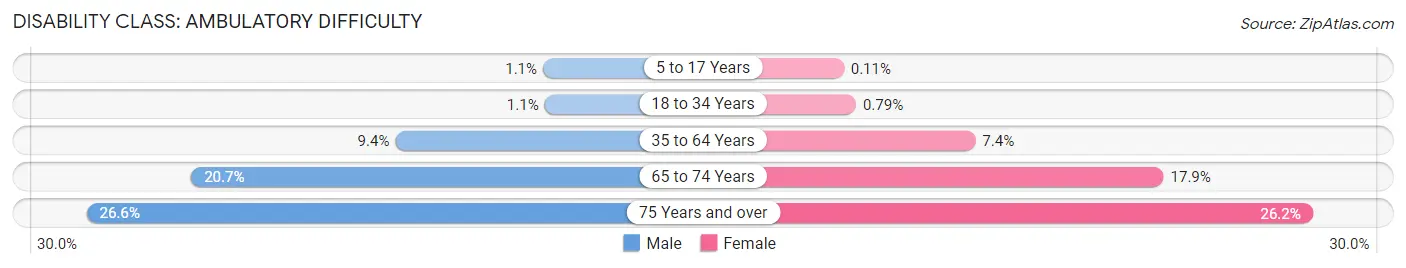
| Age Bracket | Male | Female |
| 5 to 17 Years | 50 (1.1%) | 5 (0.1%) |
| 18 to 34 Years | 61 (1.1%) | 49 (0.8%) |
| 35 to 64 Years | 882 (9.4%) | 777 (7.4%) |
| 65 to 74 Years | 693 (20.7%) | 692 (17.9%) |
| 75 Years and over | 616 (26.6%) | 719 (26.2%) |
Disability Class: Self-Care Difficulty
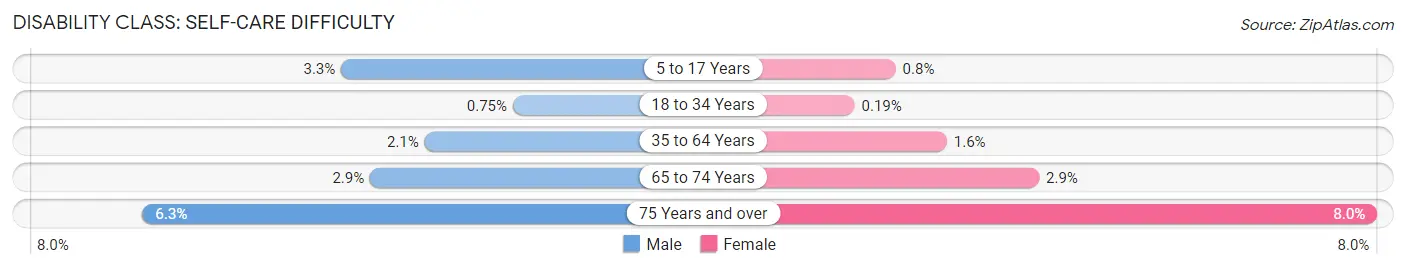
| Age Bracket | Male | Female |
| 5 to 17 Years | 145 (3.3%) | 35 (0.8%) |
| 18 to 34 Years | 44 (0.7%) | 12 (0.2%) |
| 35 to 64 Years | 194 (2.1%) | 163 (1.6%) |
| 65 to 74 Years | 96 (2.9%) | 113 (2.9%) |
| 75 Years and over | 145 (6.2%) | 218 (8.0%) |
Technology Access in Taney County
Computing Device Access in Taney County
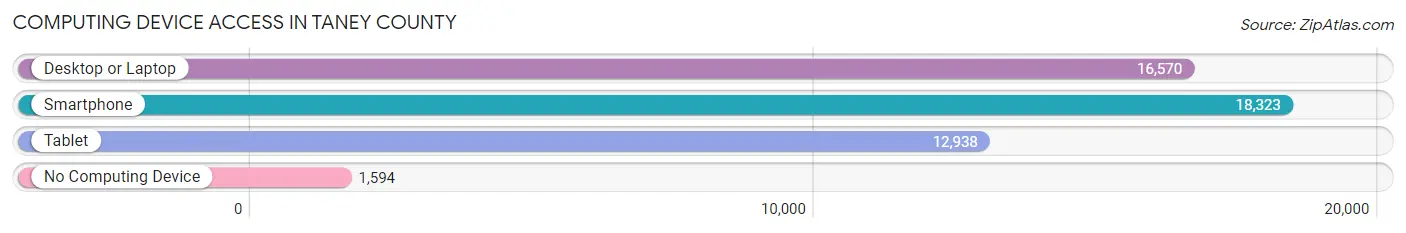
| Device Type | # Households | % Households |
| Desktop or Laptop | 16,570 | 76.7% |
| Smartphone | 18,323 | 84.9% |
| Tablet | 12,938 | 59.9% |
| No Computing Device | 1,594 | 7.4% |
| Total | 21,595 | 100.0% |
Internet Access in Taney County
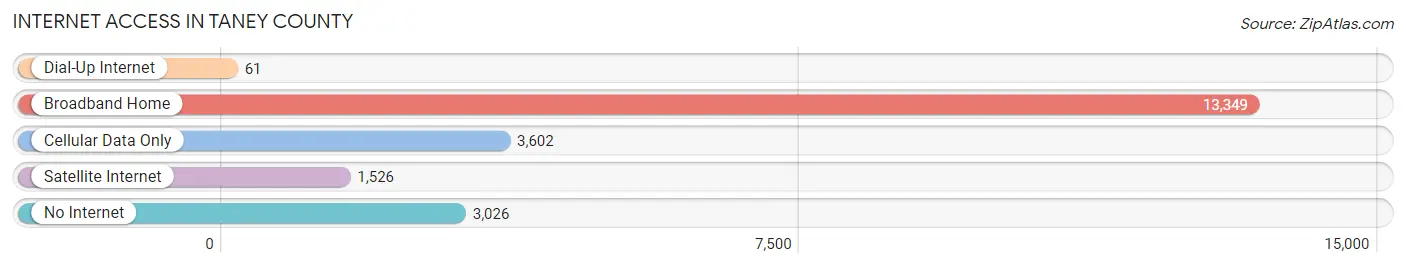
| Internet Type | # Households | % Households |
| Dial-Up Internet | 61 | 0.3% |
| Broadband Home | 13,349 | 61.8% |
| Cellular Data Only | 3,602 | 16.7% |
| Satellite Internet | 1,526 | 7.1% |
| No Internet | 3,026 | 14.0% |
| Total | 21,595 | 100.0% |
Taney County Summary
Taney County is located in the southwestern corner of Missouri, and is part of the Ozark Plateau. It is bordered by Christian County to the north, Stone County to the east, and Arkansas to the south and west. The county seat is Forsyth, and the largest city is Branson. As of the 2010 census, the population was 51,675.
Geography
Taney County covers an area of 745 square miles, and is located in the Ozark Mountains. The county is mostly hilly, with elevations ranging from 600 to 1,400 feet above sea level. The highest point is on the western border, near the Arkansas state line. The county is drained by the White River and its tributaries, including the James, Kings, and Little North Fork Rivers. The county is mostly forested, with oak, hickory, and pine trees.
History
Taney County was established in 1837, and was named after Roger B. Taney, the fifth Chief Justice of the United States Supreme Court. The county was originally part of Greene County, and was created to provide a more convenient location for the county seat. The first settlers arrived in the area in the early 1800s, and the county was officially organized in 1845.
The county was largely agricultural in the 19th century, with corn, wheat, and oats being the main crops. The timber industry also flourished, with the White River providing an easy means of transportation for logs. The county was also home to several lead and zinc mines, which provided employment for many of the residents.
Economy
Taney County’s economy is largely based on tourism, with the city of Branson being the main attraction. The city is home to numerous theaters, restaurants, and other attractions, and is a popular destination for both domestic and international tourists. The county is also home to several large employers, including Bass Pro Shops, Walmart, and the College of the Ozarks.
The county is also home to several manufacturing companies, including the Branson Tractor Company, which produces tractors and other agricultural equipment. The county is also home to several wineries, and is a popular destination for wine enthusiasts.
Demographics
As of the 2010 census, the population of Taney County was 51,675, with a population density of 69.3 people per square mile. The median age was 44.2 years, and the median household income was $41,945. The racial makeup of the county was 95.2% White, 1.2% African American, 0.7% Native American, 0.5% Asian, 0.1% Pacific Islander, and 1.3% from other races.
The largest ancestry groups in the county were German (25.2%), English (17.2%), Irish (14.2%), and American (13.2%). The largest religious affiliations were Baptist (30.2%), Methodist (14.2%), and Catholic (10.2%).
Conclusion
Taney County is located in the southwestern corner of Missouri, and is part of the Ozark Plateau. It is bordered by Christian County to the north, Stone County to the east, and Arkansas to the south and west. The county was established in 1837, and was named after Roger B. Taney, the fifth Chief Justice of the United States Supreme Court. The county’s economy is largely based on tourism, with the city of Branson being the main attraction. As of the 2010 census, the population of Taney County was 51,675, with a population density of 69.3 people per square mile. The largest ancestry groups in the county were German (25.2%), English (17.2%), Irish (14.2%), and American (13.2%).
Common Questions
What is Per Capita Income in Taney County?
Per Capita income in Taney County is $28,267.
What is the Median Family Income in Taney County?
Median Family Income in Taney County is $63,399.
What is the Median Household income in Taney County?
Median Household Income in Taney County is $54,467.
What is Income or Wage Gap in Taney County?
Income or Wage Gap in Taney County is 20.6%.
Women in Taney County earn 79.4 cents for every dollar earned by a man.
What is Family Income Deficit in Taney County?
Family Income Deficit in Taney County is $7,279.
Families that are below poverty line in Taney County earn $7,279 less on average than the poverty threshold level.
What is Inequality or Gini Index in Taney County?
Inequality or Gini Index in Taney County is 0.44.
What is the Total Population of Taney County?
Total Population of Taney County is 56,202.
What is the Total Male Population of Taney County?
Total Male Population of Taney County is 26,873.
What is the Total Female Population of Taney County?
Total Female Population of Taney County is 29,329.
What is the Ratio of Males per 100 Females in Taney County?
There are 91.63 Males per 100 Females in Taney County.
What is the Ratio of Females per 100 Males in Taney County?
There are 109.14 Females per 100 Males in Taney County.
What is the Median Population Age in Taney County?
Median Population Age in Taney County is 42.3 Years.
What is the Average Family Size in Taney County
Average Family Size in Taney County is 3.1 People.
What is the Average Household Size in Taney County
Average Household Size in Taney County is 2.5 People.
How Large is the Labor Force in Taney County?
There are 26,872 People in the Labor Forcein in Taney County.
What is the Percentage of People in the Labor Force in Taney County?
58.2% of People are in the Labor Force in Taney County.
What is the Unemployment Rate in Taney County?
Unemployment Rate in Taney County is 5.1%.