Sullivan County, MO Map & Demographics
Sullivan County Map
Sullivan County Overview
$25,882
PER CAPITA INCOME
$64,911
AVG FAMILY INCOME
$53,438
AVG HOUSEHOLD INCOME
20.1%
WAGE / INCOME GAP [ % ]
79.9¢/ $1
WAGE / INCOME GAP [ $ ]
$8,256
FAMILY INCOME DEFICIT
0.42
INEQUALITY / GINI INDEX
5,983
TOTAL POPULATION
3,001
MALE POPULATION
2,982
FEMALE POPULATION
100.64
MALES / 100 FEMALES
99.37
FEMALES / 100 MALES
43.9
MEDIAN AGE
3.9
AVG FAMILY SIZE
2.9
AVG HOUSEHOLD SIZE
2,704
LABOR FORCE [ PEOPLE ]
56.1%
PERCENT IN LABOR FORCE
2.4%
UNEMPLOYMENT RATE
Sullivan County Area Codes
Income in Sullivan County
Income Overview in Sullivan County
Per Capita Income in Sullivan County is $25,882, while median incomes of families and households are $64,911 and $53,438 respectively.
| Characteristic | Number | Measure |
| Per Capita Income | 5,983 | $25,882 |
| Median Family Income | 1,177 | $64,911 |
| Mean Family Income | 1,177 | $81,090 |
| Median Household Income | 1,991 | $53,438 |
| Mean Household Income | 1,991 | $66,272 |
| Income Deficit | 1,177 | $8,256 |
| Wage / Income Gap (%) | 5,983 | 20.10% |
| Wage / Income Gap ($) | 5,983 | 79.90¢ per $1 |
| Gini / Inequality Index | 5,983 | 0.42 |
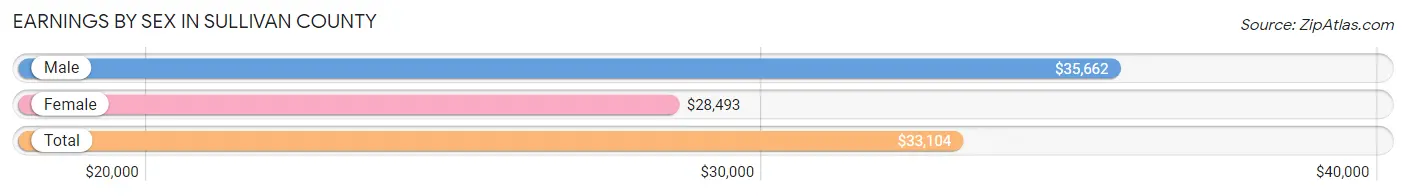
Earnings by Sex in Sullivan County
Average Earnings in Sullivan County are $33,104, $35,662 for men and $28,493 for women, a difference of 20.1%.
| Sex | Number | Average Earnings |
| Male | 1,466 (52.2%) | $35,662 |
| Female | 1,344 (47.8%) | $28,493 |
| Total | 2,810 (100.0%) | $33,104 |
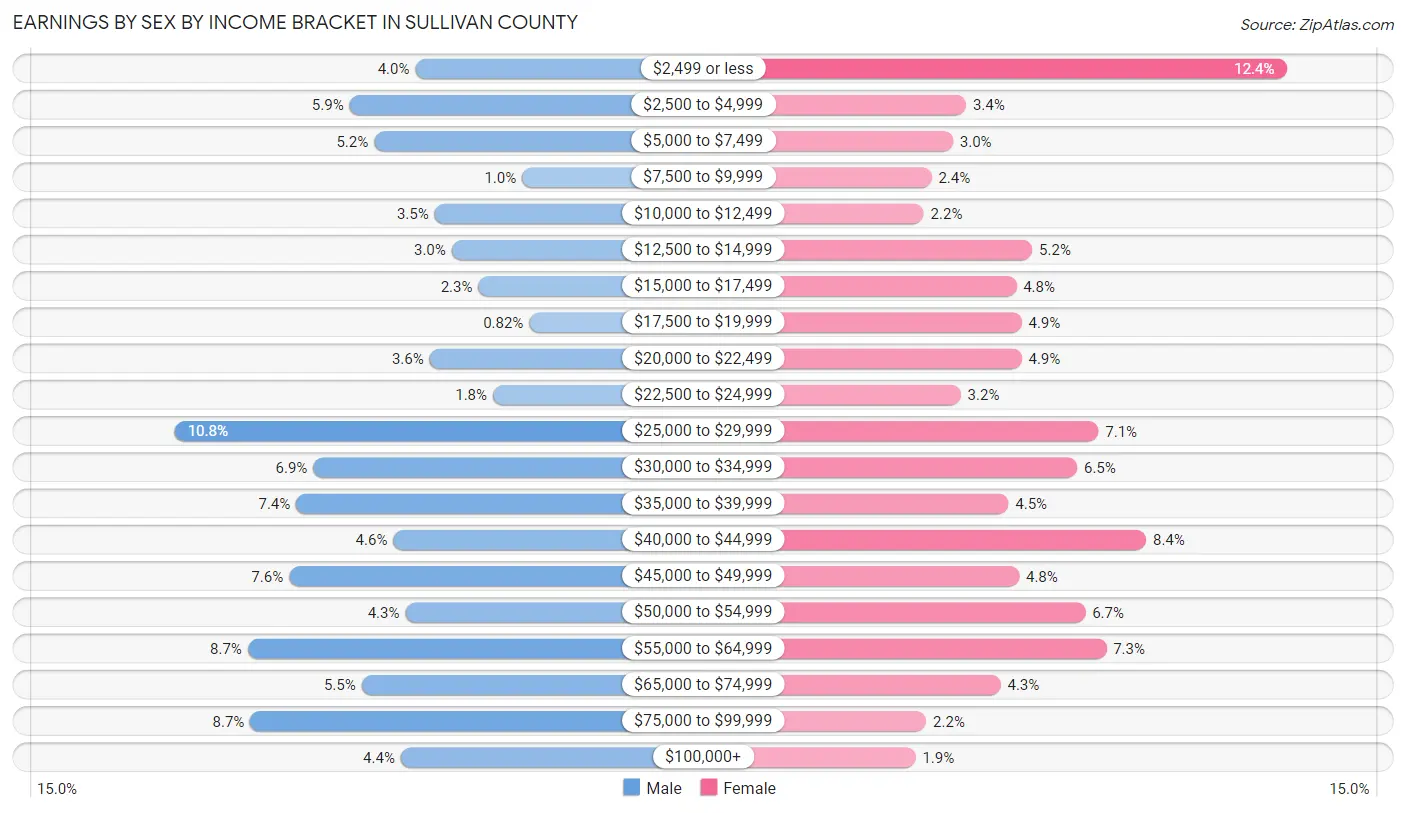
Earnings by Sex by Income Bracket in Sullivan County
The most common earnings brackets in Sullivan County are $25,000 to $29,999 for men (158 | 10.8%) and $2,499 or less for women (166 | 12.3%).
| Income | Male | Female |
| $2,499 or less | 59 (4.0%) | 166 (12.3%) |
| $2,500 to $4,999 | 86 (5.9%) | 45 (3.4%) |
| $5,000 to $7,499 | 76 (5.2%) | 40 (3.0%) |
| $7,500 to $9,999 | 15 (1.0%) | 32 (2.4%) |
| $10,000 to $12,499 | 51 (3.5%) | 29 (2.2%) |
| $12,500 to $14,999 | 44 (3.0%) | 70 (5.2%) |
| $15,000 to $17,499 | 33 (2.2%) | 64 (4.8%) |
| $17,500 to $19,999 | 12 (0.8%) | 66 (4.9%) |
| $20,000 to $22,499 | 53 (3.6%) | 66 (4.9%) |
| $22,500 to $24,999 | 27 (1.8%) | 43 (3.2%) |
| $25,000 to $29,999 | 158 (10.8%) | 95 (7.1%) |
| $30,000 to $34,999 | 101 (6.9%) | 87 (6.5%) |
| $35,000 to $39,999 | 108 (7.4%) | 61 (4.5%) |
| $40,000 to $44,999 | 68 (4.6%) | 113 (8.4%) |
| $45,000 to $49,999 | 111 (7.6%) | 65 (4.8%) |
| $50,000 to $54,999 | 63 (4.3%) | 90 (6.7%) |
| $55,000 to $64,999 | 128 (8.7%) | 98 (7.3%) |
| $65,000 to $74,999 | 81 (5.5%) | 58 (4.3%) |
| $75,000 to $99,999 | 127 (8.7%) | 30 (2.2%) |
| $100,000+ | 65 (4.4%) | 26 (1.9%) |
| Total | 1,466 (100.0%) | 1,344 (100.0%) |
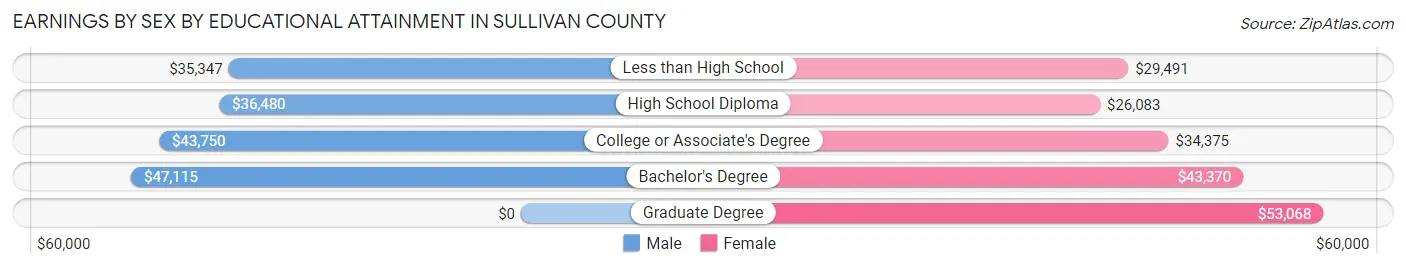
Earnings by Sex by Educational Attainment in Sullivan County
Average earnings in Sullivan County are $37,788 for men and $33,061 for women, a difference of 12.5%. Men with an educational attainment of bachelor's degree enjoy the highest average annual earnings of $47,115, while those with less than high school education earn the least with $35,347. Women with an educational attainment of graduate degree earn the most with the average annual earnings of $53,068, while those with high school diploma education have the smallest earnings of $26,083.
| Educational Attainment | Male Income | Female Income |
| Less than High School | $35,347 | $29,491 |
| High School Diploma | $36,480 | $26,083 |
| College or Associate's Degree | $43,750 | $34,375 |
| Bachelor's Degree | $47,115 | $43,370 |
| Graduate Degree | - | - |
| Total | $37,788 | $33,061 |
Family Income in Sullivan County
Family Income Brackets in Sullivan County
According to the Sullivan County family income data, there are 317 families falling into the $50,000 to $74,999 income range, which is the most common income bracket and makes up 26.9% of all families. Conversely, the $10,000 to $14,999 income bracket is the least frequent group with only 26 families (2.2%) belonging to this category.
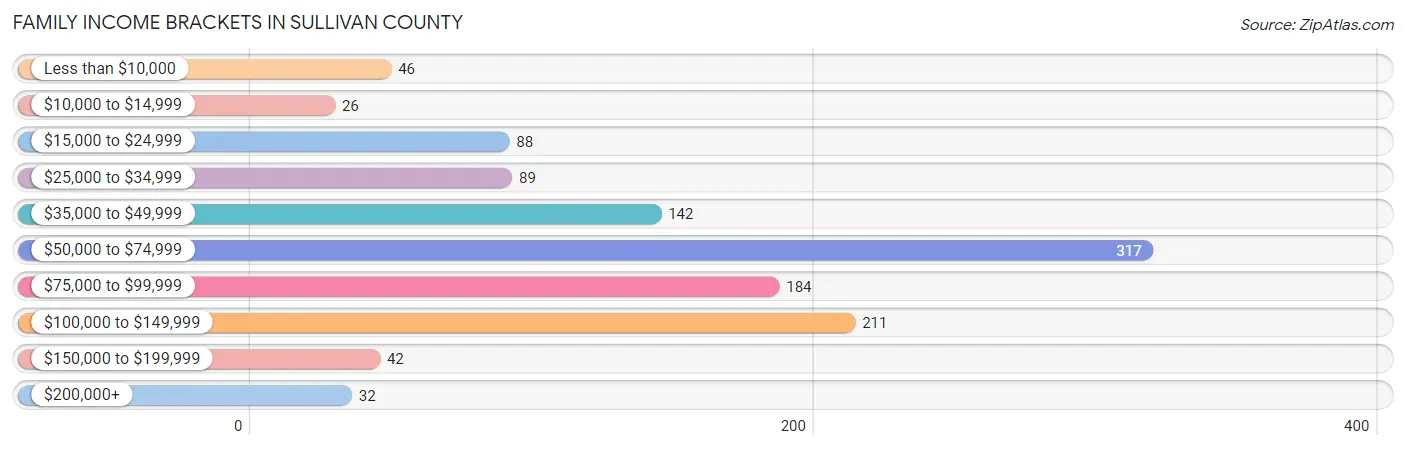
| Income Bracket | # Families | % Families |
| Less than $10,000 | 46 | 3.9% |
| $10,000 to $14,999 | 26 | 2.2% |
| $15,000 to $24,999 | 88 | 7.5% |
| $25,000 to $34,999 | 89 | 7.6% |
| $35,000 to $49,999 | 142 | 12.1% |
| $50,000 to $74,999 | 317 | 26.9% |
| $75,000 to $99,999 | 184 | 15.6% |
| $100,000 to $149,999 | 211 | 17.9% |
| $150,000 to $199,999 | 42 | 3.6% |
| $200,000+ | 32 | 2.7% |
Family Income by Famaliy Size in Sullivan County
6-person families (19 | 1.6%) account for the highest median family income in Sullivan County with $104,821 per family, while 2-person families (649 | 55.1%) have the highest median income of $31,652 per family member.
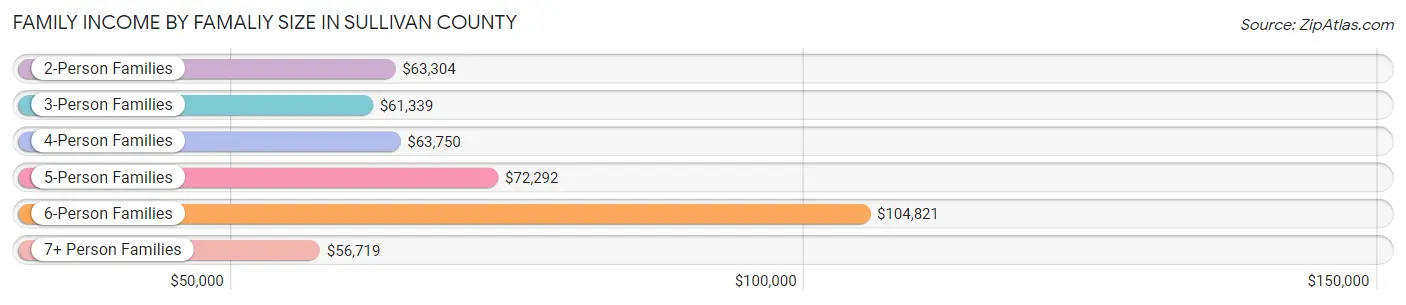
| Income Bracket | # Families | Median Income |
| 2-Person Families | 649 (55.1%) | $63,304 |
| 3-Person Families | 295 (25.1%) | $61,339 |
| 4-Person Families | 116 (9.9%) | $63,750 |
| 5-Person Families | 85 (7.2%) | $72,292 |
| 6-Person Families | 19 (1.6%) | $104,821 |
| 7+ Person Families | 13 (1.1%) | $56,719 |
| Total | 1,177 (100.0%) | $64,911 |
Family Income by Number of Earners in Sullivan County
The median family income in Sullivan County is $64,911, with families comprising 3+ earners (103) having the highest median family income of $122,969, while families with no earners (236) have the lowest median family income of $30,938, accounting for 8.7% and 20.1% of families, respectively.
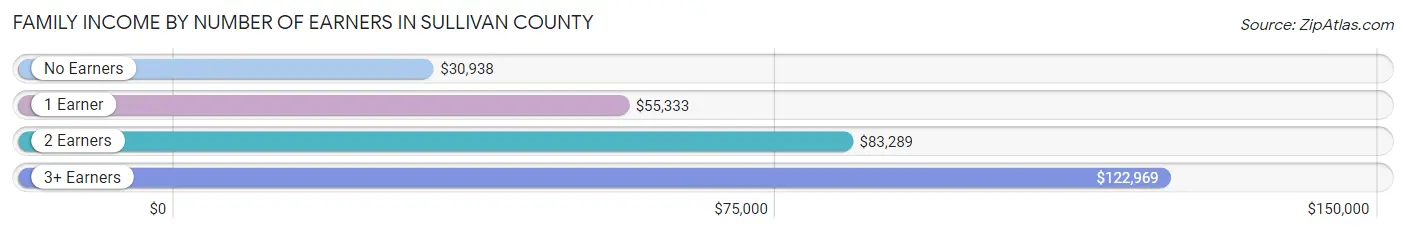
| Number of Earners | # Families | Median Income |
| No Earners | 236 (20.1%) | $30,938 |
| 1 Earner | 410 (34.8%) | $55,333 |
| 2 Earners | 428 (36.4%) | $83,289 |
| 3+ Earners | 103 (8.7%) | $122,969 |
| Total | 1,177 (100.0%) | $64,911 |
Household Income in Sullivan County
Household Income Brackets in Sullivan County
With 448 households falling in the category, the $50,000 to $74,999 income range is the most frequent in Sullivan County, accounting for 22.5% of all households. In contrast, only 36 households (1.8%) fall into the $200,000+ income bracket, making it the least populous group.
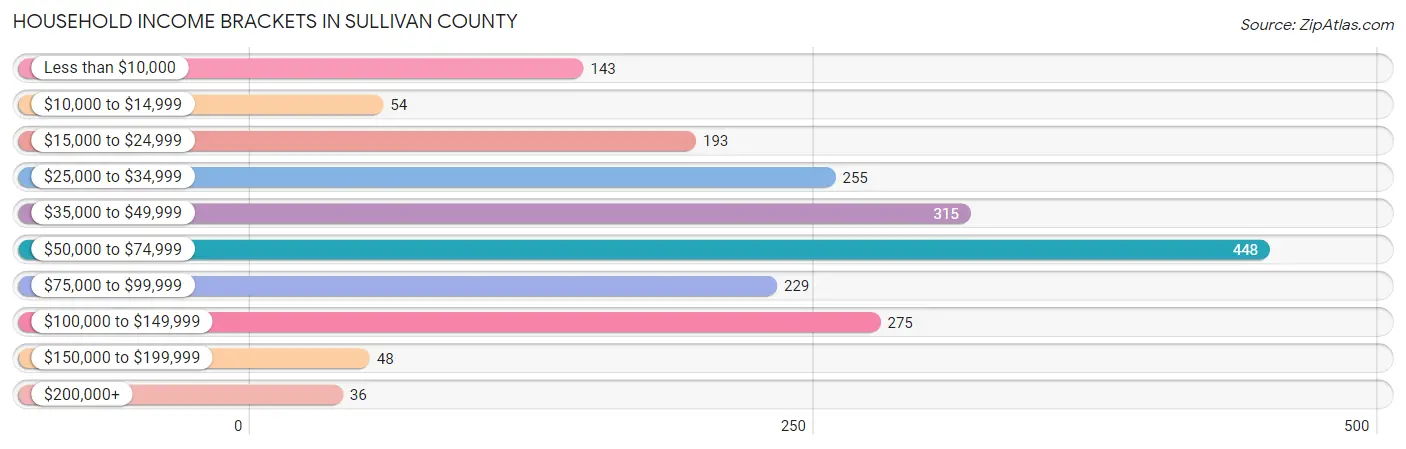
| Income Bracket | # Households | % Households |
| Less than $10,000 | 143 | 7.2% |
| $10,000 to $14,999 | 54 | 2.7% |
| $15,000 to $24,999 | 193 | 9.7% |
| $25,000 to $34,999 | 255 | 12.8% |
| $35,000 to $49,999 | 315 | 15.8% |
| $50,000 to $74,999 | 448 | 22.5% |
| $75,000 to $99,999 | 229 | 11.5% |
| $100,000 to $149,999 | 275 | 13.8% |
| $150,000 to $199,999 | 48 | 2.4% |
| $200,000+ | 36 | 1.8% |
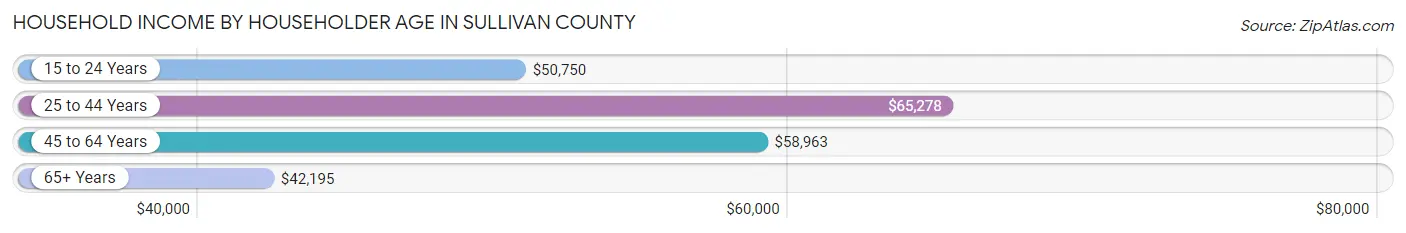
Household Income by Householder Age in Sullivan County
The median household income in Sullivan County is $53,438, with the highest median household income of $65,278 found in the 25 to 44 years age bracket for the primary householder. A total of 414 households (20.8%) fall into this category. Meanwhile, the 65+ years age bracket for the primary householder has the lowest median household income of $42,195, with 688 households (34.6%) in this group.
| Income Bracket | # Households | Median Income |
| 15 to 24 Years | 89 (4.5%) | $50,750 |
| 25 to 44 Years | 414 (20.8%) | $65,278 |
| 45 to 64 Years | 800 (40.2%) | $58,963 |
| 65+ Years | 688 (34.6%) | $42,195 |
| Total | 1,991 (100.0%) | $53,438 |
Poverty in Sullivan County
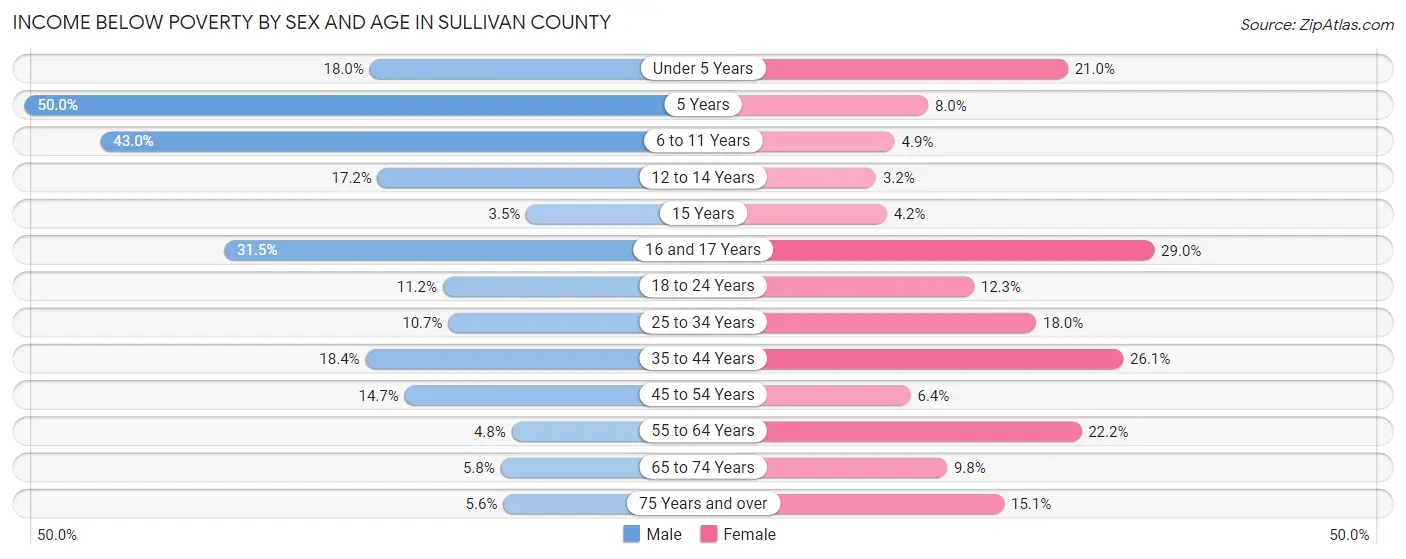
Income Below Poverty by Sex and Age in Sullivan County
With 15.2% poverty level for males and 15.1% for females among the residents of Sullivan County, 5 year old males and 16 and 17 year old females are the most vulnerable to poverty, with 11 males (50.0%) and 20 females (29.0%) in their respective age groups living below the poverty level.
| Age Bracket | Male | Female |
| Under 5 Years | 32 (18.0%) | 39 (21.0%) |
| 5 Years | 11 (50.0%) | 2 (8.0%) |
| 6 to 11 Years | 125 (43.0%) | 12 (4.9%) |
| 12 to 14 Years | 15 (17.2%) | 2 (3.2%) |
| 15 Years | 1 (3.5%) | 1 (4.2%) |
| 16 and 17 Years | 34 (31.5%) | 20 (29.0%) |
| 18 to 24 Years | 30 (11.2%) | 31 (12.2%) |
| 25 to 34 Years | 33 (10.7%) | 55 (18.0%) |
| 35 to 44 Years | 63 (18.4%) | 88 (26.1%) |
| 45 to 54 Years | 51 (14.7%) | 25 (6.4%) |
| 55 to 64 Years | 21 (4.8%) | 90 (22.2%) |
| 65 to 74 Years | 19 (5.8%) | 32 (9.8%) |
| 75 Years and over | 11 (5.6%) | 36 (15.1%) |
| Total | 446 (15.2%) | 433 (15.1%) |
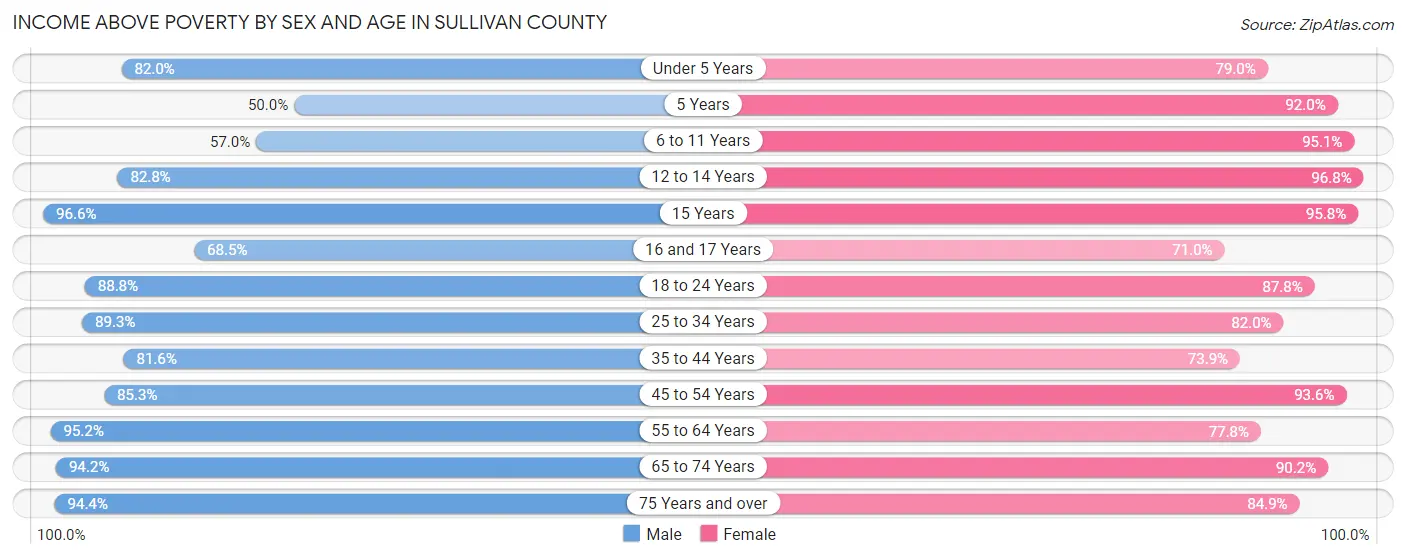
Income Above Poverty by Sex and Age in Sullivan County
According to the poverty statistics in Sullivan County, males aged 15 years and females aged 12 to 14 years are the age groups that are most secure financially, with 96.6% of males and 96.8% of females in these age groups living above the poverty line.
| Age Bracket | Male | Female |
| Under 5 Years | 146 (82.0%) | 147 (79.0%) |
| 5 Years | 11 (50.0%) | 23 (92.0%) |
| 6 to 11 Years | 166 (57.0%) | 233 (95.1%) |
| 12 to 14 Years | 72 (82.8%) | 61 (96.8%) |
| 15 Years | 28 (96.6%) | 23 (95.8%) |
| 16 and 17 Years | 74 (68.5%) | 49 (71.0%) |
| 18 to 24 Years | 238 (88.8%) | 222 (87.7%) |
| 25 to 34 Years | 276 (89.3%) | 250 (82.0%) |
| 35 to 44 Years | 280 (81.6%) | 249 (73.9%) |
| 45 to 54 Years | 295 (85.3%) | 367 (93.6%) |
| 55 to 64 Years | 416 (95.2%) | 315 (77.8%) |
| 65 to 74 Years | 307 (94.2%) | 296 (90.2%) |
| 75 Years and over | 186 (94.4%) | 203 (84.9%) |
| Total | 2,495 (84.8%) | 2,438 (84.9%) |
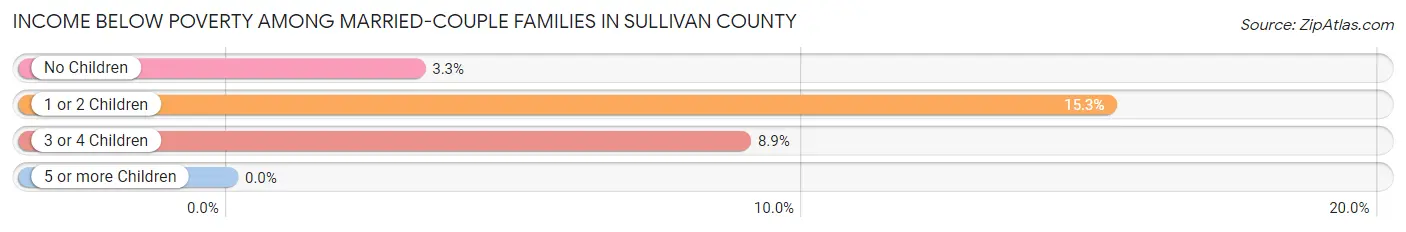
Income Below Poverty Among Married-Couple Families in Sullivan County
The poverty statistics for married-couple families in Sullivan County show that 7.0% or 63 of the total 896 families live below the poverty line. Families with 1 or 2 children have the highest poverty rate of 15.3%, comprising of 39 families. On the other hand, families with 5 or more children have the lowest poverty rate of 0.0%, which includes 0 families.
| Children | Above Poverty | Below Poverty |
| No Children | 564 (96.7%) | 19 (3.3%) |
| 1 or 2 Children | 216 (84.7%) | 39 (15.3%) |
| 3 or 4 Children | 51 (91.1%) | 5 (8.9%) |
| 5 or more Children | 2 (100.0%) | 0 (0.0%) |
| Total | 833 (93.0%) | 63 (7.0%) |
Income Below Poverty Among Single-Parent Households in Sullivan County
According to the poverty data in Sullivan County, 29.5% or 18 single-father households and 27.7% or 61 single-mother households are living below the poverty line. Among single-father households, those with 3 or 4 children have the highest poverty rate, with 2 households (100.0%) experiencing poverty. Likewise, among single-mother households, those with 3 or 4 children have the highest poverty rate, with 11 households (40.7%) falling below the poverty line.
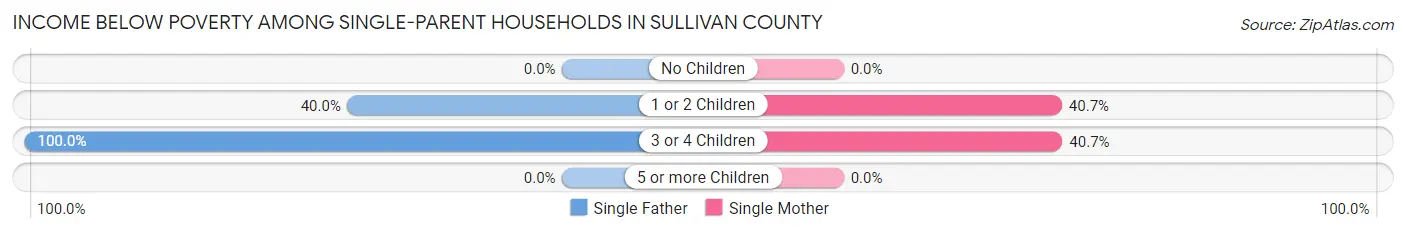
| Children | Single Father | Single Mother |
| No Children | 0 (0.0%) | 0 (0.0%) |
| 1 or 2 Children | 16 (40.0%) | 50 (40.6%) |
| 3 or 4 Children | 2 (100.0%) | 11 (40.7%) |
| 5 or more Children | 0 (0.0%) | 0 (0.0%) |
| Total | 18 (29.5%) | 61 (27.7%) |
Income Below Poverty Among Married-Couple vs Single-Parent Households in Sullivan County
The poverty data for Sullivan County shows that 63 of the married-couple family households (7.0%) and 79 of the single-parent households (28.1%) are living below the poverty level. Within the married-couple family households, those with 1 or 2 children have the highest poverty rate, with 39 households (15.3%) falling below the poverty line. Among the single-parent households, those with 3 or 4 children have the highest poverty rate, with 13 household (44.8%) living below poverty.
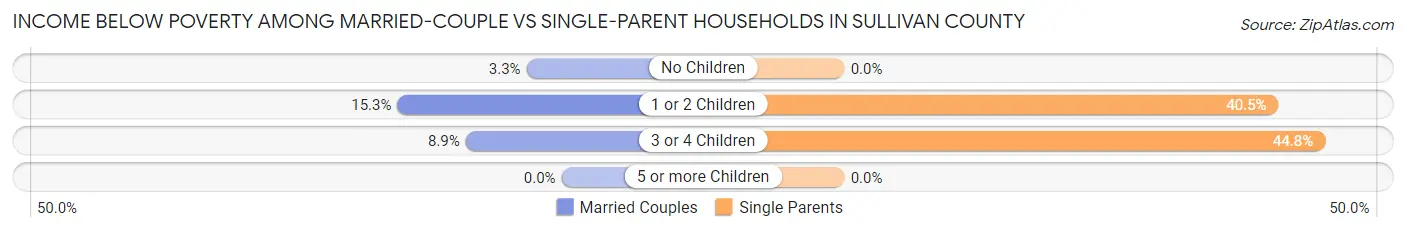
| Children | Married-Couple Families | Single-Parent Households |
| No Children | 19 (3.3%) | 0 (0.0%) |
| 1 or 2 Children | 39 (15.3%) | 66 (40.5%) |
| 3 or 4 Children | 5 (8.9%) | 13 (44.8%) |
| 5 or more Children | 0 (0.0%) | 0 (0.0%) |
| Total | 63 (7.0%) | 79 (28.1%) |
Race in Sullivan County
The most populous races in Sullivan County are White / Caucasian (5,009 | 83.7%), Hispanic or Latino (1,117 | 18.7%), and Some other Race (409 | 6.8%).
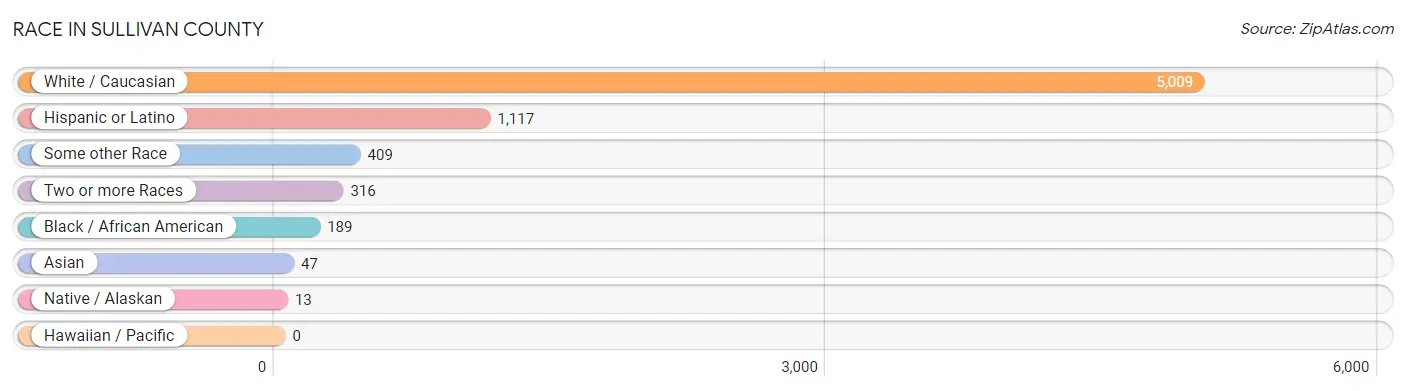
| Race | # Population | % Population |
| Asian | 47 | 0.8% |
| Black / African American | 189 | 3.2% |
| Hawaiian / Pacific | 0 | 0.0% |
| Hispanic or Latino | 1,117 | 18.7% |
| Native / Alaskan | 13 | 0.2% |
| White / Caucasian | 5,009 | 83.7% |
| Two or more Races | 316 | 5.3% |
| Some other Race | 409 | 6.8% |
| Total | 5,983 | 100.0% |
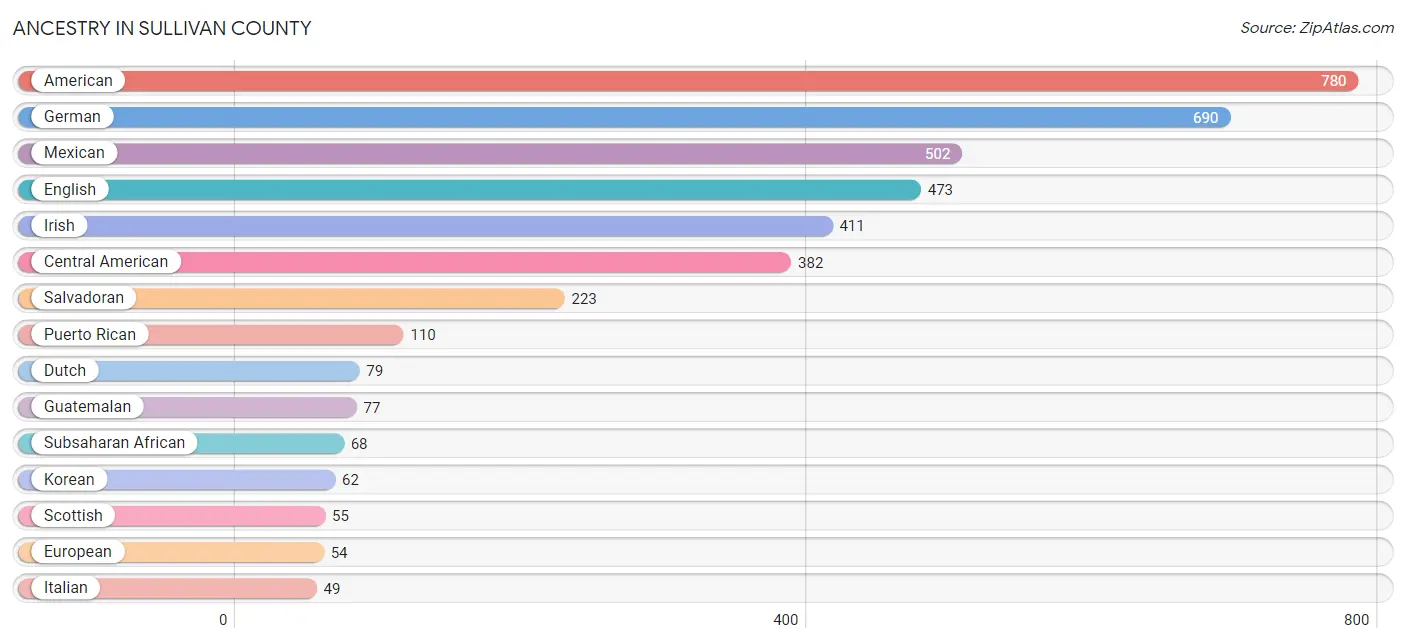
Ancestry in Sullivan County
The most populous ancestries reported in Sullivan County are American (780 | 13.0%), German (690 | 11.5%), Mexican (502 | 8.4%), English (473 | 7.9%), and Irish (411 | 6.9%), together accounting for 47.7% of all Sullivan County residents.
| Ancestry | # Population | % Population |
| American | 780 | 13.0% |
| Argentinean | 21 | 0.4% |
| Austrian | 1 | 0.0% |
| Bhutanese | 27 | 0.4% |
| British | 7 | 0.1% |
| Cajun | 14 | 0.2% |
| Canadian | 1 | 0.0% |
| Central American | 382 | 6.4% |
| Cherokee | 8 | 0.1% |
| Chilean | 2 | 0.0% |
| Costa Rican | 6 | 0.1% |
| Danish | 10 | 0.2% |
| Dutch | 79 | 1.3% |
| Eastern European | 10 | 0.2% |
| English | 473 | 7.9% |
| European | 54 | 0.9% |
| Finnish | 3 | 0.1% |
| French | 31 | 0.5% |
| French Canadian | 8 | 0.1% |
| German | 690 | 11.5% |
| Guatemalan | 77 | 1.3% |
| Haitian | 26 | 0.4% |
| Honduran | 42 | 0.7% |
| Hungarian | 1 | 0.0% |
| Irish | 411 | 6.9% |
| Italian | 49 | 0.8% |
| Korean | 62 | 1.0% |
| Mexican | 502 | 8.4% |
| Navajo | 5 | 0.1% |
| Nicaraguan | 16 | 0.3% |
| Nigerian | 24 | 0.4% |
| Norwegian | 10 | 0.2% |
| Panamanian | 18 | 0.3% |
| Pennsylvania German | 15 | 0.3% |
| Polish | 27 | 0.4% |
| Potawatomi | 9 | 0.2% |
| Puerto Rican | 110 | 1.8% |
| Salvadoran | 223 | 3.7% |
| Scotch-Irish | 26 | 0.4% |
| Scottish | 55 | 0.9% |
| Sioux | 2 | 0.0% |
| South American | 23 | 0.4% |
| Spaniard | 31 | 0.5% |
| Subsaharan African | 68 | 1.1% |
| Swedish | 16 | 0.3% |
| Swiss | 40 | 0.7% |
| Welsh | 11 | 0.2% | View All 47 Rows |
Immigrants in Sullivan County
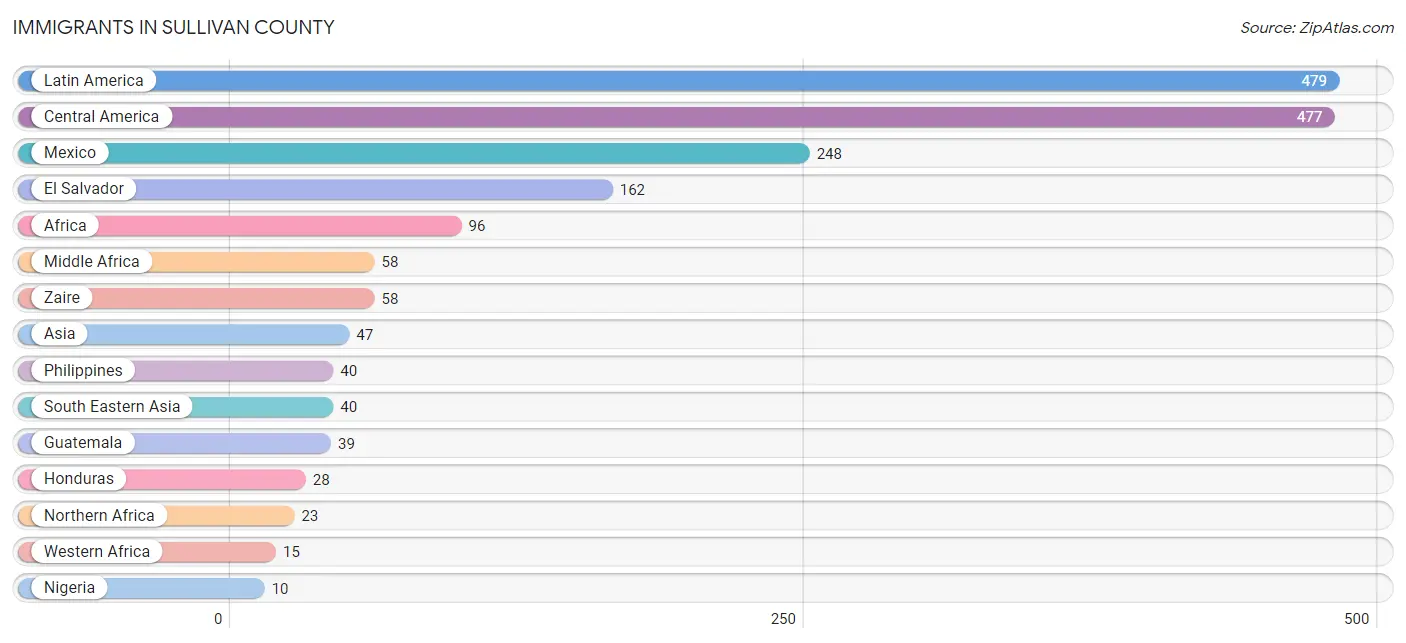
The most numerous immigrant groups reported in Sullivan County came from Latin America (479 | 8.0%), Central America (477 | 8.0%), Mexico (248 | 4.2%), El Salvador (162 | 2.7%), and Africa (96 | 1.6%), together accounting for 24.4% of all Sullivan County residents.
| Immigration Origin | # Population | % Population |
| Africa | 96 | 1.6% |
| Asia | 47 | 0.8% |
| Central America | 477 | 8.0% |
| Chile | 2 | 0.0% |
| Eastern Asia | 7 | 0.1% |
| El Salvador | 162 | 2.7% |
| Europe | 7 | 0.1% |
| Germany | 7 | 0.1% |
| Guatemala | 39 | 0.6% |
| Honduras | 28 | 0.5% |
| Japan | 7 | 0.1% |
| Latin America | 479 | 8.0% |
| Liberia | 5 | 0.1% |
| Mexico | 248 | 4.2% |
| Middle Africa | 58 | 1.0% |
| Nigeria | 10 | 0.2% |
| Northern Africa | 23 | 0.4% |
| Philippines | 40 | 0.7% |
| South America | 2 | 0.0% |
| South Eastern Asia | 40 | 0.7% |
| Western Africa | 15 | 0.3% |
| Western Europe | 7 | 0.1% |
| Zaire | 58 | 1.0% | View All 23 Rows |
Sex and Age in Sullivan County
Sex and Age in Sullivan County
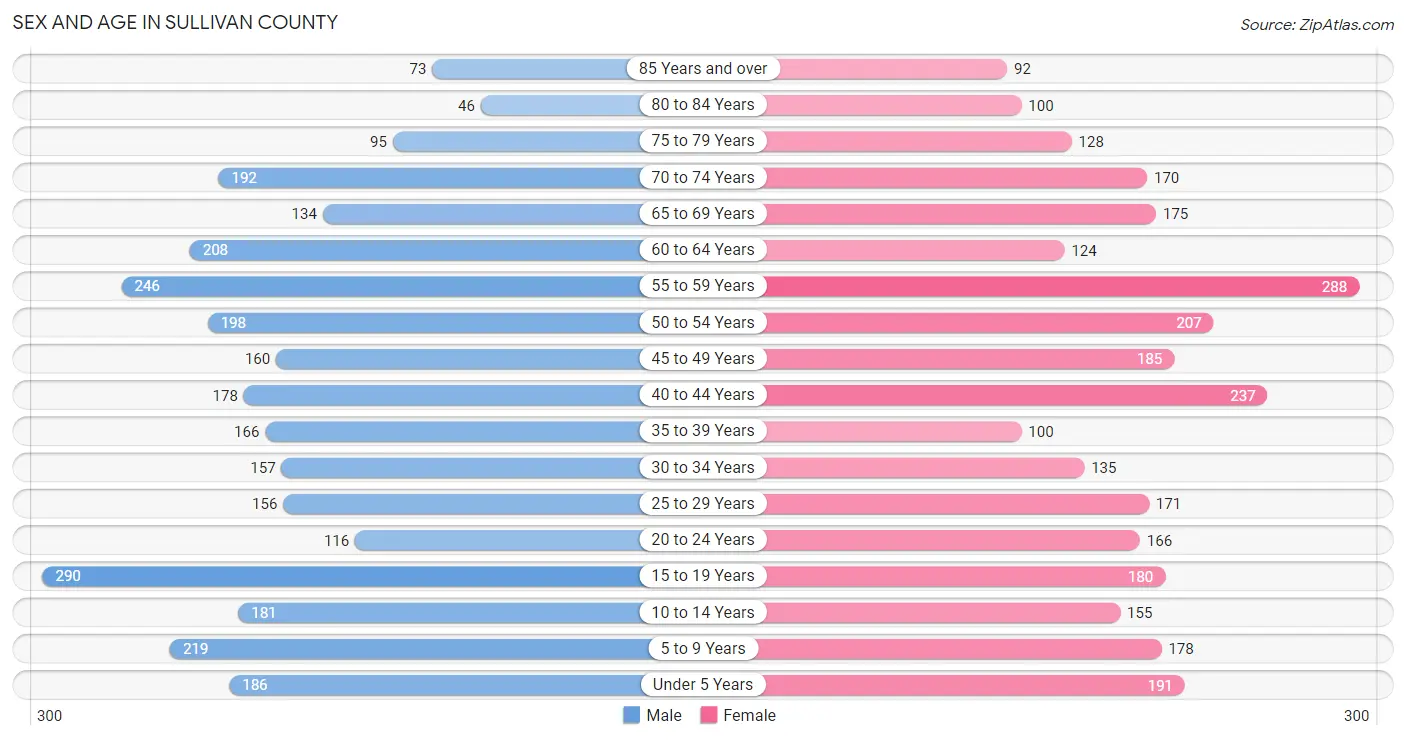
The most populous age groups in Sullivan County are 15 to 19 Years (290 | 9.7%) for men and 55 to 59 Years (288 | 9.7%) for women.
| Age Bracket | Male | Female |
| Under 5 Years | 186 (6.2%) | 191 (6.4%) |
| 5 to 9 Years | 219 (7.3%) | 178 (6.0%) |
| 10 to 14 Years | 181 (6.0%) | 155 (5.2%) |
| 15 to 19 Years | 290 (9.7%) | 180 (6.0%) |
| 20 to 24 Years | 116 (3.9%) | 166 (5.6%) |
| 25 to 29 Years | 156 (5.2%) | 171 (5.7%) |
| 30 to 34 Years | 157 (5.2%) | 135 (4.5%) |
| 35 to 39 Years | 166 (5.5%) | 100 (3.4%) |
| 40 to 44 Years | 178 (5.9%) | 237 (8.0%) |
| 45 to 49 Years | 160 (5.3%) | 185 (6.2%) |
| 50 to 54 Years | 198 (6.6%) | 207 (6.9%) |
| 55 to 59 Years | 246 (8.2%) | 288 (9.7%) |
| 60 to 64 Years | 208 (6.9%) | 124 (4.2%) |
| 65 to 69 Years | 134 (4.5%) | 175 (5.9%) |
| 70 to 74 Years | 192 (6.4%) | 170 (5.7%) |
| 75 to 79 Years | 95 (3.2%) | 128 (4.3%) |
| 80 to 84 Years | 46 (1.5%) | 100 (3.4%) |
| 85 Years and over | 73 (2.4%) | 92 (3.1%) |
| Total | 3,001 (100.0%) | 2,982 (100.0%) |
Families and Households in Sullivan County
Median Family Size in Sullivan County
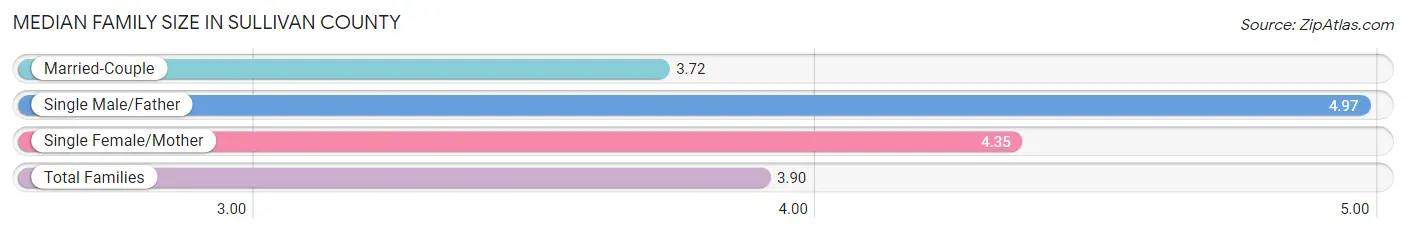
The median family size in Sullivan County is 3.90 persons per family, with single male/father families (61 | 5.2%) accounting for the largest median family size of 4.97 persons per family. On the other hand, married-couple families (896 | 76.1%) represent the smallest median family size with 3.72 persons per family.
| Family Type | # Families | Family Size |
| Married-Couple | 896 (76.1%) | 3.72 |
| Single Male/Father | 61 (5.2%) | 4.97 |
| Single Female/Mother | 220 (18.7%) | 4.35 |
| Total Families | 1,177 (100.0%) | 3.90 |
Median Household Size in Sullivan County
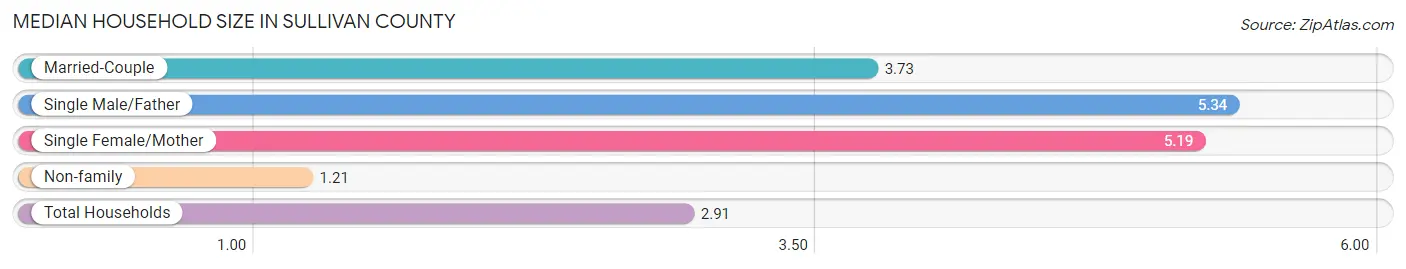
The median household size in Sullivan County is 2.91 persons per household, with single male/father households (61 | 3.1%) accounting for the largest median household size of 5.34 persons per household. non-family households (814 | 40.9%) represent the smallest median household size with 1.21 persons per household.
| Household Type | # Households | Household Size |
| Married-Couple | 896 (45.0%) | 3.73 |
| Single Male/Father | 61 (3.1%) | 5.34 |
| Single Female/Mother | 220 (11.1%) | 5.19 |
| Non-family | 814 (40.9%) | 1.21 |
| Total Households | 1,991 (100.0%) | 2.91 |
Household Size by Marriage Status in Sullivan County
Out of a total of 1,991 households in Sullivan County, 1,177 (59.1%) are family households, while 814 (40.9%) are nonfamily households. The most numerous type of family households are 2-person households, comprising 589, and the most common type of nonfamily households are 1-person households, comprising 754.
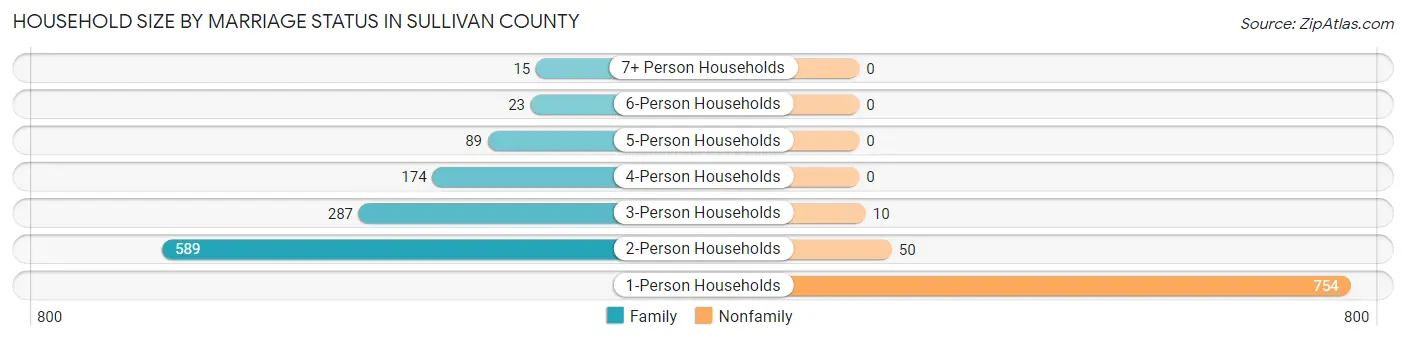
| Household Size | Family Households | Nonfamily Households |
| 1-Person Households | - | 754 (37.9%) |
| 2-Person Households | 589 (29.6%) | 50 (2.5%) |
| 3-Person Households | 287 (14.4%) | 10 (0.5%) |
| 4-Person Households | 174 (8.7%) | 0 (0.0%) |
| 5-Person Households | 89 (4.5%) | 0 (0.0%) |
| 6-Person Households | 23 (1.2%) | 0 (0.0%) |
| 7+ Person Households | 15 (0.7%) | 0 (0.0%) |
| Total | 1,177 (59.1%) | 814 (40.9%) |
Female Fertility in Sullivan County
Fertility by Age in Sullivan County
Average fertility rate in Sullivan County is 30.0 births per 1,000 women. Women in the age bracket of 20 to 34 years have the highest fertility rate with 68.0 births per 1,000 women. Women in the age bracket of 20 to 34 years acount for 86.5% of all women with births.
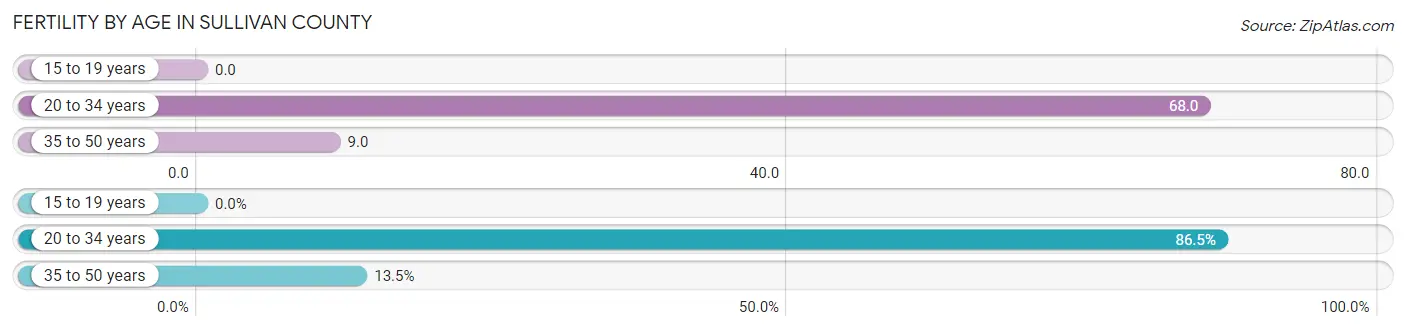
| Age Bracket | Women with Births | Births / 1,000 Women |
| 15 to 19 years | 0 (0.0%) | 0.0 |
| 20 to 34 years | 32 (86.5%) | 68.0 |
| 35 to 50 years | 5 (13.5%) | 9.0 |
| Total | 37 (100.0%) | 30.0 |
Fertility by Age by Marriage Status in Sullivan County
73.0% of women with births (37) in Sullivan County are married. The highest percentage of unmarried women with births falls into 20 to 34 years age bracket with 31.2% of them unmarried at the time of birth, while the lowest percentage of unmarried women with births belong to 35 to 50 years age bracket with 0.0% of them unmarried.
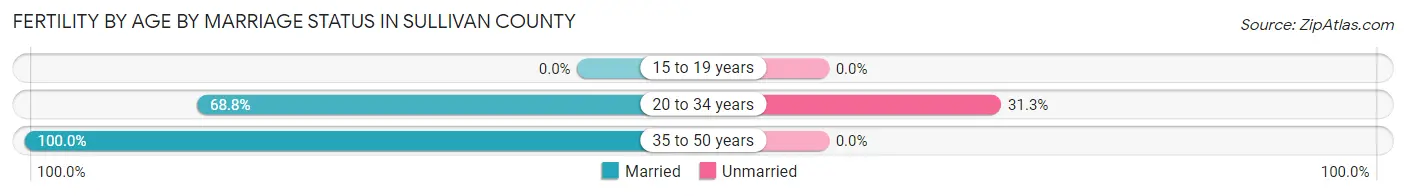
| Age Bracket | Married | Unmarried |
| 15 to 19 years | 0 (0.0%) | 0 (0.0%) |
| 20 to 34 years | 22 (68.8%) | 10 (31.2%) |
| 35 to 50 years | 5 (100.0%) | 0 (0.0%) |
| Total | 27 (73.0%) | 10 (27.0%) |
Fertility by Education in Sullivan County
Average fertility rate in Sullivan County is 30.0 births per 1,000 women. Women with the education attainment of less than high school have the highest fertility rate of 54.0 births per 1,000 women, while women with the education attainment of college or associate's degree have the lowest fertility at 5.0 births per 1,000 women. Women with the education attainment of high school diploma represent 46.0% of all women with births.
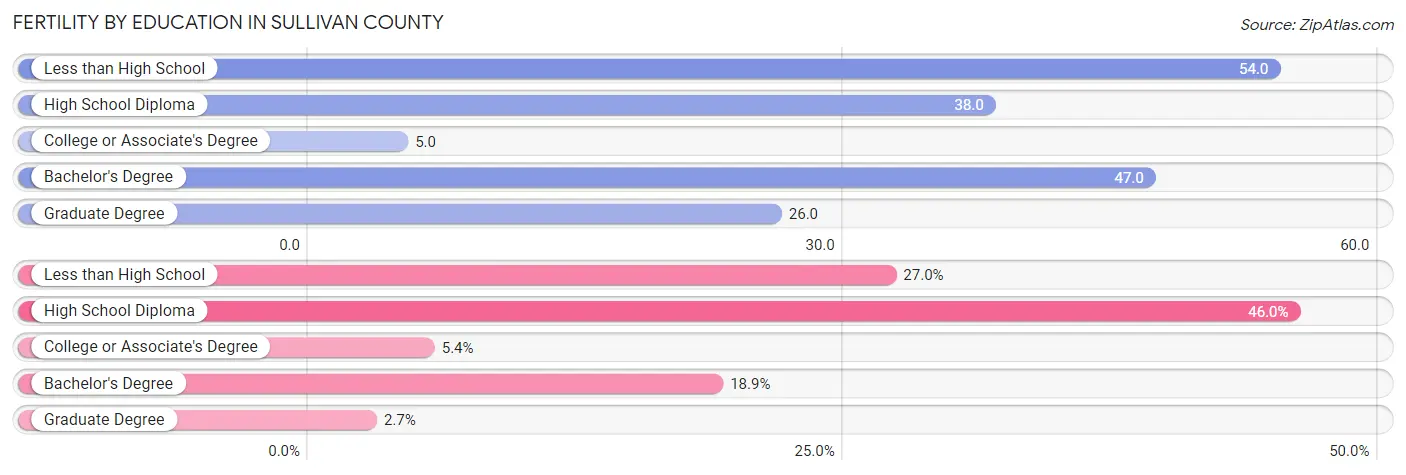
| Educational Attainment | Women with Births | Births / 1,000 Women |
| Less than High School | 10 (27.0%) | 54.0 |
| High School Diploma | 17 (46.0%) | 38.0 |
| College or Associate's Degree | 2 (5.4%) | 5.0 |
| Bachelor's Degree | 7 (18.9%) | 47.0 |
| Graduate Degree | 1 (2.7%) | 26.0 |
| Total | 37 (100.0%) | 30.0 |
Fertility by Education by Marriage Status in Sullivan County
27.0% of women with births in Sullivan County are unmarried. Women with the educational attainment of less than high school are most likely to be married with 100.0% of them married at childbirth, while women with the educational attainment of college or associate's degree are least likely to be married with 100.0% of them unmarried at childbirth.
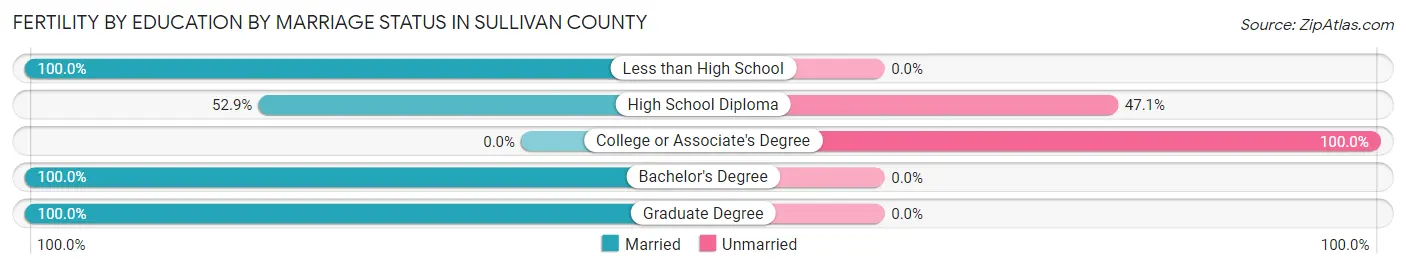
| Educational Attainment | Married | Unmarried |
| Less than High School | 10 (100.0%) | 0 (0.0%) |
| High School Diploma | 9 (52.9%) | 8 (47.1%) |
| College or Associate's Degree | 0 (0.0%) | 2 (100.0%) |
| Bachelor's Degree | 7 (100.0%) | 0 (0.0%) |
| Graduate Degree | 1 (100.0%) | 0 (0.0%) |
| Total | 27 (73.0%) | 10 (27.0%) |
Employment Characteristics in Sullivan County
Employment by Class of Employer in Sullivan County
Among the 2,621 employed individuals in Sullivan County, private company employees (1,891 | 72.2%), not-for-profit organizations (231 | 8.8%), and local government employees (166 | 6.3%) make up the most common classes of employment.
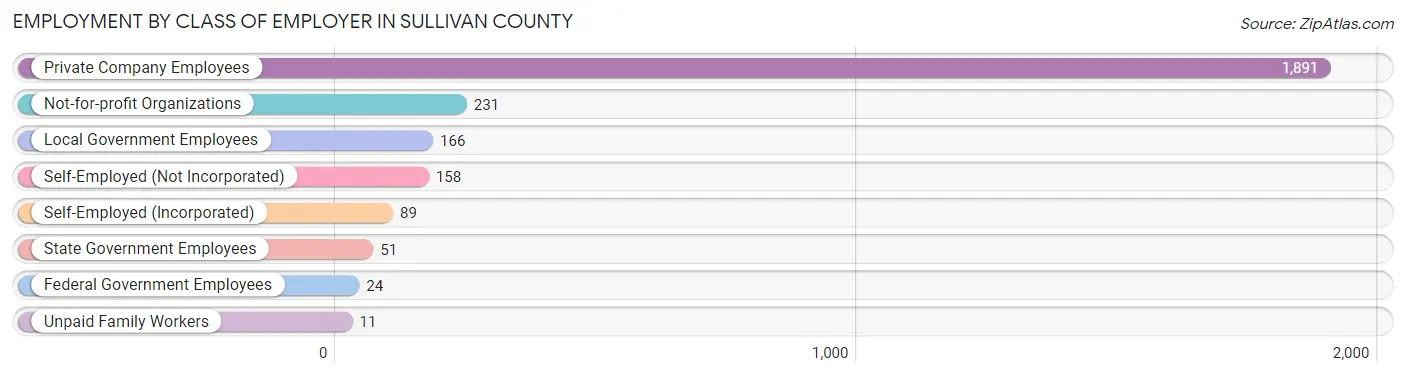
| Employer Class | # Employees | % Employees |
| Private Company Employees | 1,891 | 72.2% |
| Self-Employed (Incorporated) | 89 | 3.4% |
| Self-Employed (Not Incorporated) | 158 | 6.0% |
| Not-for-profit Organizations | 231 | 8.8% |
| Local Government Employees | 166 | 6.3% |
| State Government Employees | 51 | 1.9% |
| Federal Government Employees | 24 | 0.9% |
| Unpaid Family Workers | 11 | 0.4% |
| Total | 2,621 | 100.0% |
Employment Status by Age in Sullivan County
According to the labor force statistics for Sullivan County, out of the total population over 16 years of age (4,820), 56.1% or 2,704 individuals are in the labor force, with 2.4% or 65 of them unemployed. The age group with the highest labor force participation rate is 20 to 24 years, with 92.9% or 262 individuals in the labor force. Within the labor force, the 25 to 29 years age range has the highest percentage of unemployed individuals, with 7.5% or 17 of them being unemployed.
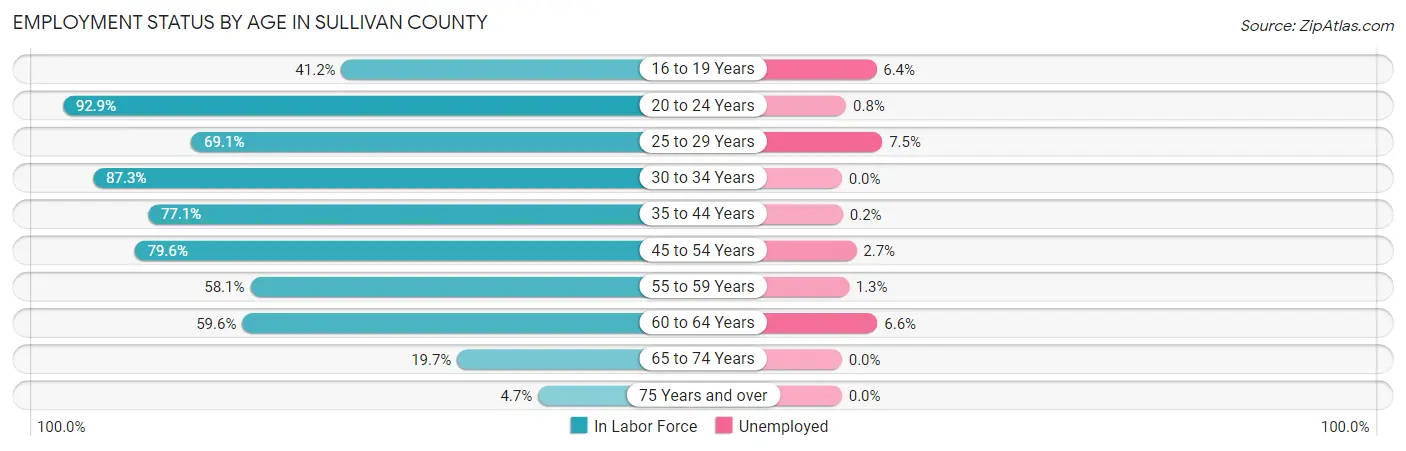
| Age Bracket | In Labor Force | Unemployed |
| 16 to 19 Years | 172 (41.2%) | 11 (6.4%) |
| 20 to 24 Years | 262 (92.9%) | 2 (0.8%) |
| 25 to 29 Years | 226 (69.1%) | 17 (7.5%) |
| 30 to 34 Years | 255 (87.3%) | 0 (0.0%) |
| 35 to 44 Years | 525 (77.1%) | 1 (0.2%) |
| 45 to 54 Years | 597 (79.6%) | 16 (2.7%) |
| 55 to 59 Years | 310 (58.1%) | 4 (1.3%) |
| 60 to 64 Years | 198 (59.6%) | 13 (6.6%) |
| 65 to 74 Years | 132 (19.7%) | 0 (0.0%) |
| 75 Years and over | 25 (4.7%) | 0 (0.0%) |
| Total | 2,704 (56.1%) | 65 (2.4%) |
Employment Status by Educational Attainment in Sullivan County
According to labor force statistics for Sullivan County, 72.4% of individuals (2,111) out of the total population between 25 and 64 years of age (2,916) are in the labor force, with 2.4% or 51 of them being unemployed. The group with the highest labor force participation rate are those with the educational attainment of less than high school, with 82.5% or 362 individuals in the labor force. Within the labor force, individuals with less than high school education have the highest percentage of unemployment, with 5.0% or 18 of them being unemployed.
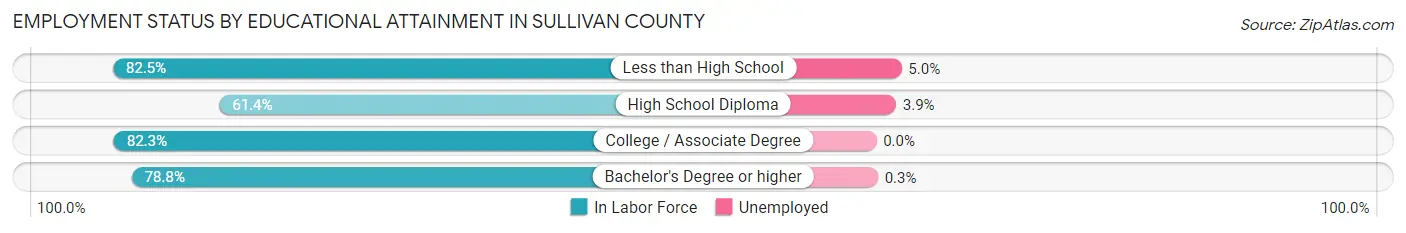
| Educational Attainment | In Labor Force | Unemployed |
| Less than High School | 362 (82.5%) | 22 (5.0%) |
| High School Diploma | 814 (61.4%) | 52 (3.9%) |
| College / Associate Degree | 638 (82.3%) | 0 (0.0%) |
| Bachelor's Degree or higher | 297 (78.8%) | 1 (0.3%) |
| Total | 2,111 (72.4%) | 70 (2.4%) |
Employment Occupations by Sex in Sullivan County
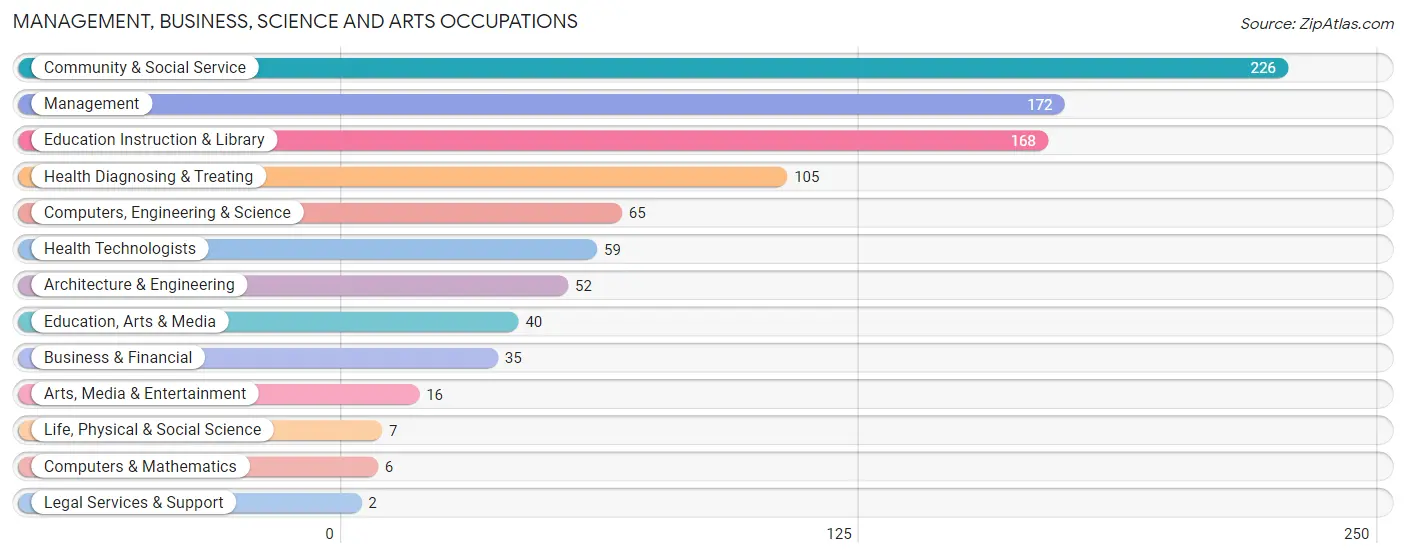
Management, Business, Science and Arts Occupations
The most common Management, Business, Science and Arts occupations in Sullivan County are Community & Social Service (226 | 8.6%), Management (172 | 6.5%), Education Instruction & Library (168 | 6.4%), Health Diagnosing & Treating (105 | 4.0%), and Computers, Engineering & Science (65 | 2.5%).
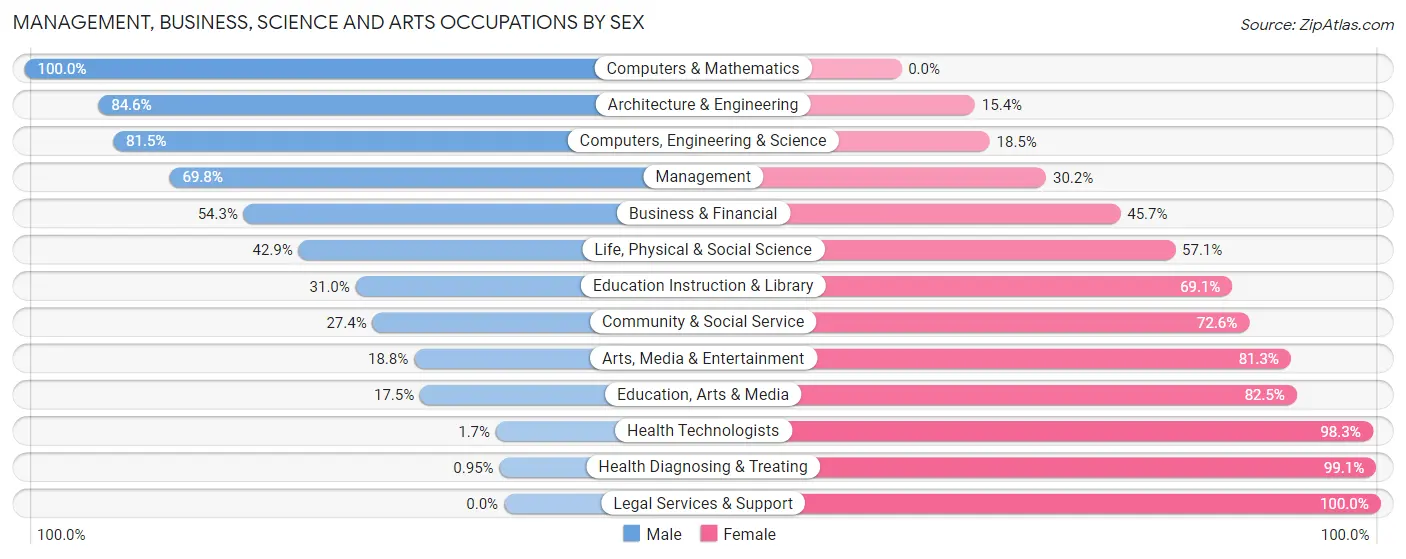
Management, Business, Science and Arts Occupations by Sex
Within the Management, Business, Science and Arts occupations in Sullivan County, the most male-oriented occupations are Computers & Mathematics (100.0%), Architecture & Engineering (84.6%), and Computers, Engineering & Science (81.5%), while the most female-oriented occupations are Legal Services & Support (100.0%), Health Diagnosing & Treating (99.1%), and Health Technologists (98.3%).
| Occupation | Male | Female |
| Management | 120 (69.8%) | 52 (30.2%) |
| Business & Financial | 19 (54.3%) | 16 (45.7%) |
| Computers, Engineering & Science | 53 (81.5%) | 12 (18.5%) |
| Computers & Mathematics | 6 (100.0%) | 0 (0.0%) |
| Architecture & Engineering | 44 (84.6%) | 8 (15.4%) |
| Life, Physical & Social Science | 3 (42.9%) | 4 (57.1%) |
| Community & Social Service | 62 (27.4%) | 164 (72.6%) |
| Education, Arts & Media | 7 (17.5%) | 33 (82.5%) |
| Legal Services & Support | 0 (0.0%) | 2 (100.0%) |
| Education Instruction & Library | 52 (30.9%) | 116 (69.1%) |
| Arts, Media & Entertainment | 3 (18.8%) | 13 (81.2%) |
| Health Diagnosing & Treating | 1 (0.9%) | 104 (99.1%) |
| Health Technologists | 1 (1.7%) | 58 (98.3%) |
| Total (Category) | 255 (42.3%) | 348 (57.7%) |
| Total (Overall) | 1,340 (50.8%) | 1,296 (49.2%) |
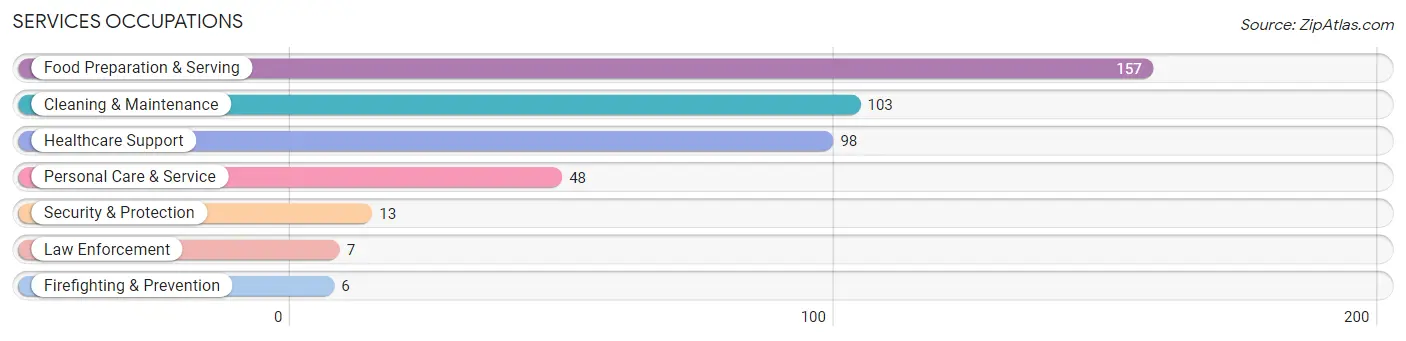
Services Occupations
The most common Services occupations in Sullivan County are Food Preparation & Serving (157 | 6.0%), Cleaning & Maintenance (103 | 3.9%), Healthcare Support (98 | 3.7%), Personal Care & Service (48 | 1.8%), and Security & Protection (13 | 0.5%).
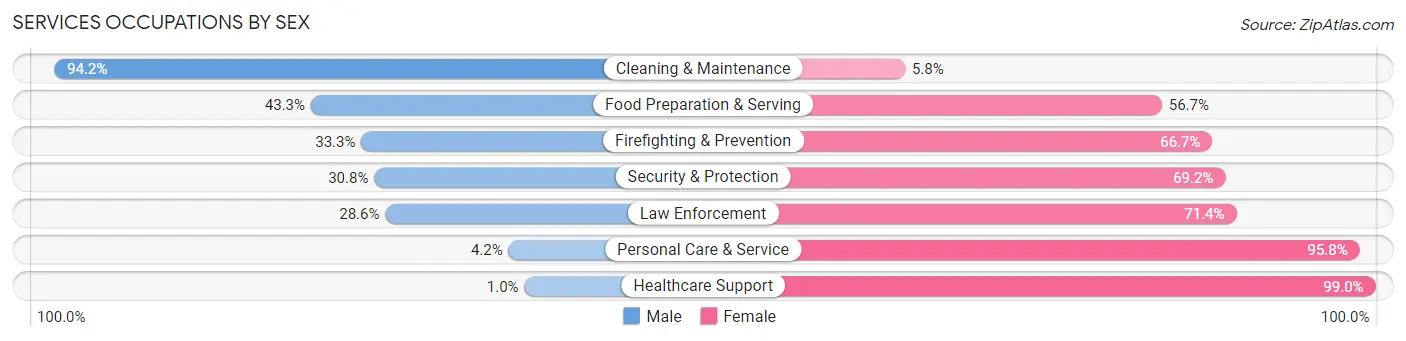
Services Occupations by Sex
Within the Services occupations in Sullivan County, the most male-oriented occupations are Cleaning & Maintenance (94.2%), Food Preparation & Serving (43.3%), and Firefighting & Prevention (33.3%), while the most female-oriented occupations are Healthcare Support (99.0%), Personal Care & Service (95.8%), and Law Enforcement (71.4%).
| Occupation | Male | Female |
| Healthcare Support | 1 (1.0%) | 97 (99.0%) |
| Security & Protection | 4 (30.8%) | 9 (69.2%) |
| Firefighting & Prevention | 2 (33.3%) | 4 (66.7%) |
| Law Enforcement | 2 (28.6%) | 5 (71.4%) |
| Food Preparation & Serving | 68 (43.3%) | 89 (56.7%) |
| Cleaning & Maintenance | 97 (94.2%) | 6 (5.8%) |
| Personal Care & Service | 2 (4.2%) | 46 (95.8%) |
| Total (Category) | 172 (41.0%) | 247 (59.0%) |
| Total (Overall) | 1,340 (50.8%) | 1,296 (49.2%) |
Sales and Office Occupations
The most common Sales and Office occupations in Sullivan County are Sales & Related (248 | 9.4%), and Office & Administration (210 | 8.0%).
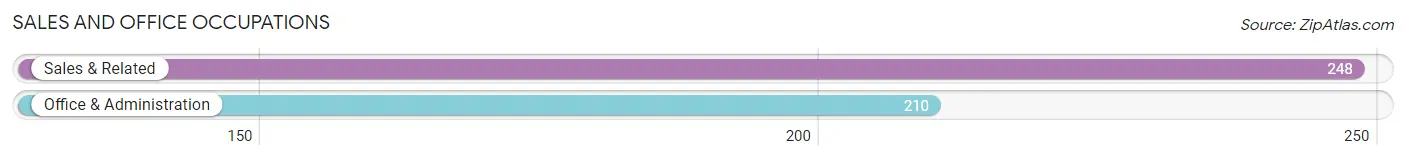
Sales and Office Occupations by Sex

| Occupation | Male | Female |
| Sales & Related | 81 (32.7%) | 167 (67.3%) |
| Office & Administration | 37 (17.6%) | 173 (82.4%) |
| Total (Category) | 118 (25.8%) | 340 (74.2%) |
| Total (Overall) | 1,340 (50.8%) | 1,296 (49.2%) |
Natural Resources, Construction and Maintenance Occupations
The most common Natural Resources, Construction and Maintenance occupations in Sullivan County are Construction & Extraction (107 | 4.1%), Installation, Maintenance & Repair (102 | 3.9%), and Farming, Fishing & Forestry (100 | 3.8%).
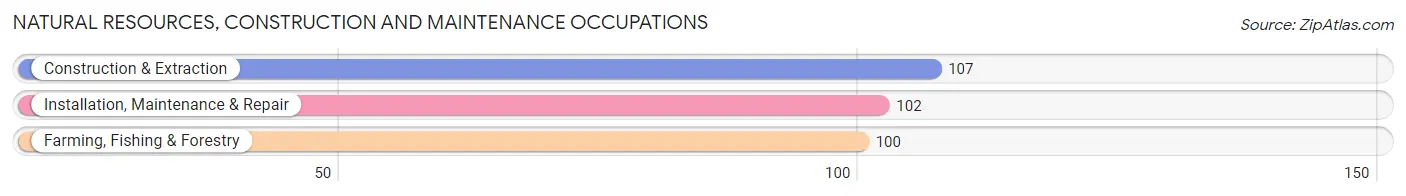
Natural Resources, Construction and Maintenance Occupations by Sex
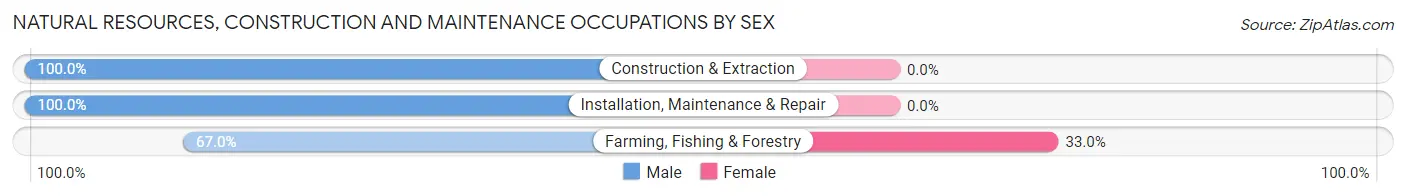
| Occupation | Male | Female |
| Farming, Fishing & Forestry | 67 (67.0%) | 33 (33.0%) |
| Construction & Extraction | 107 (100.0%) | 0 (0.0%) |
| Installation, Maintenance & Repair | 102 (100.0%) | 0 (0.0%) |
| Total (Category) | 276 (89.3%) | 33 (10.7%) |
| Total (Overall) | 1,340 (50.8%) | 1,296 (49.2%) |
Production, Transportation and Moving Occupations
The most common Production, Transportation and Moving occupations in Sullivan County are Production (543 | 20.6%), Material Moving (206 | 7.8%), and Transportation (98 | 3.7%).
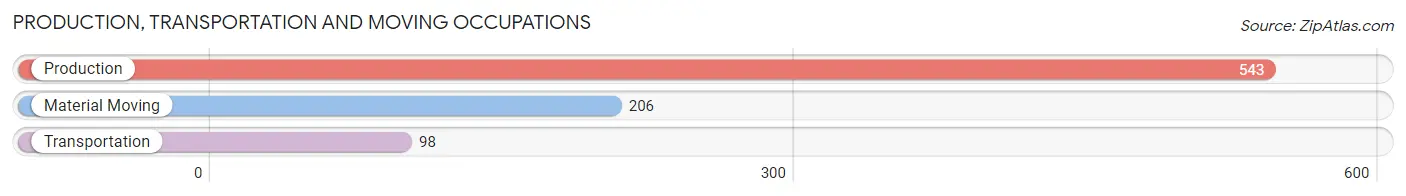
Production, Transportation and Moving Occupations by Sex
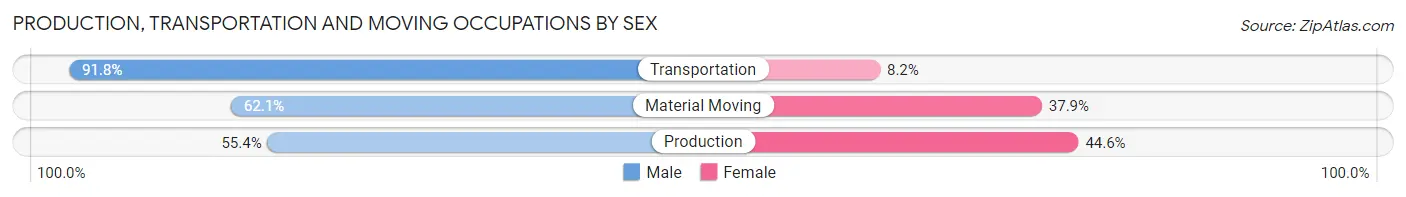
| Occupation | Male | Female |
| Production | 301 (55.4%) | 242 (44.6%) |
| Transportation | 90 (91.8%) | 8 (8.2%) |
| Material Moving | 128 (62.1%) | 78 (37.9%) |
| Total (Category) | 519 (61.3%) | 328 (38.7%) |
| Total (Overall) | 1,340 (50.8%) | 1,296 (49.2%) |
Employment Industries by Sex in Sullivan County
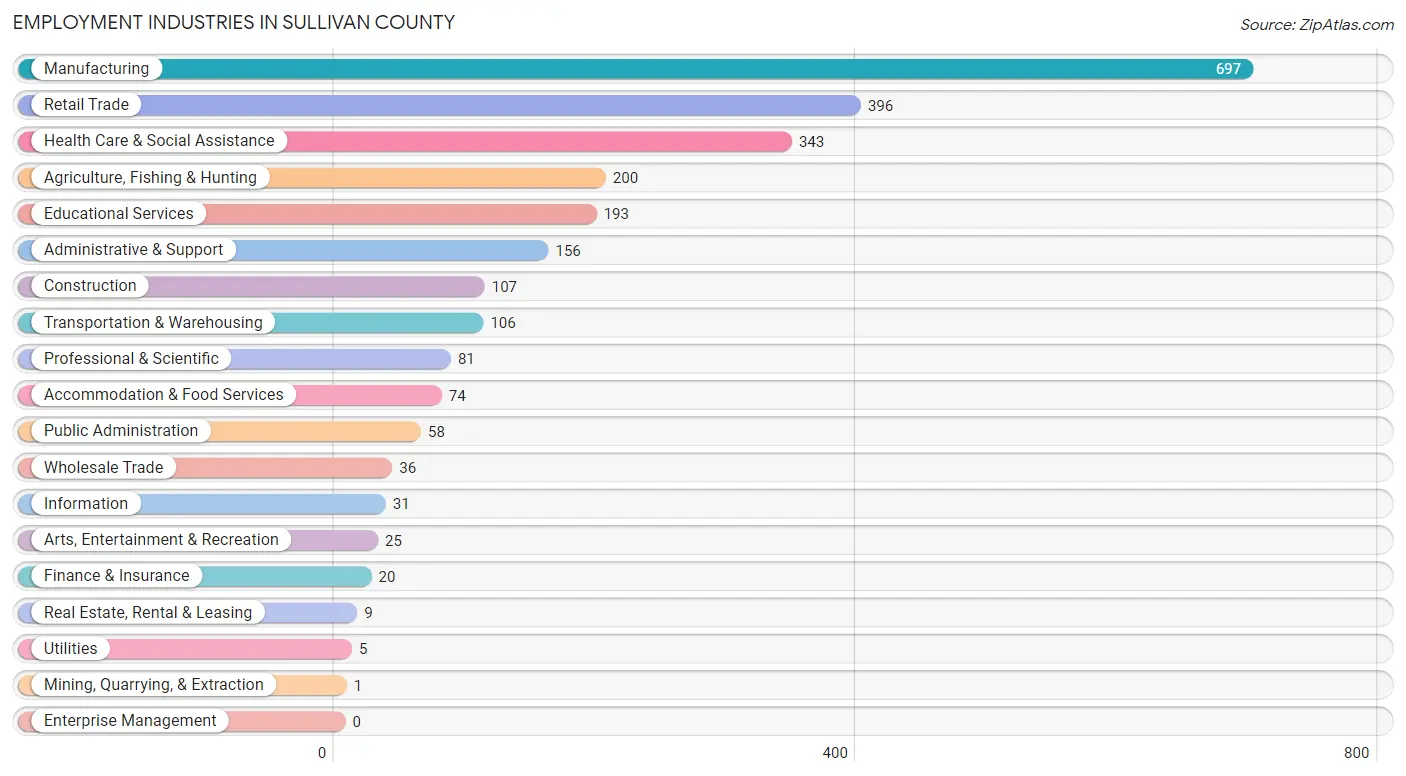
Employment Industries in Sullivan County
The major employment industries in Sullivan County include Manufacturing (697 | 26.4%), Retail Trade (396 | 15.0%), Health Care & Social Assistance (343 | 13.0%), Agriculture, Fishing & Hunting (200 | 7.6%), and Educational Services (193 | 7.3%).
Employment Industries by Sex in Sullivan County
The Sullivan County industries that see more men than women are Mining, Quarrying, & Extraction (100.0%), Arts, Entertainment & Recreation (96.0%), and Construction (95.3%), whereas the industries that tend to have a higher number of women are Finance & Insurance (100.0%), Health Care & Social Assistance (87.2%), and Information (83.9%).
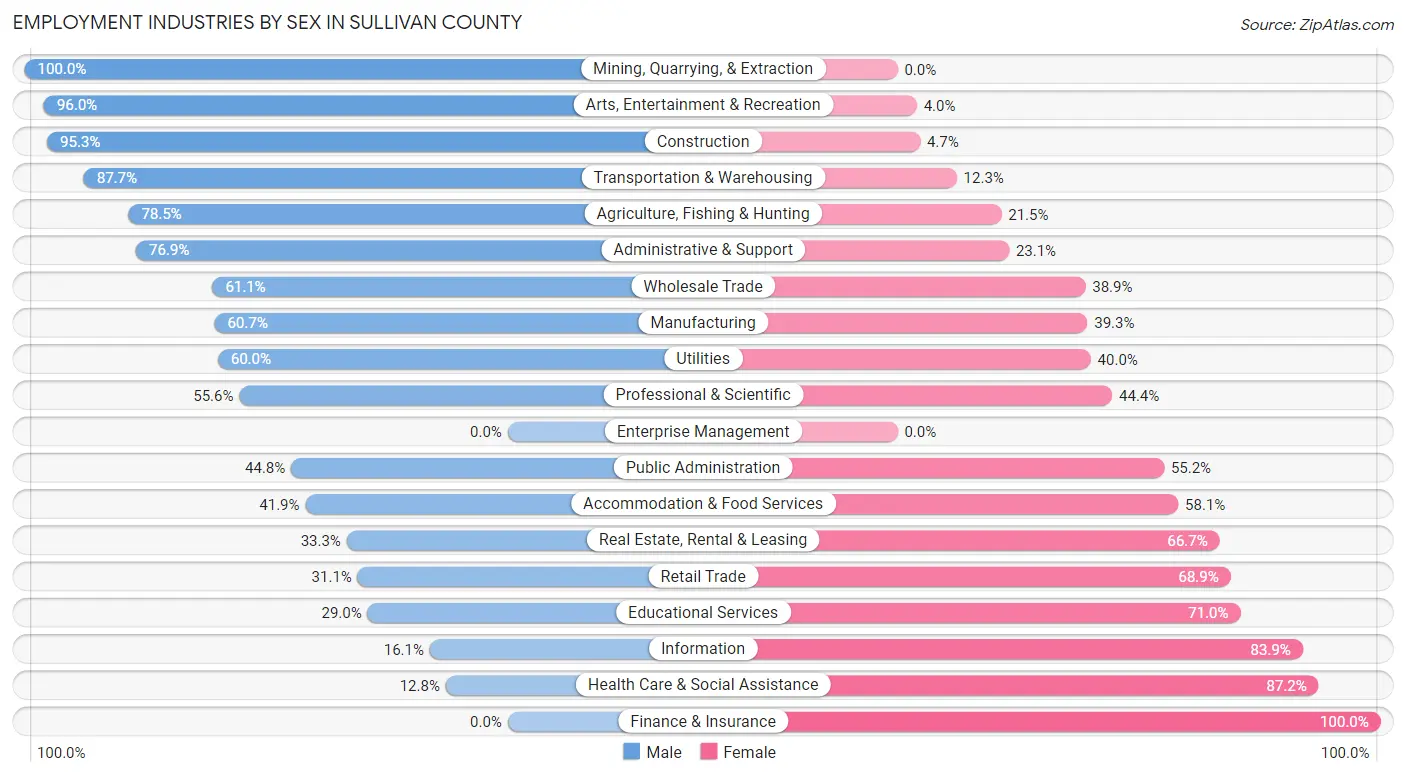
| Industry | Male | Female |
| Agriculture, Fishing & Hunting | 157 (78.5%) | 43 (21.5%) |
| Mining, Quarrying, & Extraction | 1 (100.0%) | 0 (0.0%) |
| Construction | 102 (95.3%) | 5 (4.7%) |
| Manufacturing | 423 (60.7%) | 274 (39.3%) |
| Wholesale Trade | 22 (61.1%) | 14 (38.9%) |
| Retail Trade | 123 (31.1%) | 273 (68.9%) |
| Transportation & Warehousing | 93 (87.7%) | 13 (12.3%) |
| Utilities | 3 (60.0%) | 2 (40.0%) |
| Information | 5 (16.1%) | 26 (83.9%) |
| Finance & Insurance | 0 (0.0%) | 20 (100.0%) |
| Real Estate, Rental & Leasing | 3 (33.3%) | 6 (66.7%) |
| Professional & Scientific | 45 (55.6%) | 36 (44.4%) |
| Enterprise Management | 0 (0.0%) | 0 (0.0%) |
| Administrative & Support | 120 (76.9%) | 36 (23.1%) |
| Educational Services | 56 (29.0%) | 137 (71.0%) |
| Health Care & Social Assistance | 44 (12.8%) | 299 (87.2%) |
| Arts, Entertainment & Recreation | 24 (96.0%) | 1 (4.0%) |
| Accommodation & Food Services | 31 (41.9%) | 43 (58.1%) |
| Public Administration | 26 (44.8%) | 32 (55.2%) |
| Total | 1,340 (50.8%) | 1,296 (49.2%) |
Education in Sullivan County
School Enrollment in Sullivan County
The most common levels of schooling among the 1,318 students in Sullivan County are high school (375 | 28.4%), elementary school (335 | 25.4%), and middle school (284 | 21.5%).
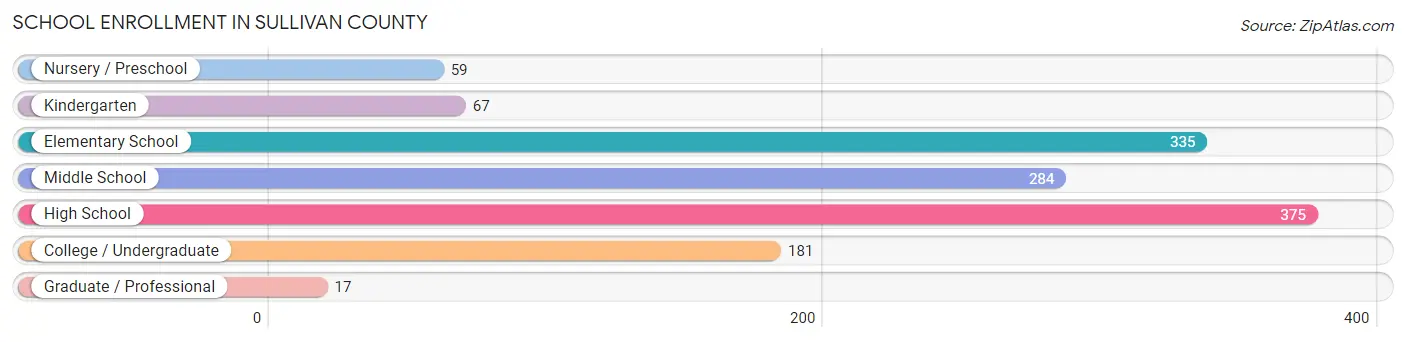
| School Level | # Students | % Students |
| Nursery / Preschool | 59 | 4.5% |
| Kindergarten | 67 | 5.1% |
| Elementary School | 335 | 25.4% |
| Middle School | 284 | 21.5% |
| High School | 375 | 28.4% |
| College / Undergraduate | 181 | 13.7% |
| Graduate / Professional | 17 | 1.3% |
| Total | 1,318 | 100.0% |
School Enrollment by Age by Funding Source in Sullivan County
Out of a total of 1,318 students who are enrolled in schools in Sullivan County, 105 (8.0%) attend a private institution, while the remaining 1,213 (92.0%) are enrolled in public schools. The age group of 35 years and over has the highest likelihood of being enrolled in private schools, with 13 (56.5% in the age bracket) enrolled. Conversely, the age group of 20 to 24 year olds has the lowest likelihood of being enrolled in a private school, with 54 (100.0% in the age bracket) attending a public institution.
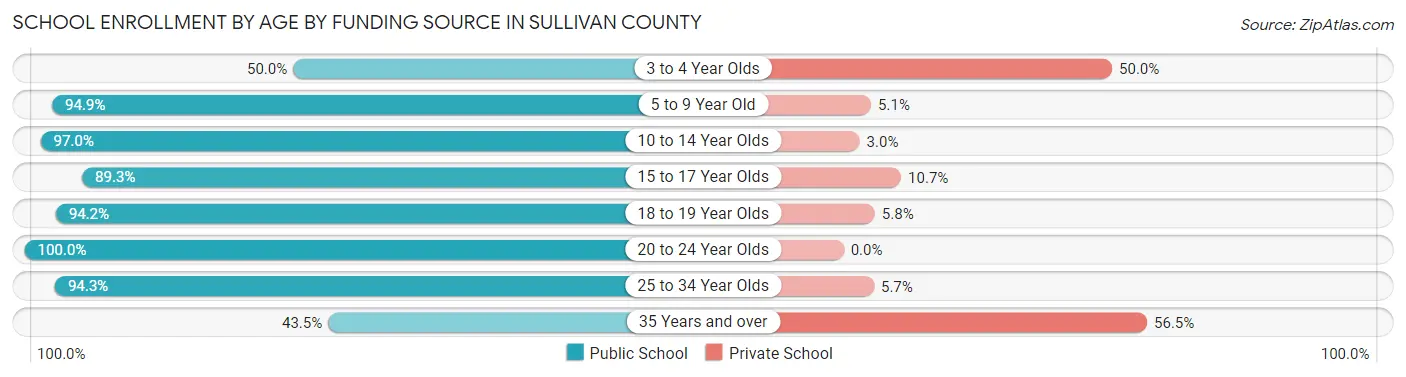
| Age Bracket | Public School | Private School |
| 3 to 4 Year Olds | 24 (50.0%) | 24 (50.0%) |
| 5 to 9 Year Old | 371 (94.9%) | 20 (5.1%) |
| 10 to 14 Year Olds | 326 (97.0%) | 10 (3.0%) |
| 15 to 17 Year Olds | 200 (89.3%) | 24 (10.7%) |
| 18 to 19 Year Olds | 178 (94.2%) | 11 (5.8%) |
| 20 to 24 Year Olds | 54 (100.0%) | 0 (0.0%) |
| 25 to 34 Year Olds | 50 (94.3%) | 3 (5.7%) |
| 35 Years and over | 10 (43.5%) | 13 (56.5%) |
| Total | 1,213 (92.0%) | 105 (8.0%) |
Educational Attainment by Field of Study in Sullivan County
Education (190 | 29.2%), science & technology (126 | 19.4%), business (105 | 16.1%), arts & humanities (48 | 7.4%), and engineering (46 | 7.1%) are the most common fields of study among 651 individuals in Sullivan County who have obtained a bachelor's degree or higher.
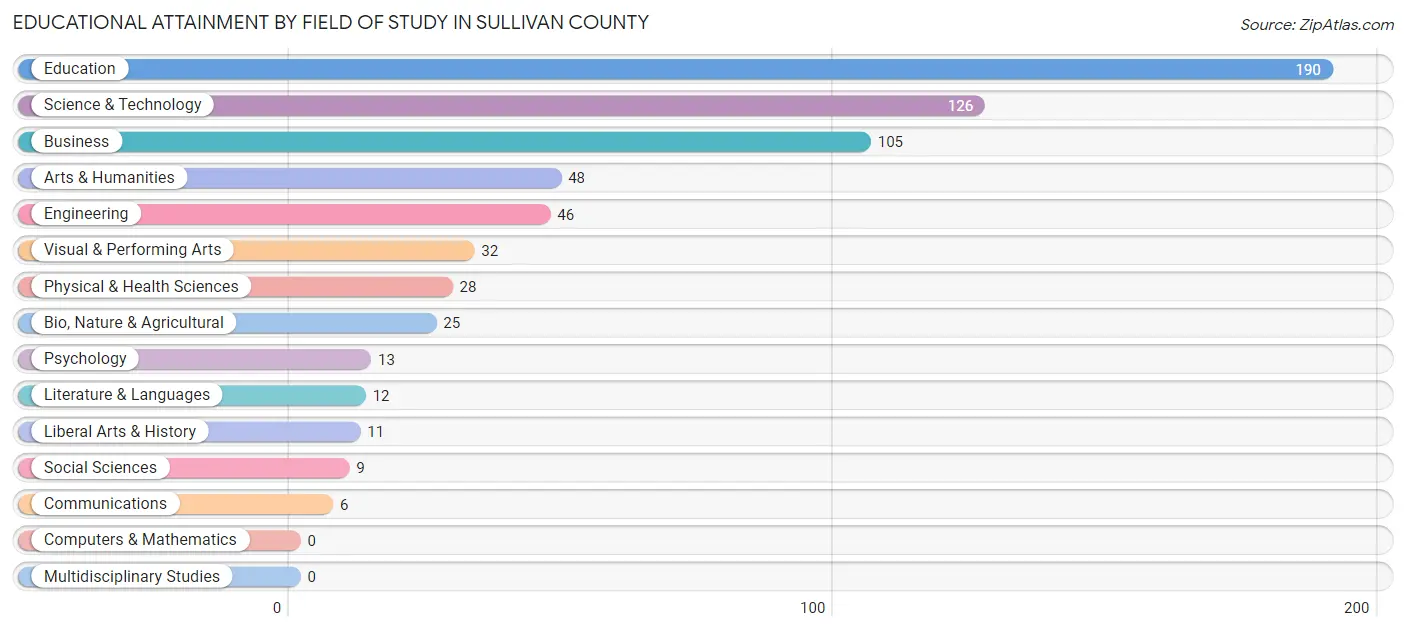
| Field of Study | # Graduates | % Graduates |
| Computers & Mathematics | 0 | 0.0% |
| Bio, Nature & Agricultural | 25 | 3.8% |
| Physical & Health Sciences | 28 | 4.3% |
| Psychology | 13 | 2.0% |
| Social Sciences | 9 | 1.4% |
| Engineering | 46 | 7.1% |
| Multidisciplinary Studies | 0 | 0.0% |
| Science & Technology | 126 | 19.4% |
| Business | 105 | 16.1% |
| Education | 190 | 29.2% |
| Literature & Languages | 12 | 1.8% |
| Liberal Arts & History | 11 | 1.7% |
| Visual & Performing Arts | 32 | 4.9% |
| Communications | 6 | 0.9% |
| Arts & Humanities | 48 | 7.4% |
| Total | 651 | 100.0% |
Transportation & Commute in Sullivan County
Vehicle Availability by Sex in Sullivan County
The most prevalent vehicle ownership categories in Sullivan County are males with 2 vehicles (456, accounting for 34.4%) and females with 2 vehicles (506, making up 35.4%).
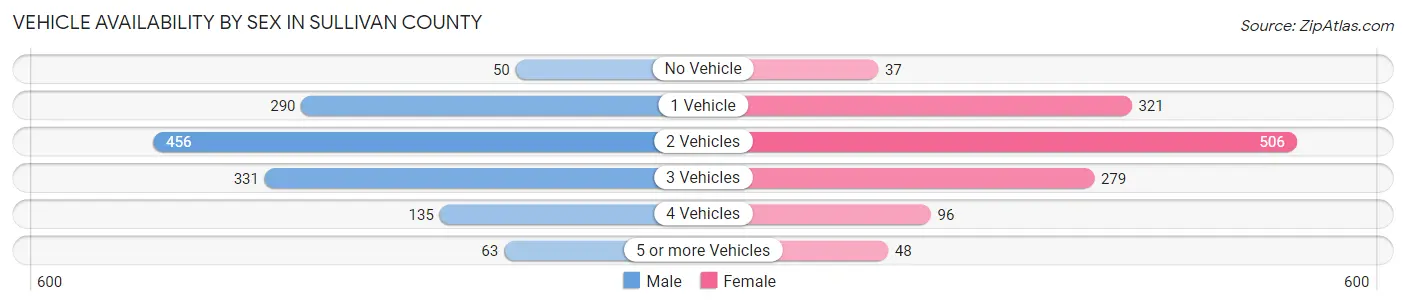
| Vehicles Available | Male | Female |
| No Vehicle | 50 (3.8%) | 37 (2.9%) |
| 1 Vehicle | 290 (21.9%) | 321 (24.9%) |
| 2 Vehicles | 456 (34.4%) | 506 (39.3%) |
| 3 Vehicles | 331 (25.0%) | 279 (21.7%) |
| 4 Vehicles | 135 (10.2%) | 96 (7.5%) |
| 5 or more Vehicles | 63 (4.8%) | 48 (3.7%) |
| Total | 1,325 (100.0%) | 1,287 (100.0%) |
Commute Time in Sullivan County
The most frequently occuring commute durations in Sullivan County are 10 to 14 minutes (575 commuters, 23.1%), 5 to 9 minutes (468 commuters, 18.8%), and 30 to 34 minutes (278 commuters, 11.2%).
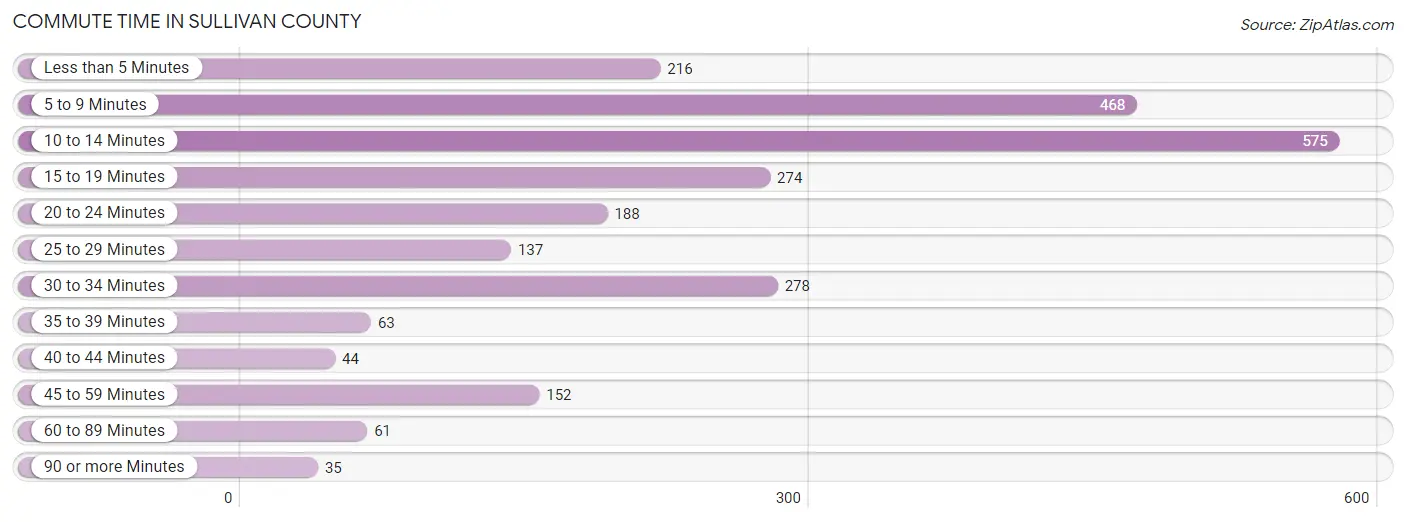
| Commute Time | # Commuters | % Commuters |
| Less than 5 Minutes | 216 | 8.7% |
| 5 to 9 Minutes | 468 | 18.8% |
| 10 to 14 Minutes | 575 | 23.1% |
| 15 to 19 Minutes | 274 | 11.0% |
| 20 to 24 Minutes | 188 | 7.5% |
| 25 to 29 Minutes | 137 | 5.5% |
| 30 to 34 Minutes | 278 | 11.2% |
| 35 to 39 Minutes | 63 | 2.5% |
| 40 to 44 Minutes | 44 | 1.8% |
| 45 to 59 Minutes | 152 | 6.1% |
| 60 to 89 Minutes | 61 | 2.5% |
| 90 or more Minutes | 35 | 1.4% |
Commute Time by Sex in Sullivan County
The most common commute times in Sullivan County are 10 to 14 minutes (352 commuters, 28.1%) for males and 5 to 9 minutes (317 commuters, 25.6%) for females.
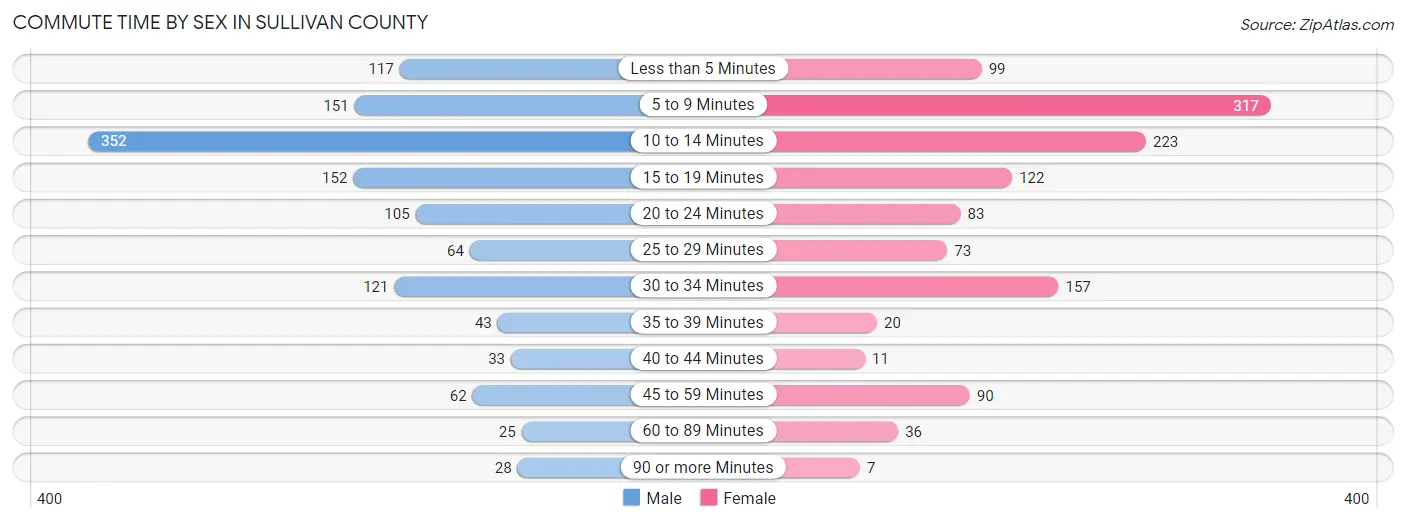
| Commute Time | Male | Female |
| Less than 5 Minutes | 117 (9.3%) | 99 (8.0%) |
| 5 to 9 Minutes | 151 (12.0%) | 317 (25.6%) |
| 10 to 14 Minutes | 352 (28.1%) | 223 (18.0%) |
| 15 to 19 Minutes | 152 (12.1%) | 122 (9.9%) |
| 20 to 24 Minutes | 105 (8.4%) | 83 (6.7%) |
| 25 to 29 Minutes | 64 (5.1%) | 73 (5.9%) |
| 30 to 34 Minutes | 121 (9.7%) | 157 (12.7%) |
| 35 to 39 Minutes | 43 (3.4%) | 20 (1.6%) |
| 40 to 44 Minutes | 33 (2.6%) | 11 (0.9%) |
| 45 to 59 Minutes | 62 (5.0%) | 90 (7.3%) |
| 60 to 89 Minutes | 25 (2.0%) | 36 (2.9%) |
| 90 or more Minutes | 28 (2.2%) | 7 (0.6%) |
Time of Departure to Work by Sex in Sullivan County
The most frequent times of departure to work in Sullivan County are 12:00 AM to 4:59 AM (255, 20.3%) for males and 7:00 AM to 7:29 AM (221, 17.8%) for females.
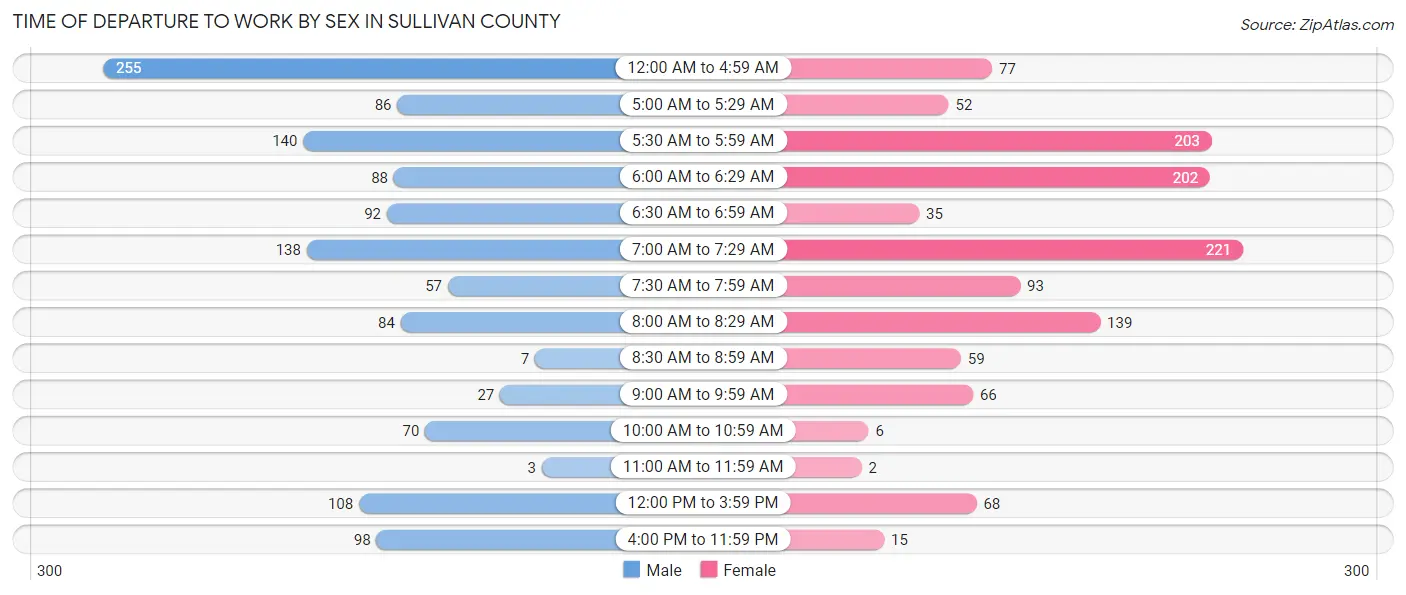
| Time of Departure | Male | Female |
| 12:00 AM to 4:59 AM | 255 (20.3%) | 77 (6.2%) |
| 5:00 AM to 5:29 AM | 86 (6.9%) | 52 (4.2%) |
| 5:30 AM to 5:59 AM | 140 (11.2%) | 203 (16.4%) |
| 6:00 AM to 6:29 AM | 88 (7.0%) | 202 (16.3%) |
| 6:30 AM to 6:59 AM | 92 (7.3%) | 35 (2.8%) |
| 7:00 AM to 7:29 AM | 138 (11.0%) | 221 (17.8%) |
| 7:30 AM to 7:59 AM | 57 (4.5%) | 93 (7.5%) |
| 8:00 AM to 8:29 AM | 84 (6.7%) | 139 (11.2%) |
| 8:30 AM to 8:59 AM | 7 (0.6%) | 59 (4.8%) |
| 9:00 AM to 9:59 AM | 27 (2.1%) | 66 (5.3%) |
| 10:00 AM to 10:59 AM | 70 (5.6%) | 6 (0.5%) |
| 11:00 AM to 11:59 AM | 3 (0.2%) | 2 (0.2%) |
| 12:00 PM to 3:59 PM | 108 (8.6%) | 68 (5.5%) |
| 4:00 PM to 11:59 PM | 98 (7.8%) | 15 (1.2%) |
| Total | 1,253 (100.0%) | 1,238 (100.0%) |
Housing Occupancy in Sullivan County
Occupancy by Ownership in Sullivan County
Of the total 1,991 dwellings in Sullivan County, owner-occupied units account for 1,478 (74.2%), while renter-occupied units make up 513 (25.8%).
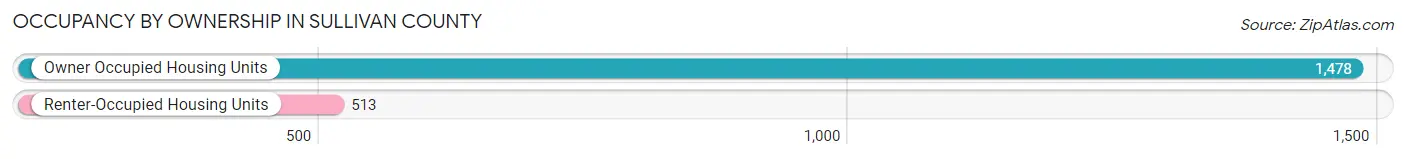
| Occupancy | # Housing Units | % Housing Units |
| Owner Occupied Housing Units | 1,478 | 74.2% |
| Renter-Occupied Housing Units | 513 | 25.8% |
| Total Occupied Housing Units | 1,991 | 100.0% |
Occupancy by Household Size in Sullivan County
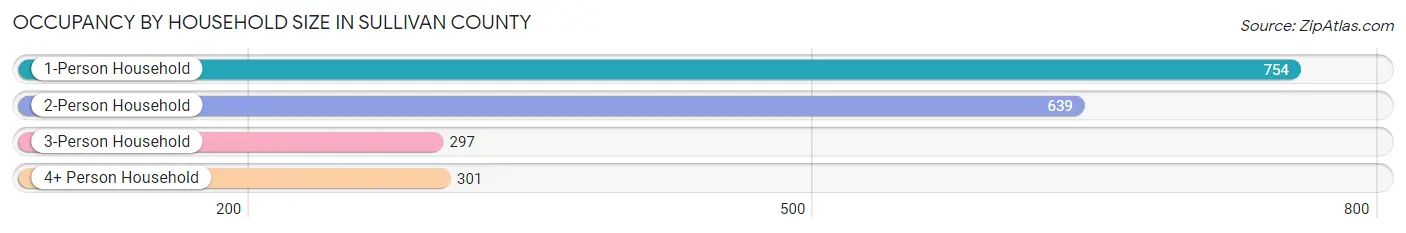
| Household Size | # Housing Units | % Housing Units |
| 1-Person Household | 754 | 37.9% |
| 2-Person Household | 639 | 32.1% |
| 3-Person Household | 297 | 14.9% |
| 4+ Person Household | 301 | 15.1% |
| Total Housing Units | 1,991 | 100.0% |
Occupancy by Ownership by Household Size in Sullivan County
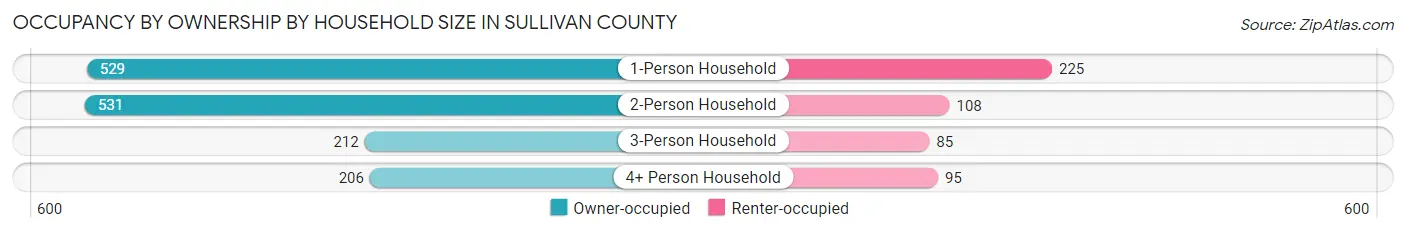
| Household Size | Owner-occupied | Renter-occupied |
| 1-Person Household | 529 (70.2%) | 225 (29.8%) |
| 2-Person Household | 531 (83.1%) | 108 (16.9%) |
| 3-Person Household | 212 (71.4%) | 85 (28.6%) |
| 4+ Person Household | 206 (68.4%) | 95 (31.6%) |
| Total Housing Units | 1,478 (74.2%) | 513 (25.8%) |
Occupancy by Educational Attainment in Sullivan County
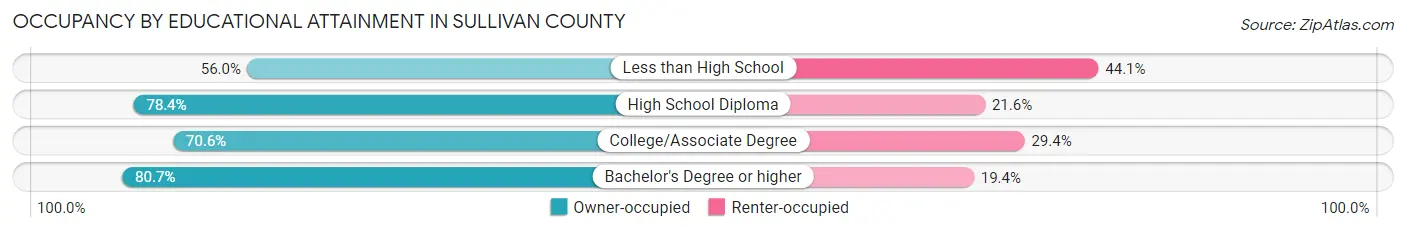
| Household Size | Owner-occupied | Renter-occupied |
| Less than High School | 127 (55.9%) | 100 (44.1%) |
| High School Diploma | 778 (78.4%) | 214 (21.6%) |
| College/Associate Degree | 348 (70.6%) | 145 (29.4%) |
| Bachelor's Degree or higher | 225 (80.6%) | 54 (19.4%) |
Occupancy by Age of Householder in Sullivan County
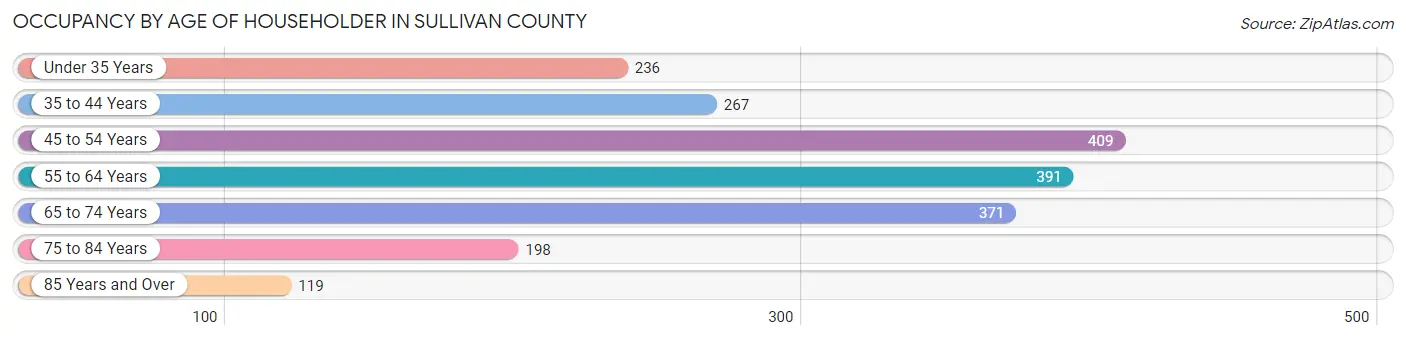
| Age Bracket | # Households | % Households |
| Under 35 Years | 236 | 11.8% |
| 35 to 44 Years | 267 | 13.4% |
| 45 to 54 Years | 409 | 20.5% |
| 55 to 64 Years | 391 | 19.6% |
| 65 to 74 Years | 371 | 18.6% |
| 75 to 84 Years | 198 | 9.9% |
| 85 Years and Over | 119 | 6.0% |
| Total | 1,991 | 100.0% |
Housing Finances in Sullivan County
Median Income by Occupancy in Sullivan County
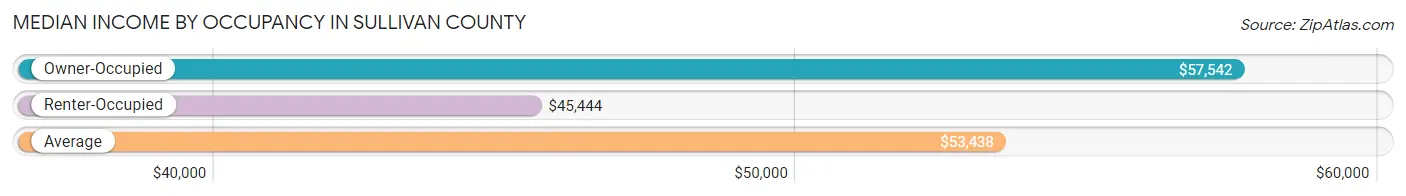
| Occupancy Type | # Households | Median Income |
| Owner-Occupied | 1,478 (74.2%) | $57,542 |
| Renter-Occupied | 513 (25.8%) | $45,444 |
| Average | 1,991 (100.0%) | $53,438 |
Occupancy by Householder Income Bracket in Sullivan County
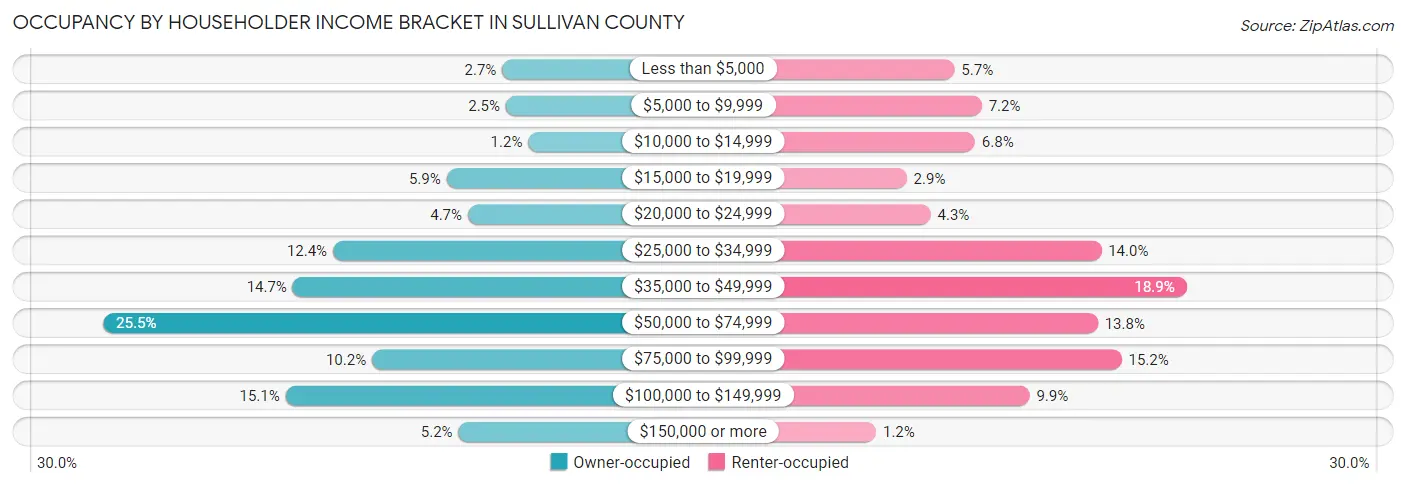
| Income Bracket | Owner-occupied | Renter-occupied |
| Less than $5,000 | 40 (2.7%) | 29 (5.7%) |
| $5,000 to $9,999 | 37 (2.5%) | 37 (7.2%) |
| $10,000 to $14,999 | 18 (1.2%) | 35 (6.8%) |
| $15,000 to $19,999 | 87 (5.9%) | 15 (2.9%) |
| $20,000 to $24,999 | 69 (4.7%) | 22 (4.3%) |
| $25,000 to $34,999 | 183 (12.4%) | 72 (14.0%) |
| $35,000 to $49,999 | 217 (14.7%) | 97 (18.9%) |
| $50,000 to $74,999 | 377 (25.5%) | 71 (13.8%) |
| $75,000 to $99,999 | 150 (10.2%) | 78 (15.2%) |
| $100,000 to $149,999 | 223 (15.1%) | 51 (9.9%) |
| $150,000 or more | 77 (5.2%) | 6 (1.2%) |
| Total | 1,478 (100.0%) | 513 (100.0%) |
Monthly Housing Cost Tiers in Sullivan County
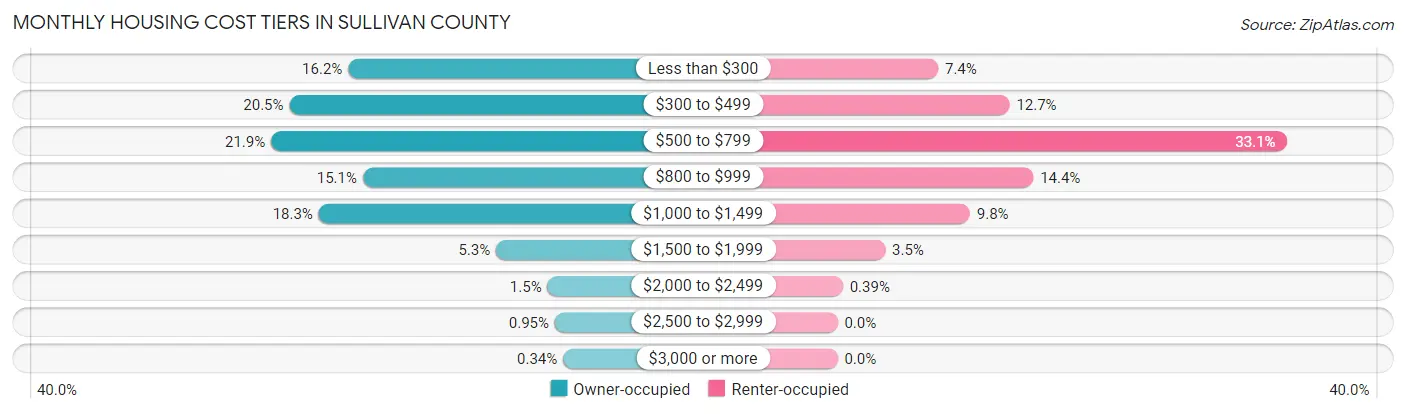
| Monthly Cost | Owner-occupied | Renter-occupied |
| Less than $300 | 239 (16.2%) | 38 (7.4%) |
| $300 to $499 | 303 (20.5%) | 65 (12.7%) |
| $500 to $799 | 323 (21.8%) | 170 (33.1%) |
| $800 to $999 | 223 (15.1%) | 74 (14.4%) |
| $1,000 to $1,499 | 271 (18.3%) | 50 (9.8%) |
| $1,500 to $1,999 | 78 (5.3%) | 18 (3.5%) |
| $2,000 to $2,499 | 22 (1.5%) | 2 (0.4%) |
| $2,500 to $2,999 | 14 (0.9%) | 0 (0.0%) |
| $3,000 or more | 5 (0.3%) | 0 (0.0%) |
| Total | 1,478 (100.0%) | 513 (100.0%) |
Physical Housing Characteristics in Sullivan County
Housing Structures in Sullivan County
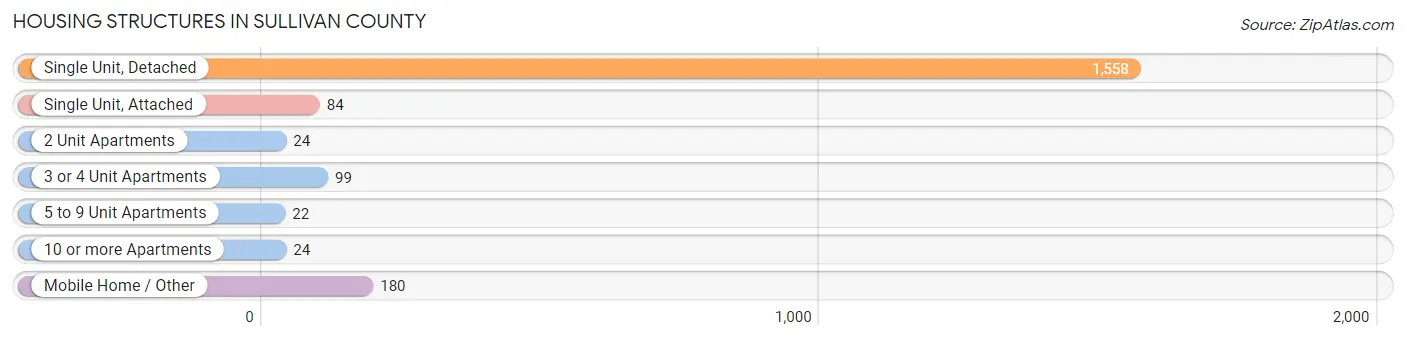
| Structure Type | # Housing Units | % Housing Units |
| Single Unit, Detached | 1,558 | 78.2% |
| Single Unit, Attached | 84 | 4.2% |
| 2 Unit Apartments | 24 | 1.2% |
| 3 or 4 Unit Apartments | 99 | 5.0% |
| 5 to 9 Unit Apartments | 22 | 1.1% |
| 10 or more Apartments | 24 | 1.2% |
| Mobile Home / Other | 180 | 9.0% |
| Total | 1,991 | 100.0% |
Housing Structures by Occupancy in Sullivan County
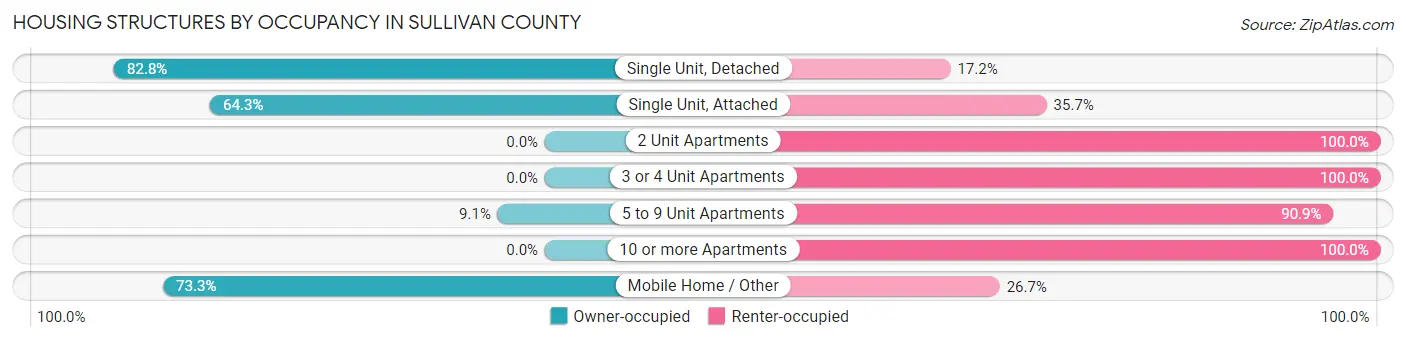
| Structure Type | Owner-occupied | Renter-occupied |
| Single Unit, Detached | 1,290 (82.8%) | 268 (17.2%) |
| Single Unit, Attached | 54 (64.3%) | 30 (35.7%) |
| 2 Unit Apartments | 0 (0.0%) | 24 (100.0%) |
| 3 or 4 Unit Apartments | 0 (0.0%) | 99 (100.0%) |
| 5 to 9 Unit Apartments | 2 (9.1%) | 20 (90.9%) |
| 10 or more Apartments | 0 (0.0%) | 24 (100.0%) |
| Mobile Home / Other | 132 (73.3%) | 48 (26.7%) |
| Total | 1,478 (74.2%) | 513 (25.8%) |
Housing Structures by Number of Rooms in Sullivan County
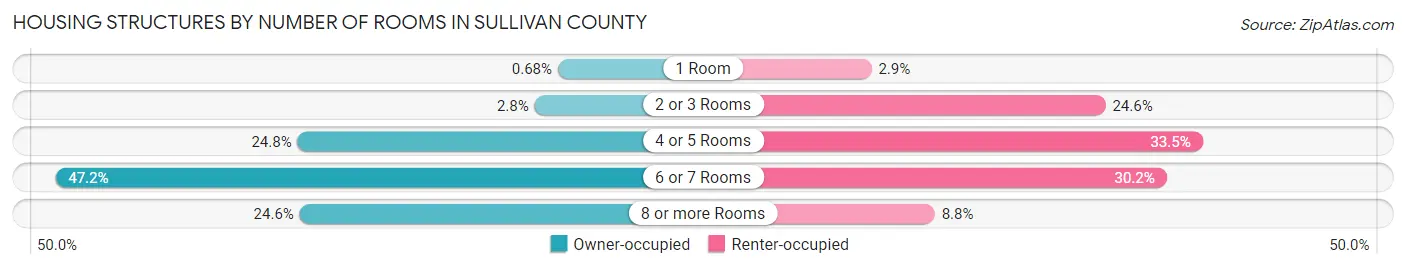
| Number of Rooms | Owner-occupied | Renter-occupied |
| 1 Room | 10 (0.7%) | 15 (2.9%) |
| 2 or 3 Rooms | 42 (2.8%) | 126 (24.6%) |
| 4 or 5 Rooms | 366 (24.8%) | 172 (33.5%) |
| 6 or 7 Rooms | 697 (47.2%) | 155 (30.2%) |
| 8 or more Rooms | 363 (24.6%) | 45 (8.8%) |
| Total | 1,478 (100.0%) | 513 (100.0%) |
Housing Structure by Heating Type in Sullivan County
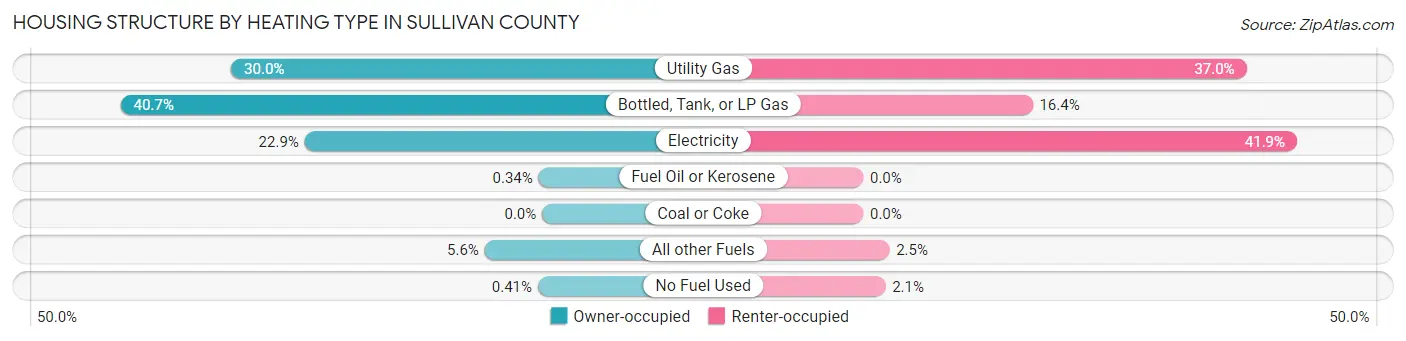
| Heating Type | Owner-occupied | Renter-occupied |
| Utility Gas | 444 (30.0%) | 190 (37.0%) |
| Bottled, Tank, or LP Gas | 602 (40.7%) | 84 (16.4%) |
| Electricity | 339 (22.9%) | 215 (41.9%) |
| Fuel Oil or Kerosene | 5 (0.3%) | 0 (0.0%) |
| Coal or Coke | 0 (0.0%) | 0 (0.0%) |
| All other Fuels | 82 (5.6%) | 13 (2.5%) |
| No Fuel Used | 6 (0.4%) | 11 (2.1%) |
| Total | 1,478 (100.0%) | 513 (100.0%) |
Household Vehicle Usage in Sullivan County
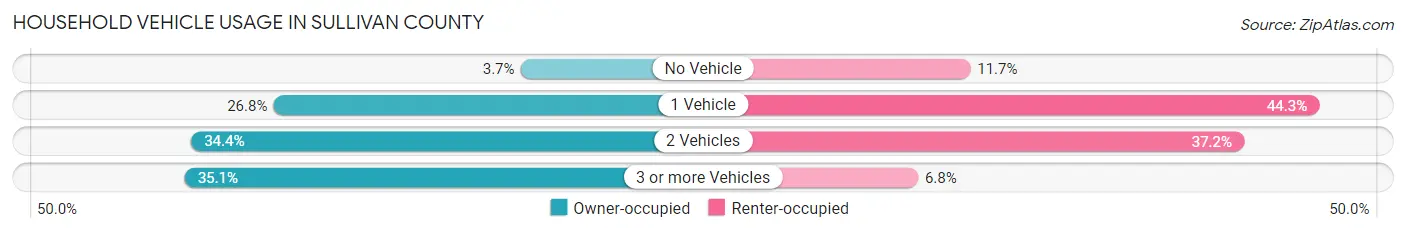
| Vehicles per Household | Owner-occupied | Renter-occupied |
| No Vehicle | 55 (3.7%) | 60 (11.7%) |
| 1 Vehicle | 396 (26.8%) | 227 (44.3%) |
| 2 Vehicles | 509 (34.4%) | 191 (37.2%) |
| 3 or more Vehicles | 518 (35.0%) | 35 (6.8%) |
| Total | 1,478 (100.0%) | 513 (100.0%) |
Real Estate & Mortgages in Sullivan County
Real Estate and Mortgage Overview in Sullivan County
| Characteristic | Without Mortgage | With Mortgage |
| Housing Units | 856 | 622 |
| Median Property Value | $79,500 | $99,300 |
| Median Household Income | $53,214 | $21 |
| Monthly Housing Costs | $420 | $5 |
| Real Estate Taxes | $670 | $13 |
Property Value by Mortgage Status in Sullivan County
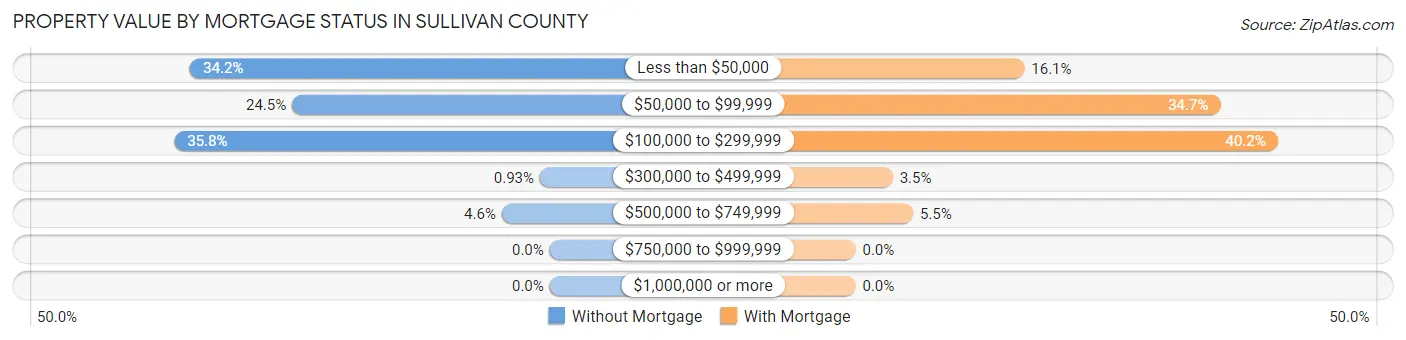
| Property Value | Without Mortgage | With Mortgage |
| Less than $50,000 | 293 (34.2%) | 100 (16.1%) |
| $50,000 to $99,999 | 210 (24.5%) | 216 (34.7%) |
| $100,000 to $299,999 | 306 (35.7%) | 250 (40.2%) |
| $300,000 to $499,999 | 8 (0.9%) | 22 (3.5%) |
| $500,000 to $749,999 | 39 (4.6%) | 34 (5.5%) |
| $750,000 to $999,999 | 0 (0.0%) | 0 (0.0%) |
| $1,000,000 or more | 0 (0.0%) | 0 (0.0%) |
| Total | 856 (100.0%) | 622 (100.0%) |
Household Income by Mortgage Status in Sullivan County
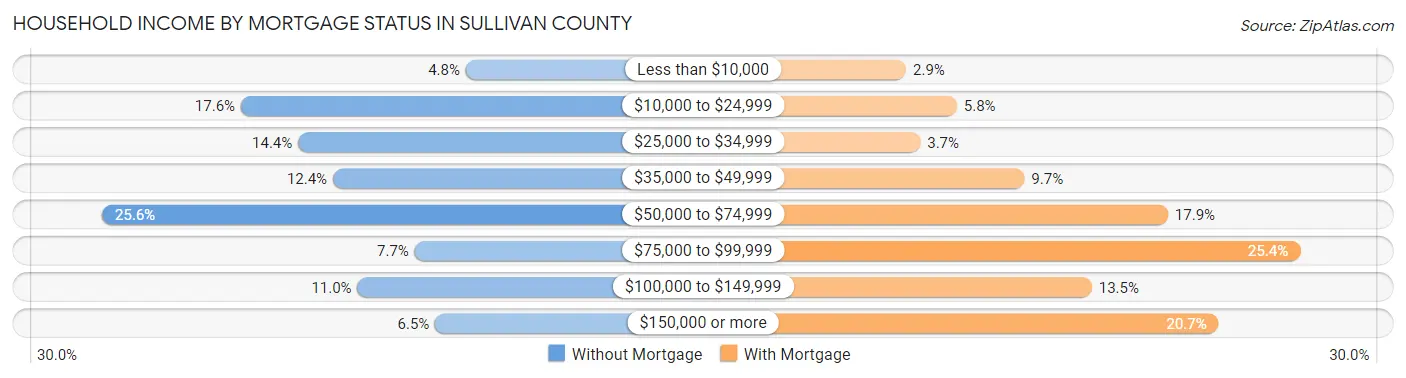
| Household Income | Without Mortgage | With Mortgage |
| Less than $10,000 | 41 (4.8%) | 18 (2.9%) |
| $10,000 to $24,999 | 151 (17.6%) | 36 (5.8%) |
| $25,000 to $34,999 | 123 (14.4%) | 23 (3.7%) |
| $35,000 to $49,999 | 106 (12.4%) | 60 (9.7%) |
| $50,000 to $74,999 | 219 (25.6%) | 111 (17.8%) |
| $75,000 to $99,999 | 66 (7.7%) | 158 (25.4%) |
| $100,000 to $149,999 | 94 (11.0%) | 84 (13.5%) |
| $150,000 or more | 56 (6.5%) | 129 (20.7%) |
| Total | 856 (100.0%) | 622 (100.0%) |
Property Value to Household Income Ratio in Sullivan County
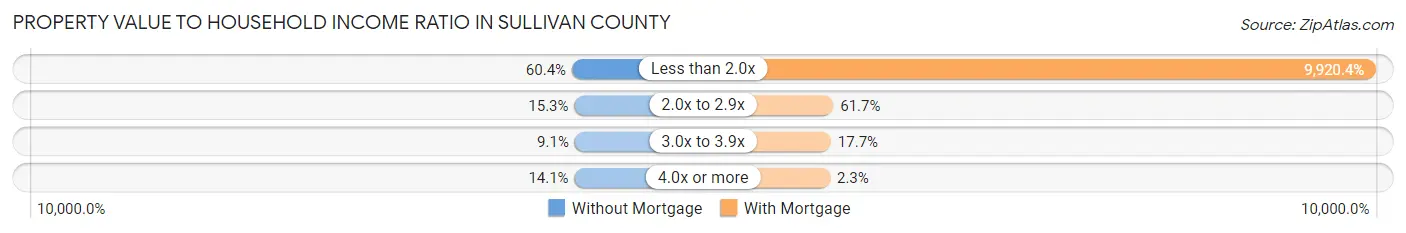
| Value-to-Income Ratio | Without Mortgage | With Mortgage |
| Less than 2.0x | 517 (60.4%) | 61,705 (9,920.4%) |
| 2.0x to 2.9x | 131 (15.3%) | 384 (61.7%) |
| 3.0x to 3.9x | 78 (9.1%) | 110 (17.7%) |
| 4.0x or more | 121 (14.1%) | 14 (2.2%) |
| Total | 856 (100.0%) | 622 (100.0%) |
Real Estate Taxes by Mortgage Status in Sullivan County
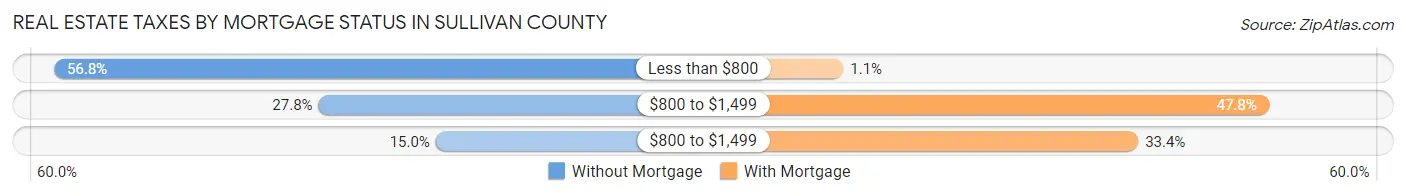
| Property Taxes | Without Mortgage | With Mortgage |
| Less than $800 | 486 (56.8%) | 7 (1.1%) |
| $800 to $1,499 | 238 (27.8%) | 297 (47.7%) |
| $800 to $1,499 | 128 (14.9%) | 208 (33.4%) |
| Total | 856 (100.0%) | 622 (100.0%) |
Health & Disability in Sullivan County
Health Insurance Coverage by Age in Sullivan County
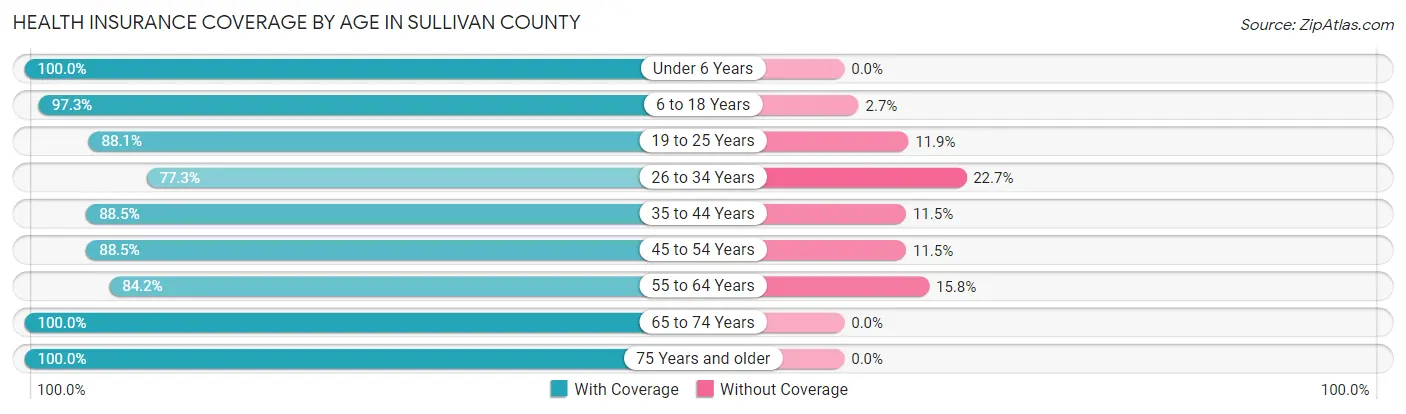
| Age Bracket | With Coverage | Without Coverage |
| Under 6 Years | 424 (100.0%) | 0 (0.0%) |
| 6 to 18 Years | 1,057 (97.3%) | 29 (2.7%) |
| 19 to 25 Years | 354 (88.1%) | 48 (11.9%) |
| 26 to 34 Years | 435 (77.3%) | 128 (22.7%) |
| 35 to 44 Years | 600 (88.5%) | 78 (11.5%) |
| 45 to 54 Years | 653 (88.5%) | 85 (11.5%) |
| 55 to 64 Years | 709 (84.2%) | 133 (15.8%) |
| 65 to 74 Years | 654 (100.0%) | 0 (0.0%) |
| 75 Years and older | 436 (100.0%) | 0 (0.0%) |
| Total | 5,322 (91.4%) | 501 (8.6%) |
Health Insurance Coverage by Citizenship Status in Sullivan County
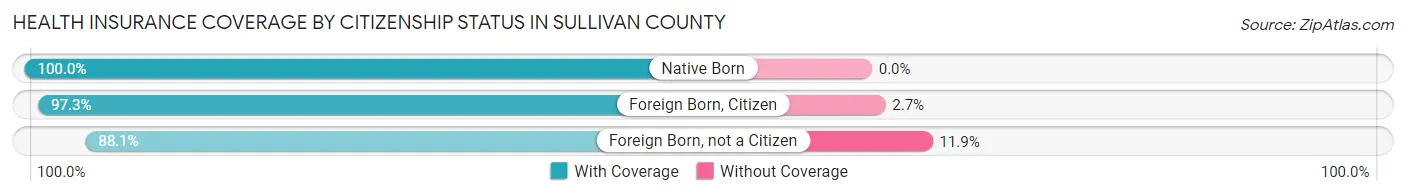
| Citizenship Status | With Coverage | Without Coverage |
| Native Born | 424 (100.0%) | 0 (0.0%) |
| Foreign Born, Citizen | 1,057 (97.3%) | 29 (2.7%) |
| Foreign Born, not a Citizen | 354 (88.1%) | 48 (11.9%) |
Health Insurance Coverage by Household Income in Sullivan County
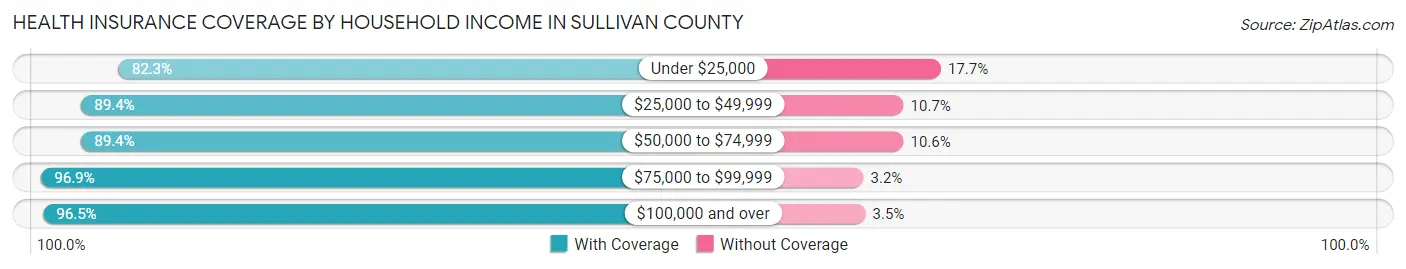
| Household Income | With Coverage | Without Coverage |
| Under $25,000 | 583 (82.3%) | 125 (17.7%) |
| $25,000 to $49,999 | 1,174 (89.3%) | 140 (10.6%) |
| $50,000 to $74,999 | 1,318 (89.4%) | 157 (10.6%) |
| $75,000 to $99,999 | 799 (96.9%) | 26 (3.2%) |
| $100,000 and over | 1,423 (96.5%) | 52 (3.5%) |
Public vs Private Health Insurance Coverage by Age in Sullivan County
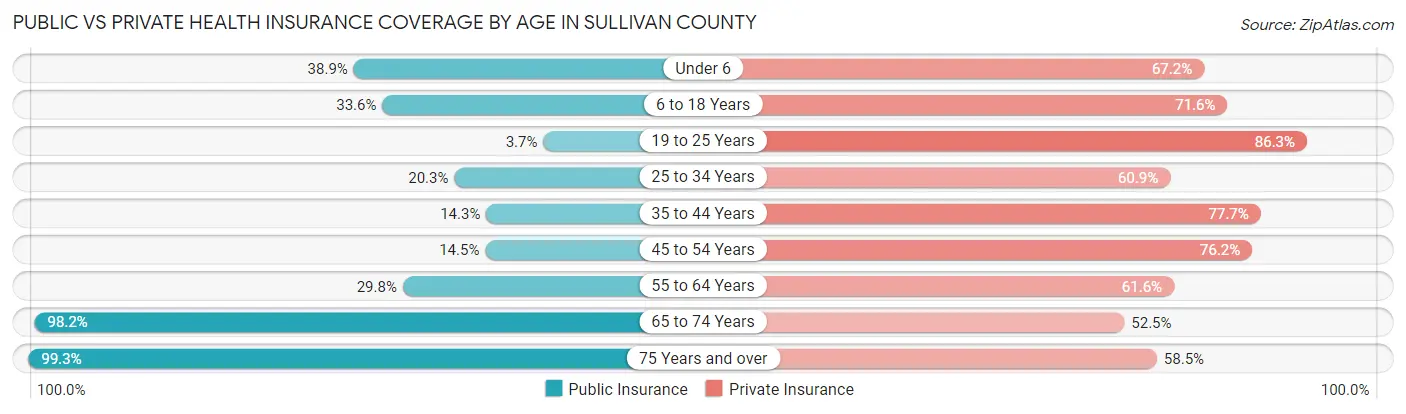
| Age Bracket | Public Insurance | Private Insurance |
| Under 6 | 165 (38.9%) | 285 (67.2%) |
| 6 to 18 Years | 365 (33.6%) | 777 (71.6%) |
| 19 to 25 Years | 15 (3.7%) | 347 (86.3%) |
| 25 to 34 Years | 114 (20.3%) | 343 (60.9%) |
| 35 to 44 Years | 97 (14.3%) | 527 (77.7%) |
| 45 to 54 Years | 107 (14.5%) | 562 (76.1%) |
| 55 to 64 Years | 251 (29.8%) | 519 (61.6%) |
| 65 to 74 Years | 642 (98.2%) | 343 (52.4%) |
| 75 Years and over | 433 (99.3%) | 255 (58.5%) |
| Total | 2,189 (37.6%) | 3,958 (68.0%) |
Disability Status by Sex by Age in Sullivan County
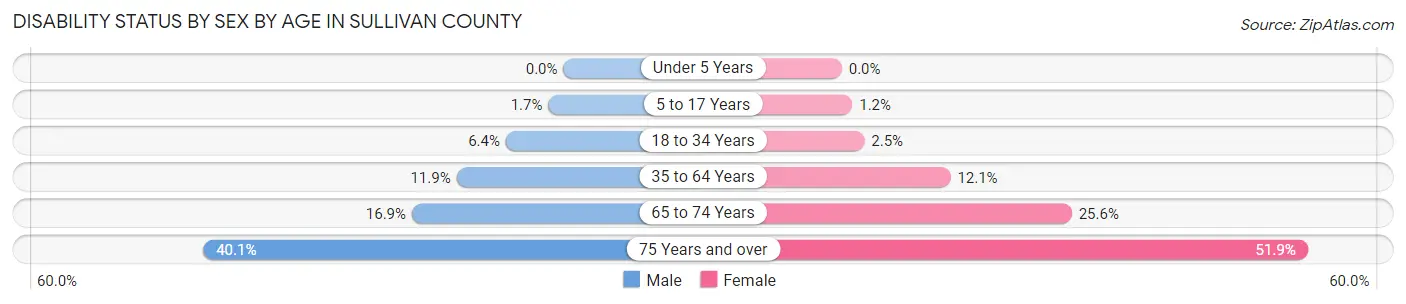
| Age Bracket | Male | Female |
| Under 5 Years | 0 (0.0%) | 0 (0.0%) |
| 5 to 17 Years | 9 (1.7%) | 5 (1.2%) |
| 18 to 34 Years | 37 (6.4%) | 14 (2.5%) |
| 35 to 64 Years | 134 (11.9%) | 137 (12.1%) |
| 65 to 74 Years | 55 (16.9%) | 84 (25.6%) |
| 75 Years and over | 79 (40.1%) | 124 (51.9%) |
Disability Class by Sex by Age in Sullivan County
Disability Class: Hearing Difficulty
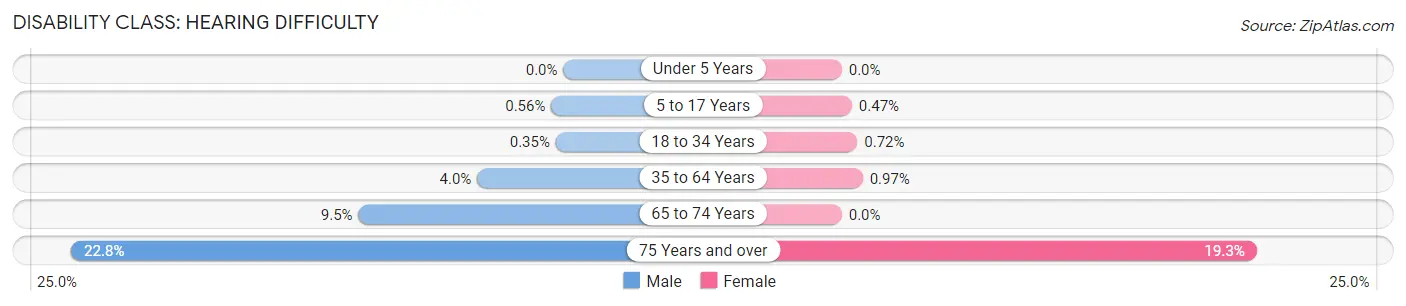
| Age Bracket | Male | Female |
| Under 5 Years | 0 (0.0%) | 0 (0.0%) |
| 5 to 17 Years | 3 (0.6%) | 2 (0.5%) |
| 18 to 34 Years | 2 (0.4%) | 4 (0.7%) |
| 35 to 64 Years | 45 (4.0%) | 11 (1.0%) |
| 65 to 74 Years | 31 (9.5%) | 0 (0.0%) |
| 75 Years and over | 45 (22.8%) | 46 (19.3%) |
Disability Class: Vision Difficulty
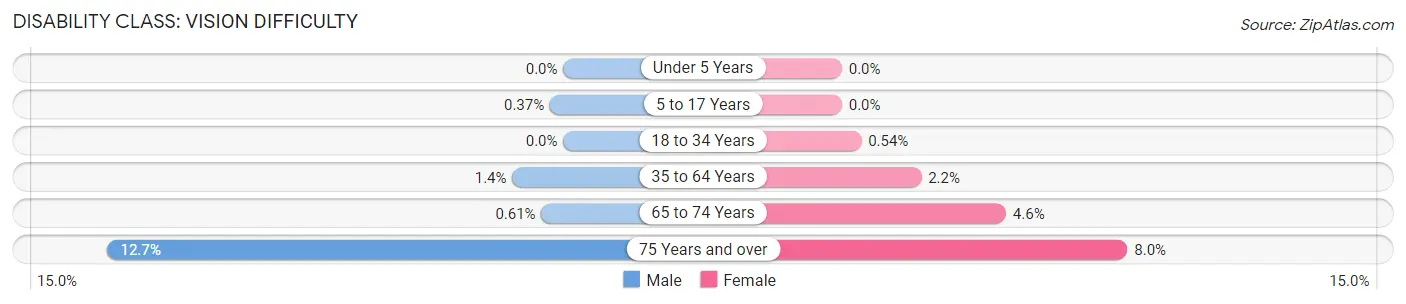
| Age Bracket | Male | Female |
| Under 5 Years | 0 (0.0%) | 0 (0.0%) |
| 5 to 17 Years | 2 (0.4%) | 0 (0.0%) |
| 18 to 34 Years | 0 (0.0%) | 3 (0.5%) |
| 35 to 64 Years | 16 (1.4%) | 25 (2.2%) |
| 65 to 74 Years | 2 (0.6%) | 15 (4.6%) |
| 75 Years and over | 25 (12.7%) | 19 (8.0%) |
Disability Class: Cognitive Difficulty
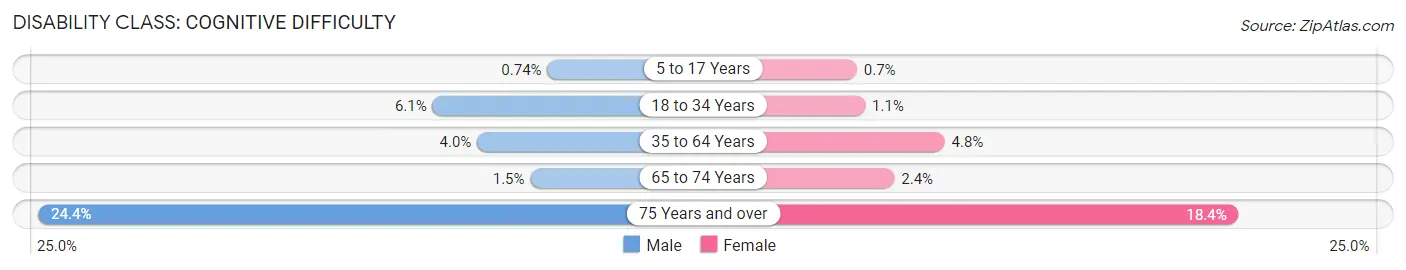
| Age Bracket | Male | Female |
| 5 to 17 Years | 4 (0.7%) | 3 (0.7%) |
| 18 to 34 Years | 35 (6.1%) | 6 (1.1%) |
| 35 to 64 Years | 45 (4.0%) | 54 (4.8%) |
| 65 to 74 Years | 5 (1.5%) | 8 (2.4%) |
| 75 Years and over | 48 (24.4%) | 44 (18.4%) |
Disability Class: Ambulatory Difficulty
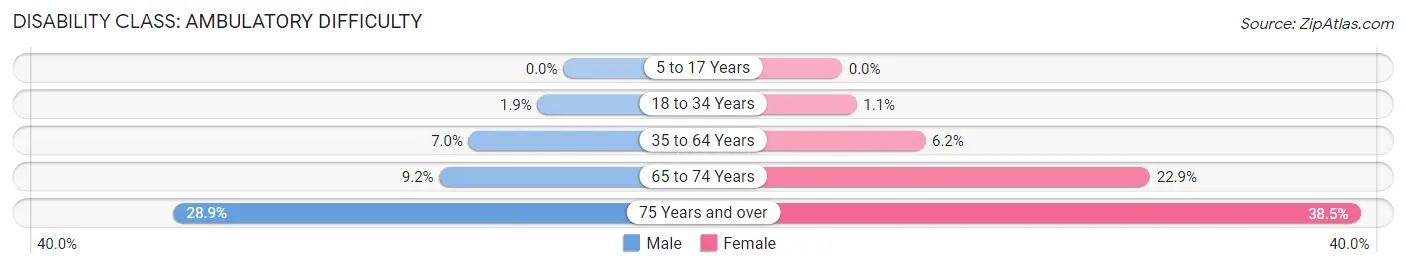
| Age Bracket | Male | Female |
| 5 to 17 Years | 0 (0.0%) | 0 (0.0%) |
| 18 to 34 Years | 11 (1.9%) | 6 (1.1%) |
| 35 to 64 Years | 79 (7.0%) | 70 (6.2%) |
| 65 to 74 Years | 30 (9.2%) | 75 (22.9%) |
| 75 Years and over | 57 (28.9%) | 92 (38.5%) |
Disability Class: Self-Care Difficulty
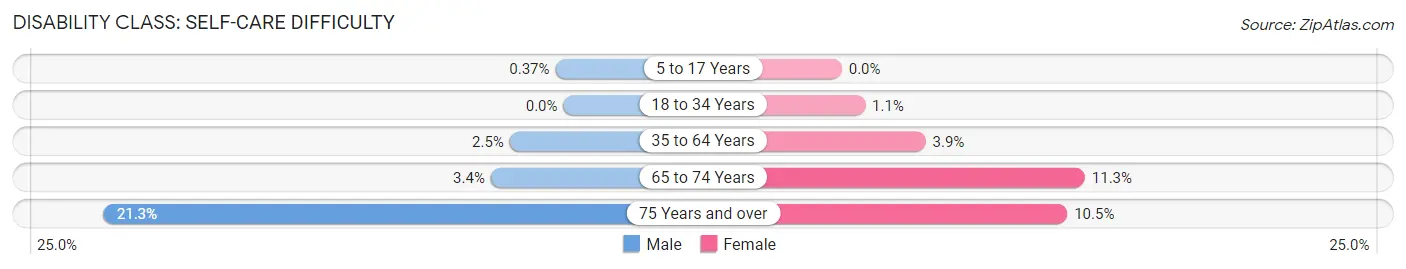
| Age Bracket | Male | Female |
| 5 to 17 Years | 2 (0.4%) | 0 (0.0%) |
| 18 to 34 Years | 0 (0.0%) | 6 (1.1%) |
| 35 to 64 Years | 28 (2.5%) | 44 (3.9%) |
| 65 to 74 Years | 11 (3.4%) | 37 (11.3%) |
| 75 Years and over | 42 (21.3%) | 25 (10.5%) |
Technology Access in Sullivan County
Computing Device Access in Sullivan County
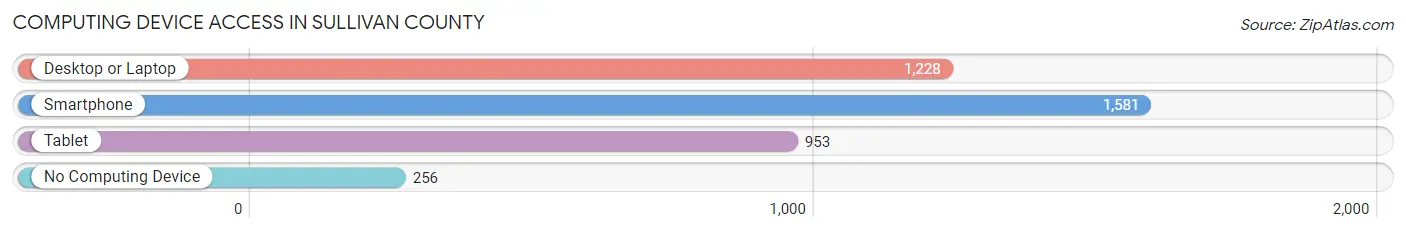
| Device Type | # Households | % Households |
| Desktop or Laptop | 1,228 | 61.7% |
| Smartphone | 1,581 | 79.4% |
| Tablet | 953 | 47.9% |
| No Computing Device | 256 | 12.9% |
| Total | 1,991 | 100.0% |
Internet Access in Sullivan County
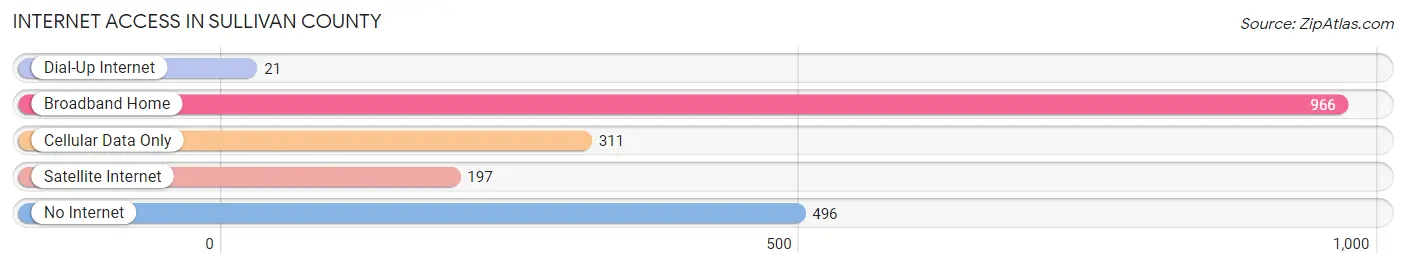
| Internet Type | # Households | % Households |
| Dial-Up Internet | 21 | 1.1% |
| Broadband Home | 966 | 48.5% |
| Cellular Data Only | 311 | 15.6% |
| Satellite Internet | 197 | 9.9% |
| No Internet | 496 | 24.9% |
| Total | 1,991 | 100.0% |
Sullivan County Summary
Sullivan County is located in the northeast corner of Missouri, and is bordered by Putnam County to the north, Adair County to the east, Linn County to the south, and Mercer County to the west. The county seat is Milan, and the county was named after Daniel Sullivan, a pioneer settler. The county has a total area of 517 square miles, of which 515 square miles is land and 2 square miles is water.
History
Sullivan County was established in 1845, and was originally part of Putnam County. The county was named after Daniel Sullivan, a pioneer settler who arrived in the area in 1820. The first settlers in the county were mostly of German and Irish descent.
The first county seat was located in the town of Milan, which was founded in 1845. The town was named after the Italian city of Milan, and was chosen as the county seat due to its central location.
The county experienced rapid growth in the late 19th century, with the population increasing from 4,000 in 1880 to 10,000 in 1900. This growth was largely due to the arrival of the railroad, which connected the county to the rest of the state.
Geography
Sullivan County is located in the northeast corner of Missouri, and is bordered by Putnam County to the north, Adair County to the east, Linn County to the south, and Mercer County to the west. The county has a total area of 517 square miles, of which 515 square miles is land and 2 square miles is water.
The county is mostly rural, with the majority of the land being used for agriculture. The terrain is mostly rolling hills, with the highest point being located in the northwest corner of the county at an elevation of 1,065 feet.
The county is home to several small towns, including Milan, Green City, Browning, and Pollock. The county also contains several small lakes, including Lake Thunderhead, Lake Viking, and Lake Wappapello.
Economy
The economy of Sullivan County is largely based on agriculture. The county is home to several large farms, and the majority of the land is used for growing crops such as corn, soybeans, and wheat.
The county is also home to several small businesses, including manufacturing, retail, and service industries. The county is home to several small manufacturing companies, including a furniture factory, a plastics factory, and a metal fabrication plant.
The county is also home to several small retail businesses, including grocery stores, hardware stores, and clothing stores. The county is also home to several small service businesses, including auto repair shops, restaurants, and hotels.
Demographics
As of the 2010 census, the population of Sullivan County was 8,845. The population has remained relatively stable over the past decade, with a slight decrease of 0.3% since 2000.
The racial makeup of the county is 97.3% White, 0.7% African American, 0.2% Native American, 0.2% Asian, 0.1% Pacific Islander, 0.4% from other races, and 1.1% from two or more races. The median household income is $37,945, and the median family income is $45,938.
The largest employers in the county are the Milan C-2 School District, the Sullivan County Memorial Hospital, and the Sullivan County Sheriff's Office. The county is also home to several small businesses, including manufacturing, retail, and service industries.
Common Questions
What is Per Capita Income in Sullivan County?
Per Capita income in Sullivan County is $25,882.
What is the Median Family Income in Sullivan County?
Median Family Income in Sullivan County is $64,911.
What is the Median Household income in Sullivan County?
Median Household Income in Sullivan County is $53,438.
What is Income or Wage Gap in Sullivan County?
Income or Wage Gap in Sullivan County is 20.1%.
Women in Sullivan County earn 79.9 cents for every dollar earned by a man.
What is Family Income Deficit in Sullivan County?
Family Income Deficit in Sullivan County is $8,256.
Families that are below poverty line in Sullivan County earn $8,256 less on average than the poverty threshold level.
What is Inequality or Gini Index in Sullivan County?
Inequality or Gini Index in Sullivan County is 0.42.
What is the Total Population of Sullivan County?
Total Population of Sullivan County is 5,983.
What is the Total Male Population of Sullivan County?
Total Male Population of Sullivan County is 3,001.
What is the Total Female Population of Sullivan County?
Total Female Population of Sullivan County is 2,982.
What is the Ratio of Males per 100 Females in Sullivan County?
There are 100.64 Males per 100 Females in Sullivan County.
What is the Ratio of Females per 100 Males in Sullivan County?
There are 99.37 Females per 100 Males in Sullivan County.
What is the Median Population Age in Sullivan County?
Median Population Age in Sullivan County is 43.9 Years.
What is the Average Family Size in Sullivan County
Average Family Size in Sullivan County is 3.9 People.
What is the Average Household Size in Sullivan County
Average Household Size in Sullivan County is 2.9 People.
How Large is the Labor Force in Sullivan County?
There are 2,704 People in the Labor Forcein in Sullivan County.
What is the Percentage of People in the Labor Force in Sullivan County?
56.1% of People are in the Labor Force in Sullivan County.
What is the Unemployment Rate in Sullivan County?
Unemployment Rate in Sullivan County is 2.4%.