Stone County, MO Map & Demographics
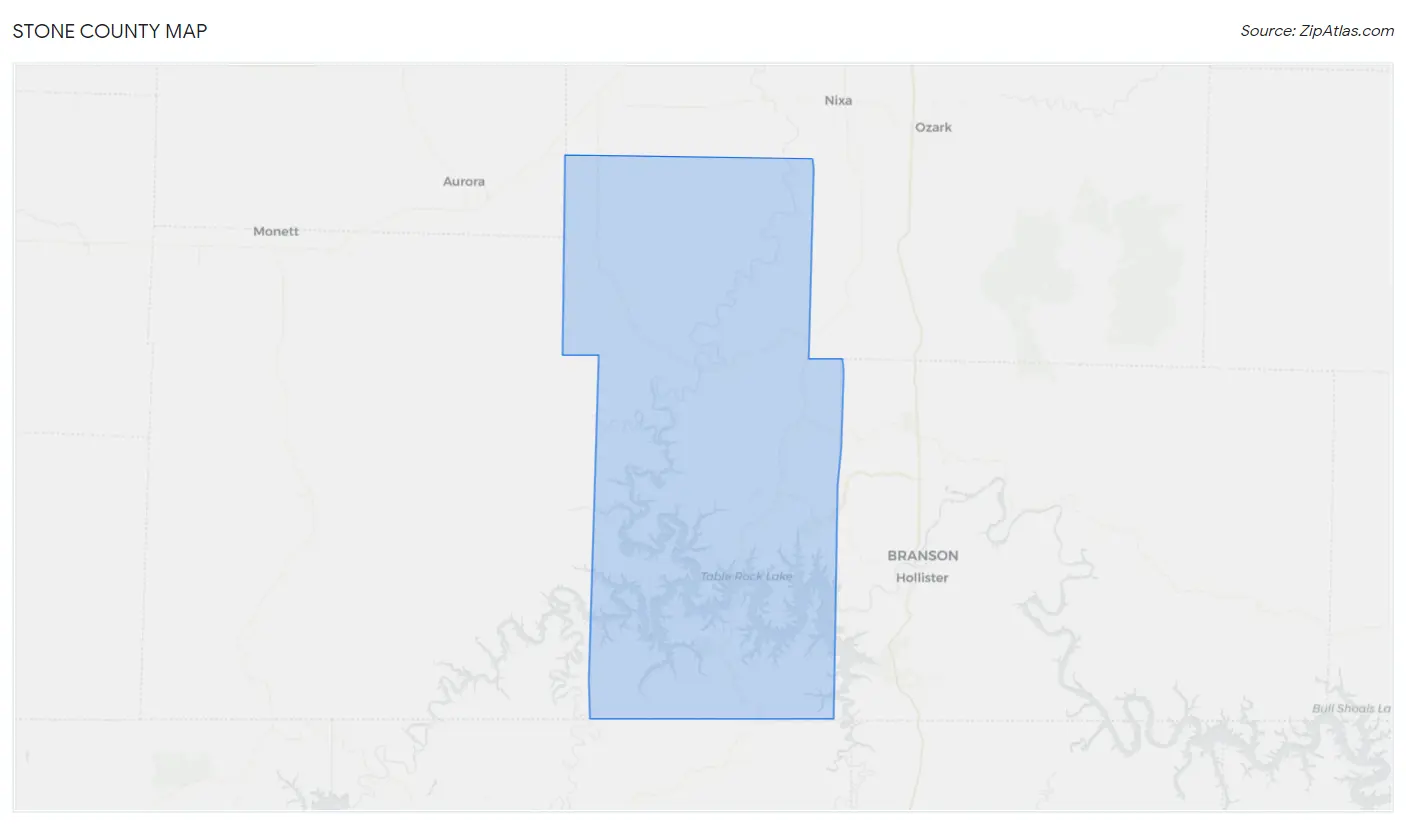
Stone County Map
Stone County Overview
$31,865
PER CAPITA INCOME
$69,762
AVG FAMILY INCOME
$58,392
AVG HOUSEHOLD INCOME
29.3%
WAGE / INCOME GAP [ % ]
70.7¢/ $1
WAGE / INCOME GAP [ $ ]
$10,214
FAMILY INCOME DEFICIT
0.45
INEQUALITY / GINI INDEX
31,314
TOTAL POPULATION
15,415
MALE POPULATION
15,899
FEMALE POPULATION
96.96
MALES / 100 FEMALES
103.14
FEMALES / 100 MALES
54.6
MEDIAN AGE
2.9
AVG FAMILY SIZE
2.4
AVG HOUSEHOLD SIZE
13,105
LABOR FORCE [ PEOPLE ]
48.7%
PERCENT IN LABOR FORCE
8.4%
UNEMPLOYMENT RATE
Stone County Area Codes
Income in Stone County
Income Overview in Stone County
Per Capita Income in Stone County is $31,865, while median incomes of families and households are $69,762 and $58,392 respectively.
| Characteristic | Number | Measure |
| Per Capita Income | 31,314 | $31,865 |
| Median Family Income | 8,741 | $69,762 |
| Mean Family Income | 8,741 | $86,253 |
| Median Household Income | 12,726 | $58,392 |
| Mean Household Income | 12,726 | $75,783 |
| Income Deficit | 8,741 | $10,214 |
| Wage / Income Gap (%) | 31,314 | 29.31% |
| Wage / Income Gap ($) | 31,314 | 70.69¢ per $1 |
| Gini / Inequality Index | 31,314 | 0.45 |
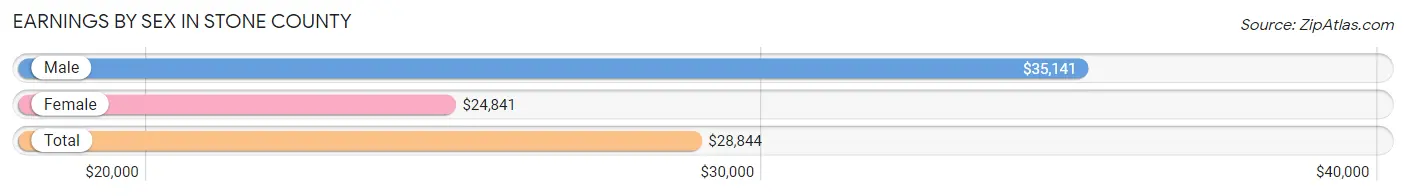
Earnings by Sex in Stone County
Average Earnings in Stone County are $28,844, $35,141 for men and $24,841 for women, a difference of 29.3%.
| Sex | Number | Average Earnings |
| Male | 6,929 (50.1%) | $35,141 |
| Female | 6,895 (49.9%) | $24,841 |
| Total | 13,824 (100.0%) | $28,844 |
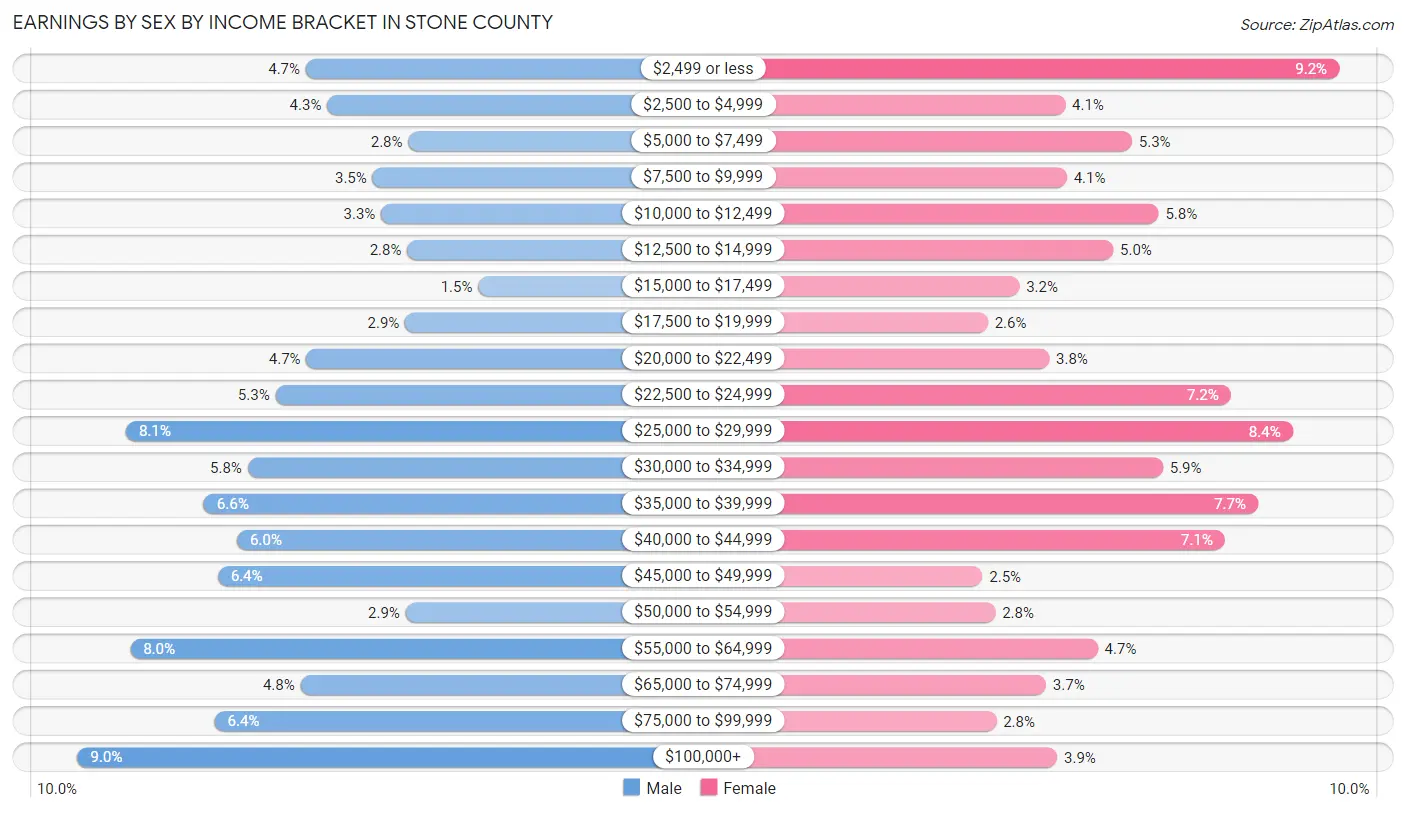
Earnings by Sex by Income Bracket in Stone County
The most common earnings brackets in Stone County are $100,000+ for men (624 | 9.0%) and $2,499 or less for women (636 | 9.2%).
| Income | Male | Female |
| $2,499 or less | 328 (4.7%) | 636 (9.2%) |
| $2,500 to $4,999 | 300 (4.3%) | 282 (4.1%) |
| $5,000 to $7,499 | 195 (2.8%) | 368 (5.3%) |
| $7,500 to $9,999 | 241 (3.5%) | 284 (4.1%) |
| $10,000 to $12,499 | 230 (3.3%) | 403 (5.8%) |
| $12,500 to $14,999 | 196 (2.8%) | 344 (5.0%) |
| $15,000 to $17,499 | 104 (1.5%) | 223 (3.2%) |
| $17,500 to $19,999 | 199 (2.9%) | 182 (2.6%) |
| $20,000 to $22,499 | 327 (4.7%) | 261 (3.8%) |
| $22,500 to $24,999 | 367 (5.3%) | 496 (7.2%) |
| $25,000 to $29,999 | 561 (8.1%) | 576 (8.4%) |
| $30,000 to $34,999 | 403 (5.8%) | 408 (5.9%) |
| $35,000 to $39,999 | 460 (6.6%) | 531 (7.7%) |
| $40,000 to $44,999 | 417 (6.0%) | 488 (7.1%) |
| $45,000 to $49,999 | 442 (6.4%) | 175 (2.5%) |
| $50,000 to $54,999 | 198 (2.9%) | 192 (2.8%) |
| $55,000 to $64,999 | 556 (8.0%) | 324 (4.7%) |
| $65,000 to $74,999 | 335 (4.8%) | 257 (3.7%) |
| $75,000 to $99,999 | 446 (6.4%) | 193 (2.8%) |
| $100,000+ | 624 (9.0%) | 272 (3.9%) |
| Total | 6,929 (100.0%) | 6,895 (100.0%) |
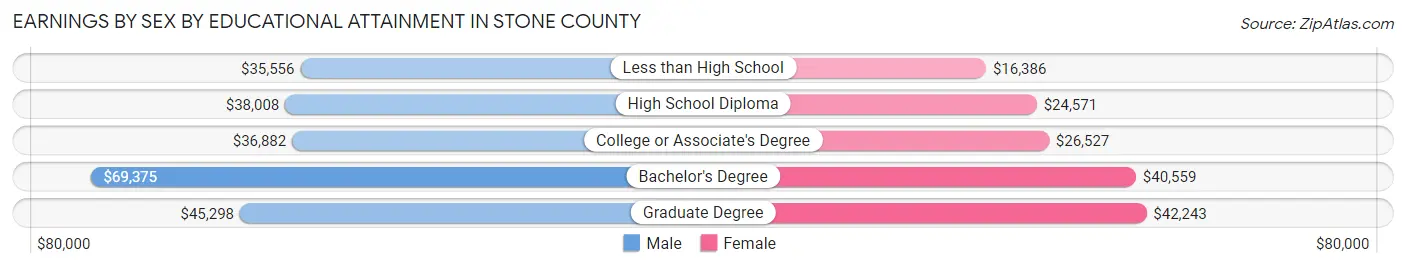
Earnings by Sex by Educational Attainment in Stone County
Average earnings in Stone County are $39,444 for men and $27,226 for women, a difference of 31.0%. Men with an educational attainment of bachelor's degree enjoy the highest average annual earnings of $69,375, while those with less than high school education earn the least with $35,556. Women with an educational attainment of graduate degree earn the most with the average annual earnings of $42,243, while those with less than high school education have the smallest earnings of $16,386.
| Educational Attainment | Male Income | Female Income |
| Less than High School | $35,556 | $16,386 |
| High School Diploma | $38,008 | $24,571 |
| College or Associate's Degree | $36,882 | $26,527 |
| Bachelor's Degree | $69,375 | $40,559 |
| Graduate Degree | $45,298 | $42,243 |
| Total | $39,444 | $27,226 |
Family Income in Stone County
Family Income Brackets in Stone County
According to the Stone County family income data, there are 2,089 families falling into the $50,000 to $74,999 income range, which is the most common income bracket and makes up 23.9% of all families. Conversely, the $10,000 to $14,999 income bracket is the least frequent group with only 175 families (2.0%) belonging to this category.
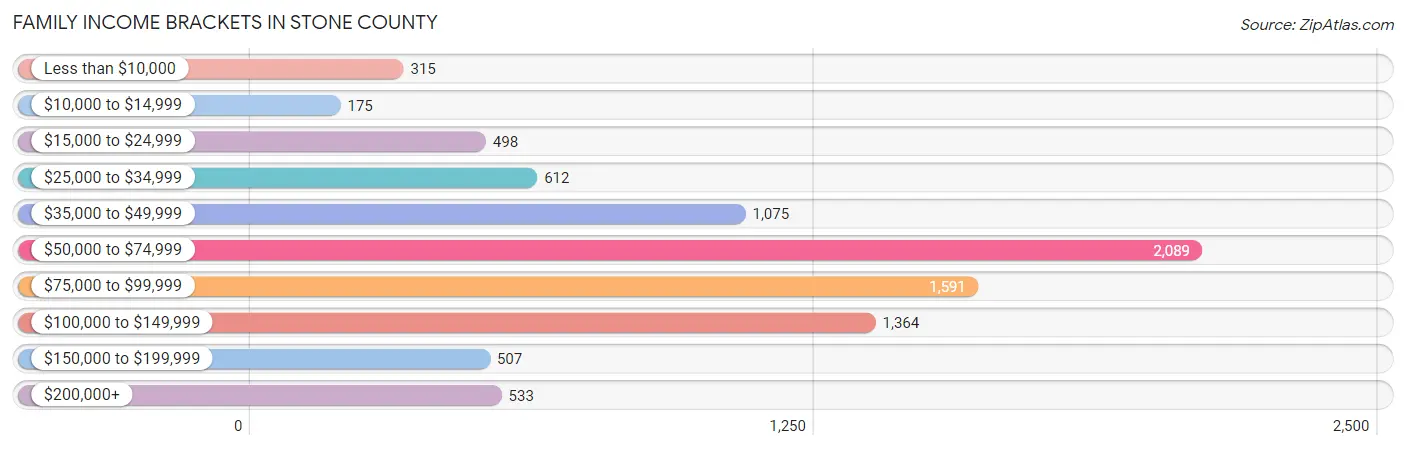
| Income Bracket | # Families | % Families |
| Less than $10,000 | 315 | 3.6% |
| $10,000 to $14,999 | 175 | 2.0% |
| $15,000 to $24,999 | 498 | 5.7% |
| $25,000 to $34,999 | 612 | 7.0% |
| $35,000 to $49,999 | 1,075 | 12.3% |
| $50,000 to $74,999 | 2,089 | 23.9% |
| $75,000 to $99,999 | 1,591 | 18.2% |
| $100,000 to $149,999 | 1,364 | 15.6% |
| $150,000 to $199,999 | 507 | 5.8% |
| $200,000+ | 533 | 6.1% |
Family Income by Famaliy Size in Stone County
4-person families (835 | 9.6%) account for the highest median family income in Stone County with $87,604 per family, while 2-person families (5,672 | 64.9%) have the highest median income of $34,000 per family member.
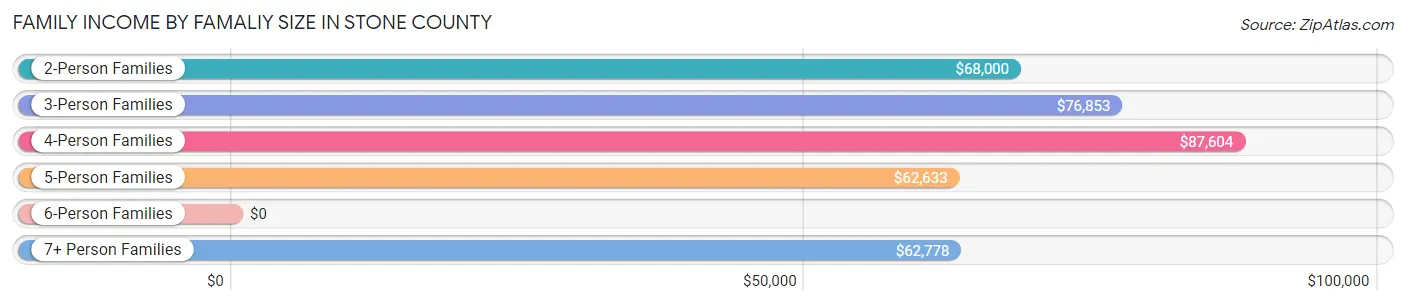
| Income Bracket | # Families | Median Income |
| 2-Person Families | 5,672 (64.9%) | $68,000 |
| 3-Person Families | 1,399 (16.0%) | $76,853 |
| 4-Person Families | 835 (9.6%) | $87,604 |
| 5-Person Families | 503 (5.8%) | $62,633 |
| 6-Person Families | 222 (2.5%) | $0 |
| 7+ Person Families | 110 (1.3%) | $62,778 |
| Total | 8,741 (100.0%) | $69,762 |
Family Income by Number of Earners in Stone County
The median family income in Stone County is $69,762, with families comprising 3+ earners (728) having the highest median family income of $118,811, while families with no earners (2,878) have the lowest median family income of $57,972, accounting for 8.3% and 32.9% of families, respectively.
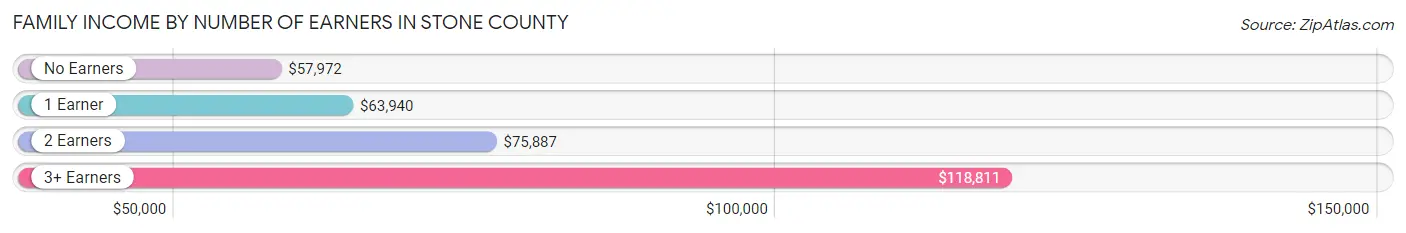
| Number of Earners | # Families | Median Income |
| No Earners | 2,878 (32.9%) | $57,972 |
| 1 Earner | 2,367 (27.1%) | $63,940 |
| 2 Earners | 2,768 (31.7%) | $75,887 |
| 3+ Earners | 728 (8.3%) | $118,811 |
| Total | 8,741 (100.0%) | $69,762 |
Household Income in Stone County
Household Income Brackets in Stone County
With 2,622 households falling in the category, the $50,000 to $74,999 income range is the most frequent in Stone County, accounting for 20.6% of all households. In contrast, only 458 households (3.6%) fall into the $10,000 to $14,999 income bracket, making it the least populous group.
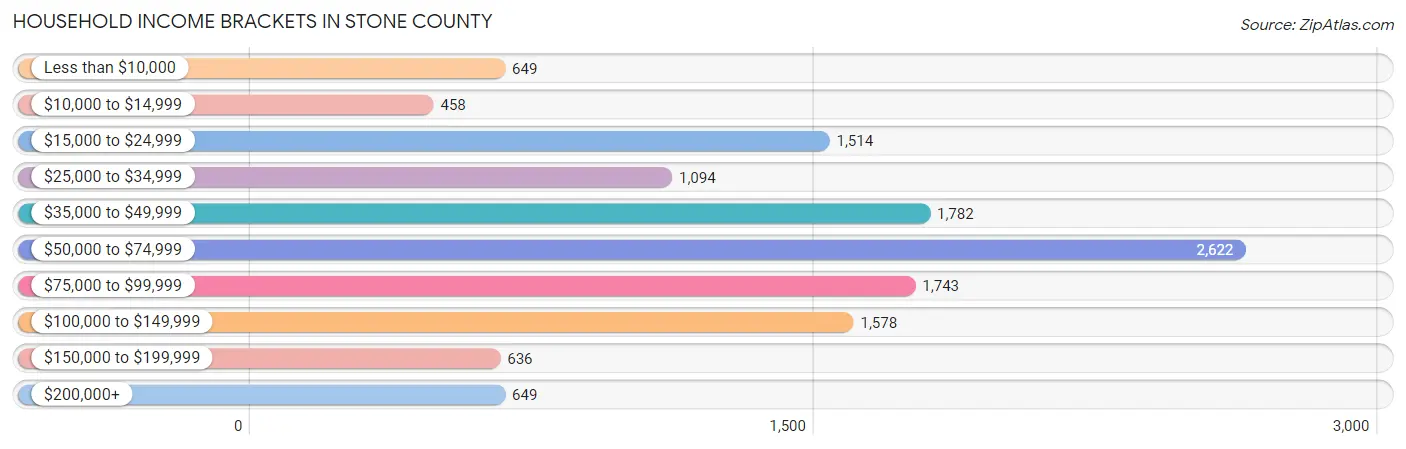
| Income Bracket | # Households | % Households |
| Less than $10,000 | 649 | 5.1% |
| $10,000 to $14,999 | 458 | 3.6% |
| $15,000 to $24,999 | 1,514 | 11.9% |
| $25,000 to $34,999 | 1,094 | 8.6% |
| $35,000 to $49,999 | 1,782 | 14.0% |
| $50,000 to $74,999 | 2,622 | 20.6% |
| $75,000 to $99,999 | 1,743 | 13.7% |
| $100,000 to $149,999 | 1,578 | 12.4% |
| $150,000 to $199,999 | 636 | 5.0% |
| $200,000+ | 649 | 5.1% |
Household Income by Householder Age in Stone County
The median household income in Stone County is $58,392, with the highest median household income of $72,901 found in the 45 to 64 years age bracket for the primary householder. A total of 4,624 households (36.3%) fall into this category. Meanwhile, the 15 to 24 years age bracket for the primary householder has the lowest median household income of $48,125, with 148 households (1.2%) in this group.
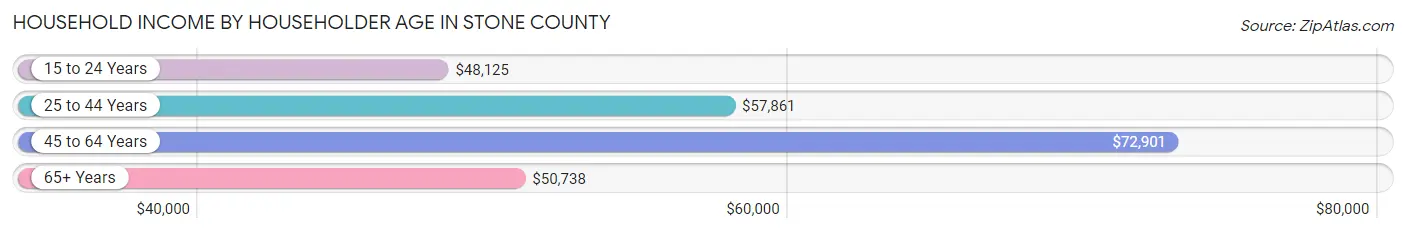
| Income Bracket | # Households | Median Income |
| 15 to 24 Years | 148 (1.2%) | $48,125 |
| 25 to 44 Years | 2,141 (16.8%) | $57,861 |
| 45 to 64 Years | 4,624 (36.3%) | $72,901 |
| 65+ Years | 5,813 (45.7%) | $50,738 |
| Total | 12,726 (100.0%) | $58,392 |
Poverty in Stone County
Income Below Poverty by Sex and Age in Stone County
With 12.5% poverty level for males and 15.6% for females among the residents of Stone County, 5 year old males and 15 year old females are the most vulnerable to poverty, with 75 males (42.4%) and 80 females (48.8%) in their respective age groups living below the poverty level.
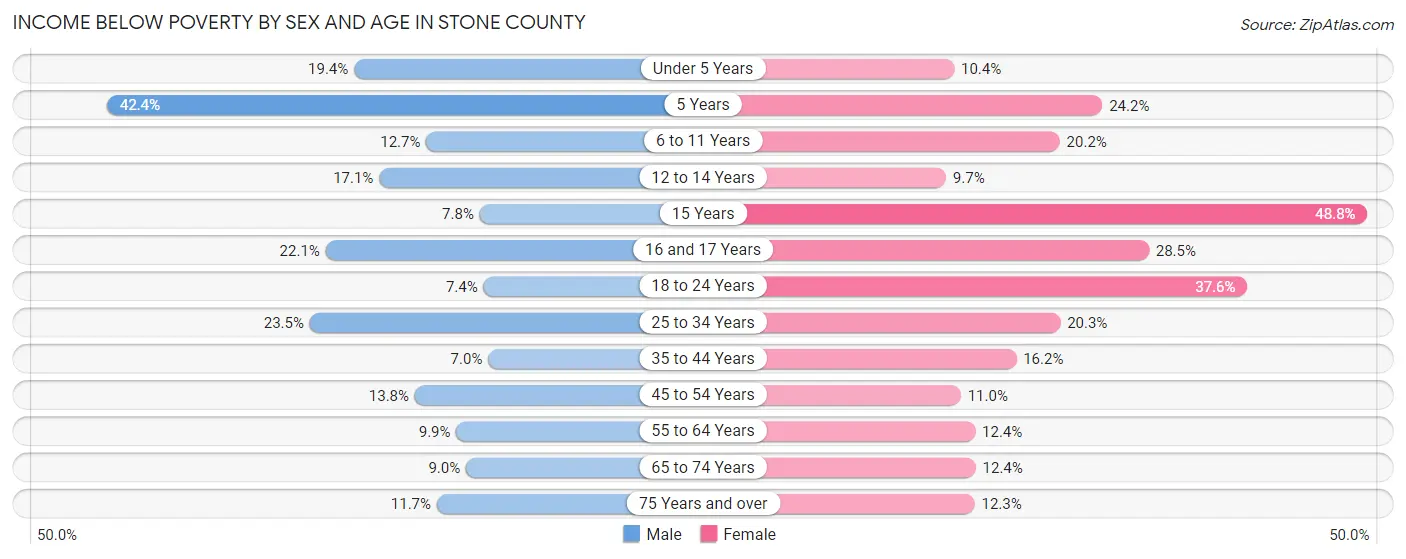
| Age Bracket | Male | Female |
| Under 5 Years | 120 (19.4%) | 54 (10.4%) |
| 5 Years | 75 (42.4%) | 29 (24.2%) |
| 6 to 11 Years | 99 (12.7%) | 148 (20.2%) |
| 12 to 14 Years | 80 (17.1%) | 51 (9.7%) |
| 15 Years | 9 (7.8%) | 80 (48.8%) |
| 16 and 17 Years | 88 (22.1%) | 96 (28.5%) |
| 18 to 24 Years | 68 (7.4%) | 330 (37.6%) |
| 25 to 34 Years | 292 (23.5%) | 240 (20.3%) |
| 35 to 44 Years | 107 (7.0%) | 245 (16.2%) |
| 45 to 54 Years | 226 (13.8%) | 197 (11.0%) |
| 55 to 64 Years | 269 (9.9%) | 358 (12.4%) |
| 65 to 74 Years | 257 (9.0%) | 384 (12.4%) |
| 75 Years and over | 213 (11.7%) | 229 (12.3%) |
| Total | 1,903 (12.5%) | 2,441 (15.6%) |
Income Above Poverty by Sex and Age in Stone County
According to the poverty statistics in Stone County, males aged 35 to 44 years and females aged 12 to 14 years are the age groups that are most secure financially, with 93.0% of males and 90.3% of females in these age groups living above the poverty line.
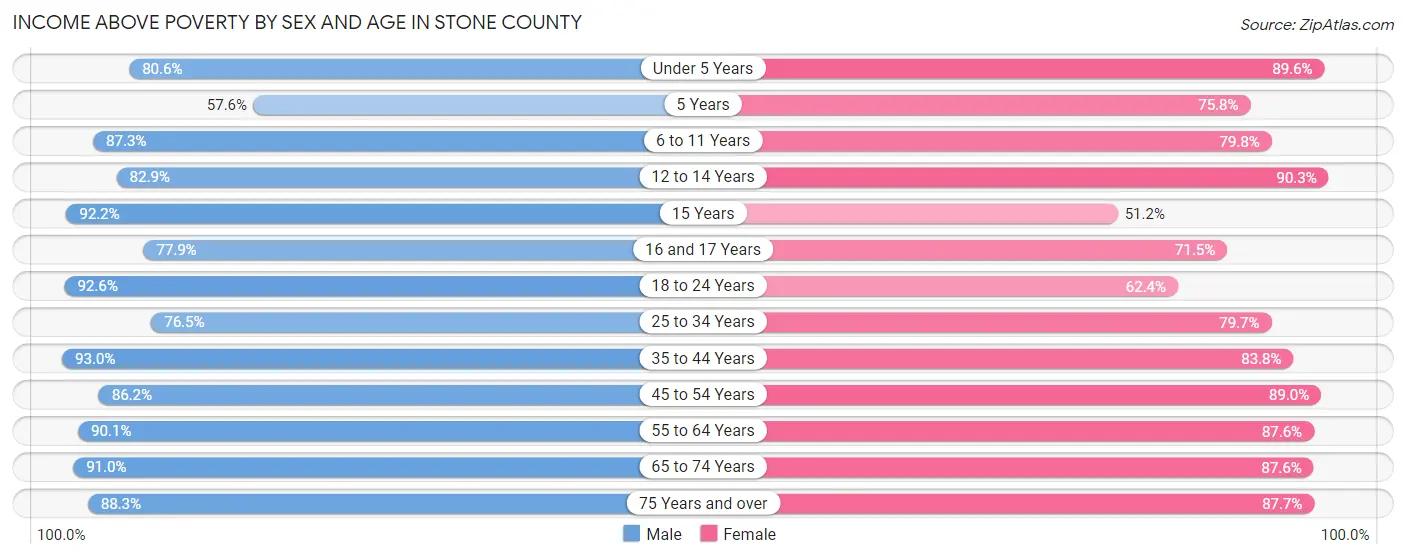
| Age Bracket | Male | Female |
| Under 5 Years | 498 (80.6%) | 464 (89.6%) |
| 5 Years | 102 (57.6%) | 91 (75.8%) |
| 6 to 11 Years | 679 (87.3%) | 584 (79.8%) |
| 12 to 14 Years | 388 (82.9%) | 477 (90.3%) |
| 15 Years | 107 (92.2%) | 84 (51.2%) |
| 16 and 17 Years | 311 (77.9%) | 241 (71.5%) |
| 18 to 24 Years | 850 (92.6%) | 547 (62.4%) |
| 25 to 34 Years | 949 (76.5%) | 944 (79.7%) |
| 35 to 44 Years | 1,428 (93.0%) | 1,268 (83.8%) |
| 45 to 54 Years | 1,414 (86.2%) | 1,587 (89.0%) |
| 55 to 64 Years | 2,441 (90.1%) | 2,537 (87.6%) |
| 65 to 74 Years | 2,589 (91.0%) | 2,708 (87.6%) |
| 75 Years and over | 1,602 (88.3%) | 1,630 (87.7%) |
| Total | 13,358 (87.5%) | 13,162 (84.4%) |
Income Below Poverty Among Married-Couple Families in Stone County
The poverty statistics for married-couple families in Stone County show that 6.2% or 464 of the total 7,427 families live below the poverty line. Families with 5 or more children have the highest poverty rate of 77.8%, comprising of 21 families. On the other hand, families with no children have the lowest poverty rate of 5.5%, which includes 312 families.
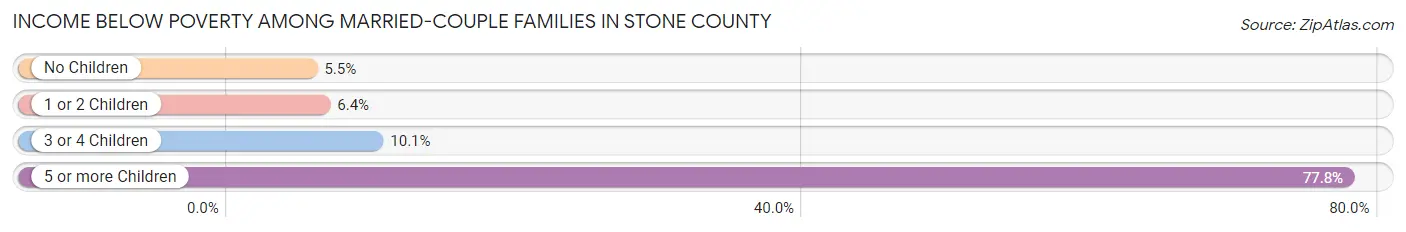
| Children | Above Poverty | Below Poverty |
| No Children | 5,335 (94.5%) | 312 (5.5%) |
| 1 or 2 Children | 1,178 (93.6%) | 81 (6.4%) |
| 3 or 4 Children | 444 (89.9%) | 50 (10.1%) |
| 5 or more Children | 6 (22.2%) | 21 (77.8%) |
| Total | 6,963 (93.8%) | 464 (6.2%) |
Income Below Poverty Among Single-Parent Households in Stone County
According to the poverty data in Stone County, 23.9% or 66 single-father households and 30.6% or 318 single-mother households are living below the poverty line. Among single-father households, those with 5 or more children have the highest poverty rate, with 2 households (100.0%) experiencing poverty. Likewise, among single-mother households, those with 3 or 4 children have the highest poverty rate, with 34 households (68.0%) falling below the poverty line.
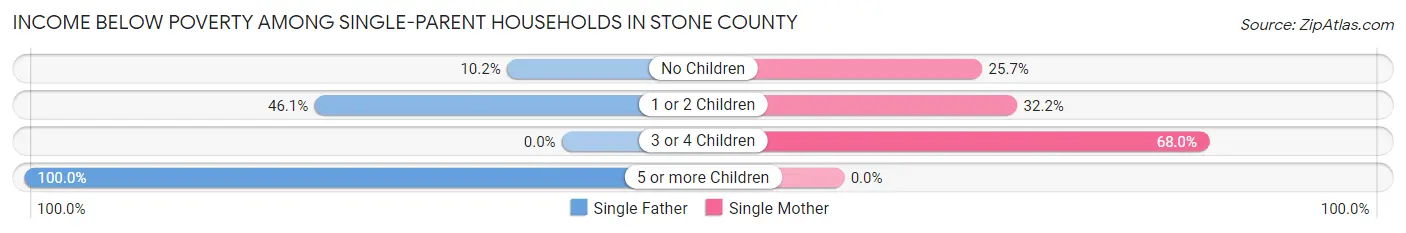
| Children | Single Father | Single Mother |
| No Children | 17 (10.2%) | 129 (25.7%) |
| 1 or 2 Children | 47 (46.1%) | 155 (32.2%) |
| 3 or 4 Children | 0 (0.0%) | 34 (68.0%) |
| 5 or more Children | 2 (100.0%) | 0 (0.0%) |
| Total | 66 (23.9%) | 318 (30.6%) |
Income Below Poverty Among Married-Couple vs Single-Parent Households in Stone County
The poverty data for Stone County shows that 464 of the married-couple family households (6.2%) and 384 of the single-parent households (29.2%) are living below the poverty level. Within the married-couple family households, those with 5 or more children have the highest poverty rate, with 21 households (77.8%) falling below the poverty line. Among the single-parent households, those with 3 or 4 children have the highest poverty rate, with 34 household (60.7%) living below poverty.
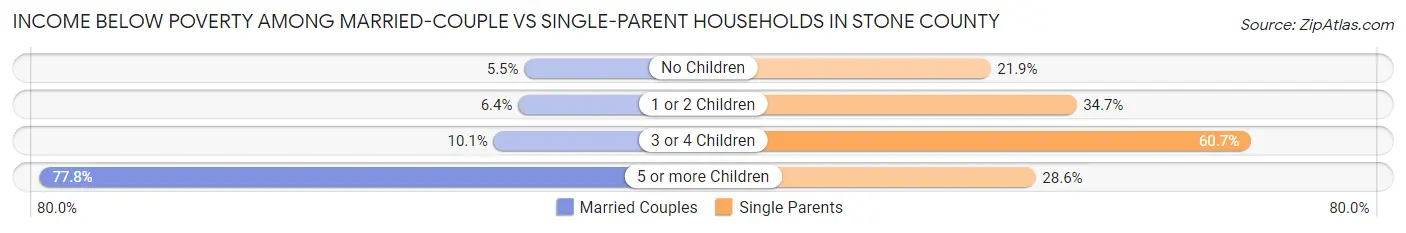
| Children | Married-Couple Families | Single-Parent Households |
| No Children | 312 (5.5%) | 146 (21.9%) |
| 1 or 2 Children | 81 (6.4%) | 202 (34.6%) |
| 3 or 4 Children | 50 (10.1%) | 34 (60.7%) |
| 5 or more Children | 21 (77.8%) | 2 (28.6%) |
| Total | 464 (6.2%) | 384 (29.2%) |
Race in Stone County
The most populous races in Stone County are White / Caucasian (29,795 | 95.2%), Two or more Races (910 | 2.9%), and Hispanic or Latino (789 | 2.5%).
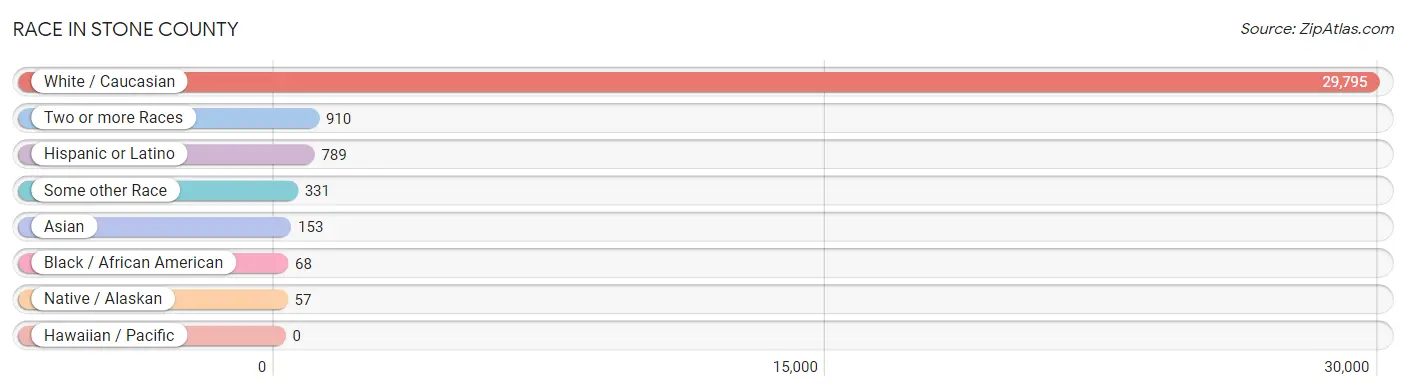
| Race | # Population | % Population |
| Asian | 153 | 0.5% |
| Black / African American | 68 | 0.2% |
| Hawaiian / Pacific | 0 | 0.0% |
| Hispanic or Latino | 789 | 2.5% |
| Native / Alaskan | 57 | 0.2% |
| White / Caucasian | 29,795 | 95.2% |
| Two or more Races | 910 | 2.9% |
| Some other Race | 331 | 1.1% |
| Total | 31,314 | 100.0% |
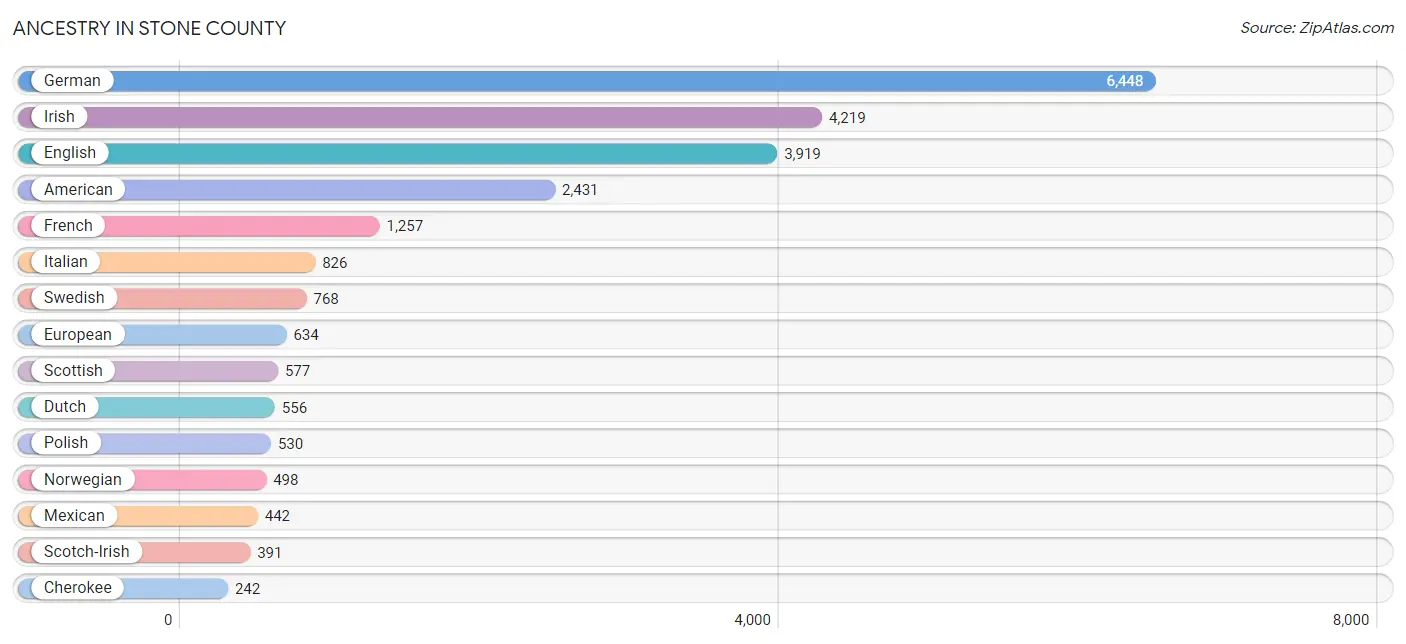
Ancestry in Stone County
The most populous ancestries reported in Stone County are German (6,448 | 20.6%), Irish (4,219 | 13.5%), English (3,919 | 12.5%), American (2,431 | 7.8%), and French (1,257 | 4.0%), together accounting for 58.4% of all Stone County residents.
| Ancestry | # Population | % Population |
| African | 3 | 0.0% |
| American | 2,431 | 7.8% |
| Apache | 12 | 0.0% |
| Arab | 6 | 0.0% |
| Armenian | 49 | 0.2% |
| Austrian | 27 | 0.1% |
| Bhutanese | 7 | 0.0% |
| Blackfeet | 49 | 0.2% |
| British | 167 | 0.5% |
| Burmese | 22 | 0.1% |
| Canadian | 52 | 0.2% |
| Central American | 81 | 0.3% |
| Cherokee | 242 | 0.8% |
| Cree | 2 | 0.0% |
| Croatian | 31 | 0.1% |
| Crow | 20 | 0.1% |
| Cuban | 12 | 0.0% |
| Czech | 213 | 0.7% |
| Czechoslovakian | 4 | 0.0% |
| Danish | 151 | 0.5% |
| Dominican | 42 | 0.1% |
| Dutch | 556 | 1.8% |
| Eastern European | 3 | 0.0% |
| Egyptian | 4 | 0.0% |
| English | 3,919 | 12.5% |
| European | 634 | 2.0% |
| Finnish | 111 | 0.4% |
| French | 1,257 | 4.0% |
| French American Indian | 10 | 0.0% |
| French Canadian | 113 | 0.4% |
| German | 6,448 | 20.6% |
| Greek | 53 | 0.2% |
| Guatemalan | 1 | 0.0% |
| Hungarian | 40 | 0.1% |
| Indian (Asian) | 106 | 0.3% |
| Indonesian | 43 | 0.1% |
| Irish | 4,219 | 13.5% |
| Iroquois | 17 | 0.1% |
| Italian | 826 | 2.6% |
| Kiowa | 14 | 0.0% |
| Korean | 5 | 0.0% |
| Laotian | 5 | 0.0% |
| Lebanese | 2 | 0.0% |
| Lithuanian | 59 | 0.2% |
| Lumbee | 12 | 0.0% |
| Mexican | 442 | 1.4% |
| Navajo | 8 | 0.0% |
| Northern European | 13 | 0.0% |
| Norwegian | 498 | 1.6% |
| Osage | 38 | 0.1% |
| Pennsylvania German | 2 | 0.0% |
| Polish | 530 | 1.7% |
| Portuguese | 205 | 0.6% |
| Puerto Rican | 20 | 0.1% |
| Russian | 98 | 0.3% |
| Salvadoran | 80 | 0.3% |
| Scandinavian | 75 | 0.2% |
| Scotch-Irish | 391 | 1.3% |
| Scottish | 577 | 1.8% |
| Sioux | 46 | 0.2% |
| Slavic | 2 | 0.0% |
| Slovak | 50 | 0.2% |
| Spaniard | 149 | 0.5% |
| Sri Lankan | 2 | 0.0% |
| Subsaharan African | 3 | 0.0% |
| Swedish | 768 | 2.5% |
| Swiss | 80 | 0.3% |
| Thai | 46 | 0.2% |
| Welsh | 136 | 0.4% |
| Yugoslavian | 2 | 0.0% | View All 70 Rows |
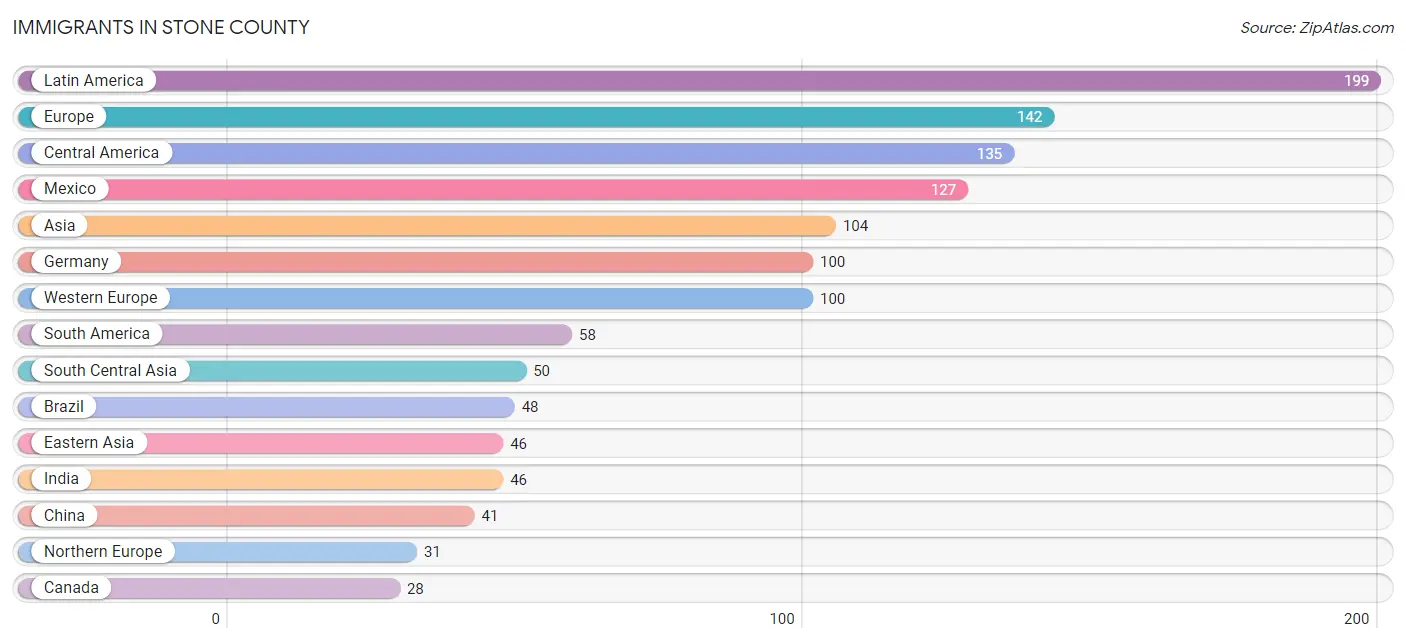
Immigrants in Stone County
The most numerous immigrant groups reported in Stone County came from Latin America (199 | 0.6%), Europe (142 | 0.4%), Central America (135 | 0.4%), Mexico (127 | 0.4%), and Asia (104 | 0.3%), together accounting for 2.3% of all Stone County residents.
| Immigration Origin | # Population | % Population |
| Asia | 104 | 0.3% |
| Brazil | 48 | 0.2% |
| Canada | 28 | 0.1% |
| Caribbean | 6 | 0.0% |
| Central America | 135 | 0.4% |
| China | 41 | 0.1% |
| Colombia | 10 | 0.0% |
| Croatia | 2 | 0.0% |
| Eastern Asia | 46 | 0.2% |
| Eastern Europe | 11 | 0.0% |
| El Salvador | 7 | 0.0% |
| England | 20 | 0.1% |
| Europe | 142 | 0.4% |
| Germany | 100 | 0.3% |
| Guatemala | 1 | 0.0% |
| India | 46 | 0.2% |
| Indonesia | 5 | 0.0% |
| Ireland | 2 | 0.0% |
| Korea | 5 | 0.0% |
| Latin America | 199 | 0.6% |
| Mexico | 127 | 0.4% |
| Northern Europe | 31 | 0.1% |
| Philippines | 3 | 0.0% |
| Russia | 2 | 0.0% |
| South America | 58 | 0.2% |
| South Central Asia | 50 | 0.2% |
| South Eastern Asia | 8 | 0.0% |
| Sri Lanka | 4 | 0.0% |
| Trinidad and Tobago | 6 | 0.0% |
| Western Europe | 100 | 0.3% | View All 30 Rows |
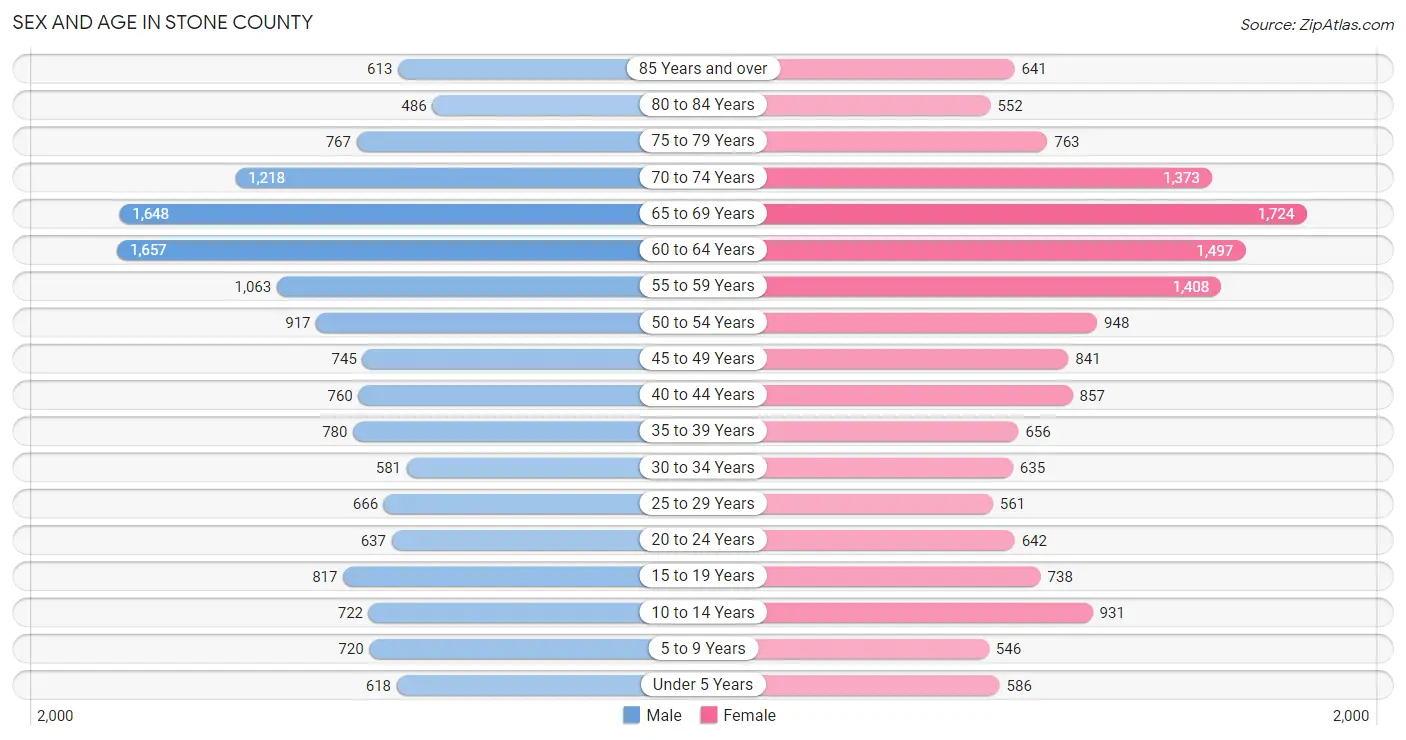
Sex and Age in Stone County
Sex and Age in Stone County
The most populous age groups in Stone County are 60 to 64 Years (1,657 | 10.7%) for men and 65 to 69 Years (1,724 | 10.8%) for women.
| Age Bracket | Male | Female |
| Under 5 Years | 618 (4.0%) | 586 (3.7%) |
| 5 to 9 Years | 720 (4.7%) | 546 (3.4%) |
| 10 to 14 Years | 722 (4.7%) | 931 (5.9%) |
| 15 to 19 Years | 817 (5.3%) | 738 (4.6%) |
| 20 to 24 Years | 637 (4.1%) | 642 (4.0%) |
| 25 to 29 Years | 666 (4.3%) | 561 (3.5%) |
| 30 to 34 Years | 581 (3.8%) | 635 (4.0%) |
| 35 to 39 Years | 780 (5.1%) | 656 (4.1%) |
| 40 to 44 Years | 760 (4.9%) | 857 (5.4%) |
| 45 to 49 Years | 745 (4.8%) | 841 (5.3%) |
| 50 to 54 Years | 917 (5.9%) | 948 (6.0%) |
| 55 to 59 Years | 1,063 (6.9%) | 1,408 (8.9%) |
| 60 to 64 Years | 1,657 (10.7%) | 1,497 (9.4%) |
| 65 to 69 Years | 1,648 (10.7%) | 1,724 (10.8%) |
| 70 to 74 Years | 1,218 (7.9%) | 1,373 (8.6%) |
| 75 to 79 Years | 767 (5.0%) | 763 (4.8%) |
| 80 to 84 Years | 486 (3.2%) | 552 (3.5%) |
| 85 Years and over | 613 (4.0%) | 641 (4.0%) |
| Total | 15,415 (100.0%) | 15,899 (100.0%) |
Families and Households in Stone County
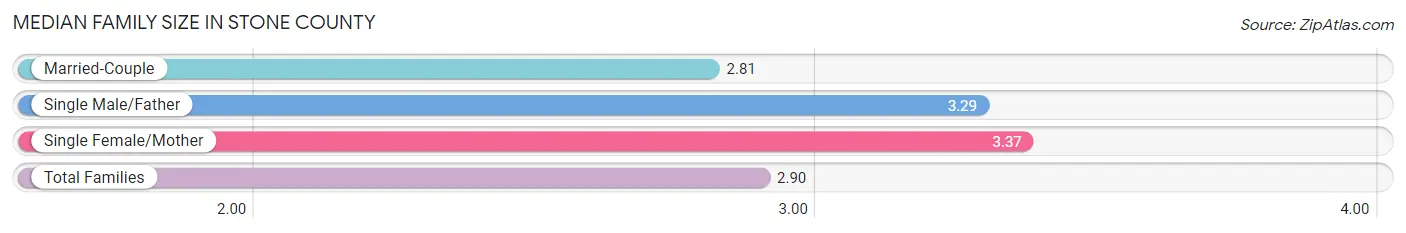
Median Family Size in Stone County
The median family size in Stone County is 2.90 persons per family, with single female/mother families (1,038 | 11.9%) accounting for the largest median family size of 3.37 persons per family. On the other hand, married-couple families (7,427 | 85.0%) represent the smallest median family size with 2.81 persons per family.
| Family Type | # Families | Family Size |
| Married-Couple | 7,427 (85.0%) | 2.81 |
| Single Male/Father | 276 (3.2%) | 3.29 |
| Single Female/Mother | 1,038 (11.9%) | 3.37 |
| Total Families | 8,741 (100.0%) | 2.90 |
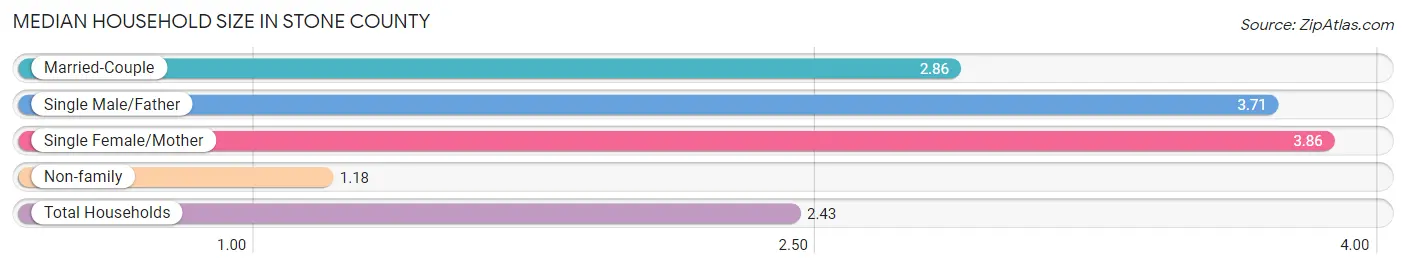
Median Household Size in Stone County
The median household size in Stone County is 2.43 persons per household, with single female/mother households (1,038 | 8.2%) accounting for the largest median household size of 3.86 persons per household. non-family households (3,985 | 31.3%) represent the smallest median household size with 1.18 persons per household.
| Household Type | # Households | Household Size |
| Married-Couple | 7,427 (58.4%) | 2.86 |
| Single Male/Father | 276 (2.2%) | 3.71 |
| Single Female/Mother | 1,038 (8.2%) | 3.86 |
| Non-family | 3,985 (31.3%) | 1.18 |
| Total Households | 12,726 (100.0%) | 2.43 |
Household Size by Marriage Status in Stone County
Out of a total of 12,726 households in Stone County, 8,741 (68.7%) are family households, while 3,985 (31.3%) are nonfamily households. The most numerous type of family households are 2-person households, comprising 5,469, and the most common type of nonfamily households are 1-person households, comprising 3,442.
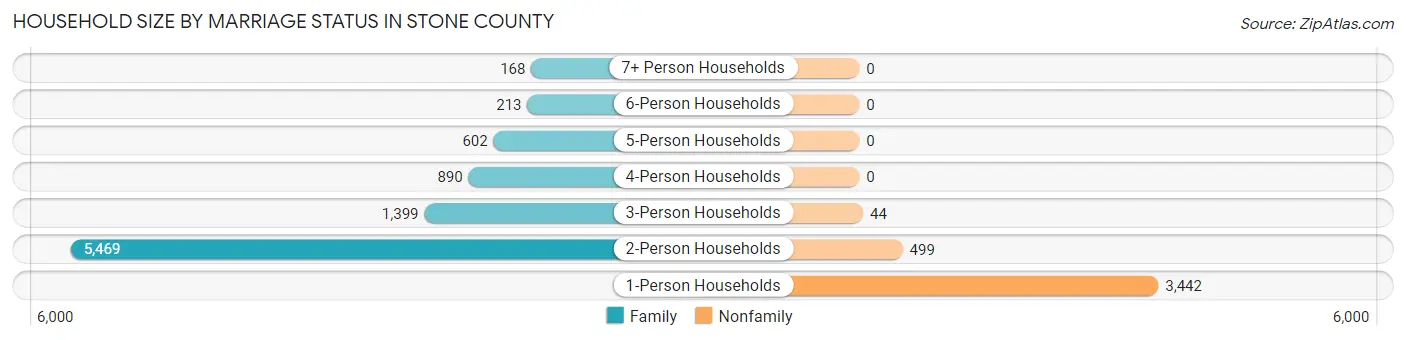
| Household Size | Family Households | Nonfamily Households |
| 1-Person Households | - | 3,442 (27.1%) |
| 2-Person Households | 5,469 (43.0%) | 499 (3.9%) |
| 3-Person Households | 1,399 (11.0%) | 44 (0.4%) |
| 4-Person Households | 890 (7.0%) | 0 (0.0%) |
| 5-Person Households | 602 (4.7%) | 0 (0.0%) |
| 6-Person Households | 213 (1.7%) | 0 (0.0%) |
| 7+ Person Households | 168 (1.3%) | 0 (0.0%) |
| Total | 8,741 (68.7%) | 3,985 (31.3%) |
Female Fertility in Stone County
Fertility by Age in Stone County
Average fertility rate in Stone County is 53.0 births per 1,000 women. Women in the age bracket of 20 to 34 years have the highest fertility rate with 125.0 births per 1,000 women. Women in the age bracket of 20 to 34 years acount for 85.8% of all women with births.
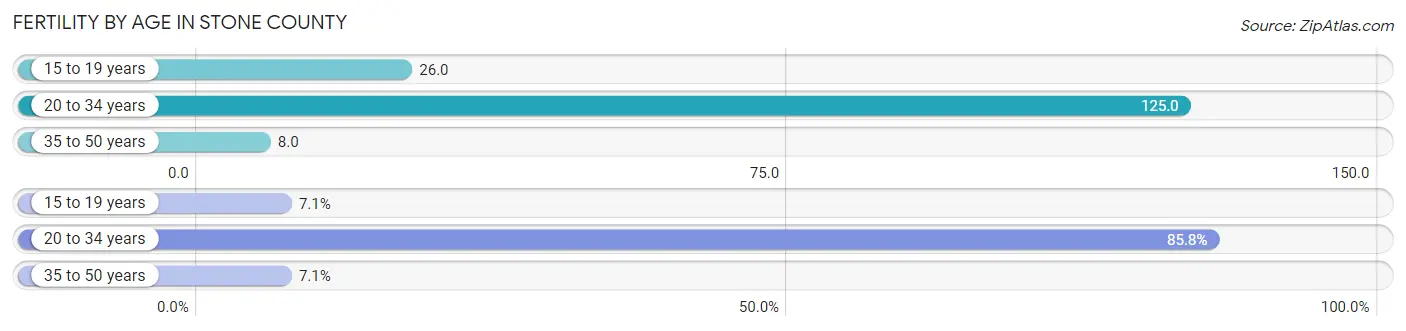
| Age Bracket | Women with Births | Births / 1,000 Women |
| 15 to 19 years | 19 (7.1%) | 26.0 |
| 20 to 34 years | 229 (85.8%) | 125.0 |
| 35 to 50 years | 19 (7.1%) | 8.0 |
| Total | 267 (100.0%) | 53.0 |
Fertility by Age by Marriage Status in Stone County
61.0% of women with births (267) in Stone County are married. The highest percentage of unmarried women with births falls into 15 to 19 years age bracket with 100.0% of them unmarried at the time of birth, while the lowest percentage of unmarried women with births belong to 35 to 50 years age bracket with 0.0% of them unmarried.
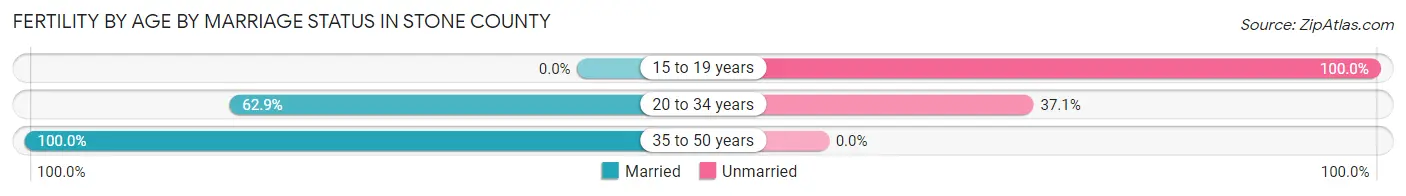
| Age Bracket | Married | Unmarried |
| 15 to 19 years | 0 (0.0%) | 19 (100.0%) |
| 20 to 34 years | 144 (62.9%) | 85 (37.1%) |
| 35 to 50 years | 19 (100.0%) | 0 (0.0%) |
| Total | 163 (61.1%) | 104 (39.0%) |
Fertility by Education in Stone County
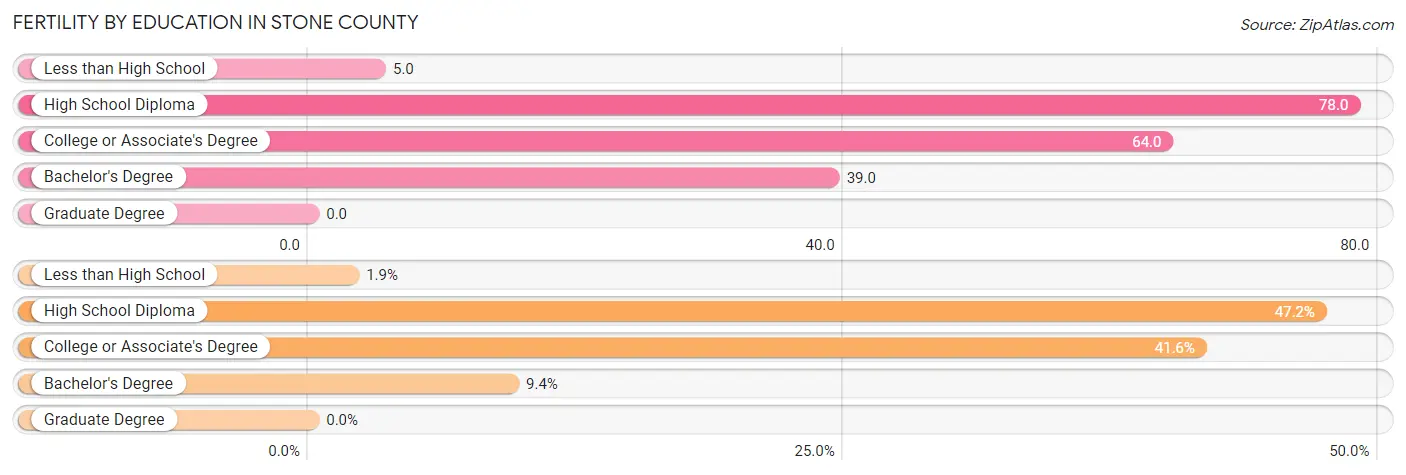
| Educational Attainment | Women with Births | Births / 1,000 Women |
| Less than High School | 5 (1.9%) | 5.0 |
| High School Diploma | 126 (47.2%) | 78.0 |
| College or Associate's Degree | 111 (41.6%) | 64.0 |
| Bachelor's Degree | 25 (9.4%) | 39.0 |
| Graduate Degree | 0 (0.0%) | 0.0 |
| Total | 267 (100.0%) | 53.0 |
Fertility by Education by Marriage Status in Stone County
39.0% of women with births in Stone County are unmarried. Women with the educational attainment of bachelor's degree are most likely to be married with 100.0% of them married at childbirth, while women with the educational attainment of less than high school are least likely to be married with 100.0% of them unmarried at childbirth.
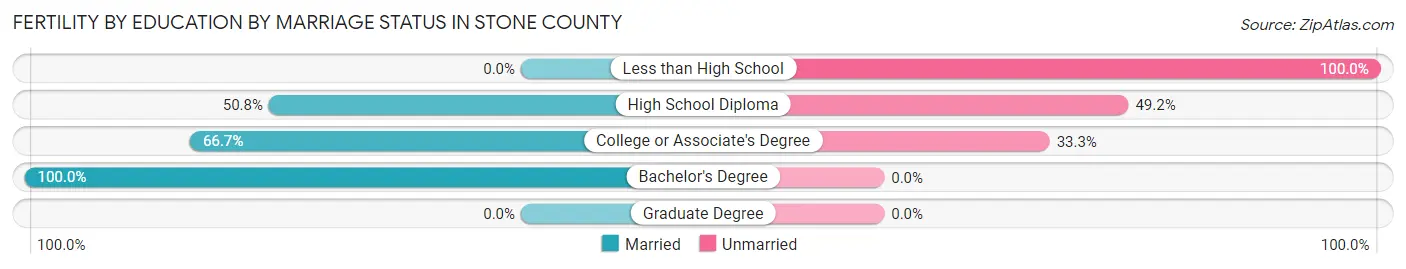
| Educational Attainment | Married | Unmarried |
| Less than High School | 0 (0.0%) | 5 (100.0%) |
| High School Diploma | 64 (50.8%) | 62 (49.2%) |
| College or Associate's Degree | 74 (66.7%) | 37 (33.3%) |
| Bachelor's Degree | 25 (100.0%) | 0 (0.0%) |
| Graduate Degree | 0 (0.0%) | 0 (0.0%) |
| Total | 163 (61.1%) | 104 (39.0%) |
Employment Characteristics in Stone County
Employment by Class of Employer in Stone County
Among the 11,736 employed individuals in Stone County, private company employees (7,778 | 66.3%), local government employees (1,160 | 9.9%), and self-employed (not incorporated) (1,012 | 8.6%) make up the most common classes of employment.
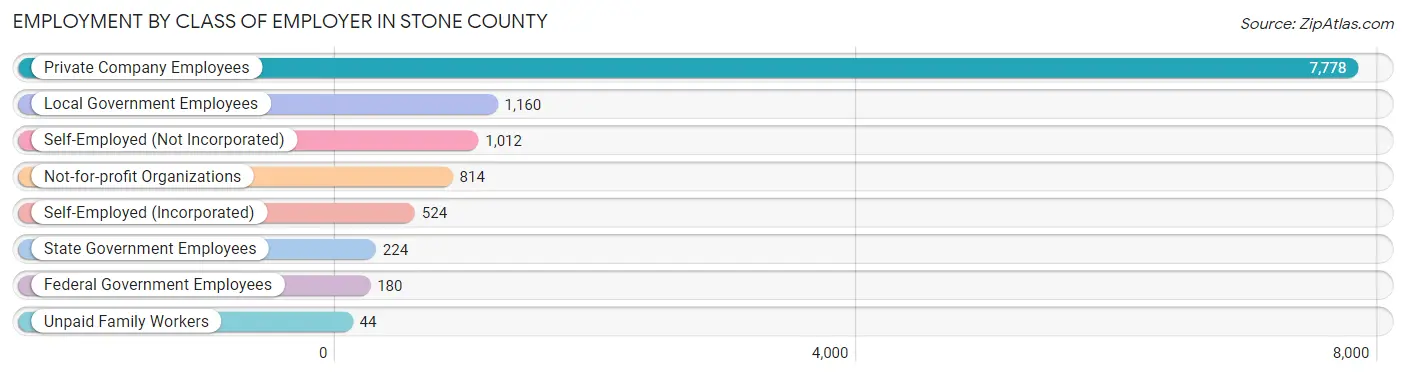
| Employer Class | # Employees | % Employees |
| Private Company Employees | 7,778 | 66.3% |
| Self-Employed (Incorporated) | 524 | 4.5% |
| Self-Employed (Not Incorporated) | 1,012 | 8.6% |
| Not-for-profit Organizations | 814 | 6.9% |
| Local Government Employees | 1,160 | 9.9% |
| State Government Employees | 224 | 1.9% |
| Federal Government Employees | 180 | 1.5% |
| Unpaid Family Workers | 44 | 0.4% |
| Total | 11,736 | 100.0% |
Employment Status by Age in Stone County
According to the labor force statistics for Stone County, out of the total population over 16 years of age (26,909), 48.7% or 13,105 individuals are in the labor force, with 8.4% or 1,101 of them unemployed. The age group with the highest labor force participation rate is 20 to 24 years, with 92.5% or 1,183 individuals in the labor force. Within the labor force, the 16 to 19 years age range has the highest percentage of unemployed individuals, with 21.3% or 114 of them being unemployed.
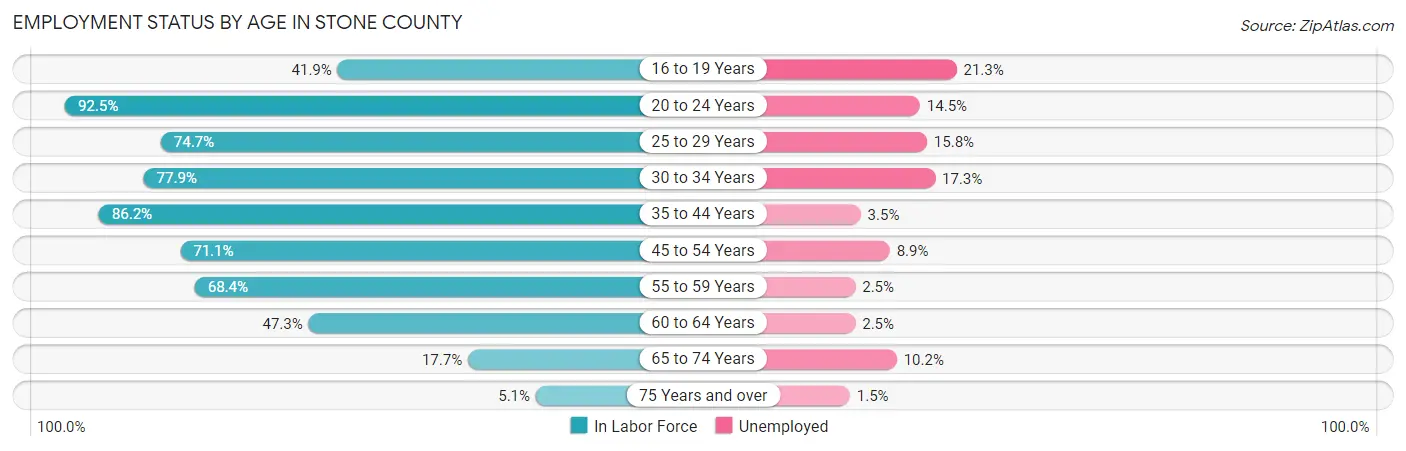
| Age Bracket | In Labor Force | Unemployed |
| 16 to 19 Years | 533 (41.9%) | 114 (21.3%) |
| 20 to 24 Years | 1,183 (92.5%) | 172 (14.5%) |
| 25 to 29 Years | 917 (74.7%) | 145 (15.8%) |
| 30 to 34 Years | 947 (77.9%) | 164 (17.3%) |
| 35 to 44 Years | 2,632 (86.2%) | 92 (3.5%) |
| 45 to 54 Years | 2,454 (71.1%) | 218 (8.9%) |
| 55 to 59 Years | 1,690 (68.4%) | 42 (2.5%) |
| 60 to 64 Years | 1,492 (47.3%) | 37 (2.5%) |
| 65 to 74 Years | 1,055 (17.7%) | 108 (10.2%) |
| 75 Years and over | 195 (5.1%) | 3 (1.5%) |
| Total | 13,105 (48.7%) | 1,101 (8.4%) |
Employment Status by Educational Attainment in Stone County
According to labor force statistics for Stone County, 69.5% of individuals (10,128) out of the total population between 25 and 64 years of age (14,572) are in the labor force, with 6.9% or 699 of them being unemployed. The group with the highest labor force participation rate are those with the educational attainment of college / associate degree, with 75.2% or 3,807 individuals in the labor force. Within the labor force, individuals with less than high school education have the highest percentage of unemployment, with 9.6% or 70 of them being unemployed.
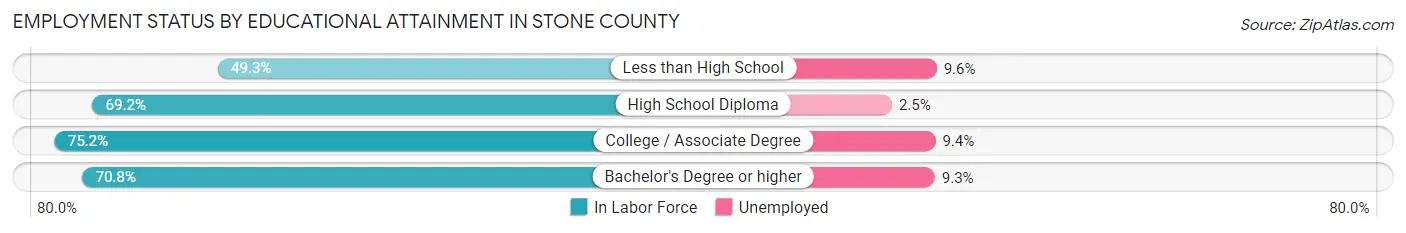
| Educational Attainment | In Labor Force | Unemployed |
| Less than High School | 731 (49.3%) | 142 (9.6%) |
| High School Diploma | 3,669 (69.2%) | 133 (2.5%) |
| College / Associate Degree | 3,807 (75.2%) | 476 (9.4%) |
| Bachelor's Degree or higher | 1,930 (70.8%) | 254 (9.3%) |
| Total | 10,128 (69.5%) | 1,005 (6.9%) |
Employment Occupations by Sex in Stone County
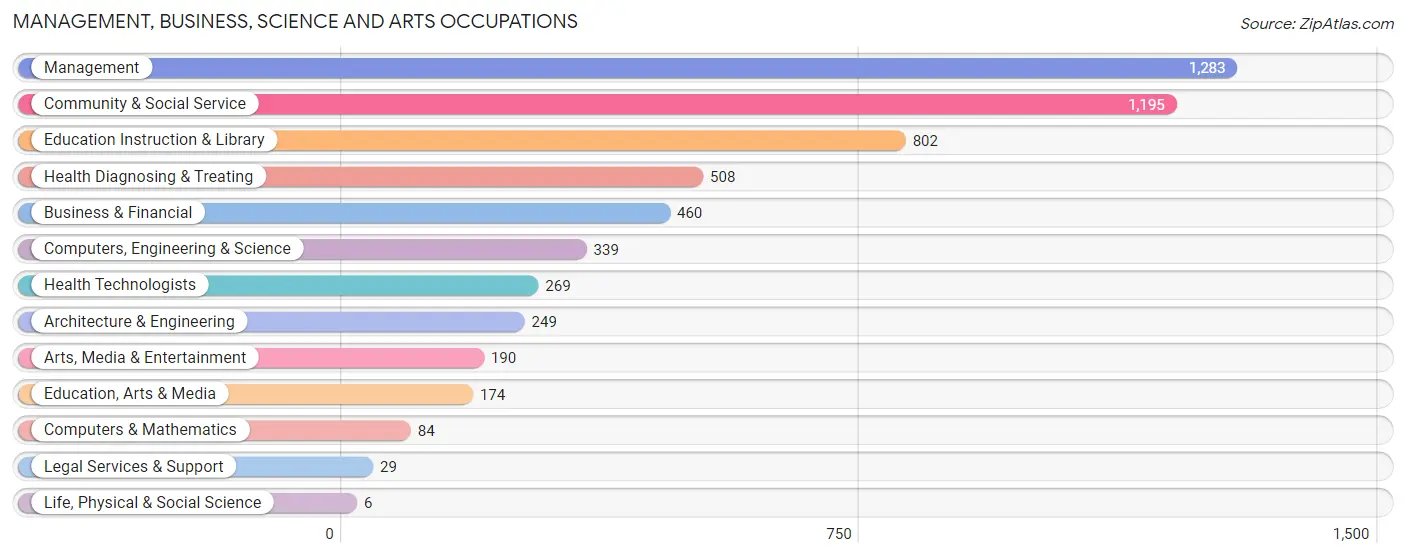
Management, Business, Science and Arts Occupations
The most common Management, Business, Science and Arts occupations in Stone County are Management (1,283 | 10.7%), Community & Social Service (1,195 | 10.0%), Education Instruction & Library (802 | 6.7%), Health Diagnosing & Treating (508 | 4.2%), and Business & Financial (460 | 3.8%).
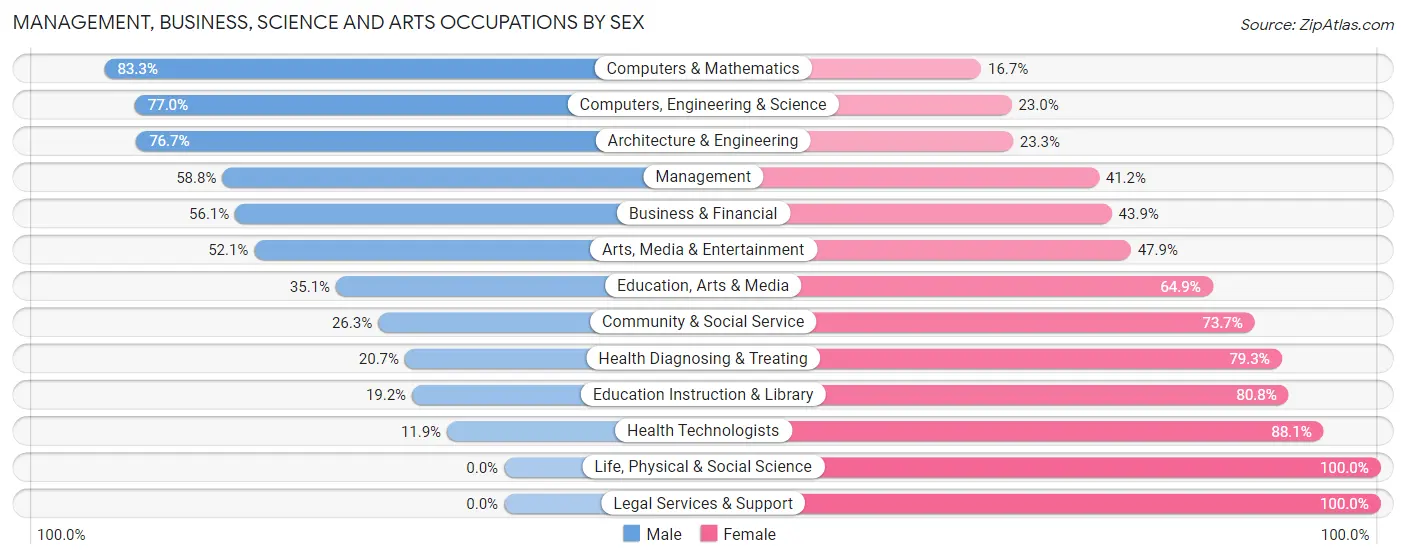
Management, Business, Science and Arts Occupations by Sex
Within the Management, Business, Science and Arts occupations in Stone County, the most male-oriented occupations are Computers & Mathematics (83.3%), Computers, Engineering & Science (77.0%), and Architecture & Engineering (76.7%), while the most female-oriented occupations are Life, Physical & Social Science (100.0%), Legal Services & Support (100.0%), and Health Technologists (88.1%).
| Occupation | Male | Female |
| Management | 754 (58.8%) | 529 (41.2%) |
| Business & Financial | 258 (56.1%) | 202 (43.9%) |
| Computers, Engineering & Science | 261 (77.0%) | 78 (23.0%) |
| Computers & Mathematics | 70 (83.3%) | 14 (16.7%) |
| Architecture & Engineering | 191 (76.7%) | 58 (23.3%) |
| Life, Physical & Social Science | 0 (0.0%) | 6 (100.0%) |
| Community & Social Service | 314 (26.3%) | 881 (73.7%) |
| Education, Arts & Media | 61 (35.1%) | 113 (64.9%) |
| Legal Services & Support | 0 (0.0%) | 29 (100.0%) |
| Education Instruction & Library | 154 (19.2%) | 648 (80.8%) |
| Arts, Media & Entertainment | 99 (52.1%) | 91 (47.9%) |
| Health Diagnosing & Treating | 105 (20.7%) | 403 (79.3%) |
| Health Technologists | 32 (11.9%) | 237 (88.1%) |
| Total (Category) | 1,692 (44.7%) | 2,093 (55.3%) |
| Total (Overall) | 6,029 (50.2%) | 5,974 (49.8%) |
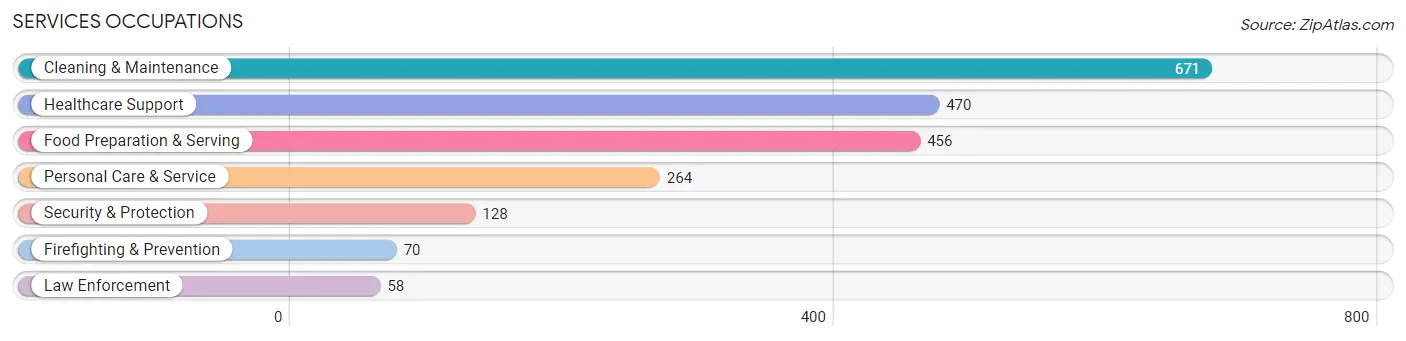
Services Occupations
The most common Services occupations in Stone County are Cleaning & Maintenance (671 | 5.6%), Healthcare Support (470 | 3.9%), Food Preparation & Serving (456 | 3.8%), Personal Care & Service (264 | 2.2%), and Security & Protection (128 | 1.1%).
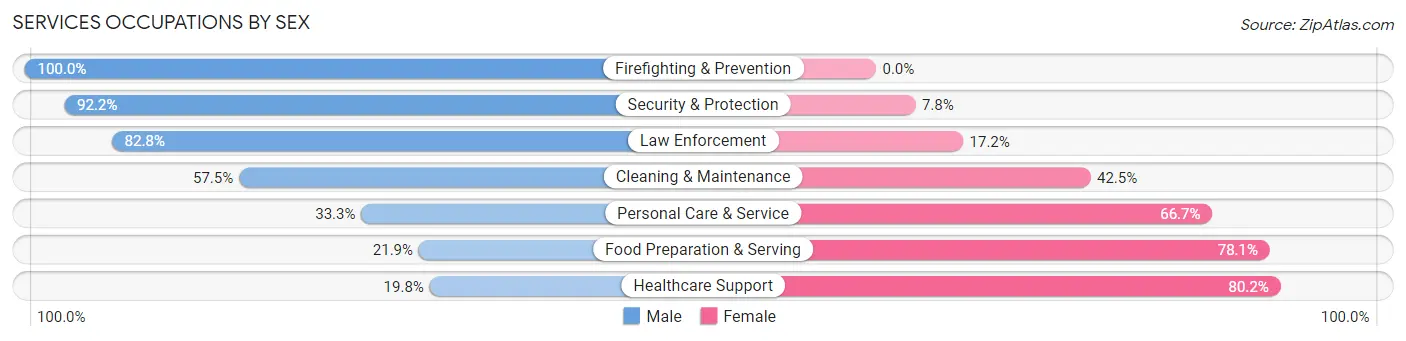
Services Occupations by Sex
Within the Services occupations in Stone County, the most male-oriented occupations are Firefighting & Prevention (100.0%), Security & Protection (92.2%), and Law Enforcement (82.8%), while the most female-oriented occupations are Healthcare Support (80.2%), Food Preparation & Serving (78.1%), and Personal Care & Service (66.7%).
| Occupation | Male | Female |
| Healthcare Support | 93 (19.8%) | 377 (80.2%) |
| Security & Protection | 118 (92.2%) | 10 (7.8%) |
| Firefighting & Prevention | 70 (100.0%) | 0 (0.0%) |
| Law Enforcement | 48 (82.8%) | 10 (17.2%) |
| Food Preparation & Serving | 100 (21.9%) | 356 (78.1%) |
| Cleaning & Maintenance | 386 (57.5%) | 285 (42.5%) |
| Personal Care & Service | 88 (33.3%) | 176 (66.7%) |
| Total (Category) | 785 (39.5%) | 1,204 (60.5%) |
| Total (Overall) | 6,029 (50.2%) | 5,974 (49.8%) |
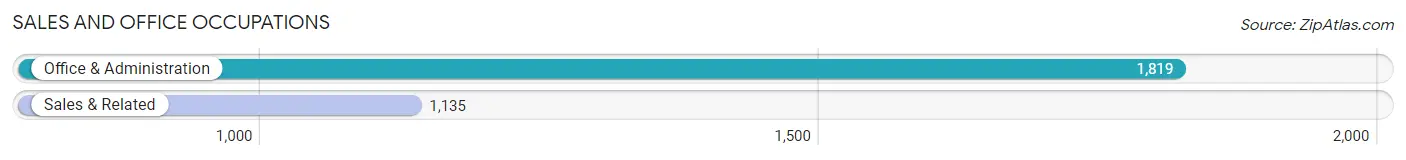
Sales and Office Occupations
The most common Sales and Office occupations in Stone County are Office & Administration (1,819 | 15.1%), and Sales & Related (1,135 | 9.5%).
Sales and Office Occupations by Sex
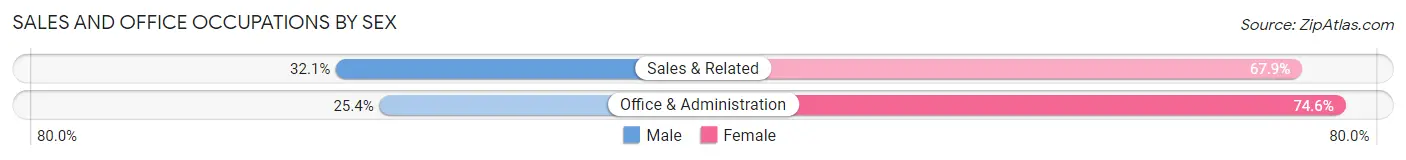
| Occupation | Male | Female |
| Sales & Related | 364 (32.1%) | 771 (67.9%) |
| Office & Administration | 462 (25.4%) | 1,357 (74.6%) |
| Total (Category) | 826 (28.0%) | 2,128 (72.0%) |
| Total (Overall) | 6,029 (50.2%) | 5,974 (49.8%) |
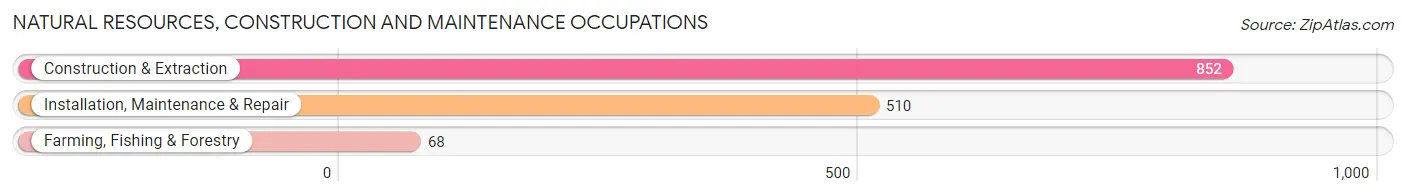
Natural Resources, Construction and Maintenance Occupations
The most common Natural Resources, Construction and Maintenance occupations in Stone County are Construction & Extraction (852 | 7.1%), Installation, Maintenance & Repair (510 | 4.3%), and Farming, Fishing & Forestry (68 | 0.6%).
Natural Resources, Construction and Maintenance Occupations by Sex
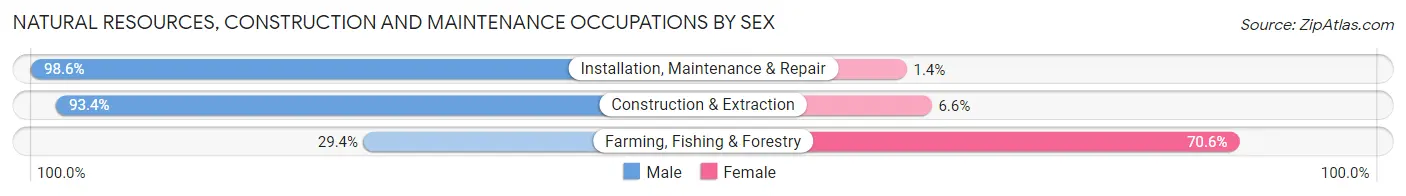
| Occupation | Male | Female |
| Farming, Fishing & Forestry | 20 (29.4%) | 48 (70.6%) |
| Construction & Extraction | 796 (93.4%) | 56 (6.6%) |
| Installation, Maintenance & Repair | 503 (98.6%) | 7 (1.4%) |
| Total (Category) | 1,319 (92.2%) | 111 (7.8%) |
| Total (Overall) | 6,029 (50.2%) | 5,974 (49.8%) |
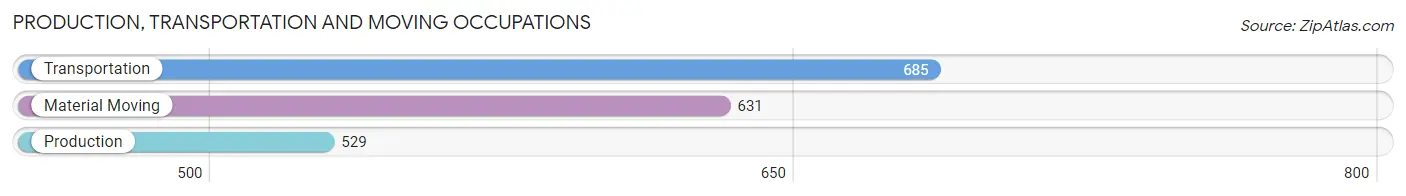
Production, Transportation and Moving Occupations
The most common Production, Transportation and Moving occupations in Stone County are Transportation (685 | 5.7%), Material Moving (631 | 5.3%), and Production (529 | 4.4%).
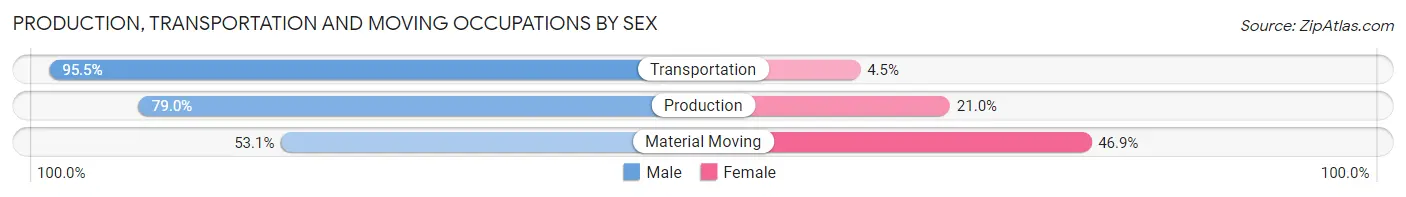
Production, Transportation and Moving Occupations by Sex
| Occupation | Male | Female |
| Production | 418 (79.0%) | 111 (21.0%) |
| Transportation | 654 (95.5%) | 31 (4.5%) |
| Material Moving | 335 (53.1%) | 296 (46.9%) |
| Total (Category) | 1,407 (76.3%) | 438 (23.7%) |
| Total (Overall) | 6,029 (50.2%) | 5,974 (49.8%) |
Employment Industries by Sex in Stone County
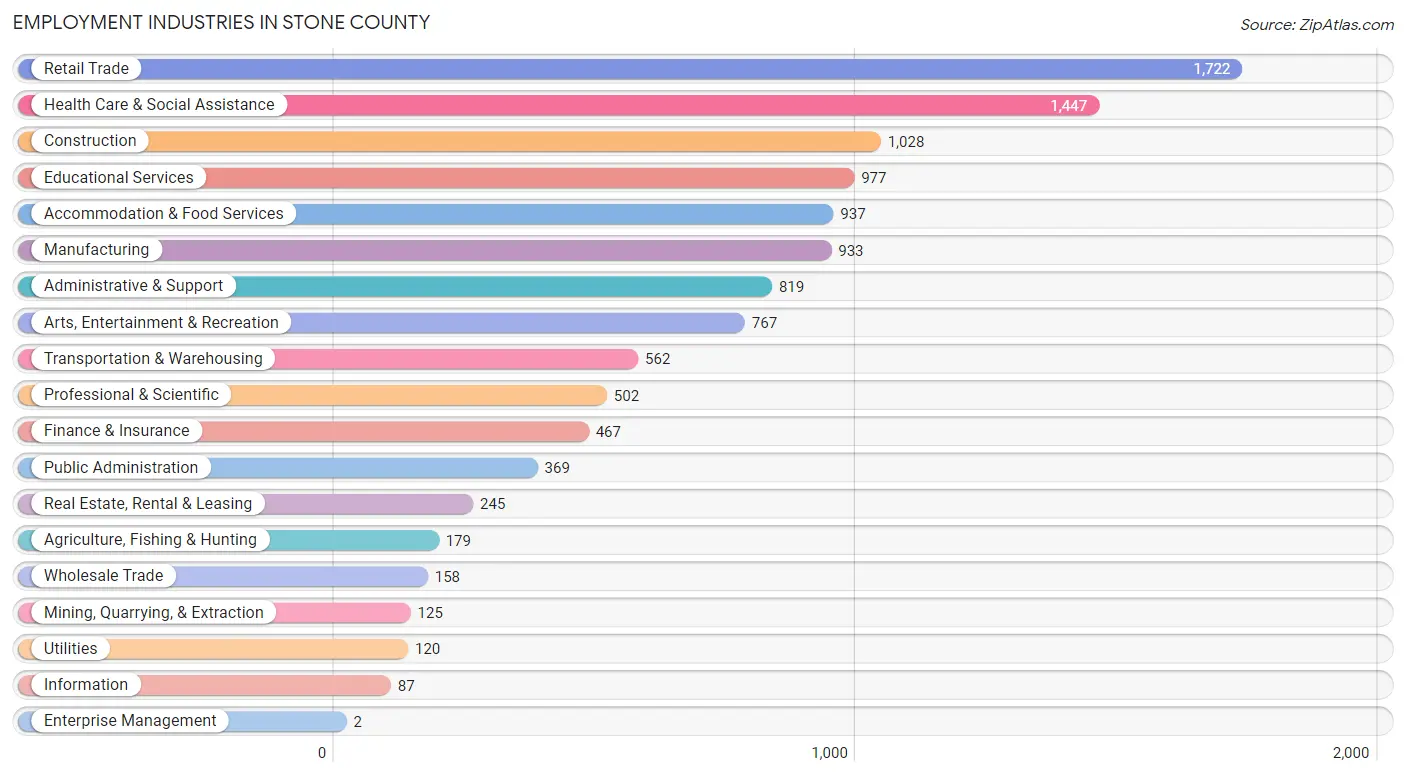
Employment Industries in Stone County
The major employment industries in Stone County include Retail Trade (1,722 | 14.3%), Health Care & Social Assistance (1,447 | 12.1%), Construction (1,028 | 8.6%), Educational Services (977 | 8.1%), and Accommodation & Food Services (937 | 7.8%).
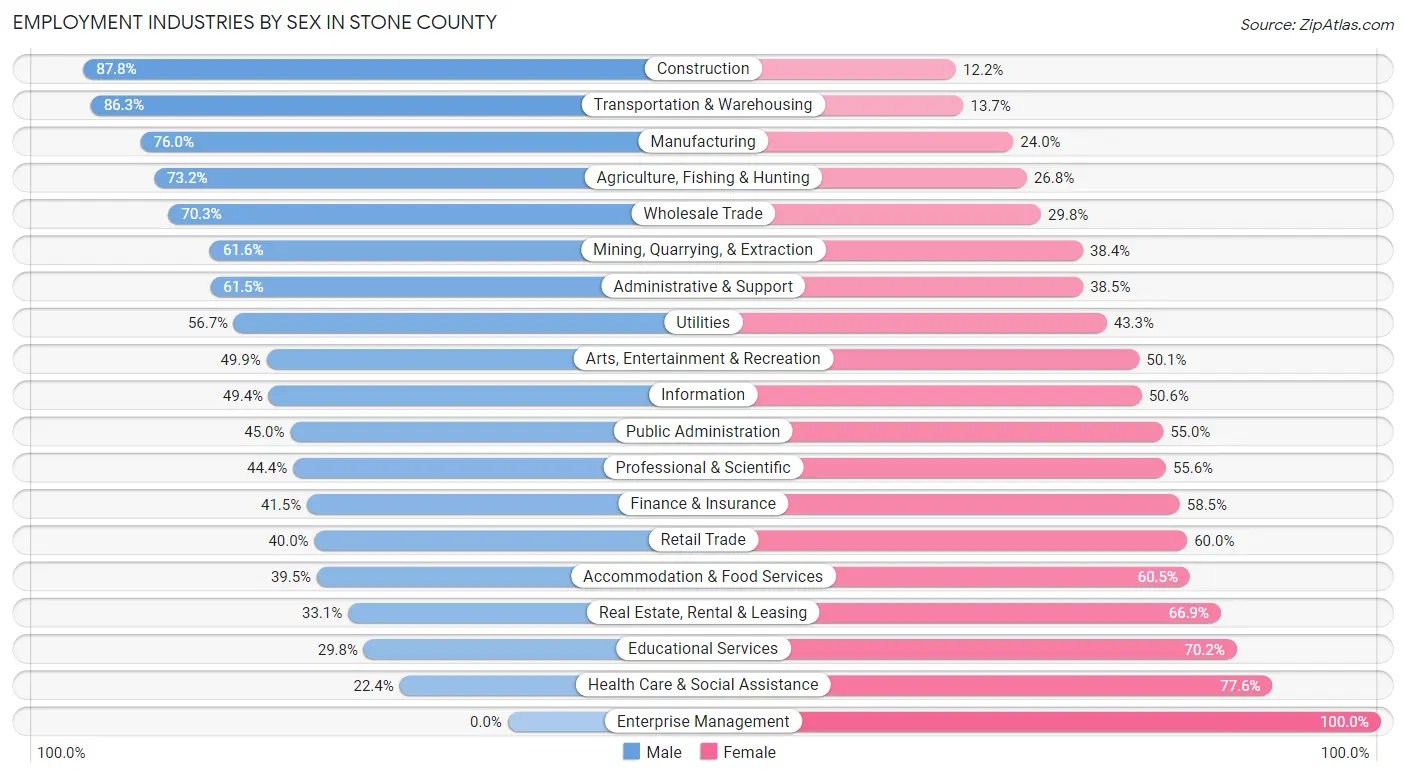
Employment Industries by Sex in Stone County
The Stone County industries that see more men than women are Construction (87.8%), Transportation & Warehousing (86.3%), and Manufacturing (76.0%), whereas the industries that tend to have a higher number of women are Enterprise Management (100.0%), Health Care & Social Assistance (77.6%), and Educational Services (70.2%).
| Industry | Male | Female |
| Agriculture, Fishing & Hunting | 131 (73.2%) | 48 (26.8%) |
| Mining, Quarrying, & Extraction | 77 (61.6%) | 48 (38.4%) |
| Construction | 903 (87.8%) | 125 (12.2%) |
| Manufacturing | 709 (76.0%) | 224 (24.0%) |
| Wholesale Trade | 111 (70.3%) | 47 (29.7%) |
| Retail Trade | 689 (40.0%) | 1,033 (60.0%) |
| Transportation & Warehousing | 485 (86.3%) | 77 (13.7%) |
| Utilities | 68 (56.7%) | 52 (43.3%) |
| Information | 43 (49.4%) | 44 (50.6%) |
| Finance & Insurance | 194 (41.5%) | 273 (58.5%) |
| Real Estate, Rental & Leasing | 81 (33.1%) | 164 (66.9%) |
| Professional & Scientific | 223 (44.4%) | 279 (55.6%) |
| Enterprise Management | 0 (0.0%) | 2 (100.0%) |
| Administrative & Support | 504 (61.5%) | 315 (38.5%) |
| Educational Services | 291 (29.8%) | 686 (70.2%) |
| Health Care & Social Assistance | 324 (22.4%) | 1,123 (77.6%) |
| Arts, Entertainment & Recreation | 383 (49.9%) | 384 (50.1%) |
| Accommodation & Food Services | 370 (39.5%) | 567 (60.5%) |
| Public Administration | 166 (45.0%) | 203 (55.0%) |
| Total | 6,029 (50.2%) | 5,974 (49.8%) |
Education in Stone County
School Enrollment in Stone County
The most common levels of schooling among the 5,052 students in Stone County are high school (1,344 | 26.6%), middle school (1,334 | 26.4%), and elementary school (1,001 | 19.8%).
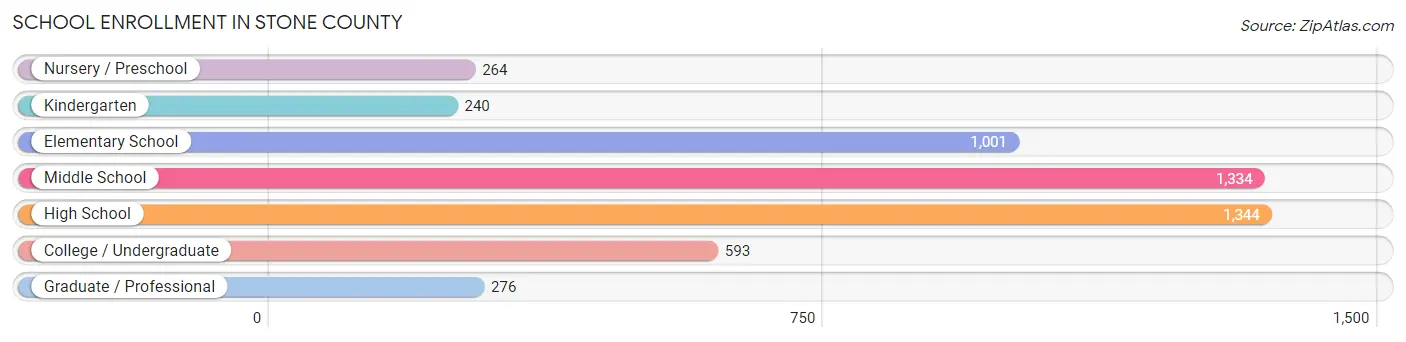
| School Level | # Students | % Students |
| Nursery / Preschool | 264 | 5.2% |
| Kindergarten | 240 | 4.8% |
| Elementary School | 1,001 | 19.8% |
| Middle School | 1,334 | 26.4% |
| High School | 1,344 | 26.6% |
| College / Undergraduate | 593 | 11.7% |
| Graduate / Professional | 276 | 5.5% |
| Total | 5,052 | 100.0% |
School Enrollment by Age by Funding Source in Stone County
Out of a total of 5,052 students who are enrolled in schools in Stone County, 763 (15.1%) attend a private institution, while the remaining 4,289 (84.9%) are enrolled in public schools. The age group of 25 to 34 year olds has the highest likelihood of being enrolled in private schools, with 141 (61.0% in the age bracket) enrolled. Conversely, the age group of 15 to 17 year olds has the lowest likelihood of being enrolled in a private school, with 933 (95.1% in the age bracket) attending a public institution.
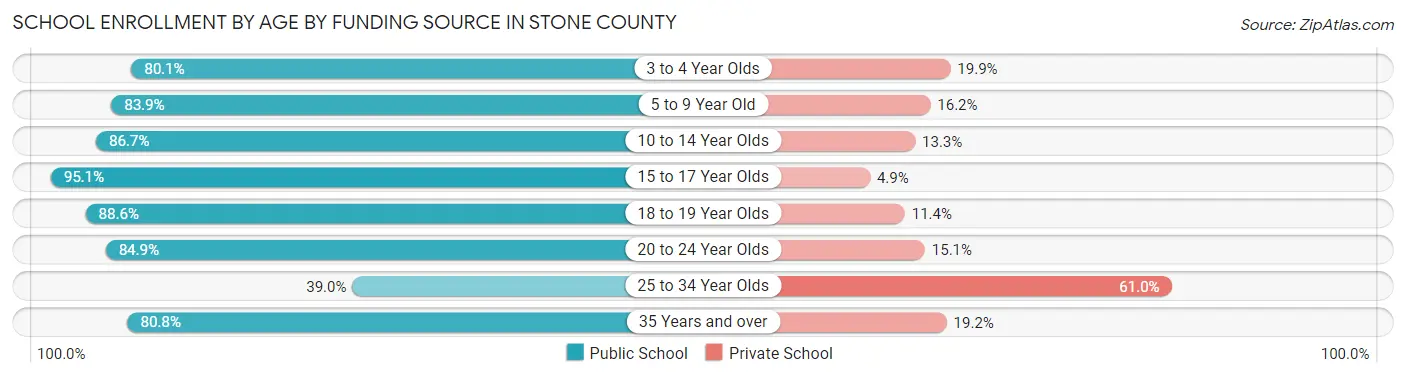
| Age Bracket | Public School | Private School |
| 3 to 4 Year Olds | 137 (80.1%) | 34 (19.9%) |
| 5 to 9 Year Old | 1,007 (83.9%) | 194 (16.2%) |
| 10 to 14 Year Olds | 1,433 (86.7%) | 220 (13.3%) |
| 15 to 17 Year Olds | 933 (95.1%) | 48 (4.9%) |
| 18 to 19 Year Olds | 288 (88.6%) | 37 (11.4%) |
| 20 to 24 Year Olds | 146 (84.9%) | 26 (15.1%) |
| 25 to 34 Year Olds | 90 (39.0%) | 141 (61.0%) |
| 35 Years and over | 257 (80.8%) | 61 (19.2%) |
| Total | 4,289 (84.9%) | 763 (15.1%) |
Educational Attainment by Field of Study in Stone County
Business (1,247 | 23.2%), education (1,206 | 22.4%), science & technology (439 | 8.2%), bio, nature & agricultural (365 | 6.8%), and engineering (335 | 6.2%) are the most common fields of study among 5,378 individuals in Stone County who have obtained a bachelor's degree or higher.
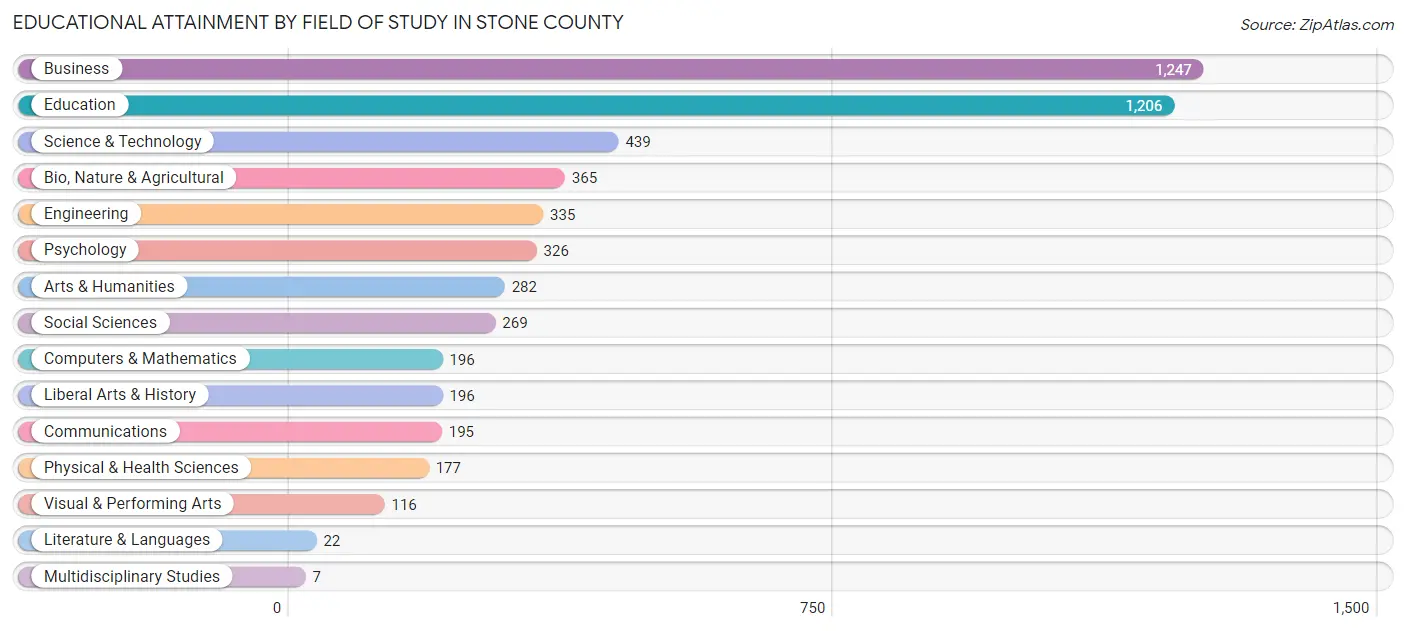
| Field of Study | # Graduates | % Graduates |
| Computers & Mathematics | 196 | 3.6% |
| Bio, Nature & Agricultural | 365 | 6.8% |
| Physical & Health Sciences | 177 | 3.3% |
| Psychology | 326 | 6.1% |
| Social Sciences | 269 | 5.0% |
| Engineering | 335 | 6.2% |
| Multidisciplinary Studies | 7 | 0.1% |
| Science & Technology | 439 | 8.2% |
| Business | 1,247 | 23.2% |
| Education | 1,206 | 22.4% |
| Literature & Languages | 22 | 0.4% |
| Liberal Arts & History | 196 | 3.6% |
| Visual & Performing Arts | 116 | 2.2% |
| Communications | 195 | 3.6% |
| Arts & Humanities | 282 | 5.2% |
| Total | 5,378 | 100.0% |
Transportation & Commute in Stone County
Vehicle Availability by Sex in Stone County
The most prevalent vehicle ownership categories in Stone County are males with 2 vehicles (1,845, accounting for 31.6%) and females with 2 vehicles (1,806, making up 31.4%).
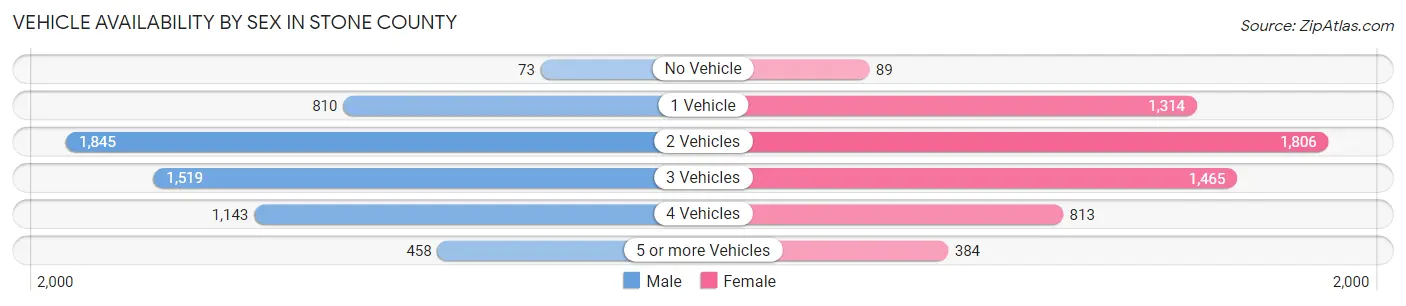
| Vehicles Available | Male | Female |
| No Vehicle | 73 (1.3%) | 89 (1.5%) |
| 1 Vehicle | 810 (13.9%) | 1,314 (22.4%) |
| 2 Vehicles | 1,845 (31.6%) | 1,806 (30.8%) |
| 3 Vehicles | 1,519 (26.0%) | 1,465 (24.9%) |
| 4 Vehicles | 1,143 (19.6%) | 813 (13.9%) |
| 5 or more Vehicles | 458 (7.8%) | 384 (6.5%) |
| Total | 5,848 (100.0%) | 5,871 (100.0%) |
Commute Time in Stone County
The most frequently occuring commute durations in Stone County are 45 to 59 minutes (1,623 commuters, 15.0%), 15 to 19 minutes (1,548 commuters, 14.3%), and 30 to 34 minutes (1,497 commuters, 13.8%).
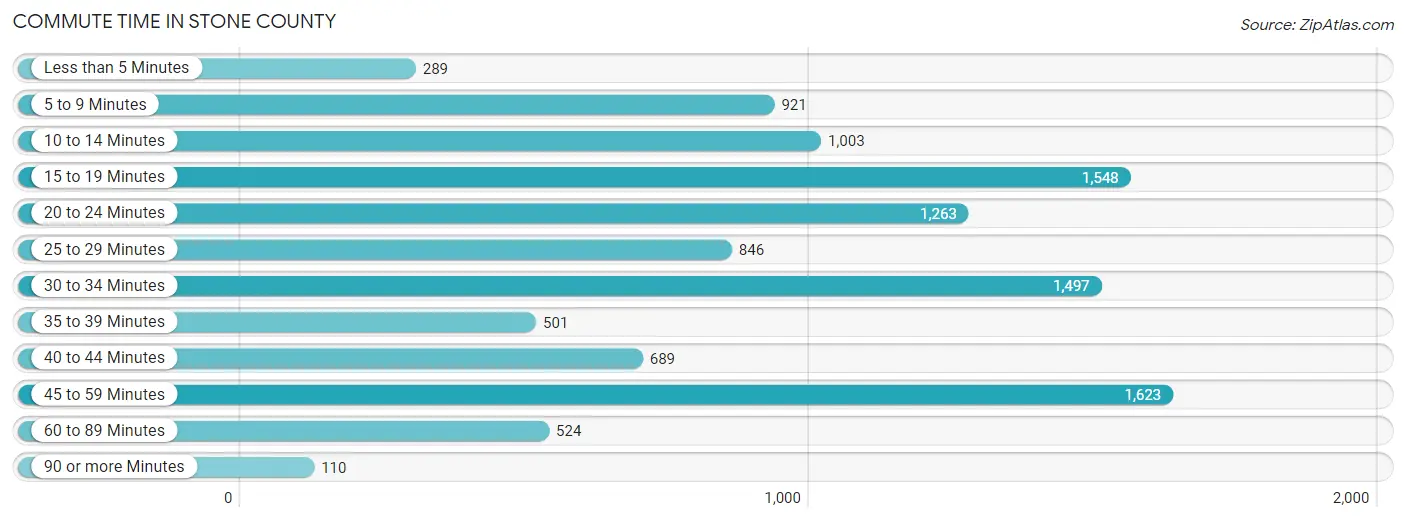
| Commute Time | # Commuters | % Commuters |
| Less than 5 Minutes | 289 | 2.7% |
| 5 to 9 Minutes | 921 | 8.5% |
| 10 to 14 Minutes | 1,003 | 9.3% |
| 15 to 19 Minutes | 1,548 | 14.3% |
| 20 to 24 Minutes | 1,263 | 11.7% |
| 25 to 29 Minutes | 846 | 7.8% |
| 30 to 34 Minutes | 1,497 | 13.8% |
| 35 to 39 Minutes | 501 | 4.6% |
| 40 to 44 Minutes | 689 | 6.4% |
| 45 to 59 Minutes | 1,623 | 15.0% |
| 60 to 89 Minutes | 524 | 4.9% |
| 90 or more Minutes | 110 | 1.0% |
Commute Time by Sex in Stone County
The most common commute times in Stone County are 45 to 59 minutes (1,046 commuters, 18.8%) for males and 15 to 19 minutes (851 commuters, 16.2%) for females.
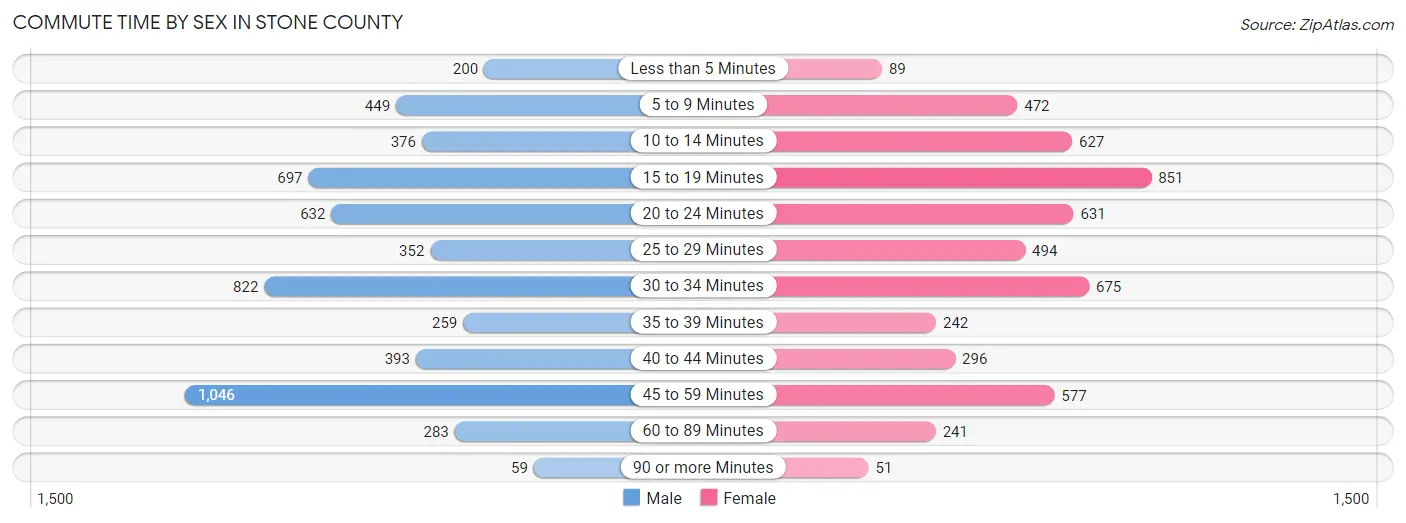
| Commute Time | Male | Female |
| Less than 5 Minutes | 200 (3.6%) | 89 (1.7%) |
| 5 to 9 Minutes | 449 (8.1%) | 472 (9.0%) |
| 10 to 14 Minutes | 376 (6.8%) | 627 (11.9%) |
| 15 to 19 Minutes | 697 (12.5%) | 851 (16.2%) |
| 20 to 24 Minutes | 632 (11.4%) | 631 (12.0%) |
| 25 to 29 Minutes | 352 (6.3%) | 494 (9.4%) |
| 30 to 34 Minutes | 822 (14.8%) | 675 (12.9%) |
| 35 to 39 Minutes | 259 (4.6%) | 242 (4.6%) |
| 40 to 44 Minutes | 393 (7.1%) | 296 (5.6%) |
| 45 to 59 Minutes | 1,046 (18.8%) | 577 (11.0%) |
| 60 to 89 Minutes | 283 (5.1%) | 241 (4.6%) |
| 90 or more Minutes | 59 (1.1%) | 51 (1.0%) |
Time of Departure to Work by Sex in Stone County
The most frequent times of departure to work in Stone County are 7:00 AM to 7:29 AM (902, 16.2%) for males and 7:00 AM to 7:29 AM (953, 18.2%) for females.
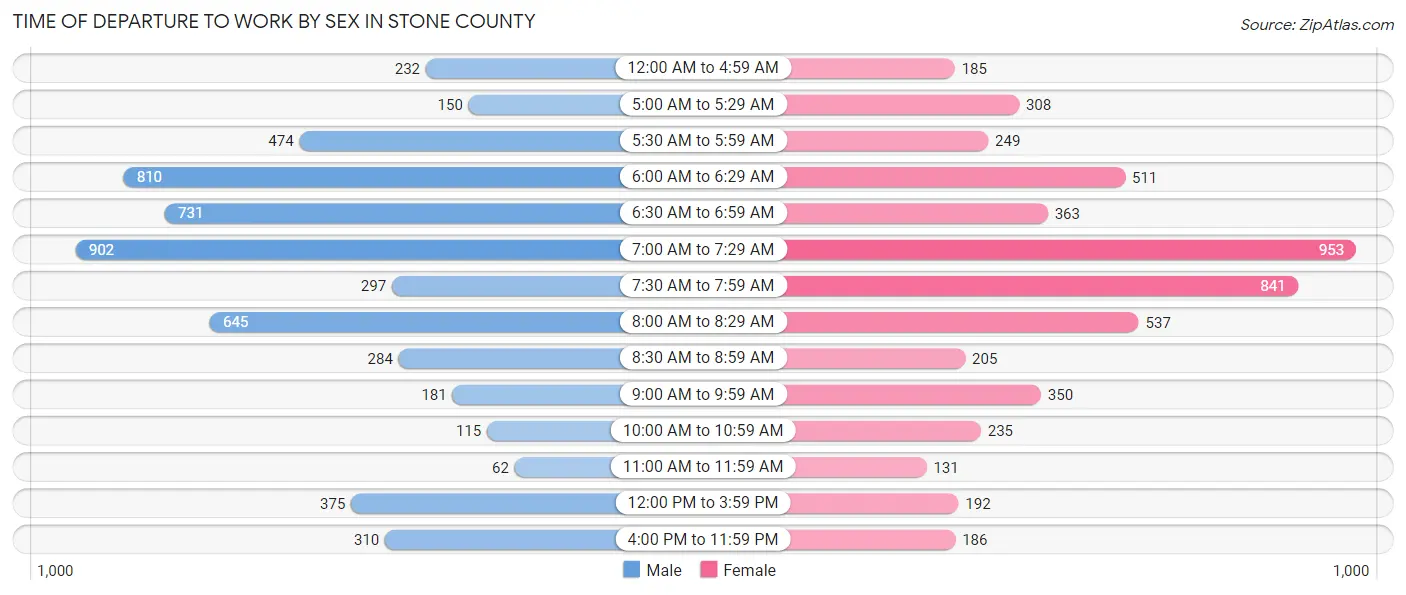
| Time of Departure | Male | Female |
| 12:00 AM to 4:59 AM | 232 (4.2%) | 185 (3.5%) |
| 5:00 AM to 5:29 AM | 150 (2.7%) | 308 (5.9%) |
| 5:30 AM to 5:59 AM | 474 (8.5%) | 249 (4.8%) |
| 6:00 AM to 6:29 AM | 810 (14.5%) | 511 (9.7%) |
| 6:30 AM to 6:59 AM | 731 (13.1%) | 363 (6.9%) |
| 7:00 AM to 7:29 AM | 902 (16.2%) | 953 (18.2%) |
| 7:30 AM to 7:59 AM | 297 (5.3%) | 841 (16.0%) |
| 8:00 AM to 8:29 AM | 645 (11.6%) | 537 (10.2%) |
| 8:30 AM to 8:59 AM | 284 (5.1%) | 205 (3.9%) |
| 9:00 AM to 9:59 AM | 181 (3.3%) | 350 (6.7%) |
| 10:00 AM to 10:59 AM | 115 (2.1%) | 235 (4.5%) |
| 11:00 AM to 11:59 AM | 62 (1.1%) | 131 (2.5%) |
| 12:00 PM to 3:59 PM | 375 (6.7%) | 192 (3.7%) |
| 4:00 PM to 11:59 PM | 310 (5.6%) | 186 (3.5%) |
| Total | 5,568 (100.0%) | 5,246 (100.0%) |
Housing Occupancy in Stone County
Occupancy by Ownership in Stone County
Of the total 12,726 dwellings in Stone County, owner-occupied units account for 10,793 (84.8%), while renter-occupied units make up 1,933 (15.2%).
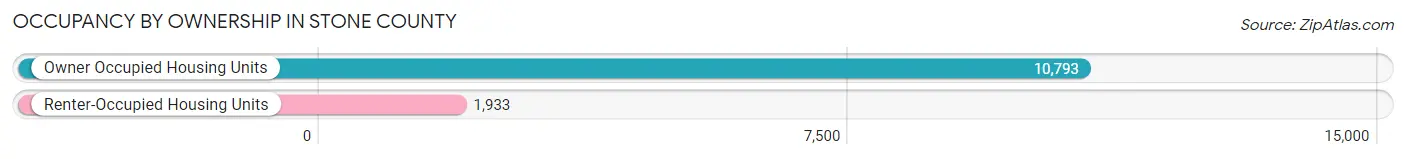
| Occupancy | # Housing Units | % Housing Units |
| Owner Occupied Housing Units | 10,793 | 84.8% |
| Renter-Occupied Housing Units | 1,933 | 15.2% |
| Total Occupied Housing Units | 12,726 | 100.0% |
Occupancy by Household Size in Stone County
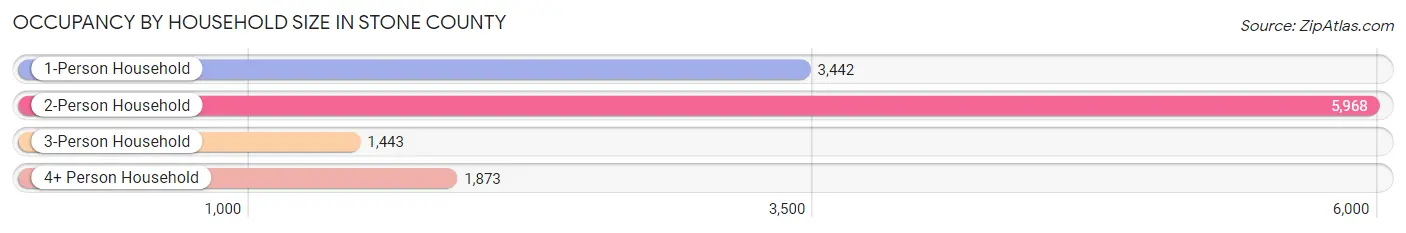
| Household Size | # Housing Units | % Housing Units |
| 1-Person Household | 3,442 | 27.1% |
| 2-Person Household | 5,968 | 46.9% |
| 3-Person Household | 1,443 | 11.3% |
| 4+ Person Household | 1,873 | 14.7% |
| Total Housing Units | 12,726 | 100.0% |
Occupancy by Ownership by Household Size in Stone County
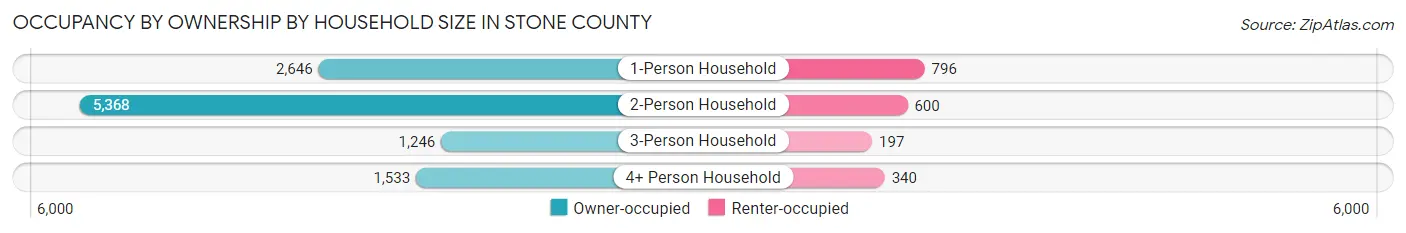
| Household Size | Owner-occupied | Renter-occupied |
| 1-Person Household | 2,646 (76.9%) | 796 (23.1%) |
| 2-Person Household | 5,368 (89.9%) | 600 (10.1%) |
| 3-Person Household | 1,246 (86.4%) | 197 (13.7%) |
| 4+ Person Household | 1,533 (81.9%) | 340 (18.1%) |
| Total Housing Units | 10,793 (84.8%) | 1,933 (15.2%) |
Occupancy by Educational Attainment in Stone County
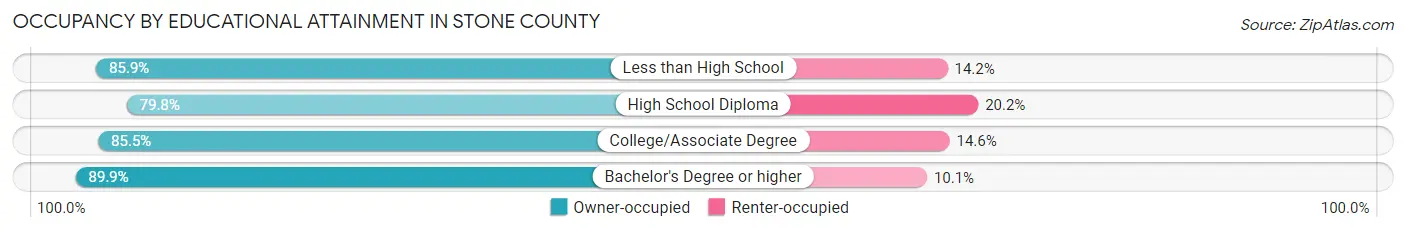
| Household Size | Owner-occupied | Renter-occupied |
| Less than High School | 880 (85.9%) | 145 (14.1%) |
| High School Diploma | 3,087 (79.8%) | 783 (20.2%) |
| College/Associate Degree | 4,129 (85.5%) | 703 (14.5%) |
| Bachelor's Degree or higher | 2,697 (89.9%) | 302 (10.1%) |
Occupancy by Age of Householder in Stone County
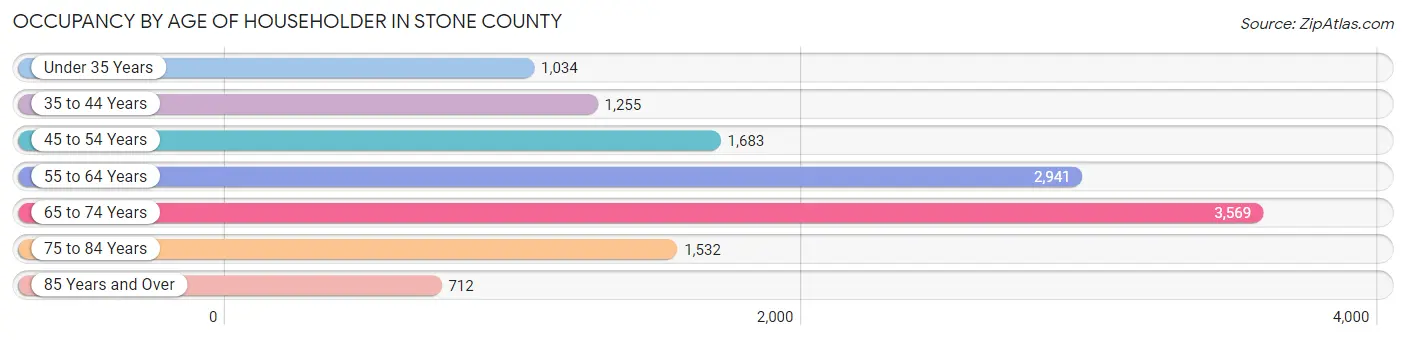
| Age Bracket | # Households | % Households |
| Under 35 Years | 1,034 | 8.1% |
| 35 to 44 Years | 1,255 | 9.9% |
| 45 to 54 Years | 1,683 | 13.2% |
| 55 to 64 Years | 2,941 | 23.1% |
| 65 to 74 Years | 3,569 | 28.0% |
| 75 to 84 Years | 1,532 | 12.0% |
| 85 Years and Over | 712 | 5.6% |
| Total | 12,726 | 100.0% |
Housing Finances in Stone County
Median Income by Occupancy in Stone County
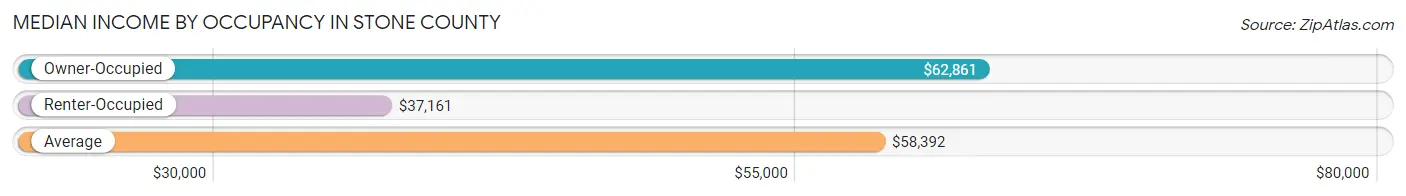
| Occupancy Type | # Households | Median Income |
| Owner-Occupied | 10,793 (84.8%) | $62,861 |
| Renter-Occupied | 1,933 (15.2%) | $37,161 |
| Average | 12,726 (100.0%) | $58,392 |
Occupancy by Householder Income Bracket in Stone County
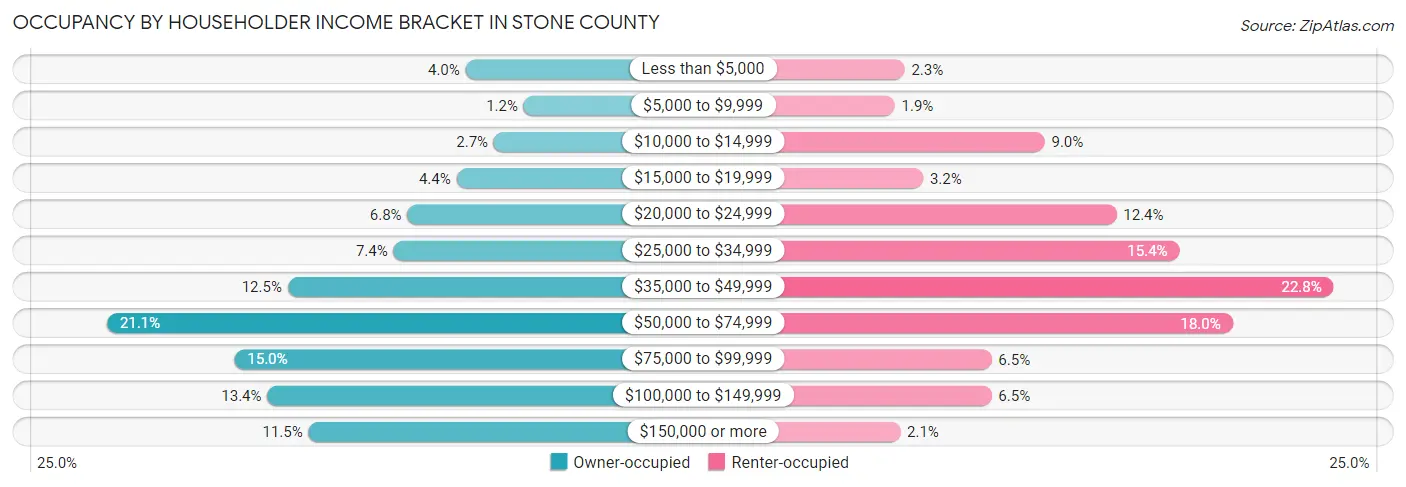
| Income Bracket | Owner-occupied | Renter-occupied |
| Less than $5,000 | 432 (4.0%) | 45 (2.3%) |
| $5,000 to $9,999 | 133 (1.2%) | 36 (1.9%) |
| $10,000 to $14,999 | 286 (2.6%) | 174 (9.0%) |
| $15,000 to $19,999 | 478 (4.4%) | 62 (3.2%) |
| $20,000 to $24,999 | 731 (6.8%) | 240 (12.4%) |
| $25,000 to $34,999 | 802 (7.4%) | 298 (15.4%) |
| $35,000 to $49,999 | 1,346 (12.5%) | 440 (22.8%) |
| $50,000 to $74,999 | 2,275 (21.1%) | 347 (17.9%) |
| $75,000 to $99,999 | 1,620 (15.0%) | 125 (6.5%) |
| $100,000 to $149,999 | 1,451 (13.4%) | 125 (6.5%) |
| $150,000 or more | 1,239 (11.5%) | 41 (2.1%) |
| Total | 10,793 (100.0%) | 1,933 (100.0%) |
Monthly Housing Cost Tiers in Stone County
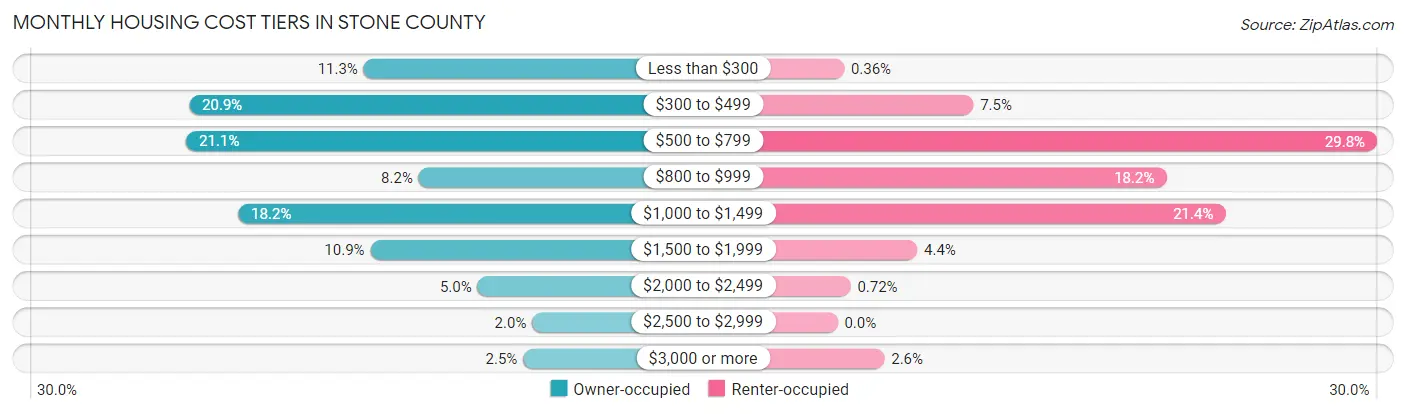
| Monthly Cost | Owner-occupied | Renter-occupied |
| Less than $300 | 1,216 (11.3%) | 7 (0.4%) |
| $300 to $499 | 2,258 (20.9%) | 145 (7.5%) |
| $500 to $799 | 2,275 (21.1%) | 576 (29.8%) |
| $800 to $999 | 888 (8.2%) | 351 (18.2%) |
| $1,000 to $1,499 | 1,965 (18.2%) | 414 (21.4%) |
| $1,500 to $1,999 | 1,176 (10.9%) | 85 (4.4%) |
| $2,000 to $2,499 | 538 (5.0%) | 14 (0.7%) |
| $2,500 to $2,999 | 212 (2.0%) | 0 (0.0%) |
| $3,000 or more | 265 (2.5%) | 50 (2.6%) |
| Total | 10,793 (100.0%) | 1,933 (100.0%) |
Physical Housing Characteristics in Stone County
Housing Structures in Stone County
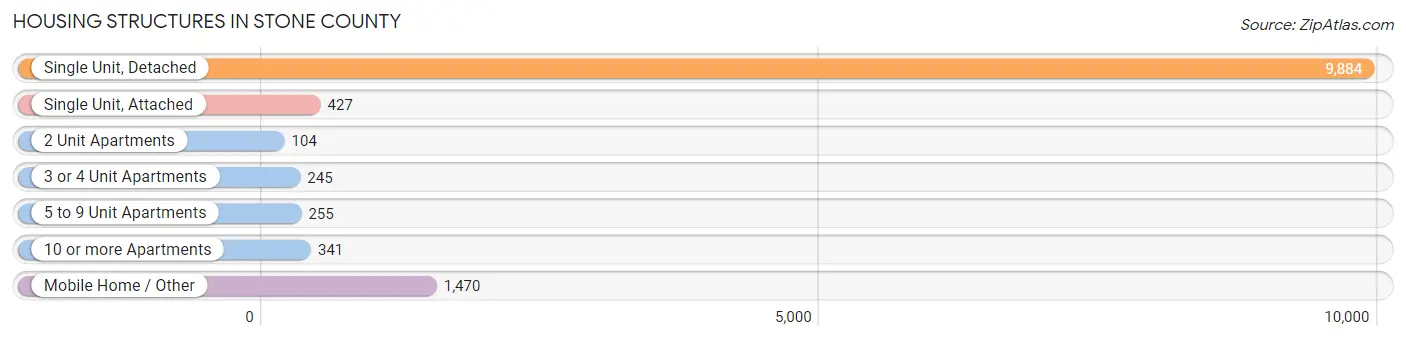
| Structure Type | # Housing Units | % Housing Units |
| Single Unit, Detached | 9,884 | 77.7% |
| Single Unit, Attached | 427 | 3.4% |
| 2 Unit Apartments | 104 | 0.8% |
| 3 or 4 Unit Apartments | 245 | 1.9% |
| 5 to 9 Unit Apartments | 255 | 2.0% |
| 10 or more Apartments | 341 | 2.7% |
| Mobile Home / Other | 1,470 | 11.6% |
| Total | 12,726 | 100.0% |
Housing Structures by Occupancy in Stone County
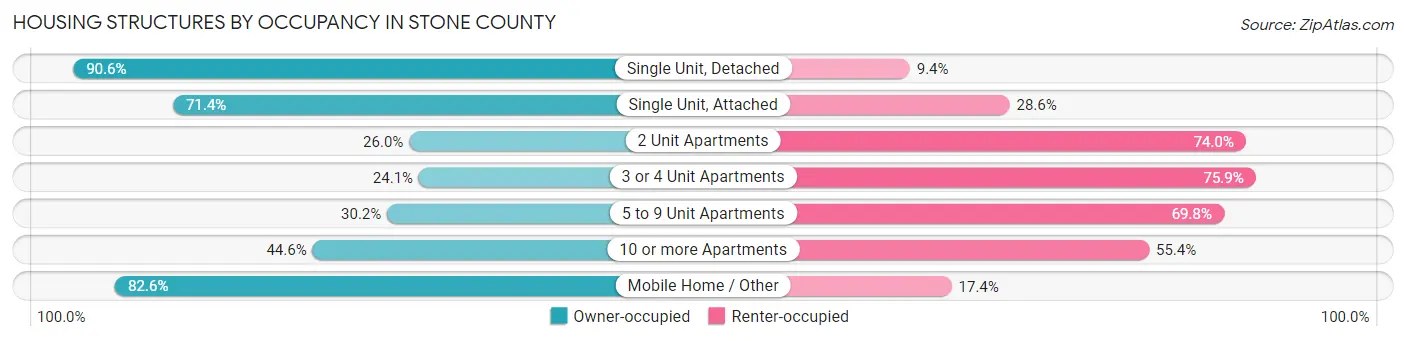
| Structure Type | Owner-occupied | Renter-occupied |
| Single Unit, Detached | 8,959 (90.6%) | 925 (9.4%) |
| Single Unit, Attached | 305 (71.4%) | 122 (28.6%) |
| 2 Unit Apartments | 27 (26.0%) | 77 (74.0%) |
| 3 or 4 Unit Apartments | 59 (24.1%) | 186 (75.9%) |
| 5 to 9 Unit Apartments | 77 (30.2%) | 178 (69.8%) |
| 10 or more Apartments | 152 (44.6%) | 189 (55.4%) |
| Mobile Home / Other | 1,214 (82.6%) | 256 (17.4%) |
| Total | 10,793 (84.8%) | 1,933 (15.2%) |
Housing Structures by Number of Rooms in Stone County
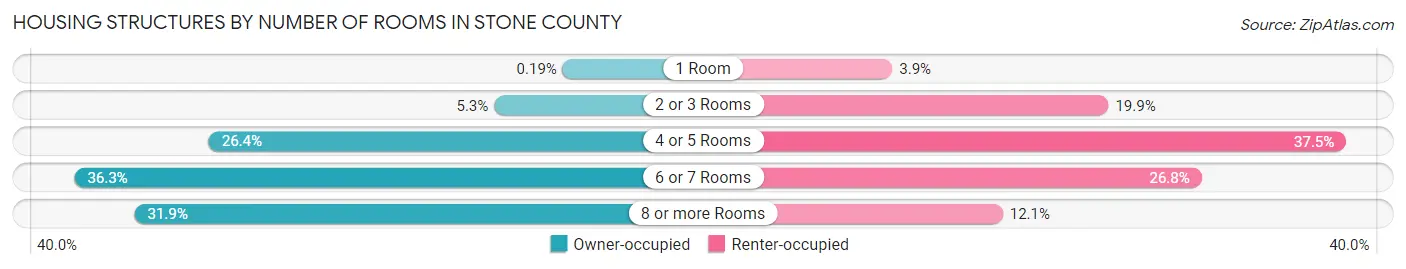
| Number of Rooms | Owner-occupied | Renter-occupied |
| 1 Room | 21 (0.2%) | 75 (3.9%) |
| 2 or 3 Rooms | 568 (5.3%) | 384 (19.9%) |
| 4 or 5 Rooms | 2,846 (26.4%) | 724 (37.4%) |
| 6 or 7 Rooms | 3,919 (36.3%) | 517 (26.8%) |
| 8 or more Rooms | 3,439 (31.9%) | 233 (12.0%) |
| Total | 10,793 (100.0%) | 1,933 (100.0%) |
Housing Structure by Heating Type in Stone County
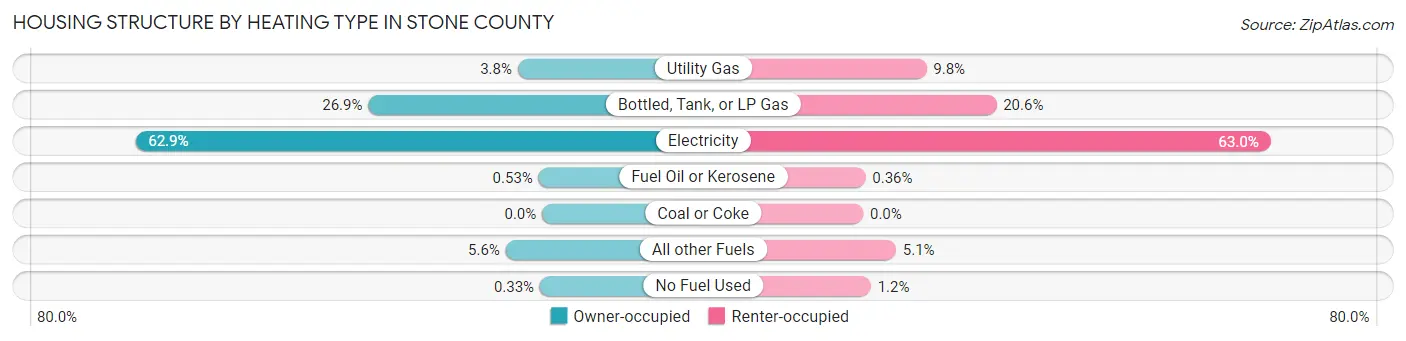
| Heating Type | Owner-occupied | Renter-occupied |
| Utility Gas | 405 (3.7%) | 189 (9.8%) |
| Bottled, Tank, or LP Gas | 2,900 (26.9%) | 398 (20.6%) |
| Electricity | 6,787 (62.9%) | 1,218 (63.0%) |
| Fuel Oil or Kerosene | 57 (0.5%) | 7 (0.4%) |
| Coal or Coke | 0 (0.0%) | 0 (0.0%) |
| All other Fuels | 608 (5.6%) | 98 (5.1%) |
| No Fuel Used | 36 (0.3%) | 23 (1.2%) |
| Total | 10,793 (100.0%) | 1,933 (100.0%) |
Household Vehicle Usage in Stone County
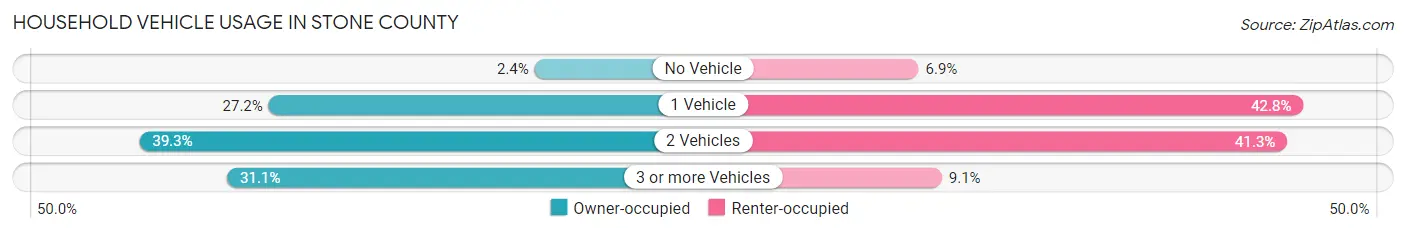
| Vehicles per Household | Owner-occupied | Renter-occupied |
| No Vehicle | 258 (2.4%) | 133 (6.9%) |
| 1 Vehicle | 2,938 (27.2%) | 827 (42.8%) |
| 2 Vehicles | 4,241 (39.3%) | 798 (41.3%) |
| 3 or more Vehicles | 3,356 (31.1%) | 175 (9.0%) |
| Total | 10,793 (100.0%) | 1,933 (100.0%) |
Real Estate & Mortgages in Stone County
Real Estate and Mortgage Overview in Stone County
| Characteristic | Without Mortgage | With Mortgage |
| Housing Units | 5,524 | 5,269 |
| Median Property Value | $200,900 | $233,900 |
| Median Household Income | $50,643 | $809 |
| Monthly Housing Costs | $442 | $265 |
| Real Estate Taxes | $965 | $27 |
Property Value by Mortgage Status in Stone County
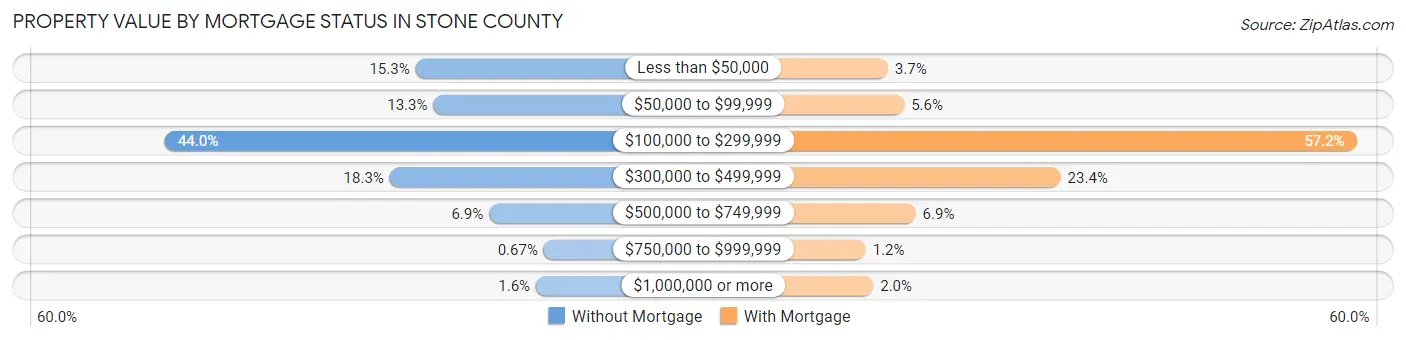
| Property Value | Without Mortgage | With Mortgage |
| Less than $50,000 | 847 (15.3%) | 195 (3.7%) |
| $50,000 to $99,999 | 734 (13.3%) | 293 (5.6%) |
| $100,000 to $299,999 | 2,428 (44.0%) | 3,016 (57.2%) |
| $300,000 to $499,999 | 1,010 (18.3%) | 1,235 (23.4%) |
| $500,000 to $749,999 | 382 (6.9%) | 362 (6.9%) |
| $750,000 to $999,999 | 37 (0.7%) | 61 (1.2%) |
| $1,000,000 or more | 86 (1.6%) | 107 (2.0%) |
| Total | 5,524 (100.0%) | 5,269 (100.0%) |
Household Income by Mortgage Status in Stone County
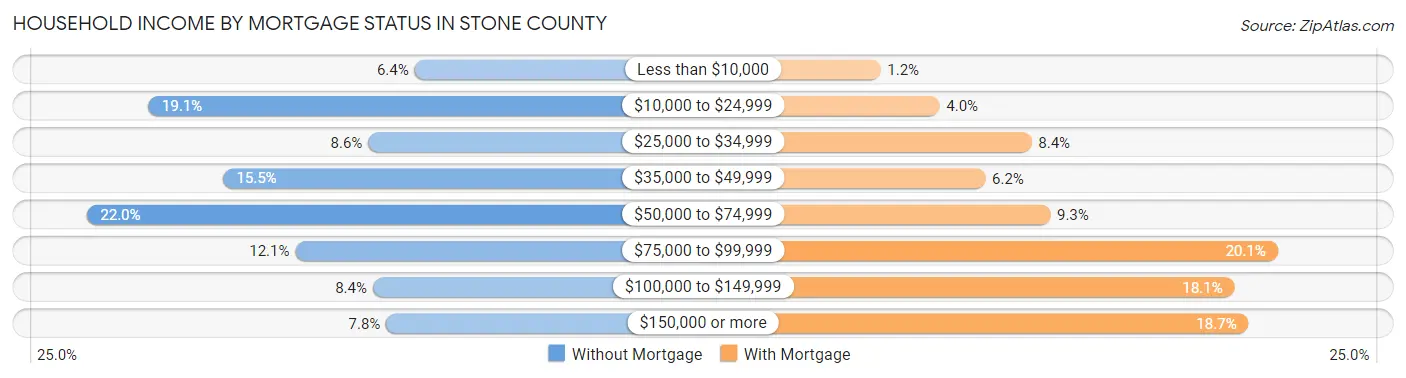
| Household Income | Without Mortgage | With Mortgage |
| Less than $10,000 | 355 (6.4%) | 62 (1.2%) |
| $10,000 to $24,999 | 1,054 (19.1%) | 210 (4.0%) |
| $25,000 to $34,999 | 477 (8.6%) | 441 (8.4%) |
| $35,000 to $49,999 | 858 (15.5%) | 325 (6.2%) |
| $50,000 to $74,999 | 1,216 (22.0%) | 488 (9.3%) |
| $75,000 to $99,999 | 669 (12.1%) | 1,059 (20.1%) |
| $100,000 to $149,999 | 465 (8.4%) | 951 (18.0%) |
| $150,000 or more | 430 (7.8%) | 986 (18.7%) |
| Total | 5,524 (100.0%) | 5,269 (100.0%) |
Property Value to Household Income Ratio in Stone County
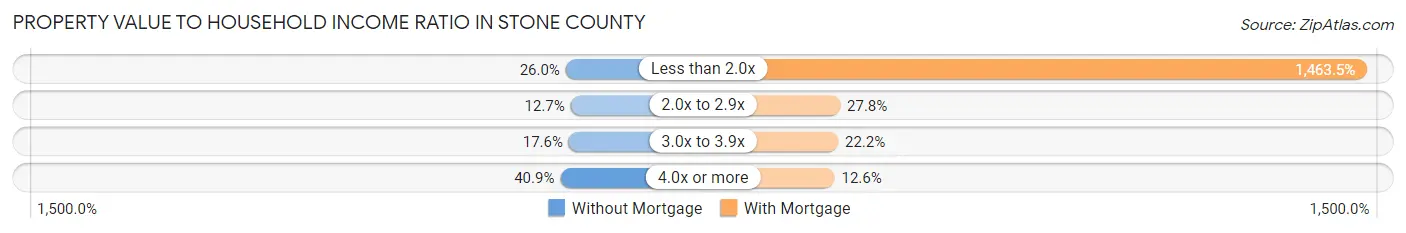
| Value-to-Income Ratio | Without Mortgage | With Mortgage |
| Less than 2.0x | 1,436 (26.0%) | 77,112 (1,463.5%) |
| 2.0x to 2.9x | 701 (12.7%) | 1,464 (27.8%) |
| 3.0x to 3.9x | 973 (17.6%) | 1,170 (22.2%) |
| 4.0x or more | 2,258 (40.9%) | 662 (12.6%) |
| Total | 5,524 (100.0%) | 5,269 (100.0%) |
Real Estate Taxes by Mortgage Status in Stone County
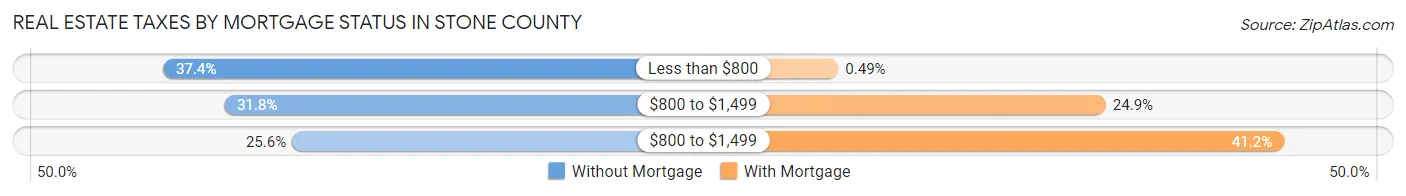
| Property Taxes | Without Mortgage | With Mortgage |
| Less than $800 | 2,064 (37.4%) | 26 (0.5%) |
| $800 to $1,499 | 1,756 (31.8%) | 1,313 (24.9%) |
| $800 to $1,499 | 1,413 (25.6%) | 2,170 (41.2%) |
| Total | 5,524 (100.0%) | 5,269 (100.0%) |
Health & Disability in Stone County
Health Insurance Coverage by Age in Stone County
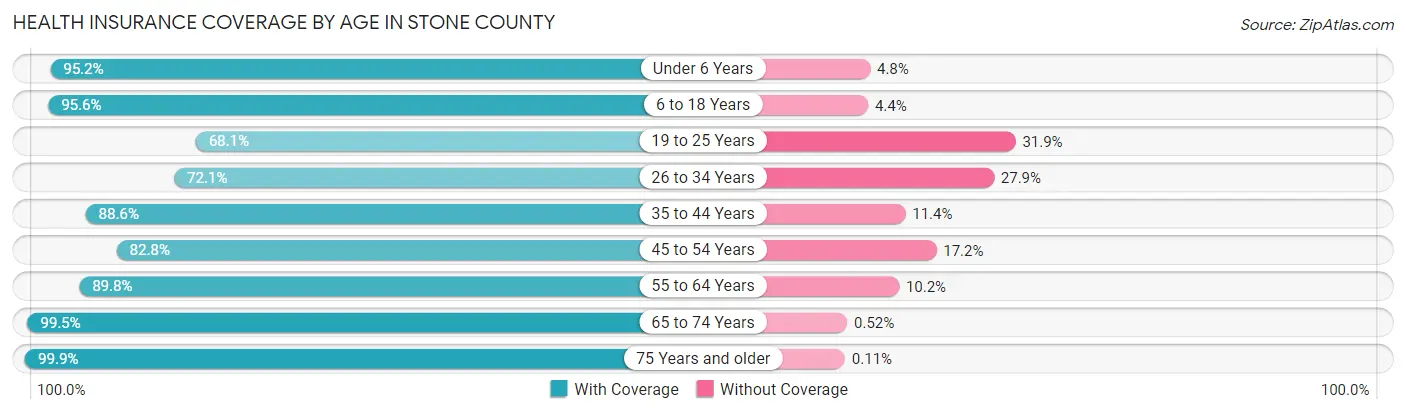
| Age Bracket | With Coverage | Without Coverage |
| Under 6 Years | 1,429 (95.2%) | 72 (4.8%) |
| 6 to 18 Years | 3,768 (95.6%) | 174 (4.4%) |
| 19 to 25 Years | 1,171 (68.1%) | 549 (31.9%) |
| 26 to 34 Years | 1,564 (72.1%) | 605 (27.9%) |
| 35 to 44 Years | 2,701 (88.6%) | 347 (11.4%) |
| 45 to 54 Years | 2,834 (82.8%) | 587 (17.2%) |
| 55 to 64 Years | 5,034 (89.8%) | 571 (10.2%) |
| 65 to 74 Years | 5,907 (99.5%) | 31 (0.5%) |
| 75 Years and older | 3,670 (99.9%) | 4 (0.1%) |
| Total | 28,078 (90.5%) | 2,940 (9.5%) |
Health Insurance Coverage by Citizenship Status in Stone County
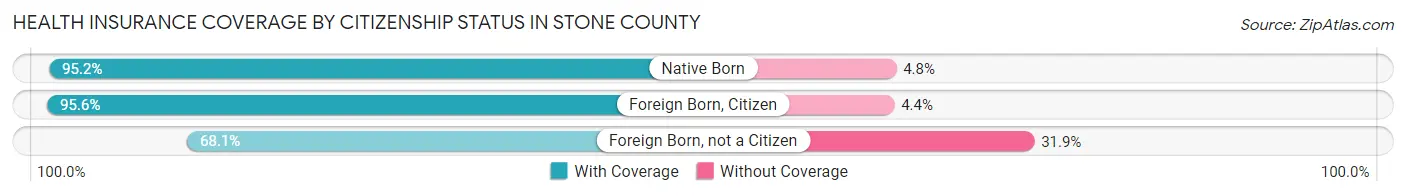
| Citizenship Status | With Coverage | Without Coverage |
| Native Born | 1,429 (95.2%) | 72 (4.8%) |
| Foreign Born, Citizen | 3,768 (95.6%) | 174 (4.4%) |
| Foreign Born, not a Citizen | 1,171 (68.1%) | 549 (31.9%) |
Health Insurance Coverage by Household Income in Stone County
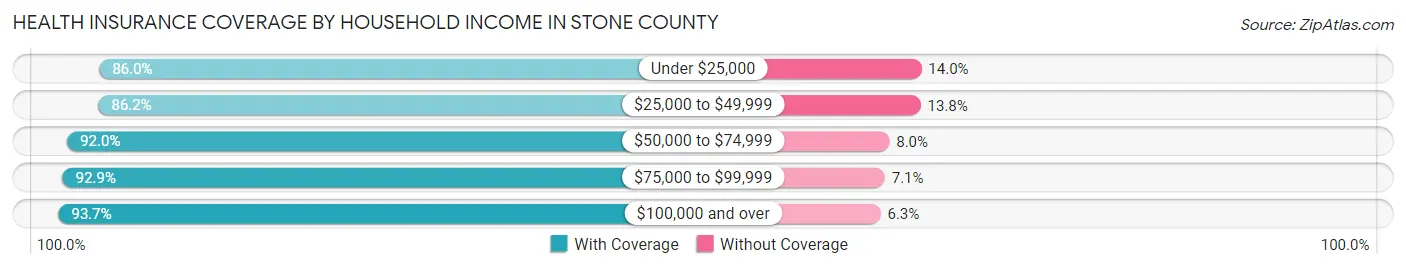
| Household Income | With Coverage | Without Coverage |
| Under $25,000 | 3,987 (86.0%) | 648 (14.0%) |
| $25,000 to $49,999 | 5,568 (86.2%) | 893 (13.8%) |
| $50,000 to $74,999 | 5,457 (92.0%) | 472 (8.0%) |
| $75,000 to $99,999 | 4,512 (92.9%) | 346 (7.1%) |
| $100,000 and over | 8,491 (93.7%) | 573 (6.3%) |
Public vs Private Health Insurance Coverage by Age in Stone County
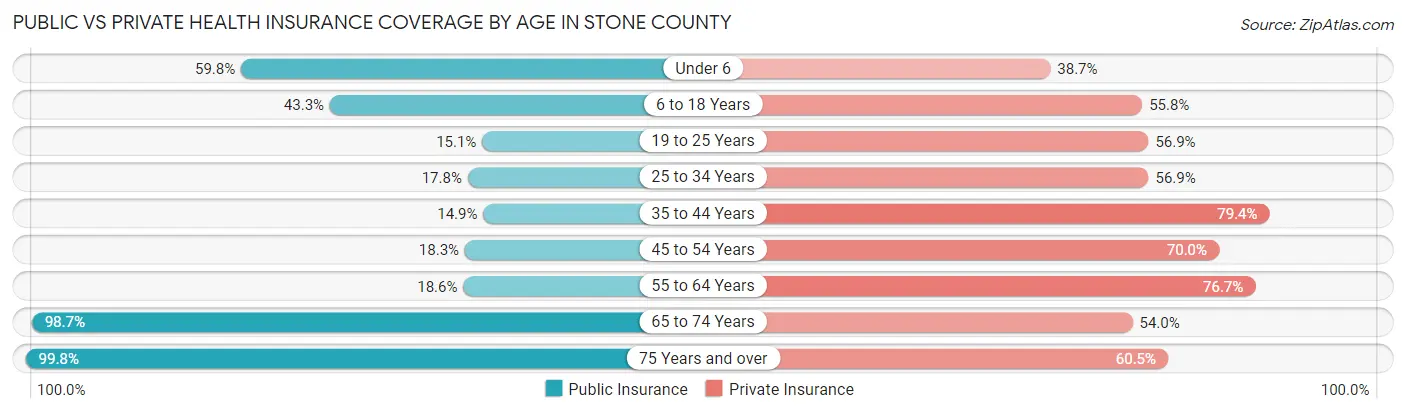
| Age Bracket | Public Insurance | Private Insurance |
| Under 6 | 898 (59.8%) | 581 (38.7%) |
| 6 to 18 Years | 1,708 (43.3%) | 2,198 (55.8%) |
| 19 to 25 Years | 259 (15.1%) | 979 (56.9%) |
| 25 to 34 Years | 385 (17.7%) | 1,235 (56.9%) |
| 35 to 44 Years | 453 (14.9%) | 2,419 (79.4%) |
| 45 to 54 Years | 625 (18.3%) | 2,394 (70.0%) |
| 55 to 64 Years | 1,041 (18.6%) | 4,300 (76.7%) |
| 65 to 74 Years | 5,859 (98.7%) | 3,204 (54.0%) |
| 75 Years and over | 3,667 (99.8%) | 2,223 (60.5%) |
| Total | 14,895 (48.0%) | 19,533 (63.0%) |
Disability Status by Sex by Age in Stone County
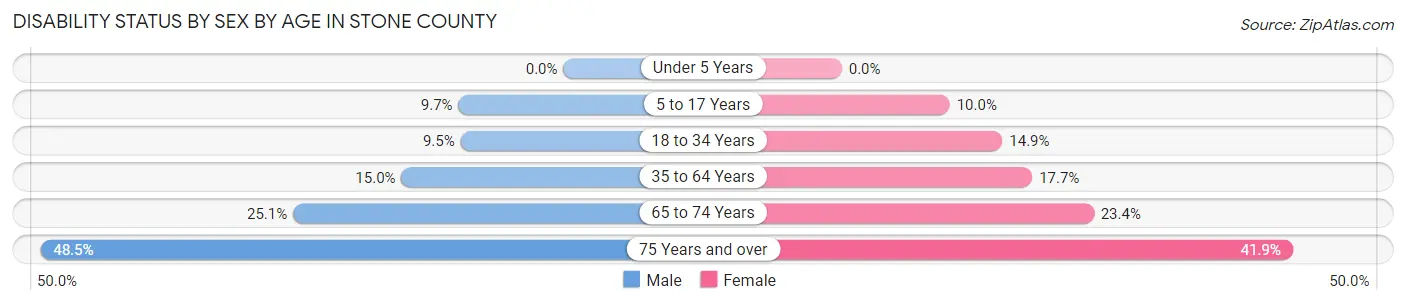
| Age Bracket | Male | Female |
| Under 5 Years | 0 (0.0%) | 0 (0.0%) |
| 5 to 17 Years | 189 (9.7%) | 197 (10.0%) |
| 18 to 34 Years | 206 (9.5%) | 307 (14.9%) |
| 35 to 64 Years | 884 (15.0%) | 1,094 (17.7%) |
| 65 to 74 Years | 714 (25.1%) | 723 (23.4%) |
| 75 Years and over | 881 (48.5%) | 778 (41.8%) |
Disability Class by Sex by Age in Stone County
Disability Class: Hearing Difficulty
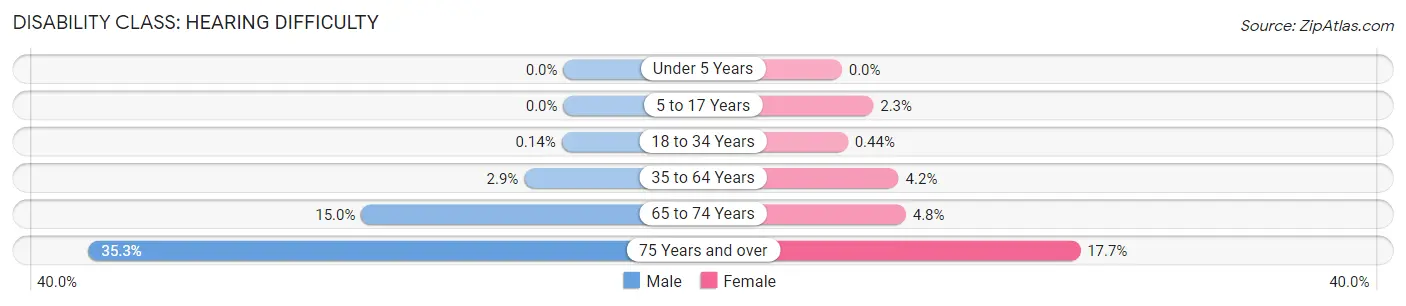
| Age Bracket | Male | Female |
| Under 5 Years | 0 (0.0%) | 0 (0.0%) |
| 5 to 17 Years | 0 (0.0%) | 46 (2.3%) |
| 18 to 34 Years | 3 (0.1%) | 9 (0.4%) |
| 35 to 64 Years | 171 (2.9%) | 261 (4.2%) |
| 65 to 74 Years | 427 (15.0%) | 147 (4.8%) |
| 75 Years and over | 640 (35.3%) | 329 (17.7%) |
Disability Class: Vision Difficulty
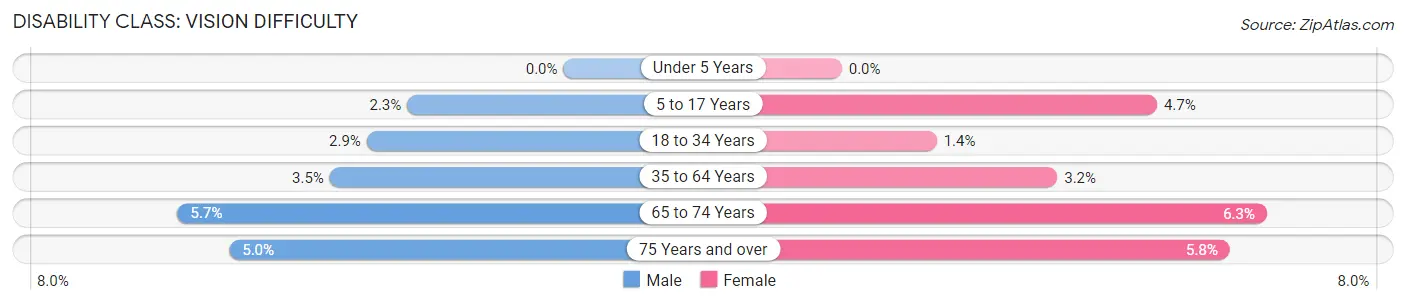
| Age Bracket | Male | Female |
| Under 5 Years | 0 (0.0%) | 0 (0.0%) |
| 5 to 17 Years | 45 (2.3%) | 92 (4.7%) |
| 18 to 34 Years | 63 (2.9%) | 29 (1.4%) |
| 35 to 64 Years | 204 (3.5%) | 198 (3.2%) |
| 65 to 74 Years | 163 (5.7%) | 195 (6.3%) |
| 75 Years and over | 90 (5.0%) | 107 (5.8%) |
Disability Class: Cognitive Difficulty
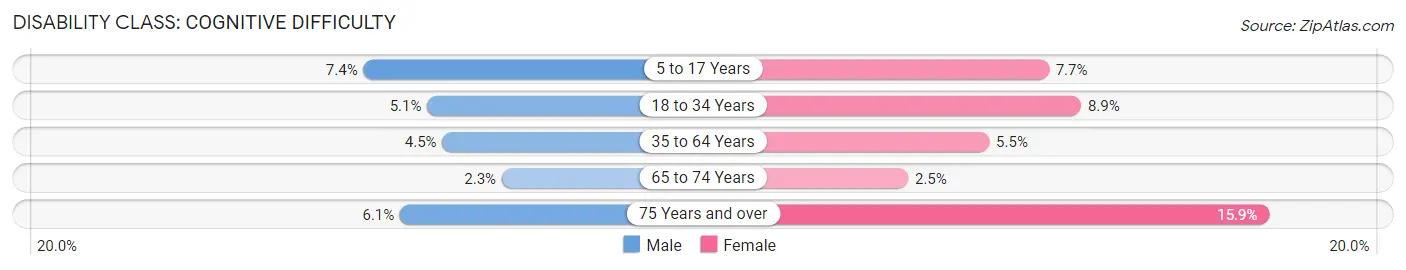
| Age Bracket | Male | Female |
| 5 to 17 Years | 144 (7.4%) | 151 (7.7%) |
| 18 to 34 Years | 109 (5.1%) | 183 (8.9%) |
| 35 to 64 Years | 264 (4.5%) | 339 (5.5%) |
| 65 to 74 Years | 65 (2.3%) | 76 (2.5%) |
| 75 Years and over | 110 (6.1%) | 295 (15.9%) |
Disability Class: Ambulatory Difficulty
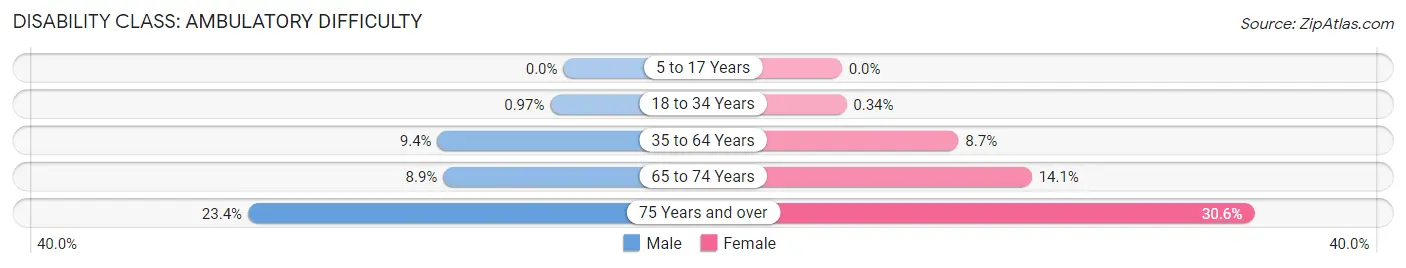
| Age Bracket | Male | Female |
| 5 to 17 Years | 0 (0.0%) | 0 (0.0%) |
| 18 to 34 Years | 21 (1.0%) | 7 (0.3%) |
| 35 to 64 Years | 550 (9.3%) | 536 (8.7%) |
| 65 to 74 Years | 254 (8.9%) | 436 (14.1%) |
| 75 Years and over | 425 (23.4%) | 569 (30.6%) |
Disability Class: Self-Care Difficulty
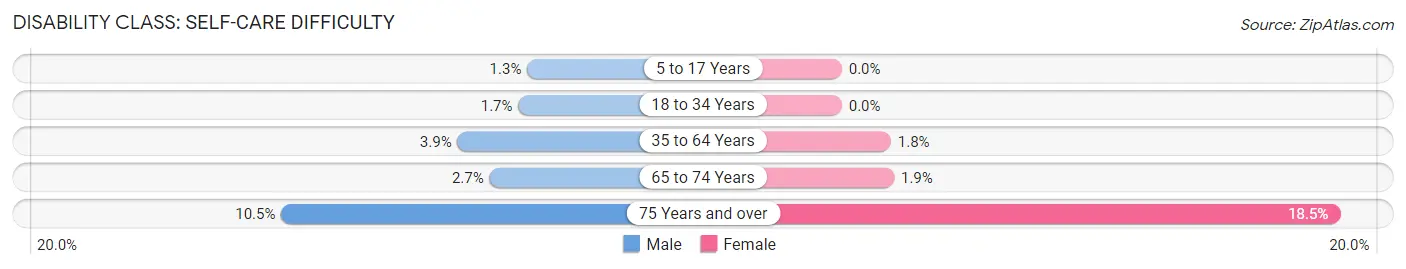
| Age Bracket | Male | Female |
| 5 to 17 Years | 26 (1.3%) | 0 (0.0%) |
| 18 to 34 Years | 36 (1.7%) | 0 (0.0%) |
| 35 to 64 Years | 231 (3.9%) | 113 (1.8%) |
| 65 to 74 Years | 78 (2.7%) | 60 (1.9%) |
| 75 Years and over | 190 (10.5%) | 344 (18.5%) |
Technology Access in Stone County
Computing Device Access in Stone County
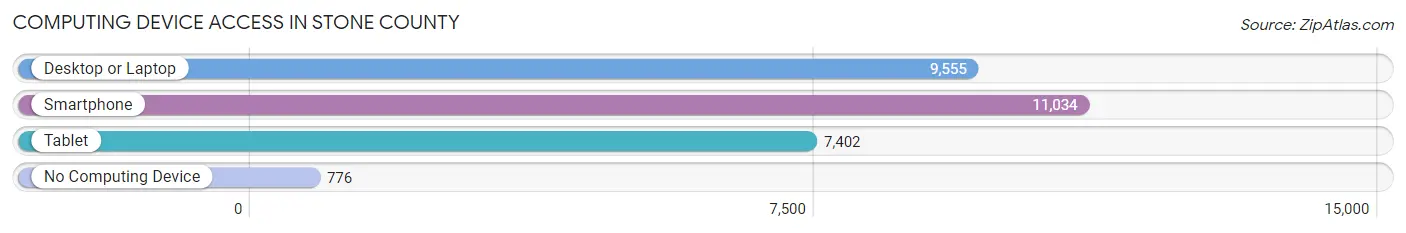
| Device Type | # Households | % Households |
| Desktop or Laptop | 9,555 | 75.1% |
| Smartphone | 11,034 | 86.7% |
| Tablet | 7,402 | 58.2% |
| No Computing Device | 776 | 6.1% |
| Total | 12,726 | 100.0% |
Internet Access in Stone County
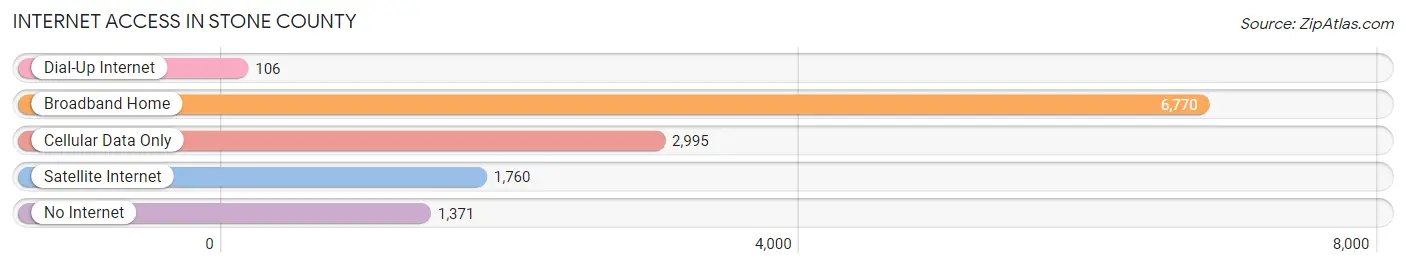
| Internet Type | # Households | % Households |
| Dial-Up Internet | 106 | 0.8% |
| Broadband Home | 6,770 | 53.2% |
| Cellular Data Only | 2,995 | 23.5% |
| Satellite Internet | 1,760 | 13.8% |
| No Internet | 1,371 | 10.8% |
| Total | 12,726 | 100.0% |
Stone County Summary
Stone County is located in the southwestern corner of Missouri, and is part of the Ozark Plateau. It is bordered by Taney County to the north, Christian County to the east, Barry County to the south, and Barry and Newton Counties to the west. The county seat is Galena, and the largest city is Branson.
History
Stone County was established in 1851 and named for William Stone, a Revolutionary War veteran. The county was originally part of Greene County, and was later divided into Taney and Christian Counties. The county was officially organized in 1873.
The county was largely rural until the 1950s, when the area began to experience a population boom due to the development of the tourism industry. The area is now home to several popular tourist attractions, including Silver Dollar City, the Titanic Museum, and the Branson Strip.
Geography
Stone County is located in the Ozark Plateau region of Missouri. The county is mostly hilly, with elevations ranging from 600 to 1,000 feet above sea level. The county is drained by the White River and its tributaries. The county is mostly forested, with oak, hickory, and pine trees being the most common.
The county has a total area of 545 square miles, of which 543 square miles is land and 2 square miles is water.
Economy
Stone County's economy is largely based on tourism. The county is home to several popular tourist attractions, including Silver Dollar City, the Titanic Museum, and the Branson Strip. The county is also home to several wineries, breweries, and distilleries.
Agriculture is also an important part of the county's economy. The county is home to several farms, which produce a variety of crops, including corn, soybeans, wheat, hay, and vegetables. Livestock production is also important, with cattle, hogs, and poultry being the most common.
Demographics
As of the 2010 census, Stone County had a population of 32,202. The racial makeup of the county was 95.3% White, 0.7% African American, 0.5% Native American, 0.5% Asian, 0.1% Pacific Islander, 1.3% from other races, and 1.6% from two or more races. Hispanic or Latino of any race were 3.2% of the population.
The median income for a household in the county was $37,945, and the median income for a family was $45,945. The per capita income for the county was $20,945. About 11.3% of families and 14.7% of the population were below the poverty line, including 19.2% of those under age 18 and 8.7% of those age 65 or over.
Common Questions
What is Per Capita Income in Stone County?
Per Capita income in Stone County is $31,865.
What is the Median Family Income in Stone County?
Median Family Income in Stone County is $69,762.
What is the Median Household income in Stone County?
Median Household Income in Stone County is $58,392.
What is Income or Wage Gap in Stone County?
Income or Wage Gap in Stone County is 29.3%.
Women in Stone County earn 70.7 cents for every dollar earned by a man.
What is Family Income Deficit in Stone County?
Family Income Deficit in Stone County is $10,214.
Families that are below poverty line in Stone County earn $10,214 less on average than the poverty threshold level.
What is Inequality or Gini Index in Stone County?
Inequality or Gini Index in Stone County is 0.45.
What is the Total Population of Stone County?
Total Population of Stone County is 31,314.
What is the Total Male Population of Stone County?
Total Male Population of Stone County is 15,415.
What is the Total Female Population of Stone County?
Total Female Population of Stone County is 15,899.
What is the Ratio of Males per 100 Females in Stone County?
There are 96.96 Males per 100 Females in Stone County.
What is the Ratio of Females per 100 Males in Stone County?
There are 103.14 Females per 100 Males in Stone County.
What is the Median Population Age in Stone County?
Median Population Age in Stone County is 54.6 Years.
What is the Average Family Size in Stone County
Average Family Size in Stone County is 2.9 People.
What is the Average Household Size in Stone County
Average Household Size in Stone County is 2.4 People.
How Large is the Labor Force in Stone County?
There are 13,105 People in the Labor Forcein in Stone County.
What is the Percentage of People in the Labor Force in Stone County?
48.7% of People are in the Labor Force in Stone County.
What is the Unemployment Rate in Stone County?
Unemployment Rate in Stone County is 8.4%.