St. Louis County, MO Map & Demographics
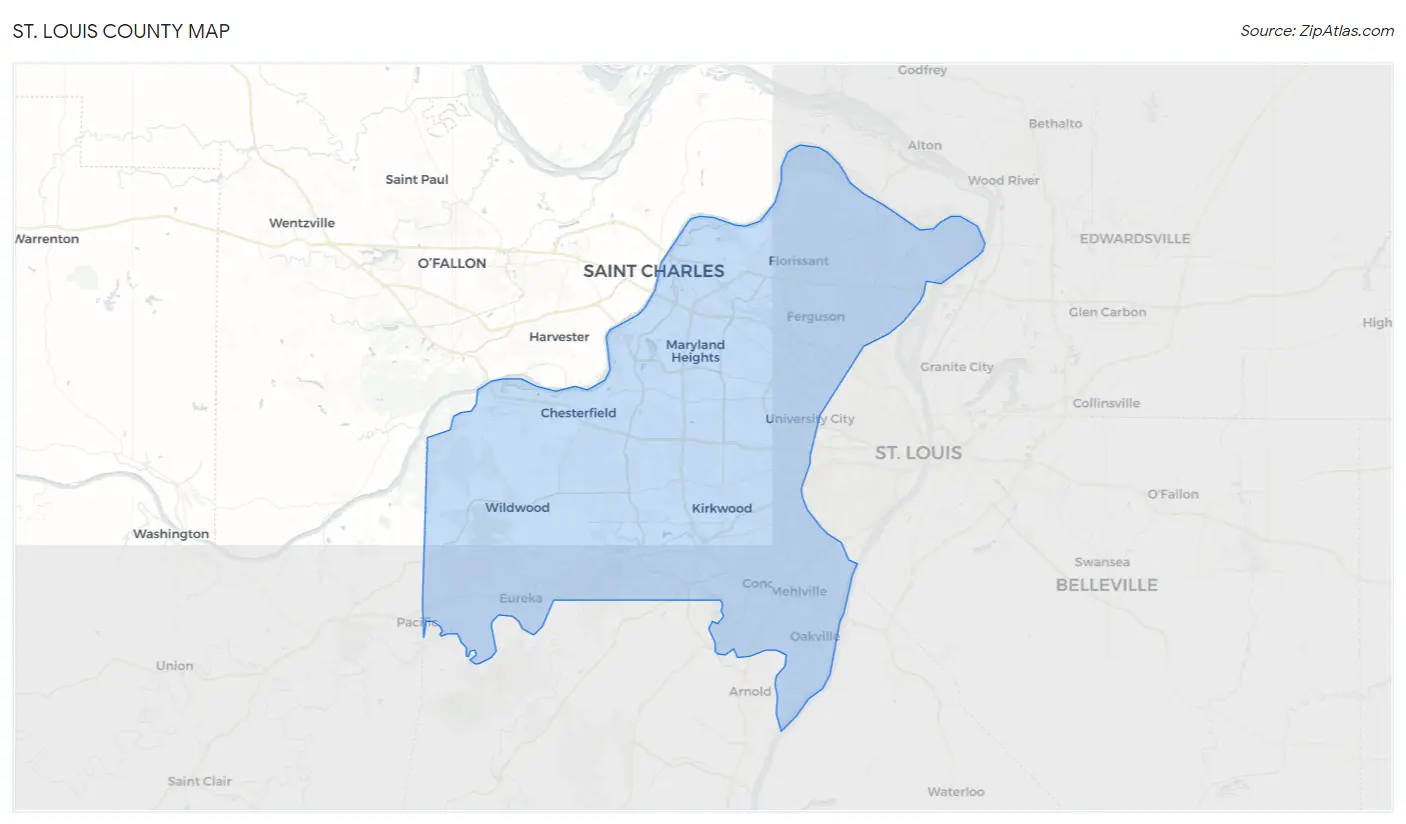
St. Louis County Map
St. Louis County Overview
$49,009
PER CAPITA INCOME
$104,371
AVG FAMILY INCOME
$78,067
AVG HOUSEHOLD INCOME
28.5%
WAGE / INCOME GAP [ % ]
71.5¢/ $1
WAGE / INCOME GAP [ $ ]
$10,837
FAMILY INCOME DEFICIT
0.50
INEQUALITY / GINI INDEX
999,703
TOTAL POPULATION
478,717
MALE POPULATION
520,986
FEMALE POPULATION
91.89
MALES / 100 FEMALES
108.83
FEMALES / 100 MALES
40.2
MEDIAN AGE
3.0
AVG FAMILY SIZE
2.4
AVG HOUSEHOLD SIZE
522,748
LABOR FORCE [ PEOPLE ]
64.8%
PERCENT IN LABOR FORCE
4.3%
UNEMPLOYMENT RATE
Income in St. Louis County
Income Overview in St. Louis County
Per Capita Income in St. Louis County is $49,009, while median incomes of families and households are $104,371 and $78,067 respectively.
| Characteristic | Number | Measure |
| Per Capita Income | 999,703 | $49,009 |
| Median Family Income | 257,856 | $104,371 |
| Mean Family Income | 257,856 | $146,110 |
| Median Household Income | 413,247 | $78,067 |
| Mean Household Income | 413,247 | $116,738 |
| Income Deficit | 257,856 | $10,837 |
| Wage / Income Gap (%) | 999,703 | 28.49% |
| Wage / Income Gap ($) | 999,703 | 71.51¢ per $1 |
| Gini / Inequality Index | 999,703 | 0.50 |
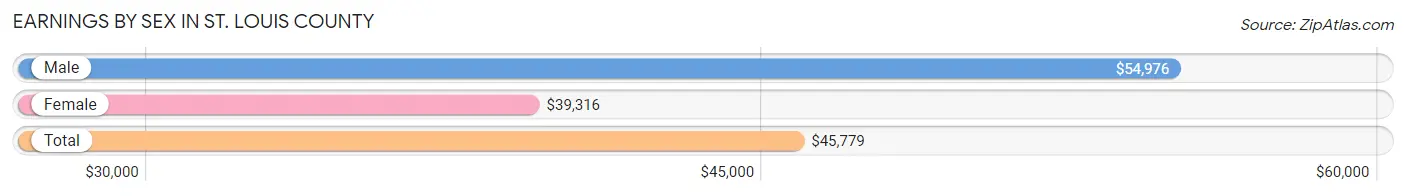
Earnings by Sex in St. Louis County
Average Earnings in St. Louis County are $45,779, $54,976 for men and $39,316 for women, a difference of 28.5%.
| Sex | Number | Average Earnings |
| Male | 275,979 (50.3%) | $54,976 |
| Female | 272,547 (49.7%) | $39,316 |
| Total | 548,526 (100.0%) | $45,779 |
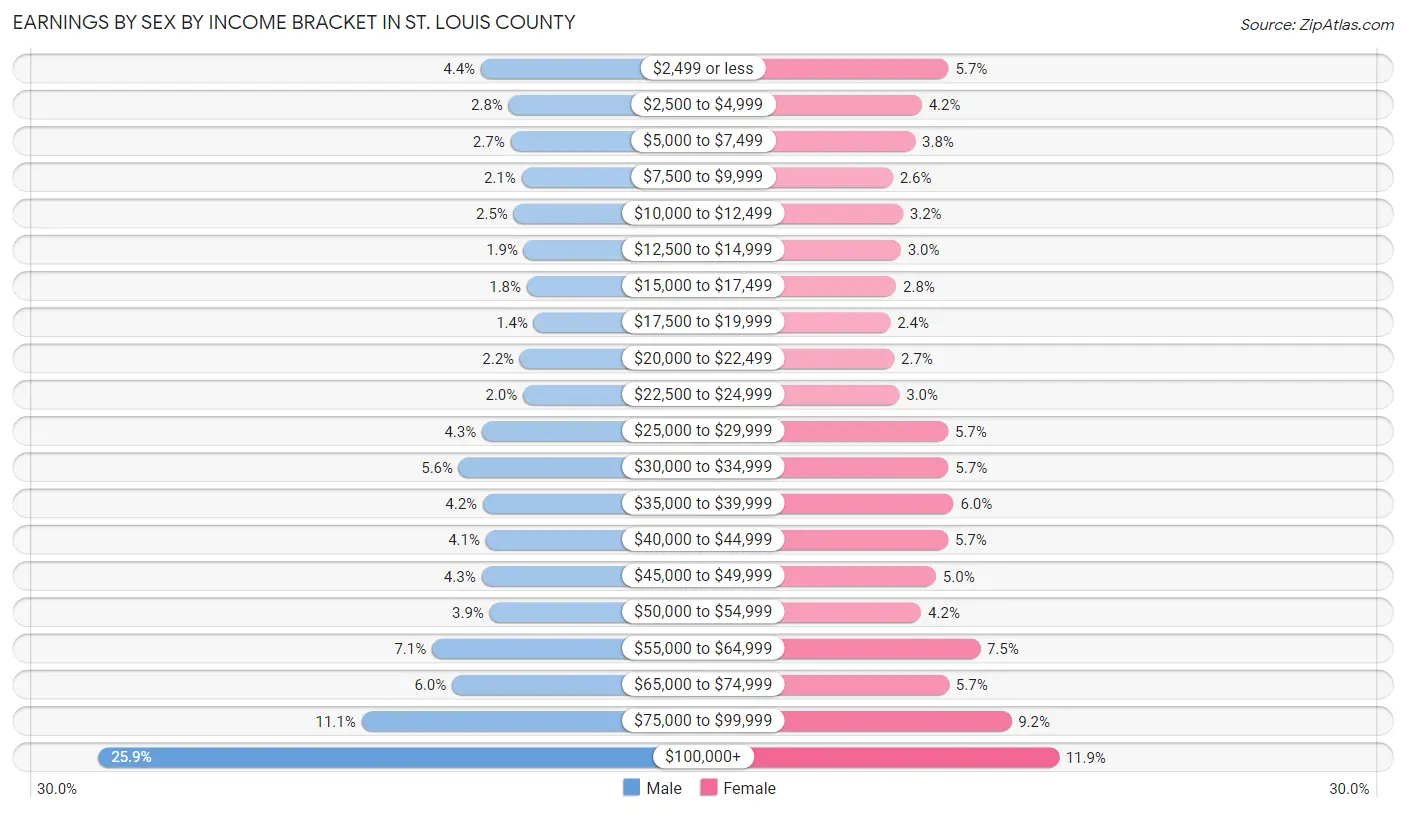
Earnings by Sex by Income Bracket in St. Louis County
The most common earnings brackets in St. Louis County are $100,000+ for men (71,358 | 25.9%) and $100,000+ for women (32,457 | 11.9%).
| Income | Male | Female |
| $2,499 or less | 12,011 (4.3%) | 15,590 (5.7%) |
| $2,500 to $4,999 | 7,695 (2.8%) | 11,469 (4.2%) |
| $5,000 to $7,499 | 7,416 (2.7%) | 10,455 (3.8%) |
| $7,500 to $9,999 | 5,704 (2.1%) | 7,044 (2.6%) |
| $10,000 to $12,499 | 6,936 (2.5%) | 8,595 (3.2%) |
| $12,500 to $14,999 | 5,362 (1.9%) | 8,269 (3.0%) |
| $15,000 to $17,499 | 4,890 (1.8%) | 7,540 (2.8%) |
| $17,500 to $19,999 | 3,802 (1.4%) | 6,645 (2.4%) |
| $20,000 to $22,499 | 5,965 (2.2%) | 7,245 (2.7%) |
| $22,500 to $24,999 | 5,458 (2.0%) | 8,042 (2.9%) |
| $25,000 to $29,999 | 11,841 (4.3%) | 15,518 (5.7%) |
| $30,000 to $34,999 | 15,430 (5.6%) | 15,551 (5.7%) |
| $35,000 to $39,999 | 11,707 (4.2%) | 16,347 (6.0%) |
| $40,000 to $44,999 | 11,253 (4.1%) | 15,519 (5.7%) |
| $45,000 to $49,999 | 11,910 (4.3%) | 13,647 (5.0%) |
| $50,000 to $54,999 | 10,657 (3.9%) | 11,394 (4.2%) |
| $55,000 to $64,999 | 19,590 (7.1%) | 20,409 (7.5%) |
| $65,000 to $74,999 | 16,468 (6.0%) | 15,633 (5.7%) |
| $75,000 to $99,999 | 30,526 (11.1%) | 25,178 (9.2%) |
| $100,000+ | 71,358 (25.9%) | 32,457 (11.9%) |
| Total | 275,979 (100.0%) | 272,547 (100.0%) |
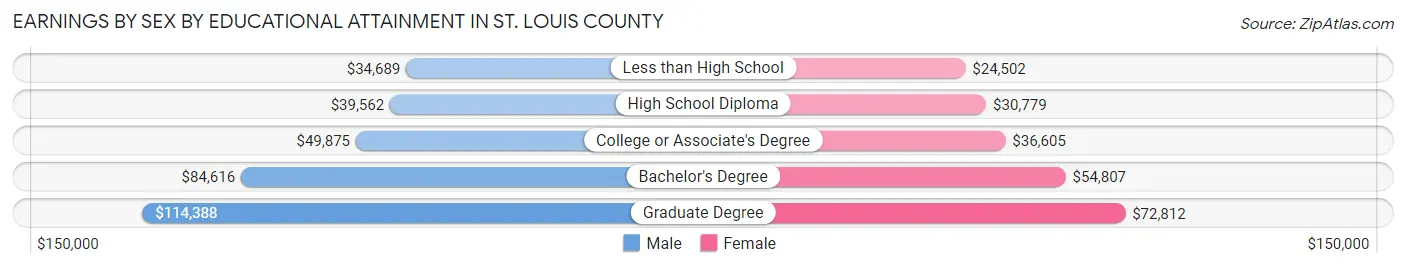
Earnings by Sex by Educational Attainment in St. Louis County
Average earnings in St. Louis County are $63,461 for men and $45,182 for women, a difference of 28.8%. Men with an educational attainment of graduate degree enjoy the highest average annual earnings of $114,388, while those with less than high school education earn the least with $34,689. Women with an educational attainment of graduate degree earn the most with the average annual earnings of $72,812, while those with less than high school education have the smallest earnings of $24,502.
| Educational Attainment | Male Income | Female Income |
| Less than High School | $34,689 | $24,502 |
| High School Diploma | $39,562 | $30,779 |
| College or Associate's Degree | $49,875 | $36,605 |
| Bachelor's Degree | $84,616 | $54,807 |
| Graduate Degree | $114,388 | $72,812 |
| Total | $63,461 | $45,182 |
Family Income in St. Louis County
Family Income Brackets in St. Louis County
According to the St. Louis County family income data, there are 53,634 families falling into the $100,000 to $149,999 income range, which is the most common income bracket and makes up 20.8% of all families. Conversely, the $10,000 to $14,999 income bracket is the least frequent group with only 3,868 families (1.5%) belonging to this category.
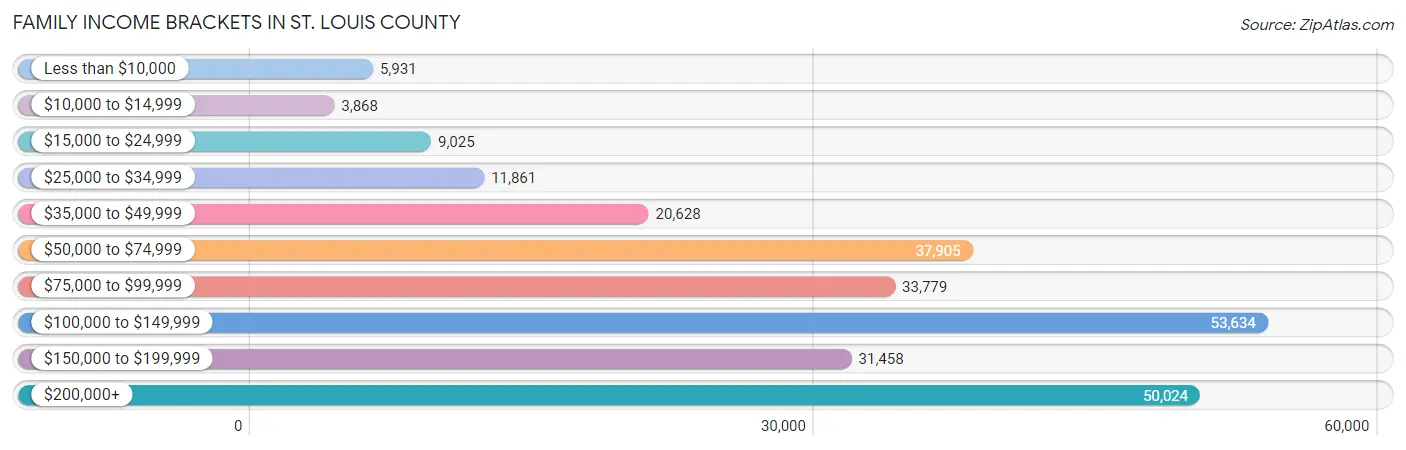
| Income Bracket | # Families | % Families |
| Less than $10,000 | 5,931 | 2.3% |
| $10,000 to $14,999 | 3,868 | 1.5% |
| $15,000 to $24,999 | 9,025 | 3.5% |
| $25,000 to $34,999 | 11,861 | 4.6% |
| $35,000 to $49,999 | 20,628 | 8.0% |
| $50,000 to $74,999 | 37,905 | 14.7% |
| $75,000 to $99,999 | 33,779 | 13.1% |
| $100,000 to $149,999 | 53,634 | 20.8% |
| $150,000 to $199,999 | 31,458 | 12.2% |
| $200,000+ | 50,024 | 19.4% |
Family Income by Famaliy Size in St. Louis County
4-person families (45,932 | 17.8%) account for the highest median family income in St. Louis County with $142,445 per family, while 2-person families (127,841 | 49.6%) have the highest median income of $45,400 per family member.
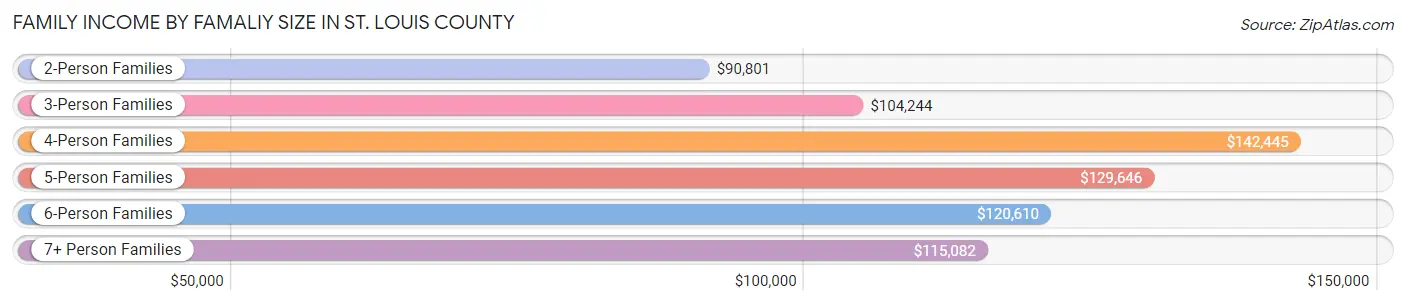
| Income Bracket | # Families | Median Income |
| 2-Person Families | 127,841 (49.6%) | $90,801 |
| 3-Person Families | 58,609 (22.7%) | $104,244 |
| 4-Person Families | 45,932 (17.8%) | $142,445 |
| 5-Person Families | 18,045 (7.0%) | $129,646 |
| 6-Person Families | 5,042 (2.0%) | $120,610 |
| 7+ Person Families | 2,387 (0.9%) | $115,082 |
| Total | 257,856 (100.0%) | $104,371 |
Family Income by Number of Earners in St. Louis County
The median family income in St. Louis County is $104,371, with families comprising 3+ earners (26,985) having the highest median family income of $163,131, while families with no earners (34,881) have the lowest median family income of $61,194, accounting for 10.5% and 13.5% of families, respectively.
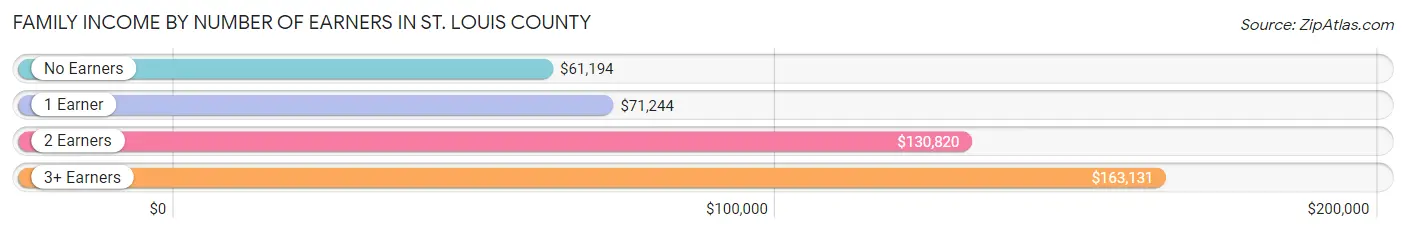
| Number of Earners | # Families | Median Income |
| No Earners | 34,881 (13.5%) | $61,194 |
| 1 Earner | 82,351 (31.9%) | $71,244 |
| 2 Earners | 113,639 (44.1%) | $130,820 |
| 3+ Earners | 26,985 (10.5%) | $163,131 |
| Total | 257,856 (100.0%) | $104,371 |
Household Income in St. Louis County
Household Income Brackets in St. Louis County
With 69,425 households falling in the category, the $100,000 to $149,999 income range is the most frequent in St. Louis County, accounting for 16.8% of all households. In contrast, only 12,397 households (3.0%) fall into the $10,000 to $14,999 income bracket, making it the least populous group.
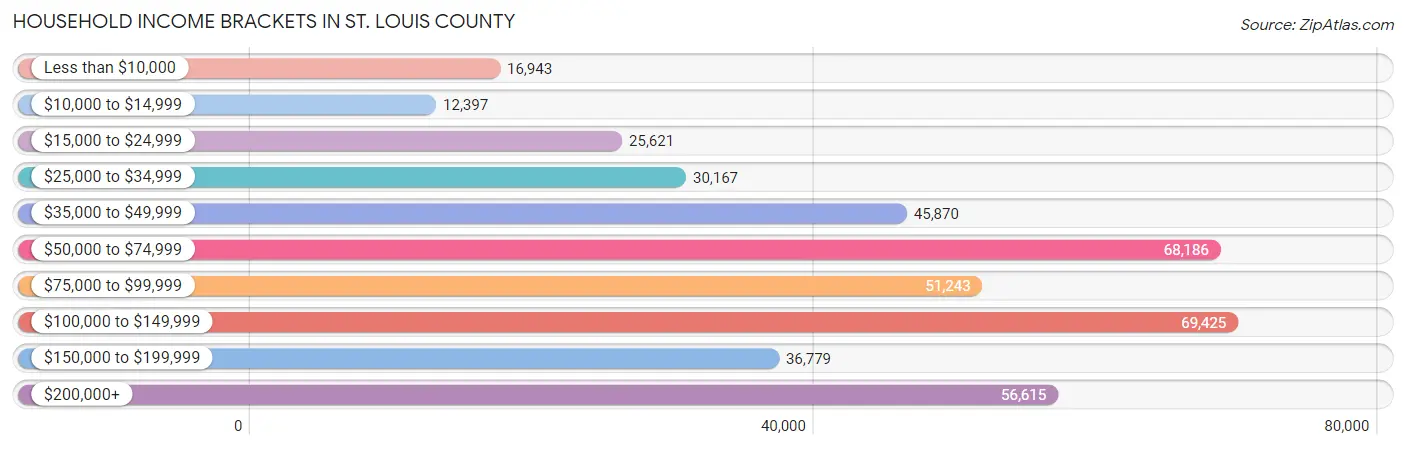
| Income Bracket | # Households | % Households |
| Less than $10,000 | 16,943 | 4.1% |
| $10,000 to $14,999 | 12,397 | 3.0% |
| $15,000 to $24,999 | 25,621 | 6.2% |
| $25,000 to $34,999 | 30,167 | 7.3% |
| $35,000 to $49,999 | 45,870 | 11.1% |
| $50,000 to $74,999 | 68,186 | 16.5% |
| $75,000 to $99,999 | 51,243 | 12.4% |
| $100,000 to $149,999 | 69,425 | 16.8% |
| $150,000 to $199,999 | 36,779 | 8.9% |
| $200,000+ | 56,615 | 13.7% |
Household Income by Householder Age in St. Louis County
The median household income in St. Louis County is $78,067, with the highest median household income of $98,429 found in the 45 to 64 years age bracket for the primary householder. A total of 150,675 households (36.5%) fall into this category. Meanwhile, the 15 to 24 years age bracket for the primary householder has the lowest median household income of $36,440, with 14,742 households (3.6%) in this group.
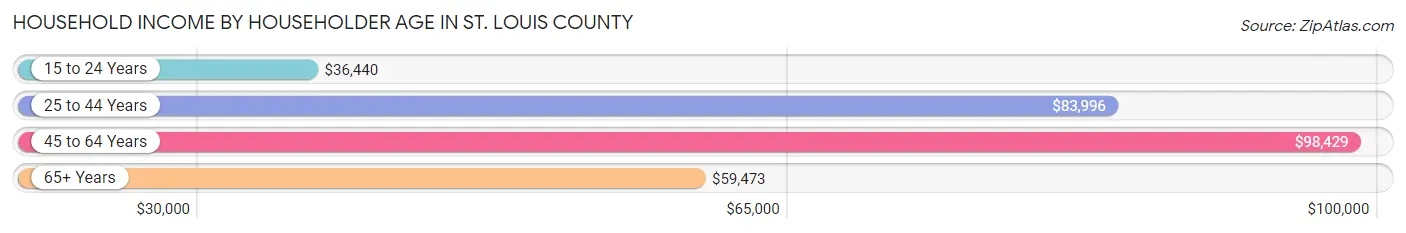
| Income Bracket | # Households | Median Income |
| 15 to 24 Years | 14,742 (3.6%) | $36,440 |
| 25 to 44 Years | 128,942 (31.2%) | $83,996 |
| 45 to 64 Years | 150,675 (36.5%) | $98,429 |
| 65+ Years | 118,888 (28.8%) | $59,473 |
| Total | 413,247 (100.0%) | $78,067 |
Poverty in St. Louis County
Income Below Poverty by Sex and Age in St. Louis County
With 8.5% poverty level for males and 10.6% for females among the residents of St. Louis County, 6 to 11 year old males and 18 to 24 year old females are the most vulnerable to poverty, with 5,246 males (14.6%) and 6,919 females (17.2%) in their respective age groups living below the poverty level.
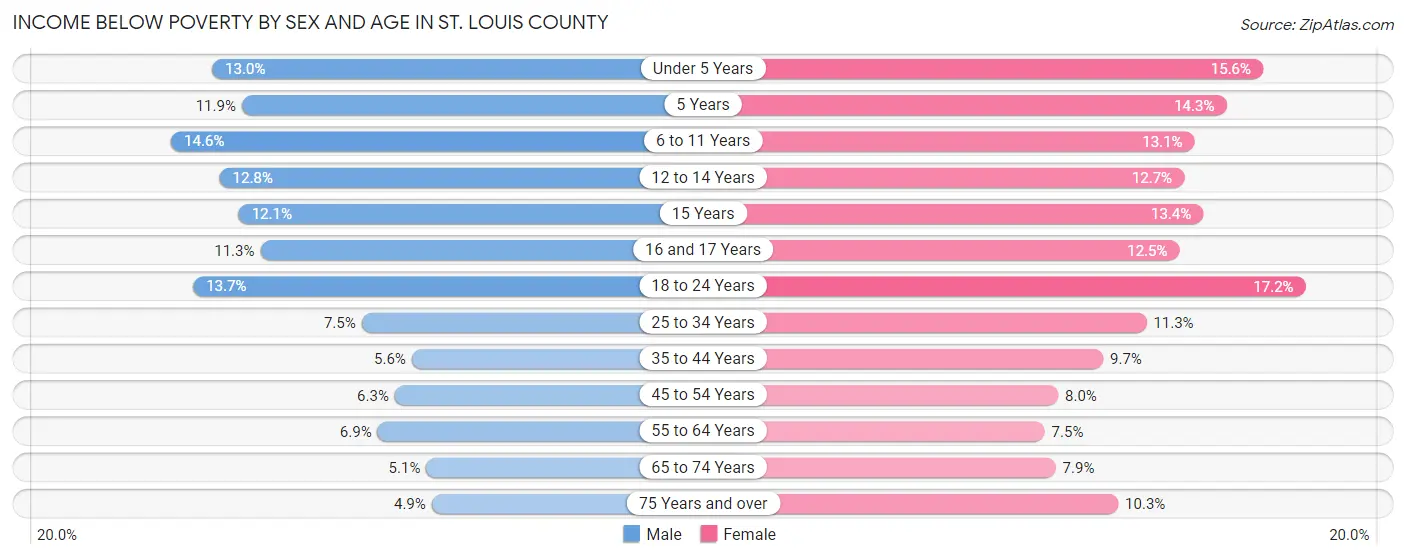
| Age Bracket | Male | Female |
| Under 5 Years | 3,738 (13.0%) | 4,265 (15.6%) |
| 5 Years | 798 (11.9%) | 731 (14.3%) |
| 6 to 11 Years | 5,246 (14.6%) | 4,398 (13.1%) |
| 12 to 14 Years | 2,377 (12.8%) | 2,487 (12.7%) |
| 15 Years | 812 (12.0%) | 812 (13.4%) |
| 16 and 17 Years | 1,454 (11.3%) | 1,630 (12.5%) |
| 18 to 24 Years | 5,518 (13.7%) | 6,919 (17.2%) |
| 25 to 34 Years | 4,604 (7.5%) | 7,322 (11.3%) |
| 35 to 44 Years | 3,366 (5.6%) | 6,217 (9.7%) |
| 45 to 54 Years | 3,548 (6.3%) | 5,026 (8.0%) |
| 55 to 64 Years | 4,453 (6.9%) | 5,413 (7.5%) |
| 65 to 74 Years | 2,384 (5.1%) | 4,535 (7.9%) |
| 75 Years and over | 1,411 (4.9%) | 4,592 (10.3%) |
| Total | 39,709 (8.5%) | 54,347 (10.6%) |
Income Above Poverty by Sex and Age in St. Louis County
According to the poverty statistics in St. Louis County, males aged 75 years and over and females aged 55 to 64 years are the age groups that are most secure financially, with 95.1% of males and 92.5% of females in these age groups living above the poverty line.
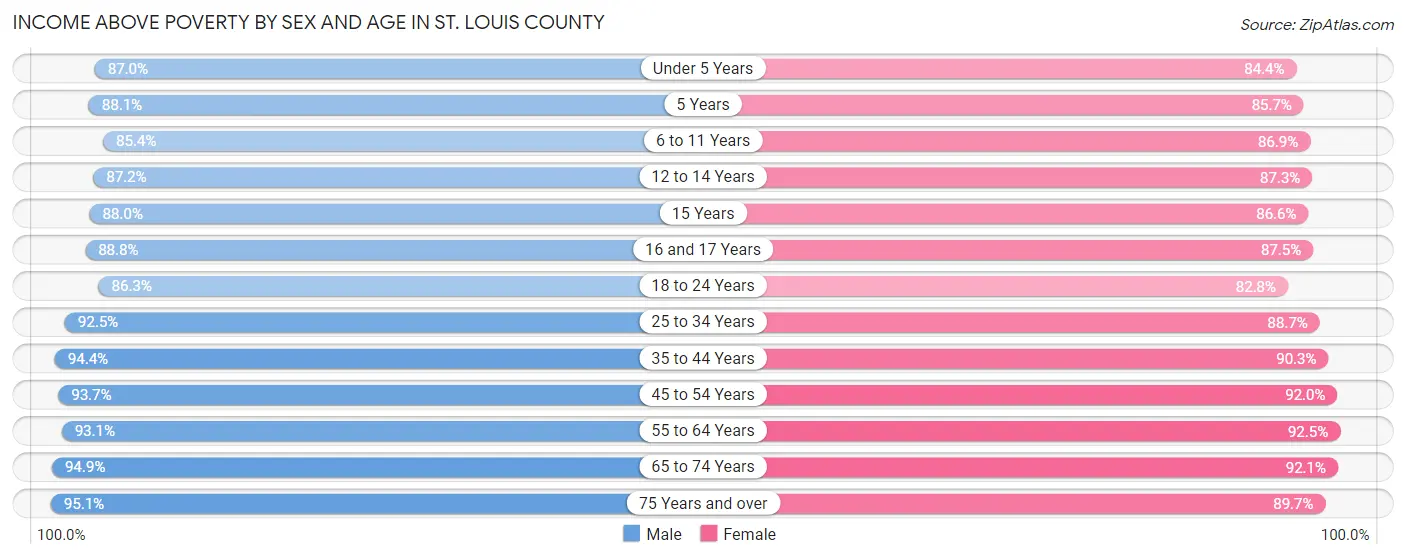
| Age Bracket | Male | Female |
| Under 5 Years | 24,919 (87.0%) | 23,027 (84.4%) |
| 5 Years | 5,884 (88.1%) | 4,392 (85.7%) |
| 6 to 11 Years | 30,787 (85.4%) | 29,190 (86.9%) |
| 12 to 14 Years | 16,248 (87.2%) | 17,094 (87.3%) |
| 15 Years | 5,925 (87.9%) | 5,243 (86.6%) |
| 16 and 17 Years | 11,474 (88.7%) | 11,375 (87.5%) |
| 18 to 24 Years | 34,642 (86.3%) | 33,294 (82.8%) |
| 25 to 34 Years | 56,835 (92.5%) | 57,428 (88.7%) |
| 35 to 44 Years | 56,434 (94.4%) | 57,873 (90.3%) |
| 45 to 54 Years | 53,135 (93.7%) | 57,565 (92.0%) |
| 55 to 64 Years | 60,082 (93.1%) | 66,478 (92.5%) |
| 65 to 74 Years | 44,448 (94.9%) | 52,599 (92.1%) |
| 75 Years and over | 27,434 (95.1%) | 40,179 (89.7%) |
| Total | 428,247 (91.5%) | 455,737 (89.3%) |
Income Below Poverty Among Married-Couple Families in St. Louis County
The poverty statistics for married-couple families in St. Louis County show that 2.4% or 4,471 of the total 187,039 families live below the poverty line. Families with 5 or more children have the highest poverty rate of 11.4%, comprising of 102 families. On the other hand, families with no children have the lowest poverty rate of 1.8%, which includes 2,053 families.
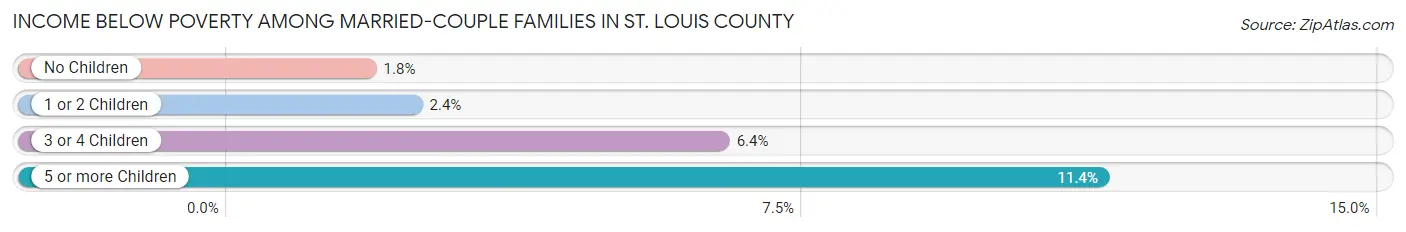
| Children | Above Poverty | Below Poverty |
| No Children | 111,446 (98.2%) | 2,053 (1.8%) |
| 1 or 2 Children | 57,144 (97.6%) | 1,412 (2.4%) |
| 3 or 4 Children | 13,184 (93.6%) | 904 (6.4%) |
| 5 or more Children | 794 (88.6%) | 102 (11.4%) |
| Total | 182,568 (97.6%) | 4,471 (2.4%) |
Income Below Poverty Among Single-Parent Households in St. Louis County
According to the poverty data in St. Louis County, 10.4% or 1,801 single-father households and 20.1% or 10,760 single-mother households are living below the poverty line. Among single-father households, those with 3 or 4 children have the highest poverty rate, with 355 households (25.8%) experiencing poverty. Likewise, among single-mother households, those with 5 or more children have the highest poverty rate, with 223 households (50.3%) falling below the poverty line.
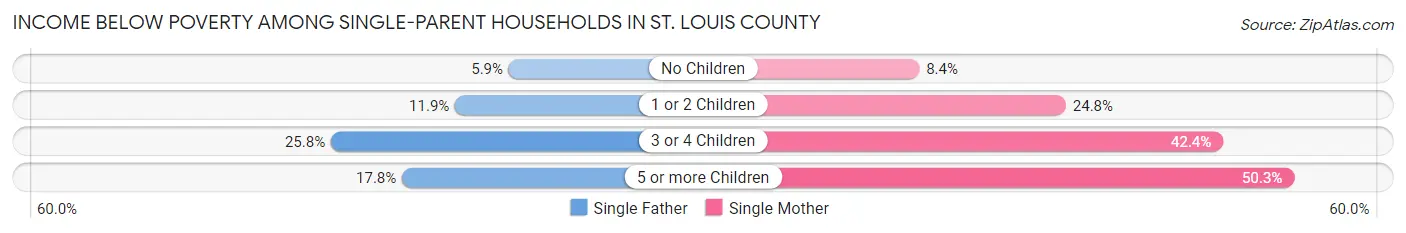
| Children | Single Father | Single Mother |
| No Children | 447 (5.9%) | 1,776 (8.4%) |
| 1 or 2 Children | 986 (11.9%) | 6,771 (24.8%) |
| 3 or 4 Children | 355 (25.8%) | 1,990 (42.4%) |
| 5 or more Children | 13 (17.8%) | 223 (50.3%) |
| Total | 1,801 (10.4%) | 10,760 (20.1%) |
Income Below Poverty Among Married-Couple vs Single-Parent Households in St. Louis County
The poverty data for St. Louis County shows that 4,471 of the married-couple family households (2.4%) and 12,561 of the single-parent households (17.7%) are living below the poverty level. Within the married-couple family households, those with 5 or more children have the highest poverty rate, with 102 households (11.4%) falling below the poverty line. Among the single-parent households, those with 5 or more children have the highest poverty rate, with 236 household (45.7%) living below poverty.
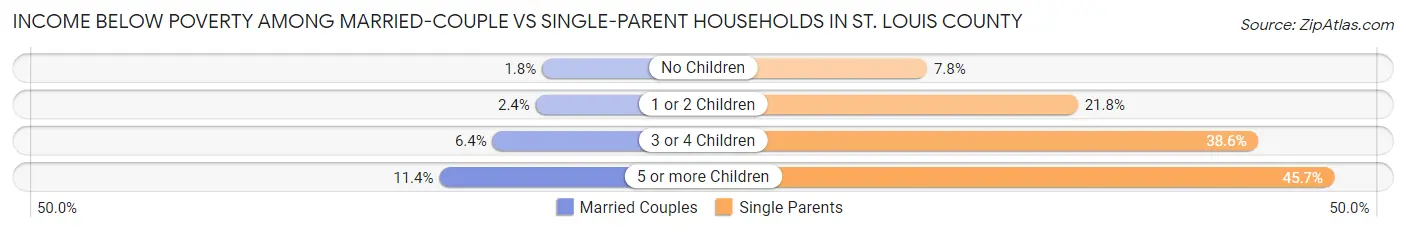
| Children | Married-Couple Families | Single-Parent Households |
| No Children | 2,053 (1.8%) | 2,223 (7.8%) |
| 1 or 2 Children | 1,412 (2.4%) | 7,757 (21.8%) |
| 3 or 4 Children | 904 (6.4%) | 2,345 (38.6%) |
| 5 or more Children | 102 (11.4%) | 236 (45.7%) |
| Total | 4,471 (2.4%) | 12,561 (17.7%) |
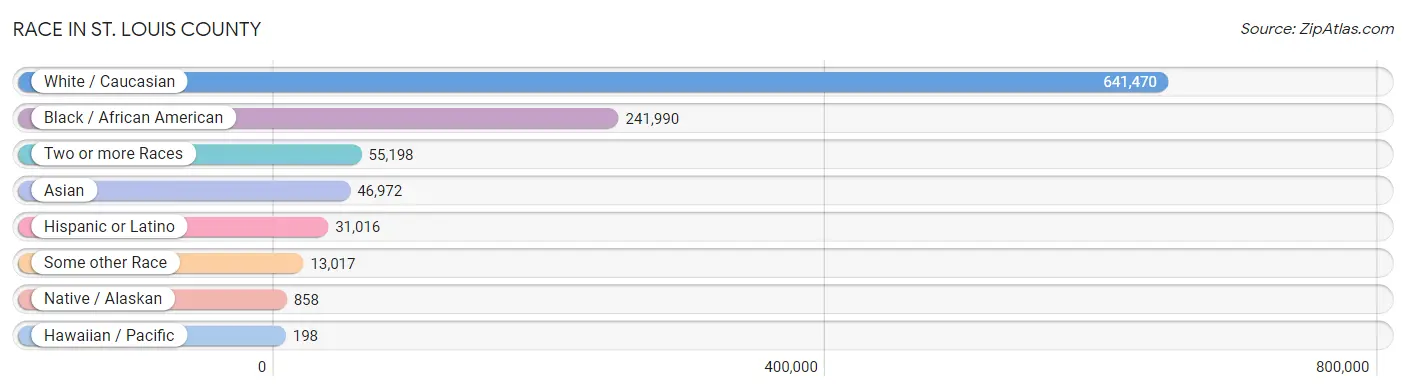
Race in St. Louis County
The most populous races in St. Louis County are White / Caucasian (641,470 | 64.2%), Black / African American (241,990 | 24.2%), and Two or more Races (55,198 | 5.5%).
| Race | # Population | % Population |
| Asian | 46,972 | 4.7% |
| Black / African American | 241,990 | 24.2% |
| Hawaiian / Pacific | 198 | 0.0% |
| Hispanic or Latino | 31,016 | 3.1% |
| Native / Alaskan | 858 | 0.1% |
| White / Caucasian | 641,470 | 64.2% |
| Two or more Races | 55,198 | 5.5% |
| Some other Race | 13,017 | 1.3% |
| Total | 999,703 | 100.0% |
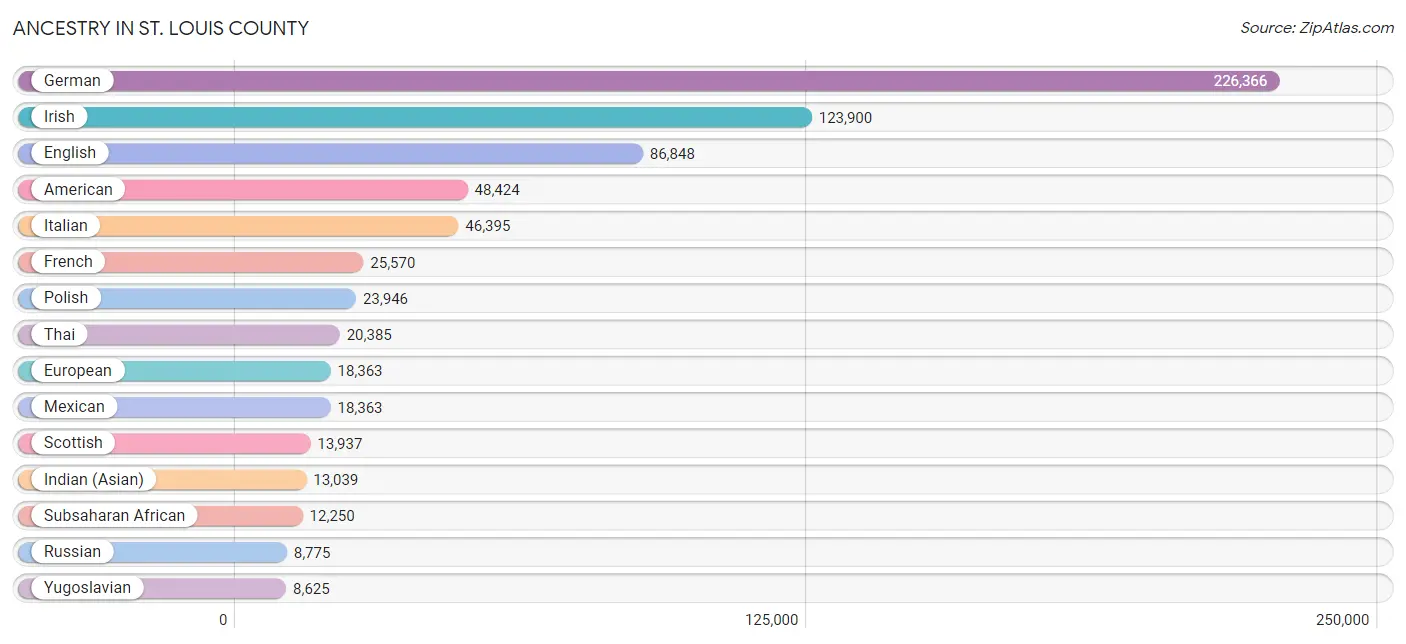
Ancestry in St. Louis County
The most populous ancestries reported in St. Louis County are German (226,366 | 22.6%), Irish (123,900 | 12.4%), English (86,848 | 8.7%), American (48,424 | 4.8%), and Italian (46,395 | 4.6%), together accounting for 53.2% of all St. Louis County residents.
| Ancestry | # Population | % Population |
| Afghan | 562 | 0.1% |
| African | 5,672 | 0.6% |
| Albanian | 1,334 | 0.1% |
| Alsatian | 69 | 0.0% |
| American | 48,424 | 4.8% |
| Apache | 158 | 0.0% |
| Arab | 6,181 | 0.6% |
| Arapaho | 5 | 0.0% |
| Argentinean | 246 | 0.0% |
| Armenian | 746 | 0.1% |
| Assyrian / Chaldean / Syriac | 5 | 0.0% |
| Australian | 271 | 0.0% |
| Austrian | 2,985 | 0.3% |
| Bahamian | 11 | 0.0% |
| Bangladeshi | 44 | 0.0% |
| Barbadian | 51 | 0.0% |
| Basque | 21 | 0.0% |
| Belgian | 842 | 0.1% |
| Belizean | 28 | 0.0% |
| Bhutanese | 2,003 | 0.2% |
| Blackfeet | 707 | 0.1% |
| Bolivian | 52 | 0.0% |
| Brazilian | 500 | 0.1% |
| British | 5,097 | 0.5% |
| British West Indian | 53 | 0.0% |
| Bulgarian | 883 | 0.1% |
| Burmese | 3,768 | 0.4% |
| Cajun | 71 | 0.0% |
| Cambodian | 62 | 0.0% |
| Canadian | 1,247 | 0.1% |
| Carpatho Rusyn | 2 | 0.0% |
| Celtic | 2 | 0.0% |
| Central American | 2,903 | 0.3% |
| Central American Indian | 226 | 0.0% |
| Cherokee | 2,027 | 0.2% |
| Cheyenne | 11 | 0.0% |
| Chickasaw | 40 | 0.0% |
| Chilean | 790 | 0.1% |
| Chinese | 15 | 0.0% |
| Chippewa | 140 | 0.0% |
| Choctaw | 568 | 0.1% |
| Colombian | 937 | 0.1% |
| Comanche | 44 | 0.0% |
| Costa Rican | 122 | 0.0% |
| Cree | 5 | 0.0% |
| Creek | 98 | 0.0% |
| Croatian | 2,855 | 0.3% |
| Crow | 15 | 0.0% |
| Cuban | 1,016 | 0.1% |
| Czech | 5,085 | 0.5% |
| Czechoslovakian | 802 | 0.1% |
| Danish | 2,014 | 0.2% |
| Delaware | 24 | 0.0% |
| Dominican | 275 | 0.0% |
| Dutch | 8,268 | 0.8% |
| Dutch West Indian | 6 | 0.0% |
| Eastern European | 4,073 | 0.4% |
| Ecuadorian | 194 | 0.0% |
| Egyptian | 237 | 0.0% |
| English | 86,848 | 8.7% |
| Estonian | 2 | 0.0% |
| Ethiopian | 747 | 0.1% |
| European | 18,363 | 1.8% |
| Filipino | 1,283 | 0.1% |
| Finnish | 752 | 0.1% |
| French | 25,570 | 2.6% |
| French American Indian | 34 | 0.0% |
| French Canadian | 1,719 | 0.2% |
| German | 226,366 | 22.6% |
| German Russian | 36 | 0.0% |
| Ghanaian | 450 | 0.1% |
| Greek | 4,308 | 0.4% |
| Guamanian / Chamorro | 47 | 0.0% |
| Guatemalan | 1,187 | 0.1% |
| Guyanese | 5 | 0.0% |
| Haitian | 417 | 0.0% |
| Hmong | 15 | 0.0% |
| Honduran | 983 | 0.1% |
| Hungarian | 4,200 | 0.4% |
| Icelander | 50 | 0.0% |
| Indian (Asian) | 13,039 | 1.3% |
| Indonesian | 167 | 0.0% |
| Inupiat | 27 | 0.0% |
| Iranian | 772 | 0.1% |
| Iraqi | 448 | 0.0% |
| Irish | 123,900 | 12.4% |
| Iroquois | 68 | 0.0% |
| Israeli | 420 | 0.0% |
| Italian | 46,395 | 4.6% |
| Jamaican | 998 | 0.1% |
| Japanese | 120 | 0.0% |
| Jordanian | 336 | 0.0% |
| Kenyan | 1,677 | 0.2% |
| Korean | 5,590 | 0.6% |
| Laotian | 278 | 0.0% |
| Latvian | 239 | 0.0% |
| Lebanese | 1,459 | 0.2% |
| Liberian | 387 | 0.0% |
| Lithuanian | 1,776 | 0.2% |
| Luxembourger | 93 | 0.0% |
| Macedonian | 179 | 0.0% |
| Malaysian | 330 | 0.0% |
| Maltese | 97 | 0.0% |
| Marshallese | 5 | 0.0% |
| Mexican | 18,363 | 1.8% |
| Mexican American Indian | 284 | 0.0% |
| Mongolian | 160 | 0.0% |
| Moroccan | 266 | 0.0% |
| Native Hawaiian | 352 | 0.0% |
| Navajo | 15 | 0.0% |
| New Zealander | 20 | 0.0% |
| Nicaraguan | 203 | 0.0% |
| Nigerian | 1,479 | 0.2% |
| Northern European | 1,699 | 0.2% |
| Norwegian | 5,725 | 0.6% |
| Okinawan | 9 | 0.0% |
| Osage | 159 | 0.0% |
| Ottawa | 14 | 0.0% |
| Paiute | 21 | 0.0% |
| Pakistani | 674 | 0.1% |
| Palestinian | 713 | 0.1% |
| Panamanian | 57 | 0.0% |
| Paraguayan | 53 | 0.0% |
| Pennsylvania German | 136 | 0.0% |
| Peruvian | 455 | 0.1% |
| Polish | 23,946 | 2.4% |
| Portuguese | 876 | 0.1% |
| Potawatomi | 96 | 0.0% |
| Pueblo | 16 | 0.0% |
| Puerto Rican | 1,960 | 0.2% |
| Romanian | 1,323 | 0.1% |
| Russian | 8,775 | 0.9% |
| Salvadoran | 351 | 0.0% |
| Samoan | 220 | 0.0% |
| Scandinavian | 2,399 | 0.2% |
| Scotch-Irish | 7,145 | 0.7% |
| Scottish | 13,937 | 1.4% |
| Seminole | 28 | 0.0% |
| Senegalese | 277 | 0.0% |
| Serbian | 753 | 0.1% |
| Sierra Leonean | 120 | 0.0% |
| Sioux | 126 | 0.0% |
| Slavic | 433 | 0.0% |
| Slovak | 1,492 | 0.2% |
| Slovene | 437 | 0.0% |
| Somali | 276 | 0.0% |
| South African | 157 | 0.0% |
| South American | 3,349 | 0.3% |
| South American Indian | 115 | 0.0% |
| Spaniard | 1,072 | 0.1% |
| Spanish | 721 | 0.1% |
| Sri Lankan | 4,912 | 0.5% |
| Subsaharan African | 12,250 | 1.2% |
| Sudanese | 53 | 0.0% |
| Swedish | 6,834 | 0.7% |
| Swiss | 3,584 | 0.4% |
| Syrian | 965 | 0.1% |
| Taiwanese | 10 | 0.0% |
| Thai | 20,385 | 2.0% |
| Tlingit-Haida | 2 | 0.0% |
| Trinidadian and Tobagonian | 110 | 0.0% |
| Turkish | 849 | 0.1% |
| U.S. Virgin Islander | 12 | 0.0% |
| Ugandan | 59 | 0.0% |
| Ukrainian | 2,012 | 0.2% |
| Uruguayan | 35 | 0.0% |
| Ute | 6 | 0.0% |
| Venezuelan | 587 | 0.1% |
| Vietnamese | 170 | 0.0% |
| Welsh | 5,042 | 0.5% |
| West Indian | 152 | 0.0% |
| Yugoslavian | 8,625 | 0.9% |
| Zimbabwean | 30 | 0.0% | View All 173 Rows |
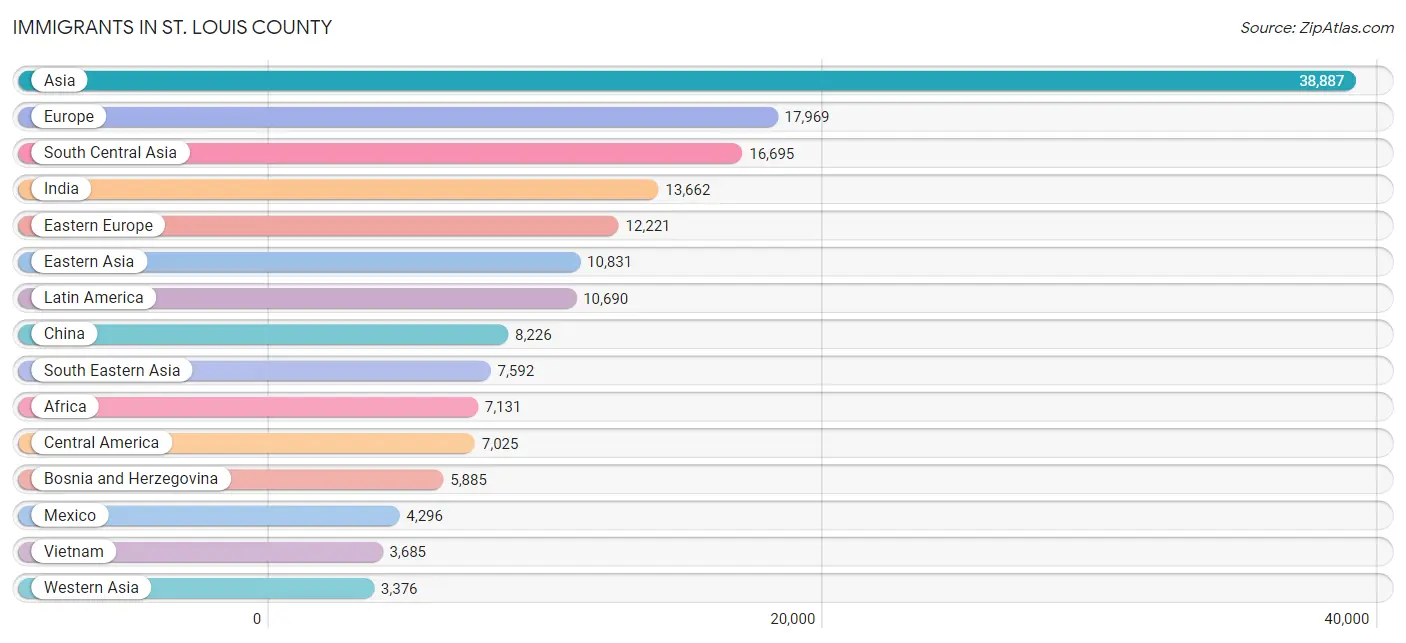
Immigrants in St. Louis County
The most numerous immigrant groups reported in St. Louis County came from Asia (38,887 | 3.9%), Europe (17,969 | 1.8%), South Central Asia (16,695 | 1.7%), India (13,662 | 1.4%), and Eastern Europe (12,221 | 1.2%), together accounting for 10.0% of all St. Louis County residents.
| Immigration Origin | # Population | % Population |
| Afghanistan | 577 | 0.1% |
| Africa | 7,131 | 0.7% |
| Albania | 908 | 0.1% |
| Argentina | 233 | 0.0% |
| Asia | 38,887 | 3.9% |
| Australia | 338 | 0.0% |
| Austria | 110 | 0.0% |
| Bangladesh | 149 | 0.0% |
| Belarus | 542 | 0.1% |
| Belgium | 68 | 0.0% |
| Belize | 66 | 0.0% |
| Bolivia | 74 | 0.0% |
| Bosnia and Herzegovina | 5,885 | 0.6% |
| Brazil | 528 | 0.1% |
| Bulgaria | 611 | 0.1% |
| Cambodia | 47 | 0.0% |
| Canada | 1,548 | 0.2% |
| Caribbean | 1,307 | 0.1% |
| Central America | 7,025 | 0.7% |
| Chile | 176 | 0.0% |
| China | 8,226 | 0.8% |
| Colombia | 729 | 0.1% |
| Congo | 117 | 0.0% |
| Costa Rica | 100 | 0.0% |
| Croatia | 324 | 0.0% |
| Cuba | 116 | 0.0% |
| Czechoslovakia | 169 | 0.0% |
| Denmark | 63 | 0.0% |
| Dominican Republic | 27 | 0.0% |
| Eastern Africa | 3,195 | 0.3% |
| Eastern Asia | 10,831 | 1.1% |
| Eastern Europe | 12,221 | 1.2% |
| Ecuador | 31 | 0.0% |
| Egypt | 168 | 0.0% |
| El Salvador | 199 | 0.0% |
| England | 921 | 0.1% |
| Eritrea | 83 | 0.0% |
| Ethiopia | 752 | 0.1% |
| Europe | 17,969 | 1.8% |
| Fiji | 17 | 0.0% |
| France | 553 | 0.1% |
| Germany | 1,721 | 0.2% |
| Ghana | 362 | 0.0% |
| Greece | 272 | 0.0% |
| Guatemala | 739 | 0.1% |
| Guyana | 5 | 0.0% |
| Haiti | 234 | 0.0% |
| Honduras | 1,357 | 0.1% |
| Hong Kong | 433 | 0.0% |
| Hungary | 154 | 0.0% |
| India | 13,662 | 1.4% |
| Indonesia | 276 | 0.0% |
| Iran | 525 | 0.1% |
| Iraq | 845 | 0.1% |
| Ireland | 143 | 0.0% |
| Israel | 300 | 0.0% |
| Italy | 613 | 0.1% |
| Jamaica | 712 | 0.1% |
| Japan | 383 | 0.0% |
| Jordan | 315 | 0.0% |
| Kazakhstan | 48 | 0.0% |
| Kenya | 1,858 | 0.2% |
| Korea | 2,189 | 0.2% |
| Kuwait | 105 | 0.0% |
| Laos | 155 | 0.0% |
| Latin America | 10,690 | 1.1% |
| Latvia | 11 | 0.0% |
| Lebanon | 65 | 0.0% |
| Liberia | 425 | 0.0% |
| Lithuania | 38 | 0.0% |
| Malaysia | 161 | 0.0% |
| Mexico | 4,296 | 0.4% |
| Micronesia | 5 | 0.0% |
| Middle Africa | 711 | 0.1% |
| Moldova | 68 | 0.0% |
| Morocco | 100 | 0.0% |
| Nepal | 248 | 0.0% |
| Netherlands | 55 | 0.0% |
| Nicaragua | 164 | 0.0% |
| Nigeria | 1,041 | 0.1% |
| North Macedonia | 15 | 0.0% |
| Northern Africa | 461 | 0.1% |
| Northern Europe | 1,808 | 0.2% |
| Norway | 1 | 0.0% |
| Oceania | 420 | 0.0% |
| Pakistan | 1,203 | 0.1% |
| Panama | 104 | 0.0% |
| Peru | 266 | 0.0% |
| Philippines | 2,664 | 0.3% |
| Poland | 355 | 0.0% |
| Romania | 306 | 0.0% |
| Russia | 1,450 | 0.2% |
| Saudi Arabia | 450 | 0.1% |
| Scotland | 64 | 0.0% |
| Senegal | 171 | 0.0% |
| Serbia | 95 | 0.0% |
| Singapore | 39 | 0.0% |
| Somalia | 108 | 0.0% |
| South Africa | 404 | 0.0% |
| South America | 2,358 | 0.2% |
| South Central Asia | 16,695 | 1.7% |
| South Eastern Asia | 7,592 | 0.8% |
| Southern Europe | 1,091 | 0.1% |
| Spain | 206 | 0.0% |
| Sri Lanka | 88 | 0.0% |
| Sudan | 27 | 0.0% |
| Sweden | 95 | 0.0% |
| Switzerland | 116 | 0.0% |
| Syria | 794 | 0.1% |
| Taiwan | 690 | 0.1% |
| Thailand | 383 | 0.0% |
| Trinidad and Tobago | 126 | 0.0% |
| Turkey | 324 | 0.0% |
| Uganda | 183 | 0.0% |
| Ukraine | 497 | 0.1% |
| Uruguay | 35 | 0.0% |
| Uzbekistan | 156 | 0.0% |
| Venezuela | 265 | 0.0% |
| Vietnam | 3,685 | 0.4% |
| Western Africa | 2,288 | 0.2% |
| Western Asia | 3,376 | 0.3% |
| Western Europe | 2,623 | 0.3% |
| Zaire | 594 | 0.1% |
| Zimbabwe | 166 | 0.0% | View All 124 Rows |
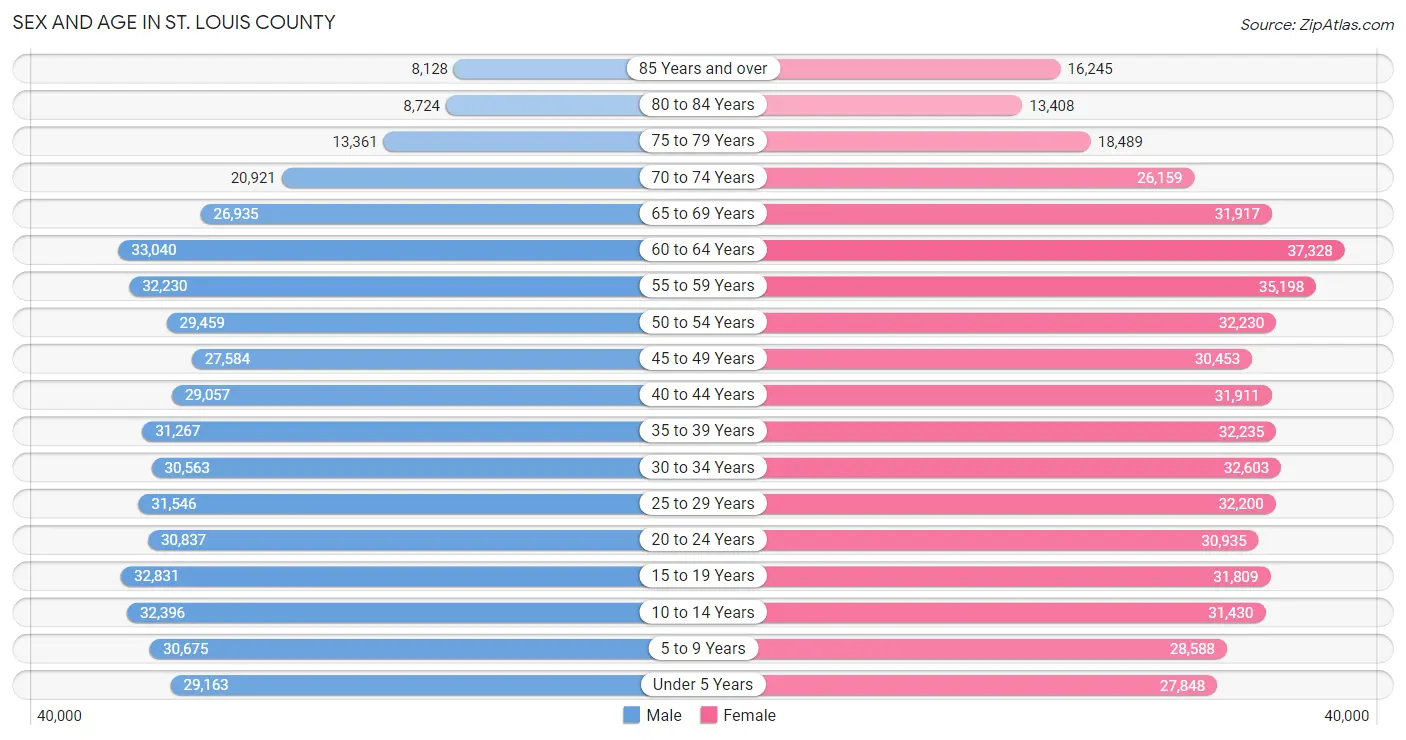
Sex and Age in St. Louis County
Sex and Age in St. Louis County
The most populous age groups in St. Louis County are 60 to 64 Years (33,040 | 6.9%) for men and 60 to 64 Years (37,328 | 7.2%) for women.
| Age Bracket | Male | Female |
| Under 5 Years | 29,163 (6.1%) | 27,848 (5.3%) |
| 5 to 9 Years | 30,675 (6.4%) | 28,588 (5.5%) |
| 10 to 14 Years | 32,396 (6.8%) | 31,430 (6.0%) |
| 15 to 19 Years | 32,831 (6.9%) | 31,809 (6.1%) |
| 20 to 24 Years | 30,837 (6.4%) | 30,935 (5.9%) |
| 25 to 29 Years | 31,546 (6.6%) | 32,200 (6.2%) |
| 30 to 34 Years | 30,563 (6.4%) | 32,603 (6.3%) |
| 35 to 39 Years | 31,267 (6.5%) | 32,235 (6.2%) |
| 40 to 44 Years | 29,057 (6.1%) | 31,911 (6.1%) |
| 45 to 49 Years | 27,584 (5.8%) | 30,453 (5.9%) |
| 50 to 54 Years | 29,459 (6.1%) | 32,230 (6.2%) |
| 55 to 59 Years | 32,230 (6.7%) | 35,198 (6.8%) |
| 60 to 64 Years | 33,040 (6.9%) | 37,328 (7.2%) |
| 65 to 69 Years | 26,935 (5.6%) | 31,917 (6.1%) |
| 70 to 74 Years | 20,921 (4.4%) | 26,159 (5.0%) |
| 75 to 79 Years | 13,361 (2.8%) | 18,489 (3.5%) |
| 80 to 84 Years | 8,724 (1.8%) | 13,408 (2.6%) |
| 85 Years and over | 8,128 (1.7%) | 16,245 (3.1%) |
| Total | 478,717 (100.0%) | 520,986 (100.0%) |
Families and Households in St. Louis County
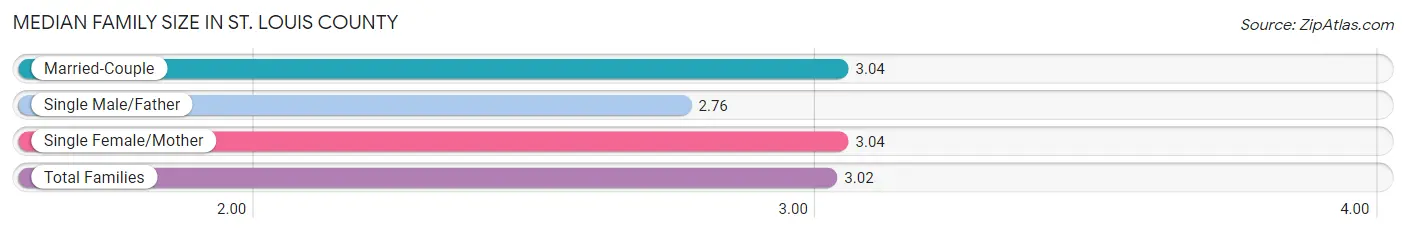
Median Family Size in St. Louis County
The median family size in St. Louis County is 3.02 persons per family, with married-couple families (187,039 | 72.5%) accounting for the largest median family size of 3.04 persons per family. On the other hand, single male/father families (17,355 | 6.7%) represent the smallest median family size with 2.76 persons per family.
| Family Type | # Families | Family Size |
| Married-Couple | 187,039 (72.5%) | 3.04 |
| Single Male/Father | 17,355 (6.7%) | 2.76 |
| Single Female/Mother | 53,462 (20.7%) | 3.04 |
| Total Families | 257,856 (100.0%) | 3.02 |
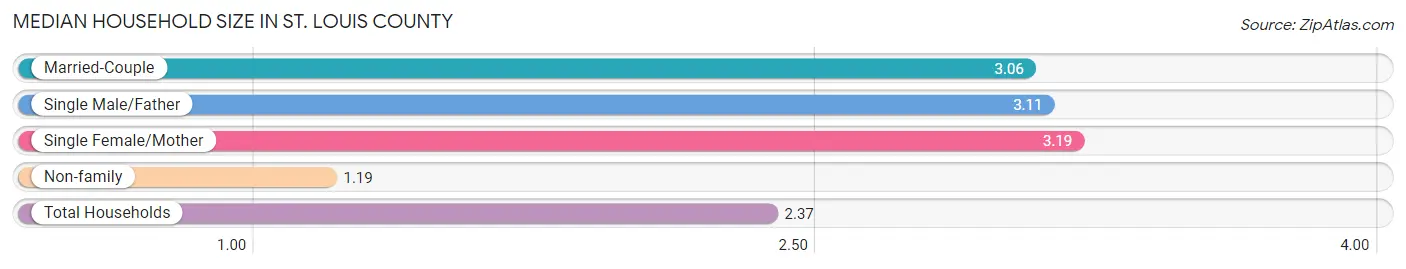
Median Household Size in St. Louis County
The median household size in St. Louis County is 2.37 persons per household, with single female/mother households (53,462 | 12.9%) accounting for the largest median household size of 3.19 persons per household. non-family households (155,391 | 37.6%) represent the smallest median household size with 1.19 persons per household.
| Household Type | # Households | Household Size |
| Married-Couple | 187,039 (45.3%) | 3.06 |
| Single Male/Father | 17,355 (4.2%) | 3.11 |
| Single Female/Mother | 53,462 (12.9%) | 3.19 |
| Non-family | 155,391 (37.6%) | 1.19 |
| Total Households | 413,247 (100.0%) | 2.37 |
Household Size by Marriage Status in St. Louis County
Out of a total of 413,247 households in St. Louis County, 257,856 (62.4%) are family households, while 155,391 (37.6%) are nonfamily households. The most numerous type of family households are 2-person households, comprising 121,715, and the most common type of nonfamily households are 1-person households, comprising 131,549.
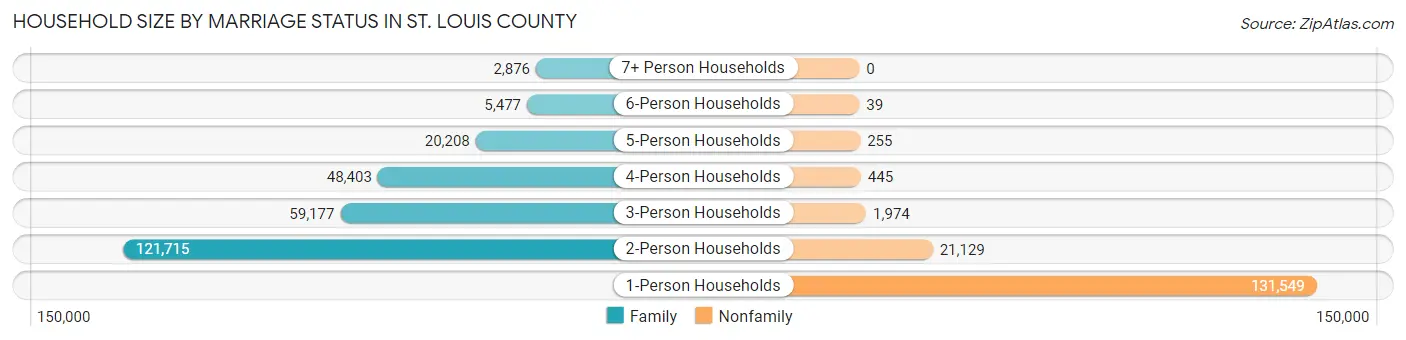
| Household Size | Family Households | Nonfamily Households |
| 1-Person Households | - | 131,549 (31.8%) |
| 2-Person Households | 121,715 (29.4%) | 21,129 (5.1%) |
| 3-Person Households | 59,177 (14.3%) | 1,974 (0.5%) |
| 4-Person Households | 48,403 (11.7%) | 445 (0.1%) |
| 5-Person Households | 20,208 (4.9%) | 255 (0.1%) |
| 6-Person Households | 5,477 (1.3%) | 39 (0.0%) |
| 7+ Person Households | 2,876 (0.7%) | 0 (0.0%) |
| Total | 257,856 (62.4%) | 155,391 (37.6%) |
Female Fertility in St. Louis County
Fertility by Age in St. Louis County
Average fertility rate in St. Louis County is 50.0 births per 1,000 women. Women in the age bracket of 20 to 34 years have the highest fertility rate with 89.0 births per 1,000 women. Women in the age bracket of 20 to 34 years acount for 74.8% of all women with births.
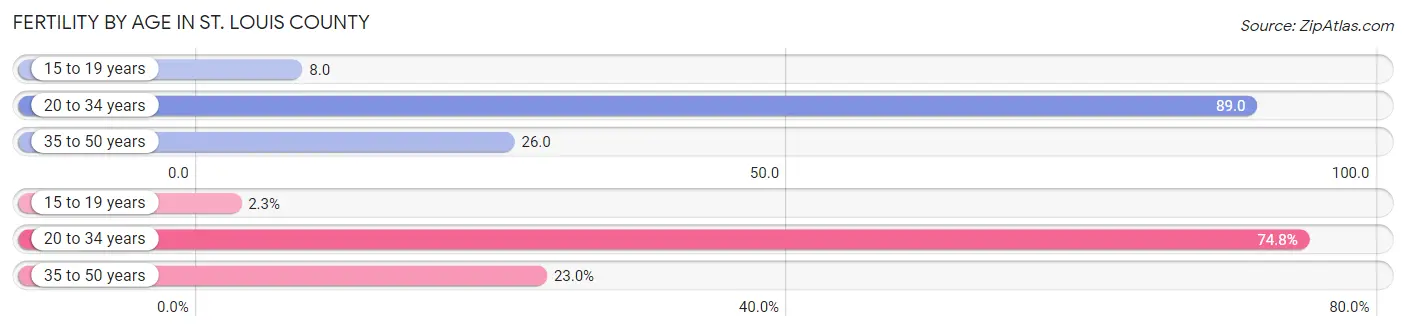
| Age Bracket | Women with Births | Births / 1,000 Women |
| 15 to 19 years | 255 (2.2%) | 8.0 |
| 20 to 34 years | 8,488 (74.8%) | 89.0 |
| 35 to 50 years | 2,612 (23.0%) | 26.0 |
| Total | 11,355 (100.0%) | 50.0 |
Fertility by Age by Marriage Status in St. Louis County
71.5% of women with births (11,355) in St. Louis County are married. The highest percentage of unmarried women with births falls into 15 to 19 years age bracket with 92.9% of them unmarried at the time of birth, while the lowest percentage of unmarried women with births belong to 35 to 50 years age bracket with 13.7% of them unmarried.
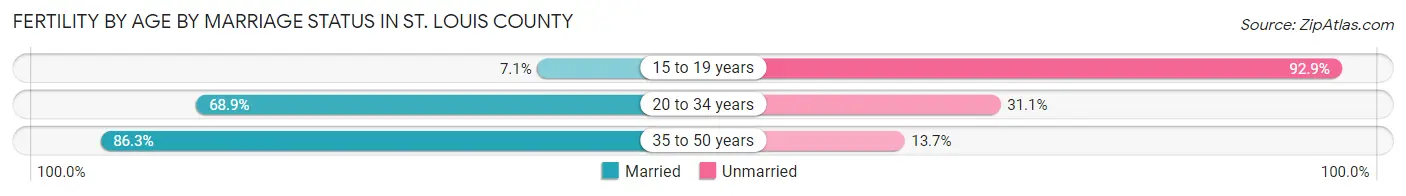
| Age Bracket | Married | Unmarried |
| 15 to 19 years | 18 (7.1%) | 237 (92.9%) |
| 20 to 34 years | 5,848 (68.9%) | 2,640 (31.1%) |
| 35 to 50 years | 2,254 (86.3%) | 358 (13.7%) |
| Total | 8,119 (71.5%) | 3,236 (28.5%) |
Fertility by Education in St. Louis County
Average fertility rate in St. Louis County is 50.0 births per 1,000 women. Women with the education attainment of graduate degree have the highest fertility rate of 71.0 births per 1,000 women, while women with the education attainment of less than high school have the lowest fertility at 22.0 births per 1,000 women. Women with the education attainment of bachelor's degree represent 28.0% of all women with births.
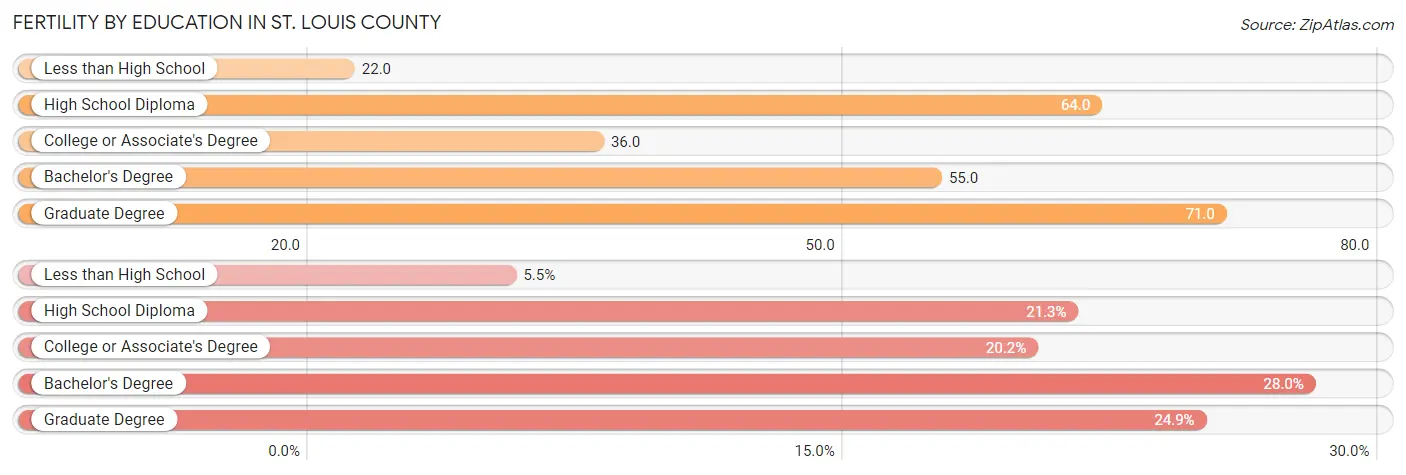
| Educational Attainment | Women with Births | Births / 1,000 Women |
| Less than High School | 629 (5.5%) | 22.0 |
| High School Diploma | 2,422 (21.3%) | 64.0 |
| College or Associate's Degree | 2,294 (20.2%) | 36.0 |
| Bachelor's Degree | 3,179 (28.0%) | 55.0 |
| Graduate Degree | 2,831 (24.9%) | 71.0 |
| Total | 11,355 (100.0%) | 50.0 |
Fertility by Education by Marriage Status in St. Louis County
28.5% of women with births in St. Louis County are unmarried. Women with the educational attainment of graduate degree are most likely to be married with 95.3% of them married at childbirth, while women with the educational attainment of high school diploma are least likely to be married with 69.4% of them unmarried at childbirth.
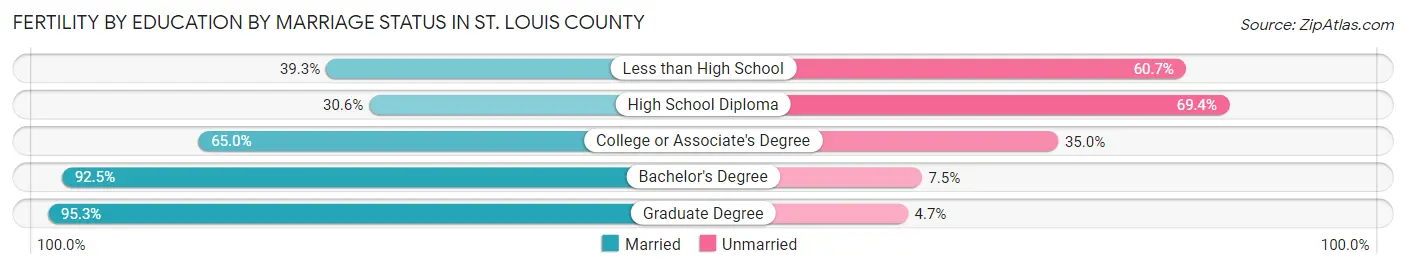
| Educational Attainment | Married | Unmarried |
| Less than High School | 247 (39.3%) | 382 (60.7%) |
| High School Diploma | 741 (30.6%) | 1,681 (69.4%) |
| College or Associate's Degree | 1,491 (65.0%) | 803 (35.0%) |
| Bachelor's Degree | 2,941 (92.5%) | 238 (7.5%) |
| Graduate Degree | 2,698 (95.3%) | 133 (4.7%) |
| Total | 8,119 (71.5%) | 3,236 (28.5%) |
Employment Characteristics in St. Louis County
Employment by Class of Employer in St. Louis County
Among the 491,731 employed individuals in St. Louis County, private company employees (335,074 | 68.1%), not-for-profit organizations (65,129 | 13.2%), and local government employees (26,000 | 5.3%) make up the most common classes of employment.
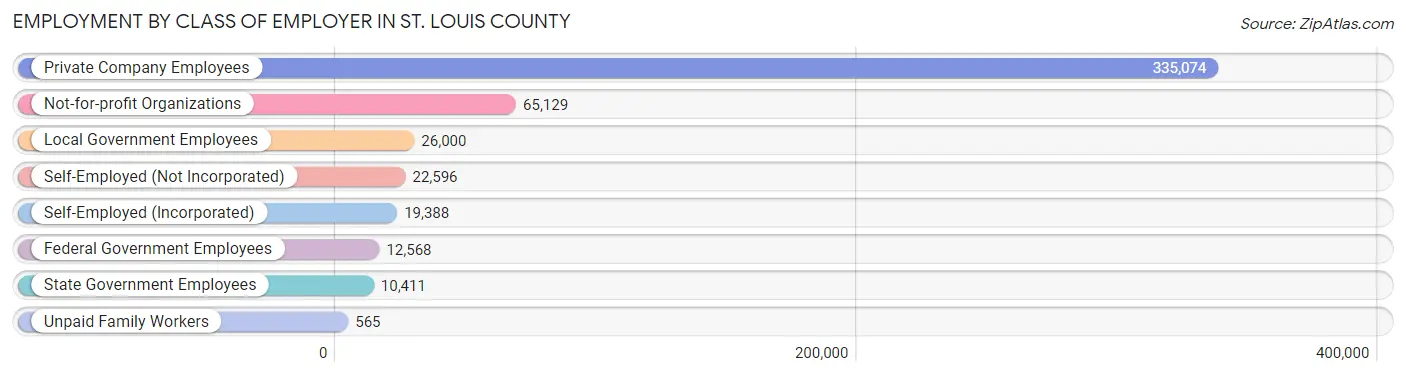
| Employer Class | # Employees | % Employees |
| Private Company Employees | 335,074 | 68.1% |
| Self-Employed (Incorporated) | 19,388 | 3.9% |
| Self-Employed (Not Incorporated) | 22,596 | 4.6% |
| Not-for-profit Organizations | 65,129 | 13.2% |
| Local Government Employees | 26,000 | 5.3% |
| State Government Employees | 10,411 | 2.1% |
| Federal Government Employees | 12,568 | 2.6% |
| Unpaid Family Workers | 565 | 0.1% |
| Total | 491,731 | 100.0% |
Employment Status by Age in St. Louis County
According to the labor force statistics for St. Louis County, out of the total population over 16 years of age (806,710), 64.8% or 522,748 individuals are in the labor force, with 4.3% or 22,478 of them unemployed. The age group with the highest labor force participation rate is 25 to 29 years, with 89.3% or 56,925 individuals in the labor force. Within the labor force, the 16 to 19 years age range has the highest percentage of unemployed individuals, with 13.2% or 2,753 of them being unemployed.
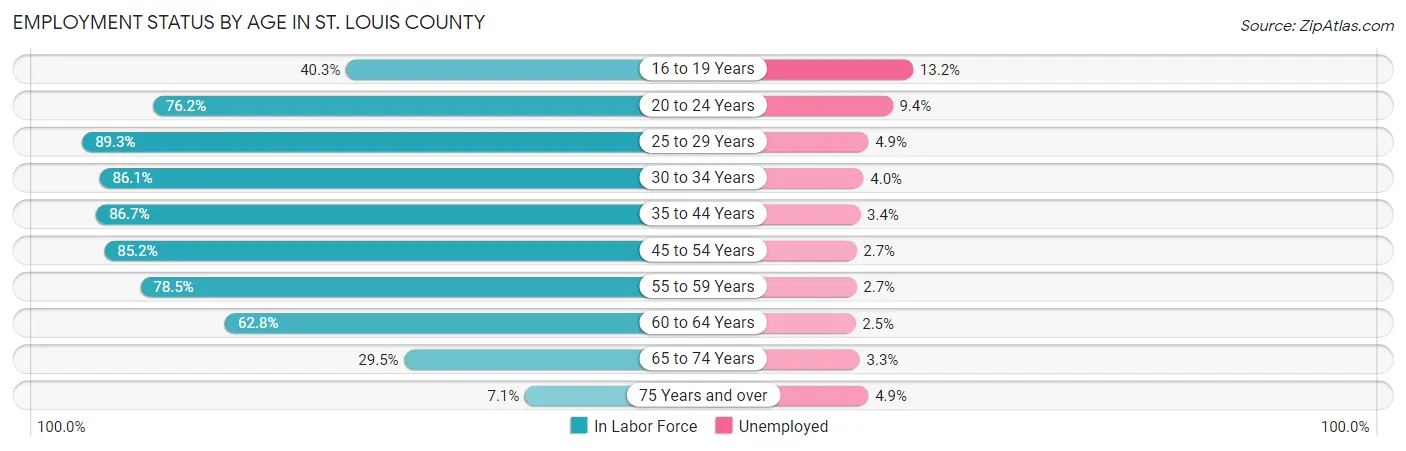
| Age Bracket | In Labor Force | Unemployed |
| 16 to 19 Years | 20,854 (40.3%) | 2,753 (13.2%) |
| 20 to 24 Years | 47,070 (76.2%) | 4,425 (9.4%) |
| 25 to 29 Years | 56,925 (89.3%) | 2,789 (4.9%) |
| 30 to 34 Years | 54,386 (86.1%) | 2,175 (4.0%) |
| 35 to 44 Years | 107,915 (86.7%) | 3,669 (3.4%) |
| 45 to 54 Years | 102,007 (85.2%) | 2,754 (2.7%) |
| 55 to 59 Years | 52,931 (78.5%) | 1,429 (2.7%) |
| 60 to 64 Years | 44,191 (62.8%) | 1,105 (2.5%) |
| 65 to 74 Years | 31,250 (29.5%) | 1,031 (3.3%) |
| 75 Years and over | 5,563 (7.1%) | 273 (4.9%) |
| Total | 522,748 (64.8%) | 22,478 (4.3%) |
Employment Status by Educational Attainment in St. Louis County
According to labor force statistics for St. Louis County, 82.2% of individuals (418,319) out of the total population between 25 and 64 years of age (508,904) are in the labor force, with 3.3% or 13,805 of them being unemployed. The group with the highest labor force participation rate are those with the educational attainment of bachelor's degree or higher, with 87.8% or 217,366 individuals in the labor force. Within the labor force, individuals with less than high school education have the highest percentage of unemployment, with 10.8% or 1,634 of them being unemployed.
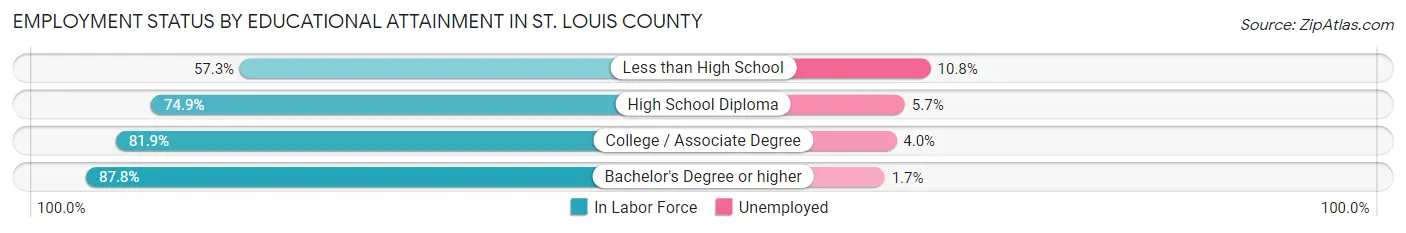
| Educational Attainment | In Labor Force | Unemployed |
| Less than High School | 15,125 (57.3%) | 2,851 (10.8%) |
| High School Diploma | 71,389 (74.9%) | 5,433 (5.7%) |
| College / Associate Degree | 114,355 (81.9%) | 5,585 (4.0%) |
| Bachelor's Degree or higher | 217,366 (87.8%) | 4,209 (1.7%) |
| Total | 418,319 (82.2%) | 16,794 (3.3%) |
Employment Occupations by Sex in St. Louis County
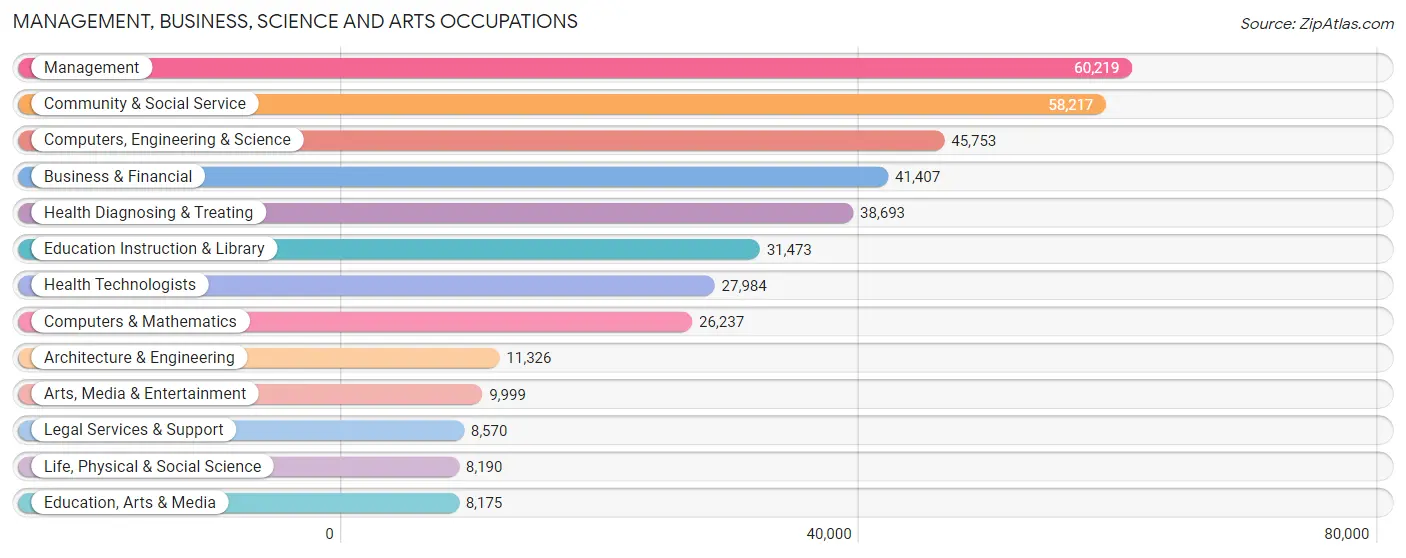
Management, Business, Science and Arts Occupations
The most common Management, Business, Science and Arts occupations in St. Louis County are Management (60,219 | 12.0%), Community & Social Service (58,217 | 11.6%), Computers, Engineering & Science (45,753 | 9.1%), Business & Financial (41,407 | 8.3%), and Health Diagnosing & Treating (38,693 | 7.7%).
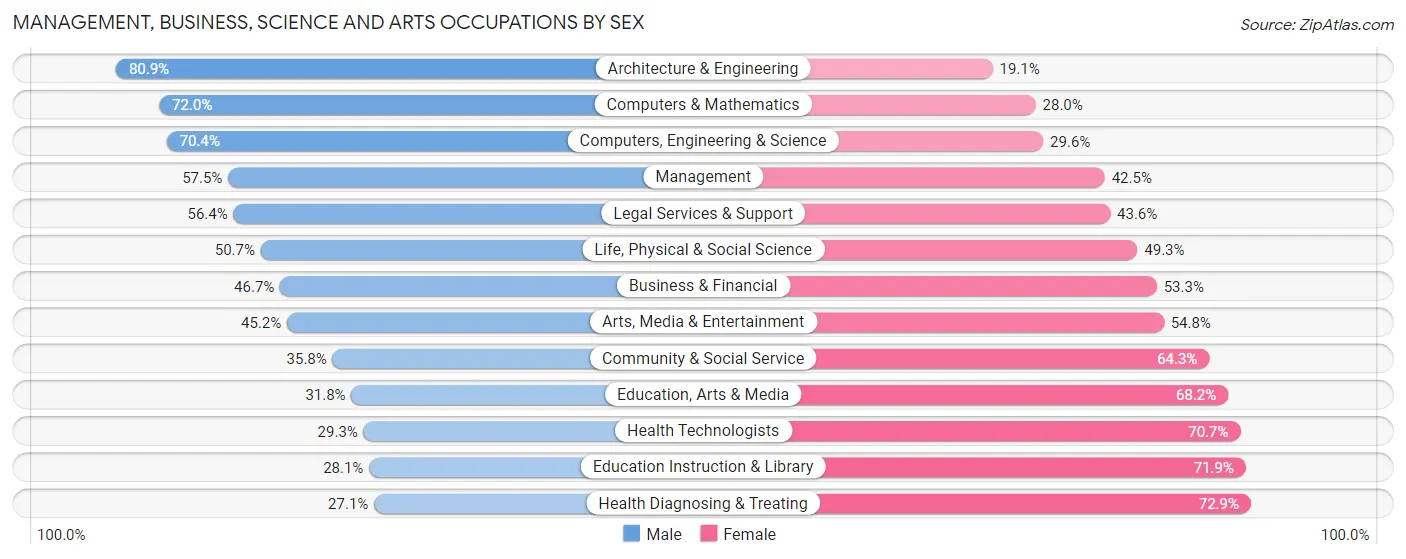
Management, Business, Science and Arts Occupations by Sex
Within the Management, Business, Science and Arts occupations in St. Louis County, the most male-oriented occupations are Architecture & Engineering (80.9%), Computers & Mathematics (72.0%), and Computers, Engineering & Science (70.4%), while the most female-oriented occupations are Health Diagnosing & Treating (72.9%), Education Instruction & Library (71.9%), and Health Technologists (70.7%).
| Occupation | Male | Female |
| Management | 34,642 (57.5%) | 25,577 (42.5%) |
| Business & Financial | 19,334 (46.7%) | 22,073 (53.3%) |
| Computers, Engineering & Science | 32,203 (70.4%) | 13,550 (29.6%) |
| Computers & Mathematics | 18,881 (72.0%) | 7,356 (28.0%) |
| Architecture & Engineering | 9,167 (80.9%) | 2,159 (19.1%) |
| Life, Physical & Social Science | 4,155 (50.7%) | 4,035 (49.3%) |
| Community & Social Service | 20,811 (35.7%) | 37,406 (64.2%) |
| Education, Arts & Media | 2,601 (31.8%) | 5,574 (68.2%) |
| Legal Services & Support | 4,835 (56.4%) | 3,735 (43.6%) |
| Education Instruction & Library | 8,851 (28.1%) | 22,622 (71.9%) |
| Arts, Media & Entertainment | 4,524 (45.2%) | 5,475 (54.8%) |
| Health Diagnosing & Treating | 10,478 (27.1%) | 28,215 (72.9%) |
| Health Technologists | 8,191 (29.3%) | 19,793 (70.7%) |
| Total (Category) | 117,468 (48.1%) | 126,821 (51.9%) |
| Total (Overall) | 252,650 (50.5%) | 247,342 (49.5%) |
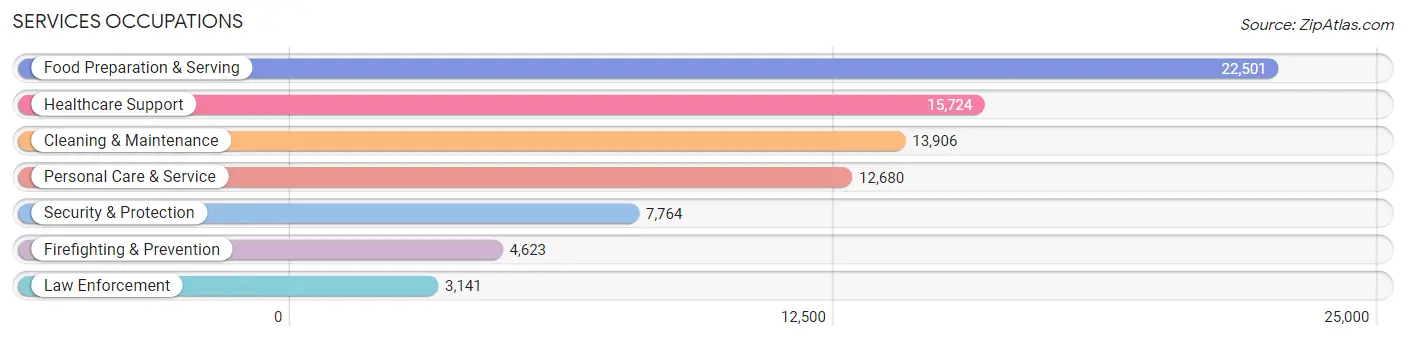
Services Occupations
The most common Services occupations in St. Louis County are Food Preparation & Serving (22,501 | 4.5%), Healthcare Support (15,724 | 3.1%), Cleaning & Maintenance (13,906 | 2.8%), Personal Care & Service (12,680 | 2.5%), and Security & Protection (7,764 | 1.5%).
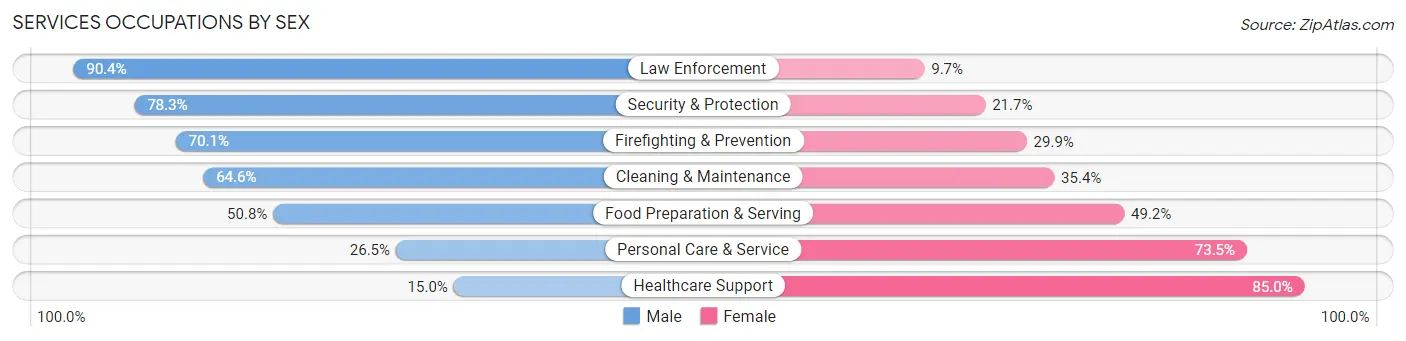
Services Occupations by Sex
Within the Services occupations in St. Louis County, the most male-oriented occupations are Law Enforcement (90.3%), Security & Protection (78.3%), and Firefighting & Prevention (70.1%), while the most female-oriented occupations are Healthcare Support (85.0%), Personal Care & Service (73.5%), and Food Preparation & Serving (49.2%).
| Occupation | Male | Female |
| Healthcare Support | 2,365 (15.0%) | 13,359 (85.0%) |
| Security & Protection | 6,078 (78.3%) | 1,686 (21.7%) |
| Firefighting & Prevention | 3,240 (70.1%) | 1,383 (29.9%) |
| Law Enforcement | 2,838 (90.3%) | 303 (9.7%) |
| Food Preparation & Serving | 11,425 (50.8%) | 11,076 (49.2%) |
| Cleaning & Maintenance | 8,987 (64.6%) | 4,919 (35.4%) |
| Personal Care & Service | 3,358 (26.5%) | 9,322 (73.5%) |
| Total (Category) | 32,213 (44.4%) | 40,362 (55.6%) |
| Total (Overall) | 252,650 (50.5%) | 247,342 (49.5%) |
Sales and Office Occupations
The most common Sales and Office occupations in St. Louis County are Office & Administration (55,576 | 11.1%), and Sales & Related (49,417 | 9.9%).

Sales and Office Occupations by Sex
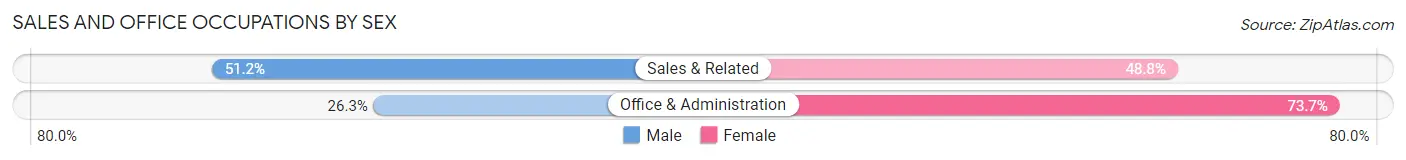
| Occupation | Male | Female |
| Sales & Related | 25,307 (51.2%) | 24,110 (48.8%) |
| Office & Administration | 14,619 (26.3%) | 40,957 (73.7%) |
| Total (Category) | 39,926 (38.0%) | 65,067 (62.0%) |
| Total (Overall) | 252,650 (50.5%) | 247,342 (49.5%) |
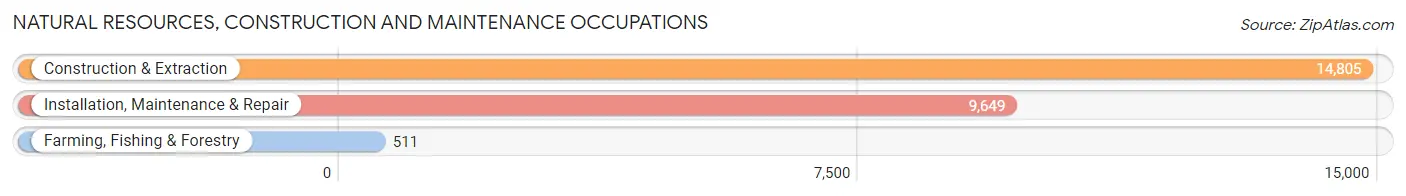
Natural Resources, Construction and Maintenance Occupations
The most common Natural Resources, Construction and Maintenance occupations in St. Louis County are Construction & Extraction (14,805 | 3.0%), Installation, Maintenance & Repair (9,649 | 1.9%), and Farming, Fishing & Forestry (511 | 0.1%).
Natural Resources, Construction and Maintenance Occupations by Sex
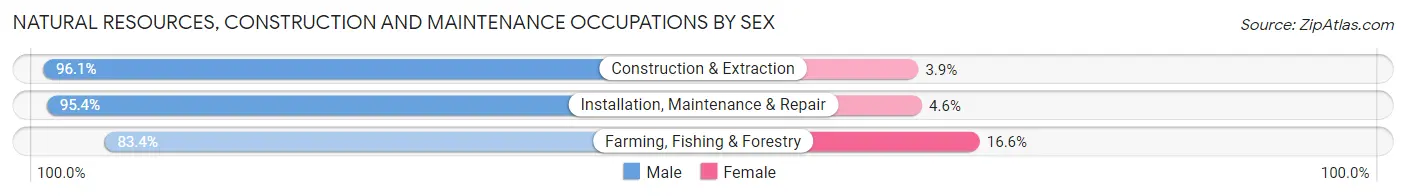
| Occupation | Male | Female |
| Farming, Fishing & Forestry | 426 (83.4%) | 85 (16.6%) |
| Construction & Extraction | 14,234 (96.1%) | 571 (3.9%) |
| Installation, Maintenance & Repair | 9,202 (95.4%) | 447 (4.6%) |
| Total (Category) | 23,862 (95.6%) | 1,103 (4.4%) |
| Total (Overall) | 252,650 (50.5%) | 247,342 (49.5%) |
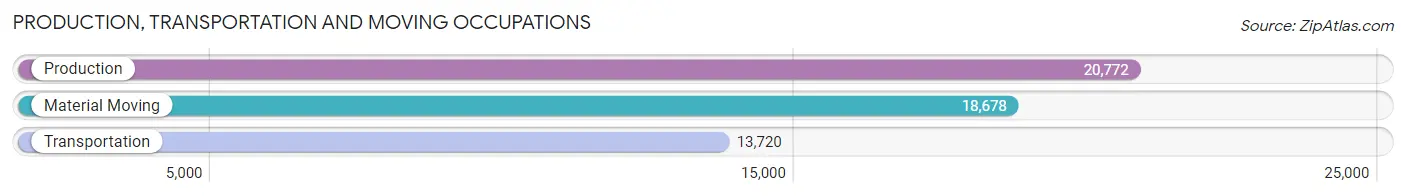
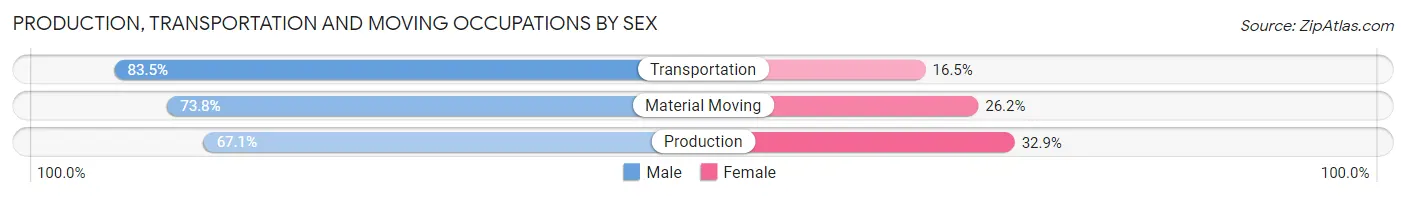
Production, Transportation and Moving Occupations
The most common Production, Transportation and Moving occupations in St. Louis County are Production (20,772 | 4.2%), Material Moving (18,678 | 3.7%), and Transportation (13,720 | 2.7%).
Production, Transportation and Moving Occupations by Sex
| Occupation | Male | Female |
| Production | 13,945 (67.1%) | 6,827 (32.9%) |
| Transportation | 11,452 (83.5%) | 2,268 (16.5%) |
| Material Moving | 13,784 (73.8%) | 4,894 (26.2%) |
| Total (Category) | 39,181 (73.7%) | 13,989 (26.3%) |
| Total (Overall) | 252,650 (50.5%) | 247,342 (49.5%) |
Employment Industries by Sex in St. Louis County
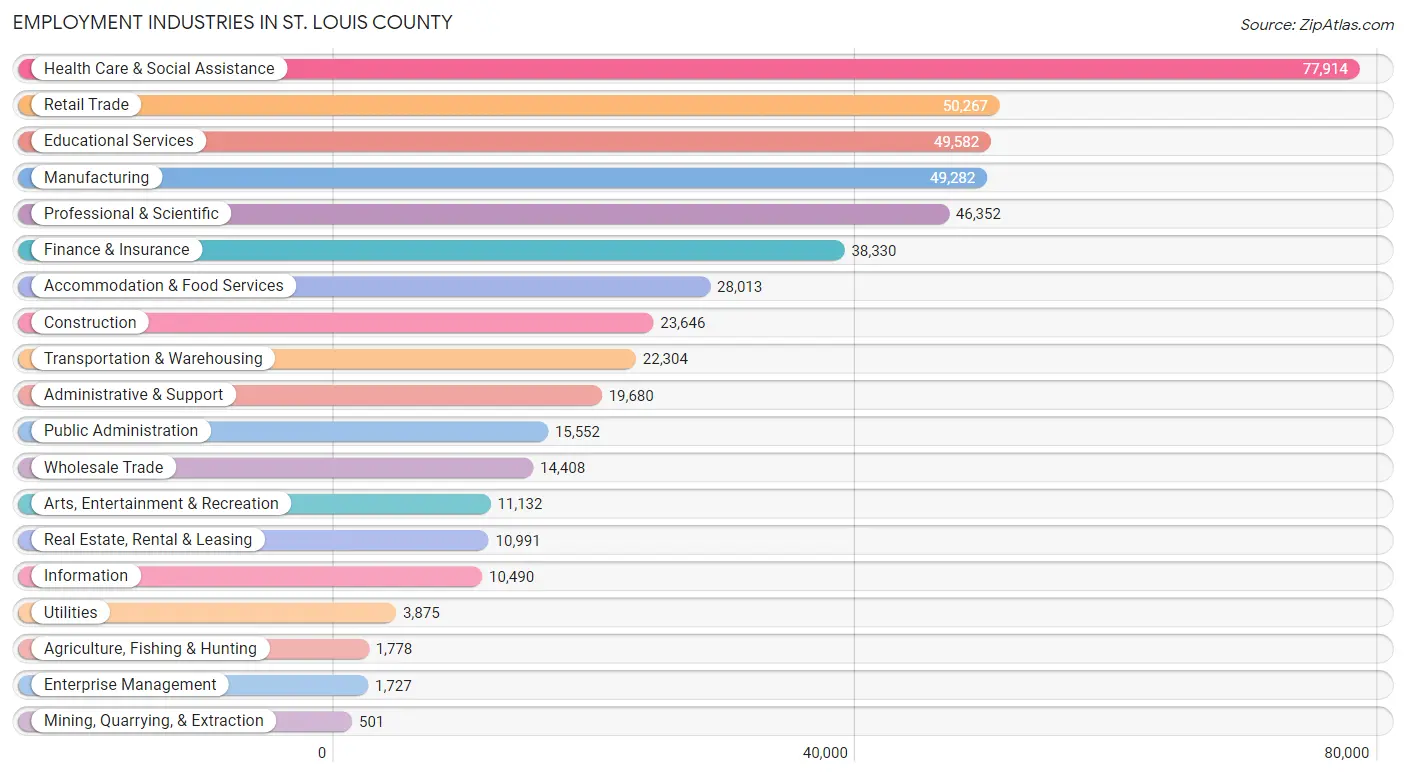
Employment Industries in St. Louis County
The major employment industries in St. Louis County include Health Care & Social Assistance (77,914 | 15.6%), Retail Trade (50,267 | 10.1%), Educational Services (49,582 | 9.9%), Manufacturing (49,282 | 9.9%), and Professional & Scientific (46,352 | 9.3%).
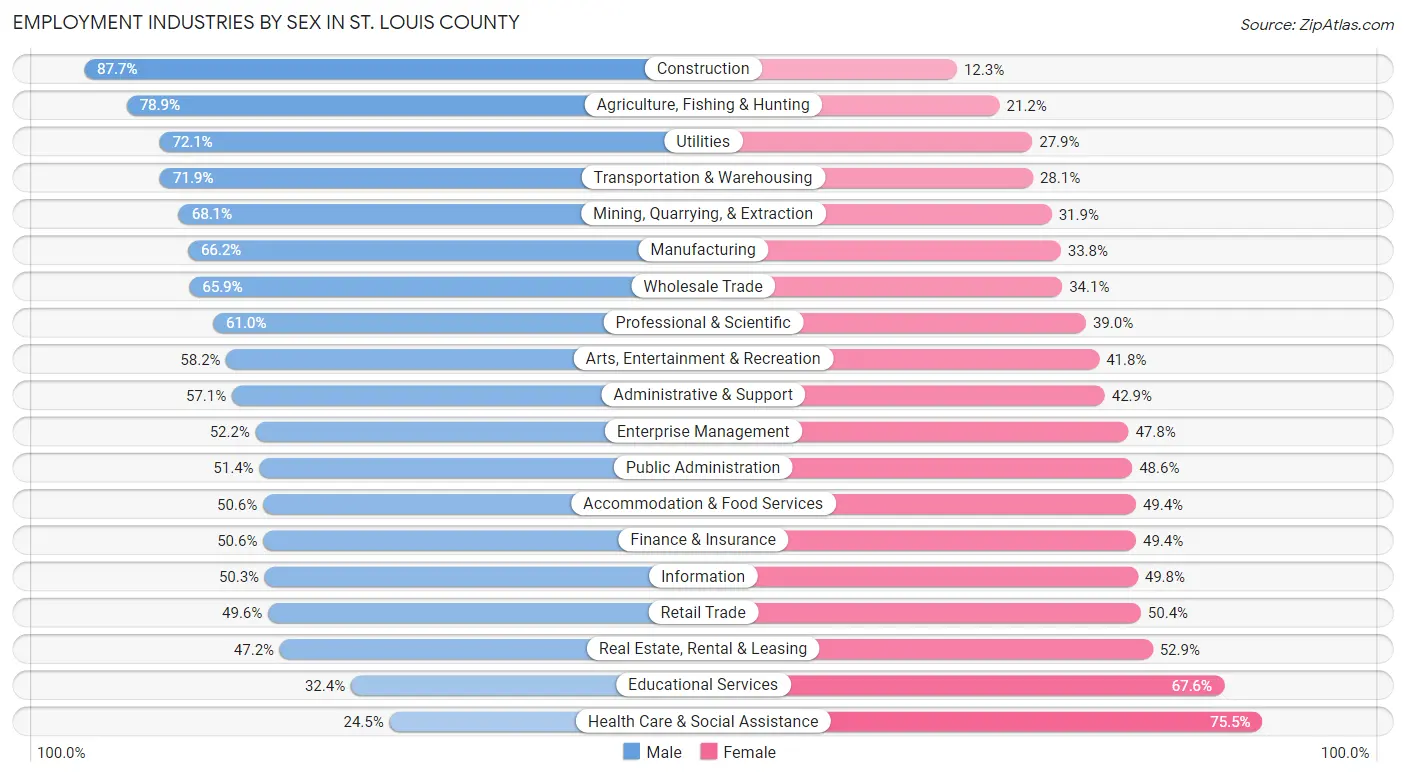
Employment Industries by Sex in St. Louis County
The St. Louis County industries that see more men than women are Construction (87.7%), Agriculture, Fishing & Hunting (78.8%), and Utilities (72.1%), whereas the industries that tend to have a higher number of women are Health Care & Social Assistance (75.5%), Educational Services (67.6%), and Real Estate, Rental & Leasing (52.8%).
| Industry | Male | Female |
| Agriculture, Fishing & Hunting | 1,402 (78.8%) | 376 (21.1%) |
| Mining, Quarrying, & Extraction | 341 (68.1%) | 160 (31.9%) |
| Construction | 20,730 (87.7%) | 2,916 (12.3%) |
| Manufacturing | 32,616 (66.2%) | 16,666 (33.8%) |
| Wholesale Trade | 9,494 (65.9%) | 4,914 (34.1%) |
| Retail Trade | 24,934 (49.6%) | 25,333 (50.4%) |
| Transportation & Warehousing | 16,045 (71.9%) | 6,259 (28.1%) |
| Utilities | 2,793 (72.1%) | 1,082 (27.9%) |
| Information | 5,271 (50.2%) | 5,219 (49.7%) |
| Finance & Insurance | 19,397 (50.6%) | 18,933 (49.4%) |
| Real Estate, Rental & Leasing | 5,182 (47.1%) | 5,809 (52.8%) |
| Professional & Scientific | 28,259 (61.0%) | 18,093 (39.0%) |
| Enterprise Management | 901 (52.2%) | 826 (47.8%) |
| Administrative & Support | 11,232 (57.1%) | 8,448 (42.9%) |
| Educational Services | 16,082 (32.4%) | 33,500 (67.6%) |
| Health Care & Social Assistance | 19,058 (24.5%) | 58,856 (75.5%) |
| Arts, Entertainment & Recreation | 6,482 (58.2%) | 4,650 (41.8%) |
| Accommodation & Food Services | 14,184 (50.6%) | 13,829 (49.4%) |
| Public Administration | 7,994 (51.4%) | 7,558 (48.6%) |
| Total | 252,650 (50.5%) | 247,342 (49.5%) |
Education in St. Louis County
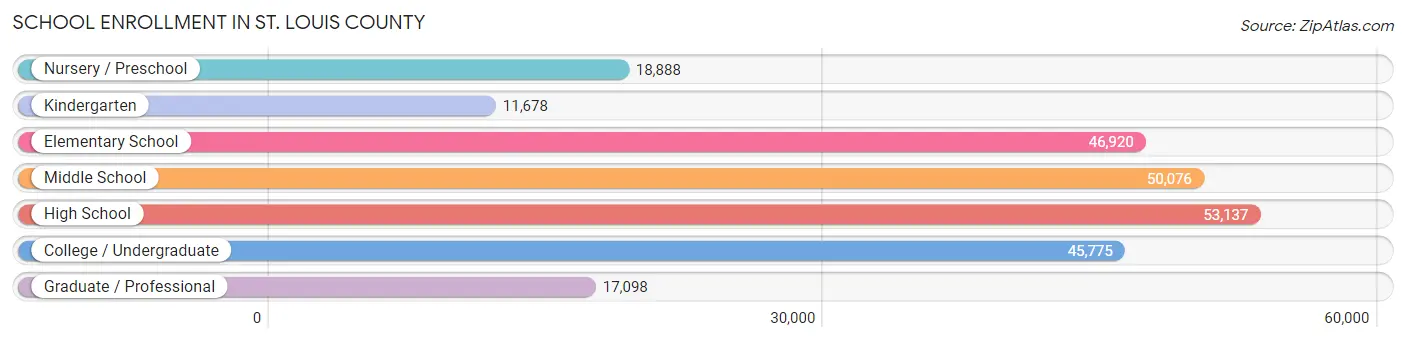
School Enrollment in St. Louis County
The most common levels of schooling among the 243,572 students in St. Louis County are high school (53,137 | 21.8%), middle school (50,076 | 20.6%), and elementary school (46,920 | 19.3%).
| School Level | # Students | % Students |
| Nursery / Preschool | 18,888 | 7.7% |
| Kindergarten | 11,678 | 4.8% |
| Elementary School | 46,920 | 19.3% |
| Middle School | 50,076 | 20.6% |
| High School | 53,137 | 21.8% |
| College / Undergraduate | 45,775 | 18.8% |
| Graduate / Professional | 17,098 | 7.0% |
| Total | 243,572 | 100.0% |
School Enrollment by Age by Funding Source in St. Louis County
Out of a total of 243,572 students who are enrolled in schools in St. Louis County, 68,687 (28.2%) attend a private institution, while the remaining 174,885 (71.8%) are enrolled in public schools. The age group of 3 to 4 year olds has the highest likelihood of being enrolled in private schools, with 7,813 (55.5% in the age bracket) enrolled. Conversely, the age group of 10 to 14 year olds has the lowest likelihood of being enrolled in a private school, with 50,978 (81.4% in the age bracket) attending a public institution.
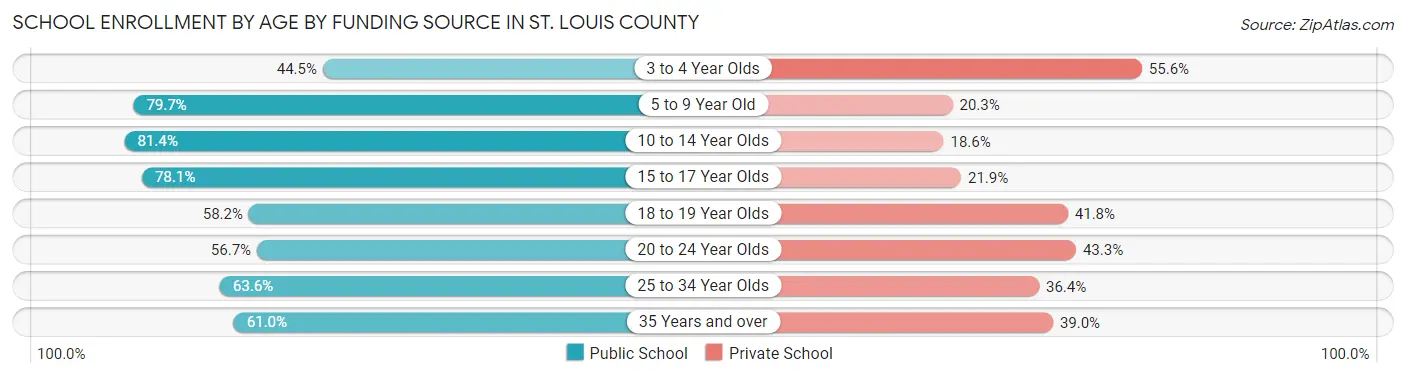
| Age Bracket | Public School | Private School |
| 3 to 4 Year Olds | 6,251 (44.5%) | 7,813 (55.5%) |
| 5 to 9 Year Old | 44,767 (79.7%) | 11,386 (20.3%) |
| 10 to 14 Year Olds | 50,978 (81.4%) | 11,660 (18.6%) |
| 15 to 17 Year Olds | 30,008 (78.1%) | 8,399 (21.9%) |
| 18 to 19 Year Olds | 11,347 (58.2%) | 8,137 (41.8%) |
| 20 to 24 Year Olds | 14,781 (56.7%) | 11,272 (43.3%) |
| 25 to 34 Year Olds | 9,433 (63.6%) | 5,397 (36.4%) |
| 35 Years and over | 7,288 (61.0%) | 4,655 (39.0%) |
| Total | 174,885 (71.8%) | 68,687 (28.2%) |
Educational Attainment by Field of Study in St. Louis County
Business (79,020 | 22.9%), education (38,724 | 11.2%), science & technology (34,367 | 10.0%), engineering (26,037 | 7.5%), and social sciences (21,566 | 6.2%) are the most common fields of study among 345,353 individuals in St. Louis County who have obtained a bachelor's degree or higher.
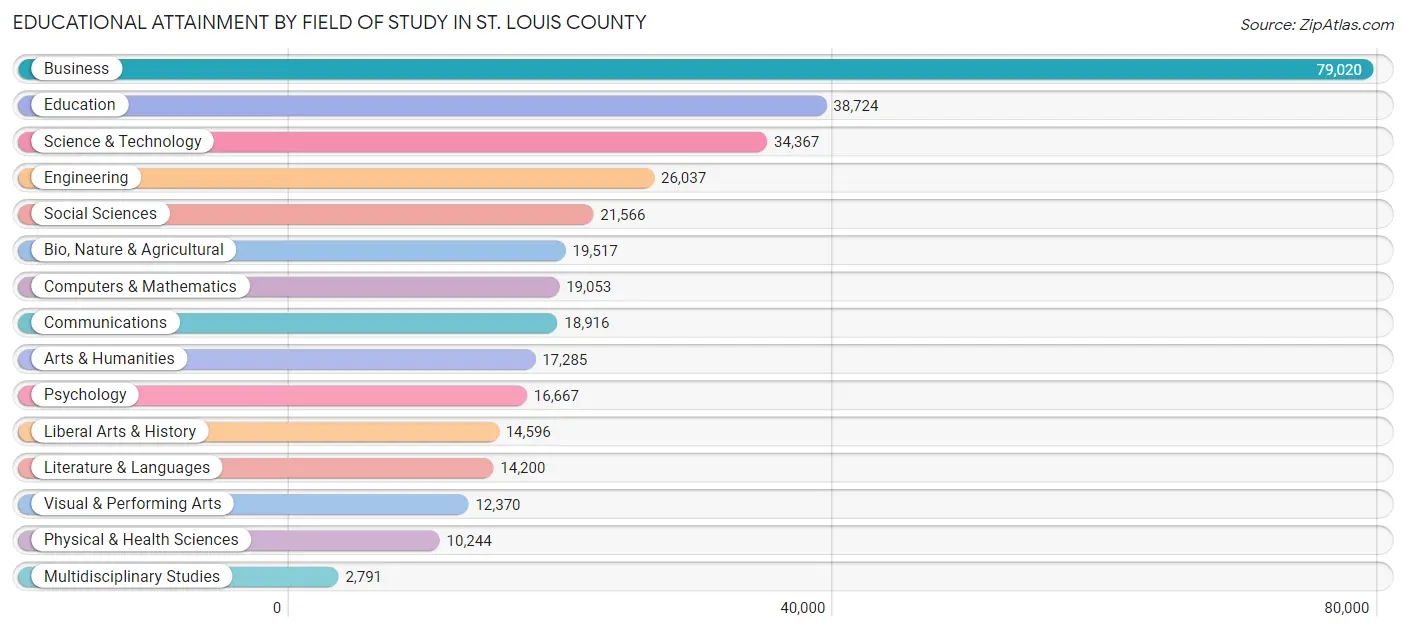
| Field of Study | # Graduates | % Graduates |
| Computers & Mathematics | 19,053 | 5.5% |
| Bio, Nature & Agricultural | 19,517 | 5.7% |
| Physical & Health Sciences | 10,244 | 3.0% |
| Psychology | 16,667 | 4.8% |
| Social Sciences | 21,566 | 6.2% |
| Engineering | 26,037 | 7.5% |
| Multidisciplinary Studies | 2,791 | 0.8% |
| Science & Technology | 34,367 | 10.0% |
| Business | 79,020 | 22.9% |
| Education | 38,724 | 11.2% |
| Literature & Languages | 14,200 | 4.1% |
| Liberal Arts & History | 14,596 | 4.2% |
| Visual & Performing Arts | 12,370 | 3.6% |
| Communications | 18,916 | 5.5% |
| Arts & Humanities | 17,285 | 5.0% |
| Total | 345,353 | 100.0% |
Transportation & Commute in St. Louis County
Vehicle Availability by Sex in St. Louis County
The most prevalent vehicle ownership categories in St. Louis County are males with 2 vehicles (118,131, accounting for 47.4%) and females with 2 vehicles (106,660, making up 49.2%).
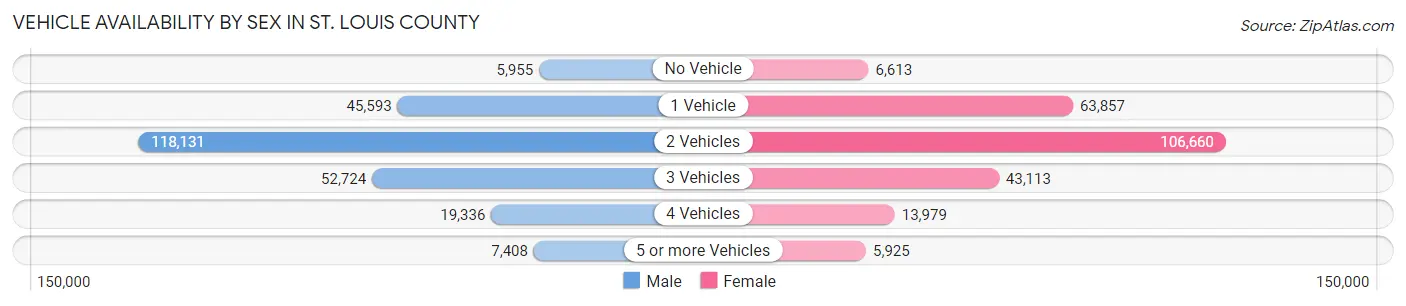
| Vehicles Available | Male | Female |
| No Vehicle | 5,955 (2.4%) | 6,613 (2.8%) |
| 1 Vehicle | 45,593 (18.3%) | 63,857 (26.6%) |
| 2 Vehicles | 118,131 (47.4%) | 106,660 (44.4%) |
| 3 Vehicles | 52,724 (21.2%) | 43,113 (17.9%) |
| 4 Vehicles | 19,336 (7.8%) | 13,979 (5.8%) |
| 5 or more Vehicles | 7,408 (3.0%) | 5,925 (2.5%) |
| Total | 249,147 (100.0%) | 240,147 (100.0%) |
Commute Time in St. Louis County
The most frequently occuring commute durations in St. Louis County are 20 to 24 minutes (83,836 commuters, 19.8%), 15 to 19 minutes (72,739 commuters, 17.2%), and 30 to 34 minutes (70,069 commuters, 16.6%).
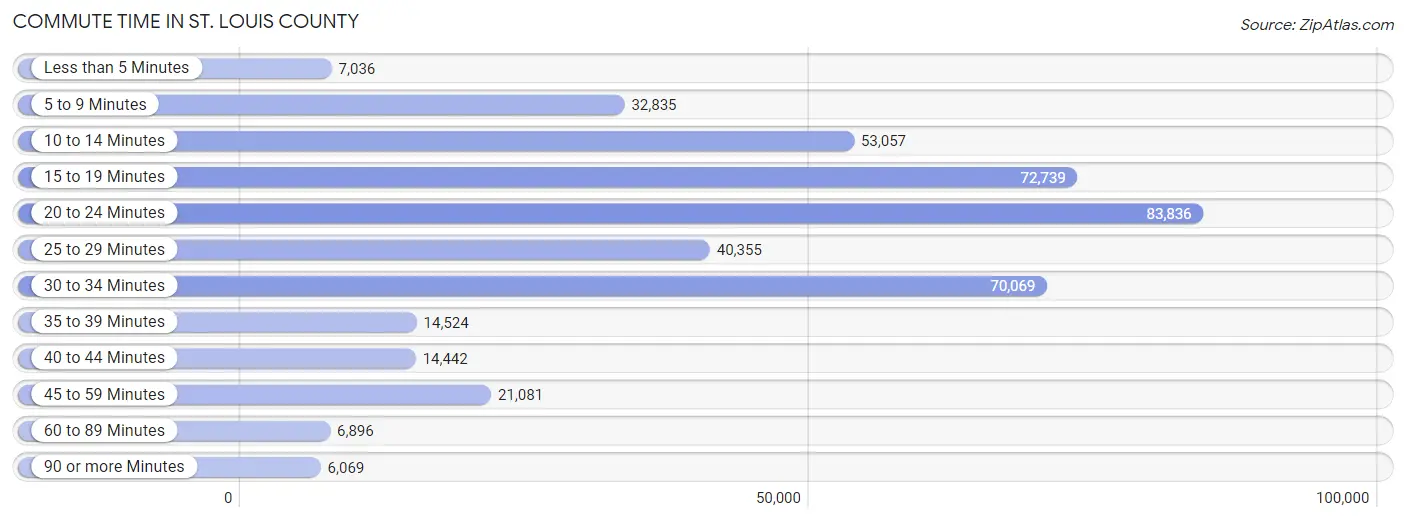
| Commute Time | # Commuters | % Commuters |
| Less than 5 Minutes | 7,036 | 1.7% |
| 5 to 9 Minutes | 32,835 | 7.8% |
| 10 to 14 Minutes | 53,057 | 12.5% |
| 15 to 19 Minutes | 72,739 | 17.2% |
| 20 to 24 Minutes | 83,836 | 19.8% |
| 25 to 29 Minutes | 40,355 | 9.5% |
| 30 to 34 Minutes | 70,069 | 16.6% |
| 35 to 39 Minutes | 14,524 | 3.4% |
| 40 to 44 Minutes | 14,442 | 3.4% |
| 45 to 59 Minutes | 21,081 | 5.0% |
| 60 to 89 Minutes | 6,896 | 1.6% |
| 90 or more Minutes | 6,069 | 1.4% |
Commute Time by Sex in St. Louis County
The most common commute times in St. Louis County are 20 to 24 minutes (42,492 commuters, 19.5%) for males and 20 to 24 minutes (41,344 commuters, 20.2%) for females.
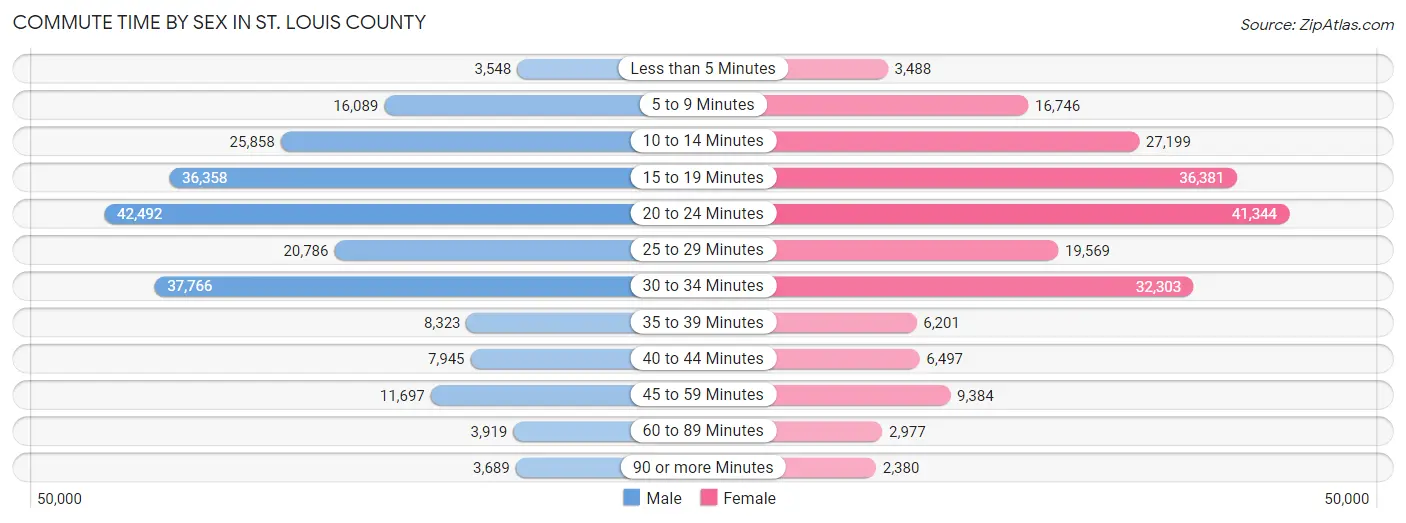
| Commute Time | Male | Female |
| Less than 5 Minutes | 3,548 (1.6%) | 3,488 (1.7%) |
| 5 to 9 Minutes | 16,089 (7.4%) | 16,746 (8.2%) |
| 10 to 14 Minutes | 25,858 (11.8%) | 27,199 (13.3%) |
| 15 to 19 Minutes | 36,358 (16.6%) | 36,381 (17.8%) |
| 20 to 24 Minutes | 42,492 (19.5%) | 41,344 (20.2%) |
| 25 to 29 Minutes | 20,786 (9.5%) | 19,569 (9.6%) |
| 30 to 34 Minutes | 37,766 (17.3%) | 32,303 (15.8%) |
| 35 to 39 Minutes | 8,323 (3.8%) | 6,201 (3.0%) |
| 40 to 44 Minutes | 7,945 (3.6%) | 6,497 (3.2%) |
| 45 to 59 Minutes | 11,697 (5.3%) | 9,384 (4.6%) |
| 60 to 89 Minutes | 3,919 (1.8%) | 2,977 (1.5%) |
| 90 or more Minutes | 3,689 (1.7%) | 2,380 (1.2%) |
Time of Departure to Work by Sex in St. Louis County
The most frequent times of departure to work in St. Louis County are 7:00 AM to 7:29 AM (32,439, 14.8%) for males and 7:30 AM to 7:59 AM (31,264, 15.3%) for females.
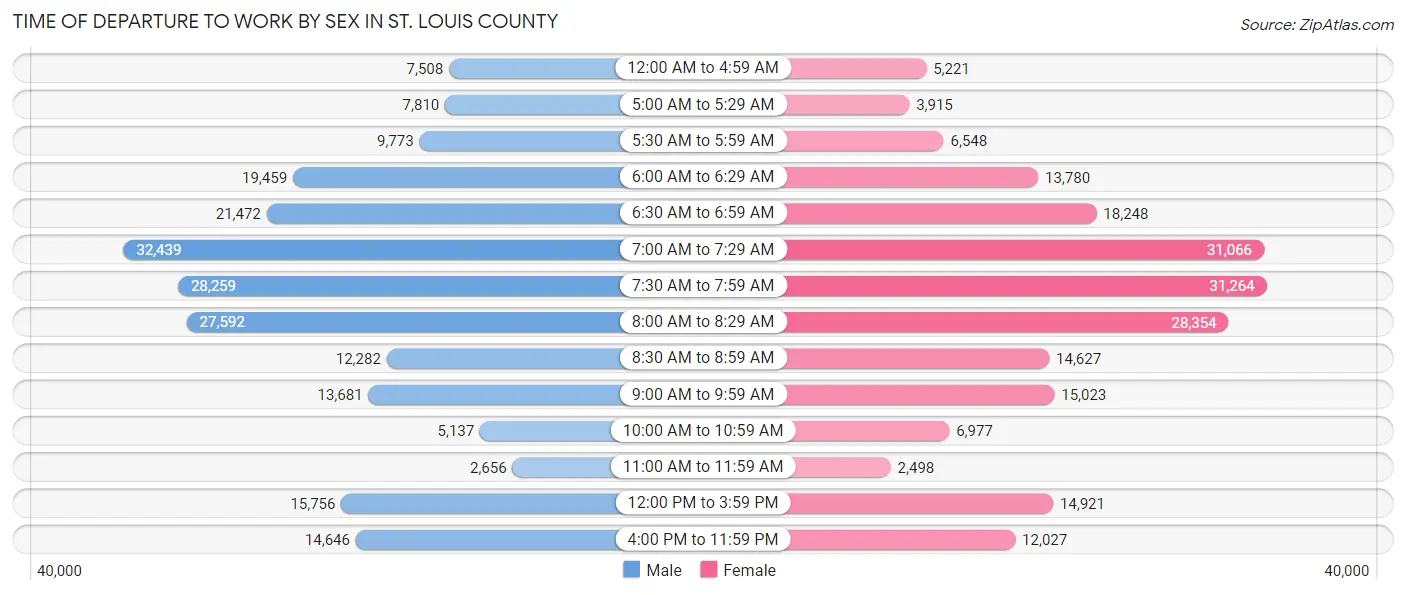
| Time of Departure | Male | Female |
| 12:00 AM to 4:59 AM | 7,508 (3.4%) | 5,221 (2.5%) |
| 5:00 AM to 5:29 AM | 7,810 (3.6%) | 3,915 (1.9%) |
| 5:30 AM to 5:59 AM | 9,773 (4.5%) | 6,548 (3.2%) |
| 6:00 AM to 6:29 AM | 19,459 (8.9%) | 13,780 (6.7%) |
| 6:30 AM to 6:59 AM | 21,472 (9.8%) | 18,248 (8.9%) |
| 7:00 AM to 7:29 AM | 32,439 (14.8%) | 31,066 (15.2%) |
| 7:30 AM to 7:59 AM | 28,259 (12.9%) | 31,264 (15.3%) |
| 8:00 AM to 8:29 AM | 27,592 (12.6%) | 28,354 (13.9%) |
| 8:30 AM to 8:59 AM | 12,282 (5.6%) | 14,627 (7.1%) |
| 9:00 AM to 9:59 AM | 13,681 (6.3%) | 15,023 (7.3%) |
| 10:00 AM to 10:59 AM | 5,137 (2.4%) | 6,977 (3.4%) |
| 11:00 AM to 11:59 AM | 2,656 (1.2%) | 2,498 (1.2%) |
| 12:00 PM to 3:59 PM | 15,756 (7.2%) | 14,921 (7.3%) |
| 4:00 PM to 11:59 PM | 14,646 (6.7%) | 12,027 (5.9%) |
| Total | 218,470 (100.0%) | 204,469 (100.0%) |
Housing Occupancy in St. Louis County
Occupancy by Ownership in St. Louis County
Of the total 413,247 dwellings in St. Louis County, owner-occupied units account for 283,007 (68.5%), while renter-occupied units make up 130,240 (31.5%).
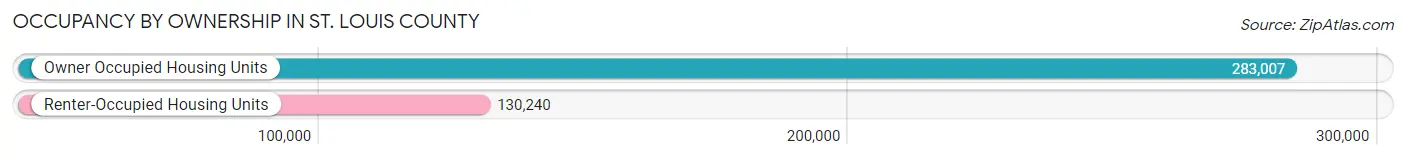
| Occupancy | # Housing Units | % Housing Units |
| Owner Occupied Housing Units | 283,007 | 68.5% |
| Renter-Occupied Housing Units | 130,240 | 31.5% |
| Total Occupied Housing Units | 413,247 | 100.0% |
Occupancy by Household Size in St. Louis County
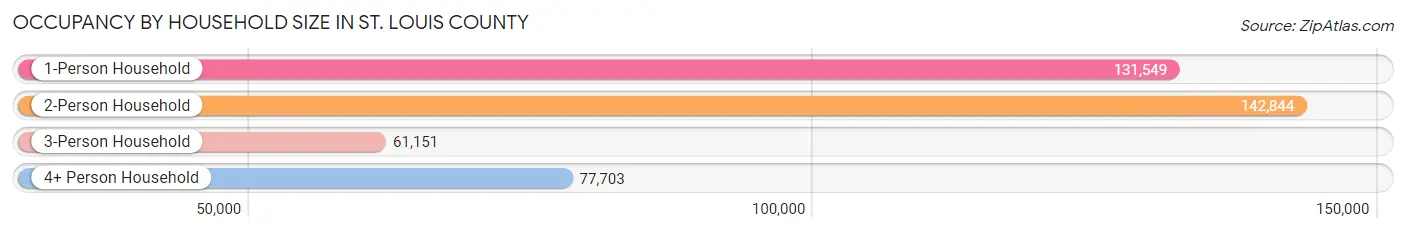
| Household Size | # Housing Units | % Housing Units |
| 1-Person Household | 131,549 | 31.8% |
| 2-Person Household | 142,844 | 34.6% |
| 3-Person Household | 61,151 | 14.8% |
| 4+ Person Household | 77,703 | 18.8% |
| Total Housing Units | 413,247 | 100.0% |
Occupancy by Ownership by Household Size in St. Louis County
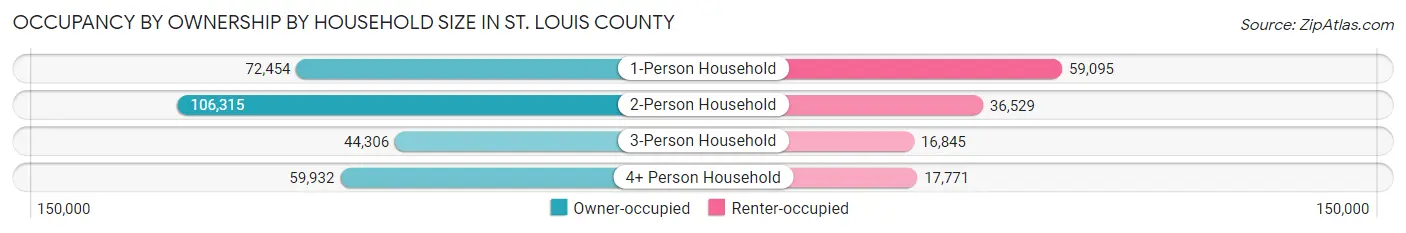
| Household Size | Owner-occupied | Renter-occupied |
| 1-Person Household | 72,454 (55.1%) | 59,095 (44.9%) |
| 2-Person Household | 106,315 (74.4%) | 36,529 (25.6%) |
| 3-Person Household | 44,306 (72.5%) | 16,845 (27.6%) |
| 4+ Person Household | 59,932 (77.1%) | 17,771 (22.9%) |
| Total Housing Units | 283,007 (68.5%) | 130,240 (31.5%) |
Occupancy by Educational Attainment in St. Louis County
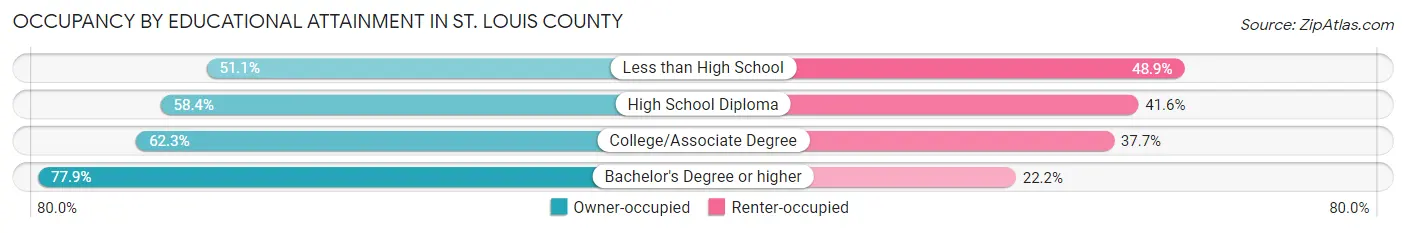
| Household Size | Owner-occupied | Renter-occupied |
| Less than High School | 9,945 (51.1%) | 9,500 (48.9%) |
| High School Diploma | 45,649 (58.4%) | 32,496 (41.6%) |
| College/Associate Degree | 73,348 (62.3%) | 44,412 (37.7%) |
| Bachelor's Degree or higher | 154,065 (77.8%) | 43,832 (22.2%) |
Occupancy by Age of Householder in St. Louis County
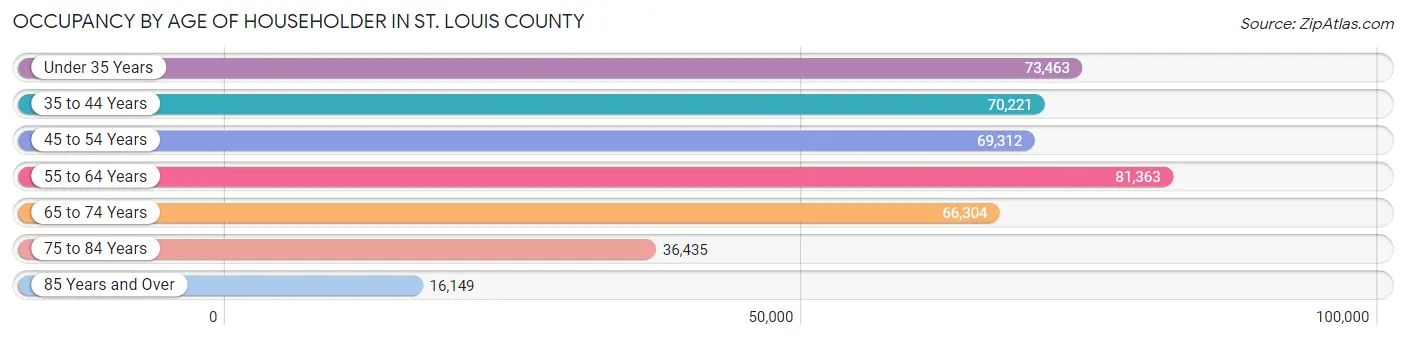
| Age Bracket | # Households | % Households |
| Under 35 Years | 73,463 | 17.8% |
| 35 to 44 Years | 70,221 | 17.0% |
| 45 to 54 Years | 69,312 | 16.8% |
| 55 to 64 Years | 81,363 | 19.7% |
| 65 to 74 Years | 66,304 | 16.0% |
| 75 to 84 Years | 36,435 | 8.8% |
| 85 Years and Over | 16,149 | 3.9% |
| Total | 413,247 | 100.0% |
Housing Finances in St. Louis County
Median Income by Occupancy in St. Louis County
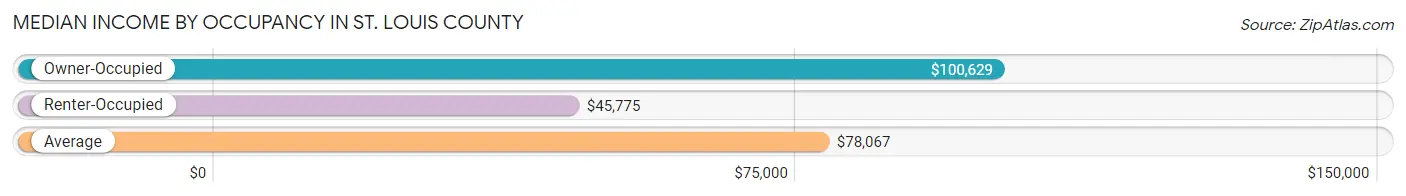
| Occupancy Type | # Households | Median Income |
| Owner-Occupied | 283,007 (68.5%) | $100,629 |
| Renter-Occupied | 130,240 (31.5%) | $45,775 |
| Average | 413,247 (100.0%) | $78,067 |
Occupancy by Householder Income Bracket in St. Louis County
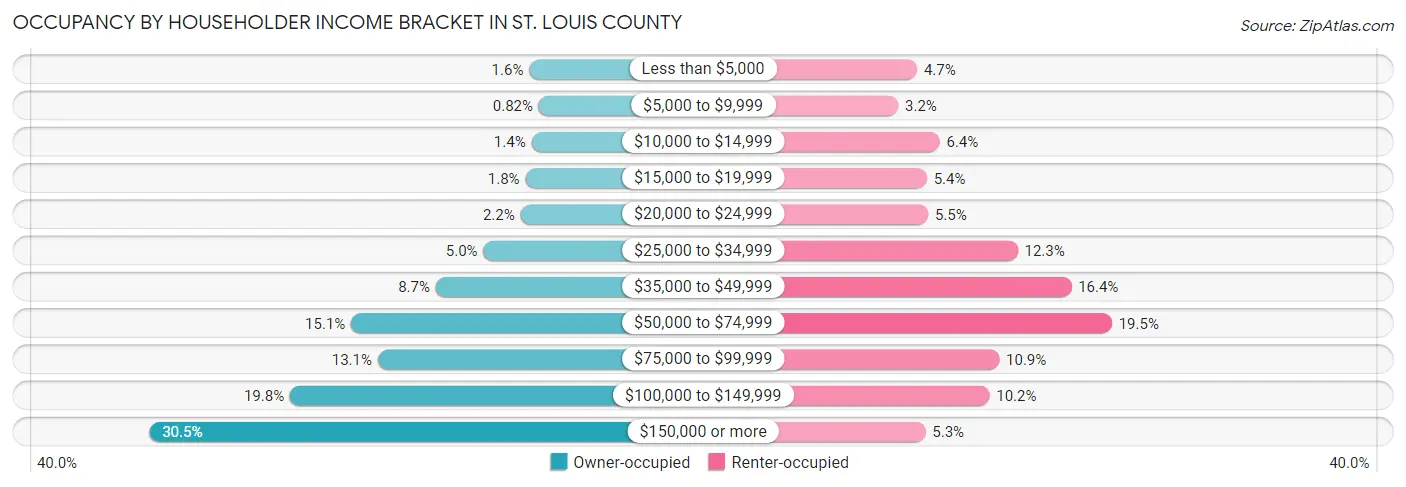
| Income Bracket | Owner-occupied | Renter-occupied |
| Less than $5,000 | 4,393 (1.5%) | 6,091 (4.7%) |
| $5,000 to $9,999 | 2,309 (0.8%) | 4,226 (3.2%) |
| $10,000 to $14,999 | 3,902 (1.4%) | 8,341 (6.4%) |
| $15,000 to $19,999 | 5,200 (1.8%) | 7,062 (5.4%) |
| $20,000 to $24,999 | 6,250 (2.2%) | 7,192 (5.5%) |
| $25,000 to $34,999 | 14,260 (5.0%) | 16,066 (12.3%) |
| $35,000 to $49,999 | 24,530 (8.7%) | 21,401 (16.4%) |
| $50,000 to $74,999 | 42,790 (15.1%) | 25,418 (19.5%) |
| $75,000 to $99,999 | 37,052 (13.1%) | 14,242 (10.9%) |
| $100,000 to $149,999 | 55,990 (19.8%) | 13,270 (10.2%) |
| $150,000 or more | 86,331 (30.5%) | 6,931 (5.3%) |
| Total | 283,007 (100.0%) | 130,240 (100.0%) |
Monthly Housing Cost Tiers in St. Louis County
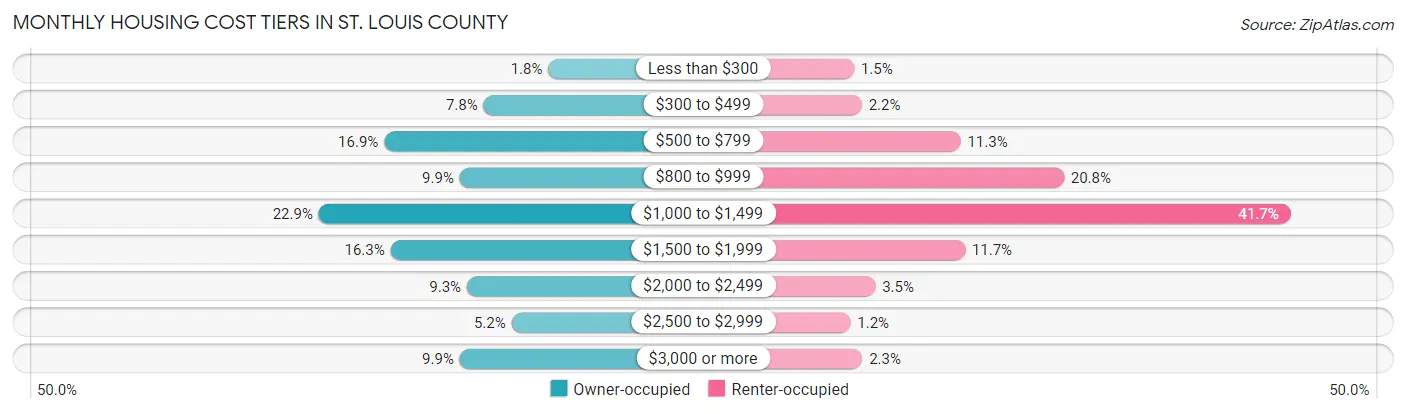
| Monthly Cost | Owner-occupied | Renter-occupied |
| Less than $300 | 5,059 (1.8%) | 1,978 (1.5%) |
| $300 to $499 | 21,939 (7.7%) | 2,918 (2.2%) |
| $500 to $799 | 47,841 (16.9%) | 14,752 (11.3%) |
| $800 to $999 | 28,121 (9.9%) | 27,147 (20.8%) |
| $1,000 to $1,499 | 64,861 (22.9%) | 54,334 (41.7%) |
| $1,500 to $1,999 | 46,163 (16.3%) | 15,285 (11.7%) |
| $2,000 to $2,499 | 26,267 (9.3%) | 4,531 (3.5%) |
| $2,500 to $2,999 | 14,636 (5.2%) | 1,550 (1.2%) |
| $3,000 or more | 28,120 (9.9%) | 2,964 (2.3%) |
| Total | 283,007 (100.0%) | 130,240 (100.0%) |
Physical Housing Characteristics in St. Louis County
Housing Structures in St. Louis County
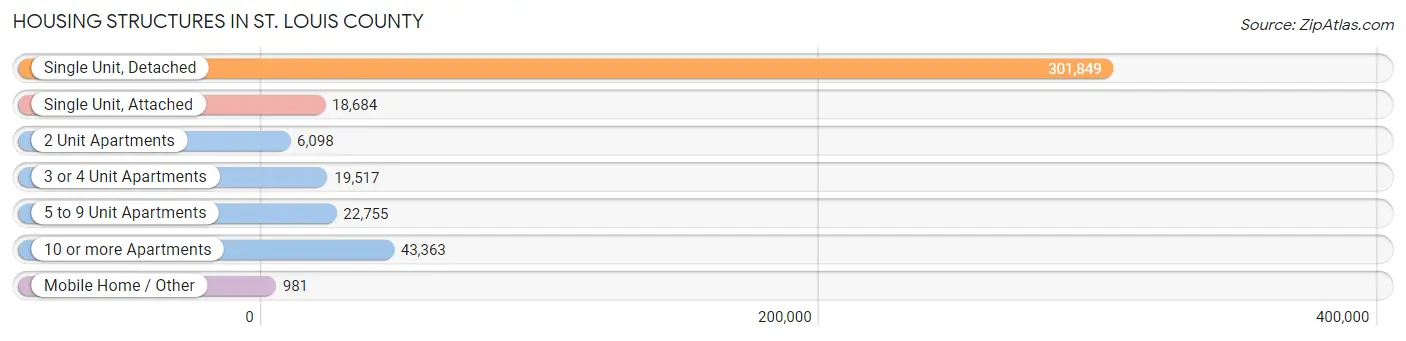
| Structure Type | # Housing Units | % Housing Units |
| Single Unit, Detached | 301,849 | 73.0% |
| Single Unit, Attached | 18,684 | 4.5% |
| 2 Unit Apartments | 6,098 | 1.5% |
| 3 or 4 Unit Apartments | 19,517 | 4.7% |
| 5 to 9 Unit Apartments | 22,755 | 5.5% |
| 10 or more Apartments | 43,363 | 10.5% |
| Mobile Home / Other | 981 | 0.2% |
| Total | 413,247 | 100.0% |
Housing Structures by Occupancy in St. Louis County
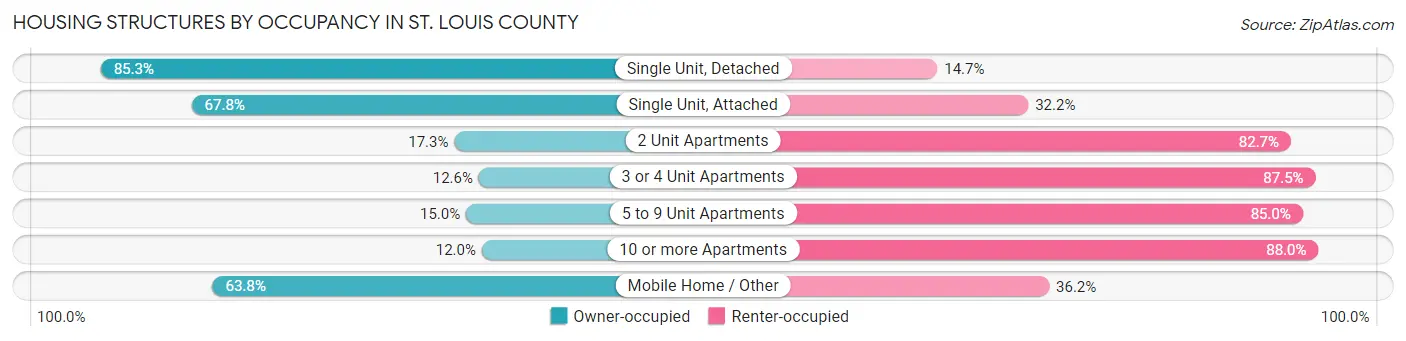
| Structure Type | Owner-occupied | Renter-occupied |
| Single Unit, Detached | 257,594 (85.3%) | 44,255 (14.7%) |
| Single Unit, Attached | 12,674 (67.8%) | 6,010 (32.2%) |
| 2 Unit Apartments | 1,053 (17.3%) | 5,045 (82.7%) |
| 3 or 4 Unit Apartments | 2,450 (12.6%) | 17,067 (87.5%) |
| 5 to 9 Unit Apartments | 3,413 (15.0%) | 19,342 (85.0%) |
| 10 or more Apartments | 5,197 (12.0%) | 38,166 (88.0%) |
| Mobile Home / Other | 626 (63.8%) | 355 (36.2%) |
| Total | 283,007 (68.5%) | 130,240 (31.5%) |
Housing Structures by Number of Rooms in St. Louis County
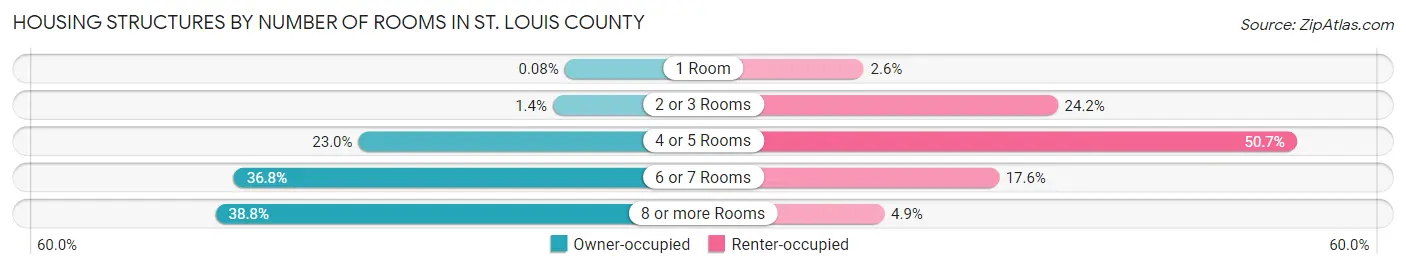
| Number of Rooms | Owner-occupied | Renter-occupied |
| 1 Room | 232 (0.1%) | 3,429 (2.6%) |
| 2 or 3 Rooms | 3,911 (1.4%) | 31,467 (24.2%) |
| 4 or 5 Rooms | 64,990 (23.0%) | 66,011 (50.7%) |
| 6 or 7 Rooms | 104,080 (36.8%) | 22,950 (17.6%) |
| 8 or more Rooms | 109,794 (38.8%) | 6,383 (4.9%) |
| Total | 283,007 (100.0%) | 130,240 (100.0%) |
Housing Structure by Heating Type in St. Louis County
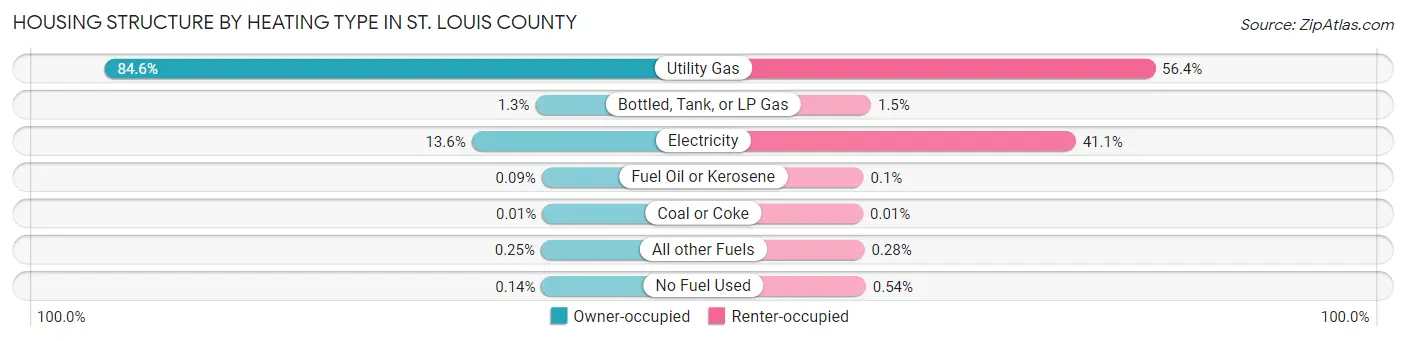
| Heating Type | Owner-occupied | Renter-occupied |
| Utility Gas | 239,287 (84.6%) | 73,505 (56.4%) |
| Bottled, Tank, or LP Gas | 3,737 (1.3%) | 2,011 (1.5%) |
| Electricity | 38,609 (13.6%) | 53,517 (41.1%) |
| Fuel Oil or Kerosene | 249 (0.1%) | 128 (0.1%) |
| Coal or Coke | 26 (0.0%) | 15 (0.0%) |
| All other Fuels | 712 (0.3%) | 362 (0.3%) |
| No Fuel Used | 387 (0.1%) | 702 (0.5%) |
| Total | 283,007 (100.0%) | 130,240 (100.0%) |
Household Vehicle Usage in St. Louis County
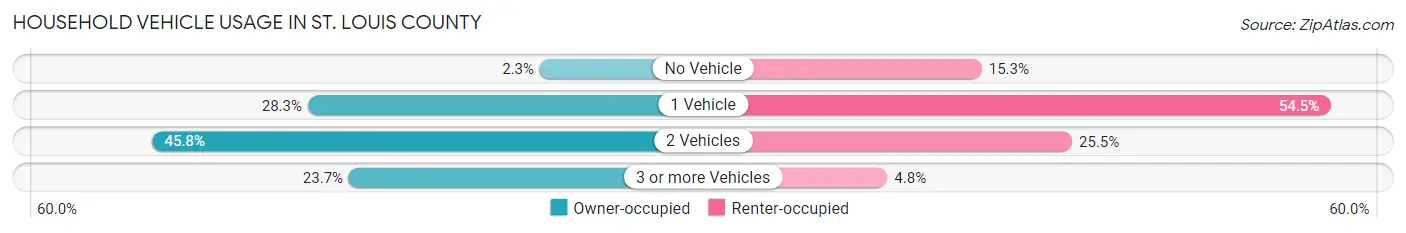
| Vehicles per Household | Owner-occupied | Renter-occupied |
| No Vehicle | 6,441 (2.3%) | 19,961 (15.3%) |
| 1 Vehicle | 80,037 (28.3%) | 70,934 (54.5%) |
| 2 Vehicles | 129,535 (45.8%) | 33,152 (25.5%) |
| 3 or more Vehicles | 66,994 (23.7%) | 6,193 (4.8%) |
| Total | 283,007 (100.0%) | 130,240 (100.0%) |
Real Estate & Mortgages in St. Louis County
Real Estate and Mortgage Overview in St. Louis County
| Characteristic | Without Mortgage | With Mortgage |
| Housing Units | 99,331 | 183,676 |
| Median Property Value | $236,700 | $256,800 |
| Median Household Income | $77,073 | $64,558 |
| Monthly Housing Costs | $655 | $27,204 |
| Real Estate Taxes | $2,996 | $2,492 |
Property Value by Mortgage Status in St. Louis County
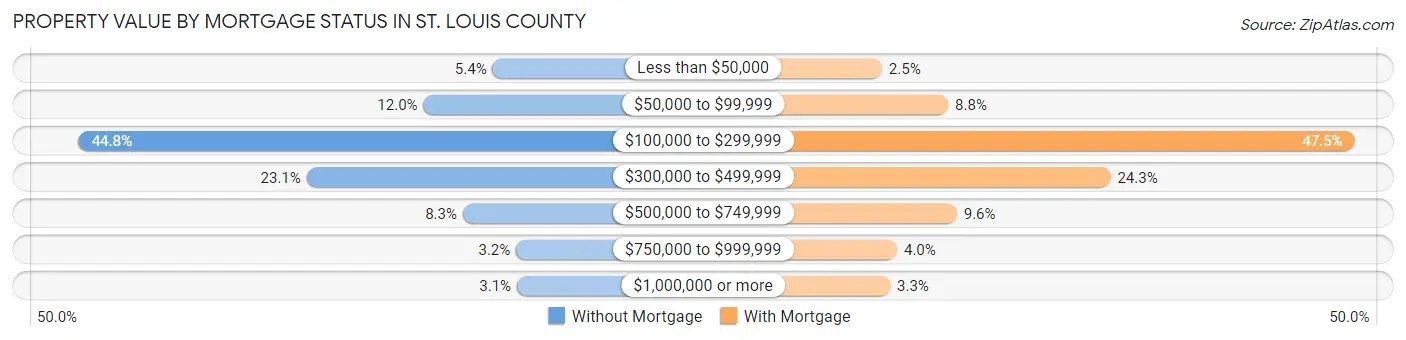
| Property Value | Without Mortgage | With Mortgage |
| Less than $50,000 | 5,401 (5.4%) | 4,606 (2.5%) |
| $50,000 to $99,999 | 11,936 (12.0%) | 16,202 (8.8%) |
| $100,000 to $299,999 | 44,537 (44.8%) | 87,265 (47.5%) |
| $300,000 to $499,999 | 22,982 (23.1%) | 44,602 (24.3%) |
| $500,000 to $749,999 | 8,212 (8.3%) | 17,714 (9.6%) |
| $750,000 to $999,999 | 3,173 (3.2%) | 7,248 (4.0%) |
| $1,000,000 or more | 3,090 (3.1%) | 6,039 (3.3%) |
| Total | 99,331 (100.0%) | 183,676 (100.0%) |
Household Income by Mortgage Status in St. Louis County
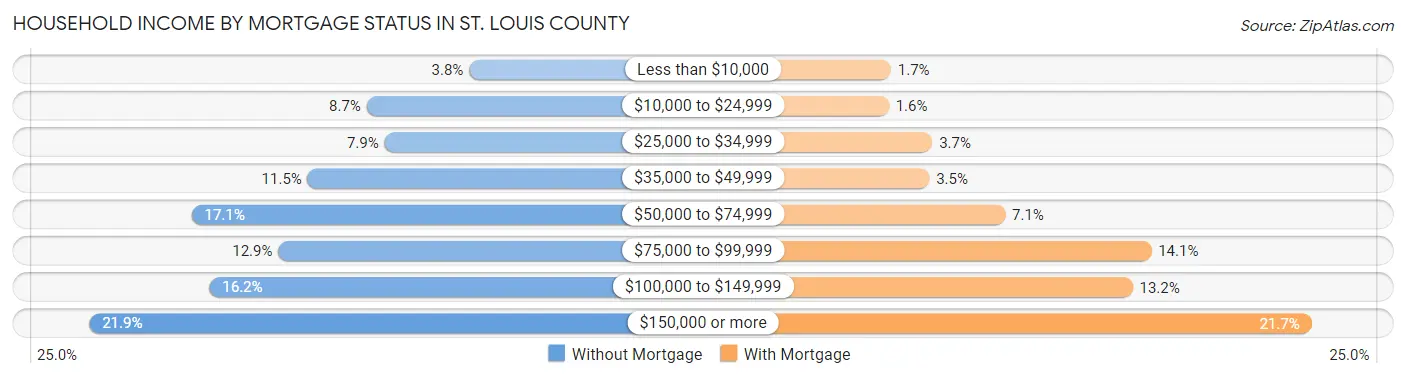
| Household Income | Without Mortgage | With Mortgage |
| Less than $10,000 | 3,803 (3.8%) | 3,078 (1.7%) |
| $10,000 to $24,999 | 8,648 (8.7%) | 2,899 (1.6%) |
| $25,000 to $34,999 | 7,808 (7.9%) | 6,704 (3.6%) |
| $35,000 to $49,999 | 11,446 (11.5%) | 6,452 (3.5%) |
| $50,000 to $74,999 | 16,934 (17.1%) | 13,084 (7.1%) |
| $75,000 to $99,999 | 12,830 (12.9%) | 25,856 (14.1%) |
| $100,000 to $149,999 | 16,089 (16.2%) | 24,222 (13.2%) |
| $150,000 or more | 21,773 (21.9%) | 39,901 (21.7%) |
| Total | 99,331 (100.0%) | 183,676 (100.0%) |
Property Value to Household Income Ratio in St. Louis County
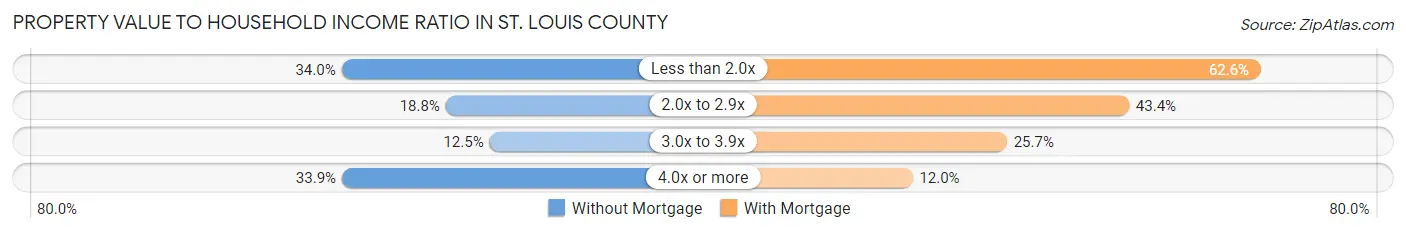
| Value-to-Income Ratio | Without Mortgage | With Mortgage |
| Less than 2.0x | 33,734 (34.0%) | 115,024 (62.6%) |
| 2.0x to 2.9x | 18,691 (18.8%) | 79,780 (43.4%) |
| 3.0x to 3.9x | 12,378 (12.5%) | 47,193 (25.7%) |
| 4.0x or more | 33,671 (33.9%) | 22,023 (12.0%) |
| Total | 99,331 (100.0%) | 183,676 (100.0%) |
Real Estate Taxes by Mortgage Status in St. Louis County
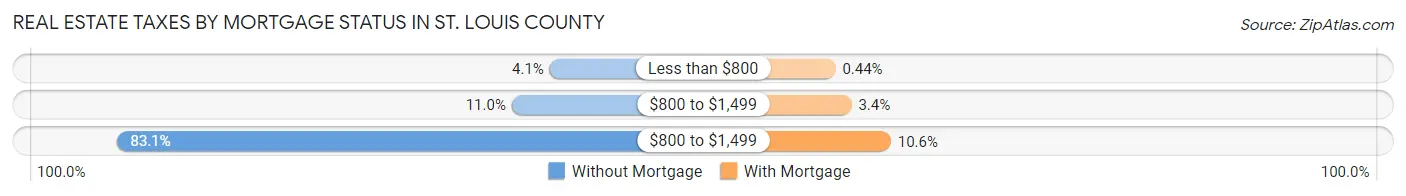
| Property Taxes | Without Mortgage | With Mortgage |
| Less than $800 | 4,063 (4.1%) | 810 (0.4%) |
| $800 to $1,499 | 10,952 (11.0%) | 6,179 (3.4%) |
| $800 to $1,499 | 82,494 (83.1%) | 19,376 (10.5%) |
| Total | 99,331 (100.0%) | 183,676 (100.0%) |
Health & Disability in St. Louis County
Health Insurance Coverage by Age in St. Louis County
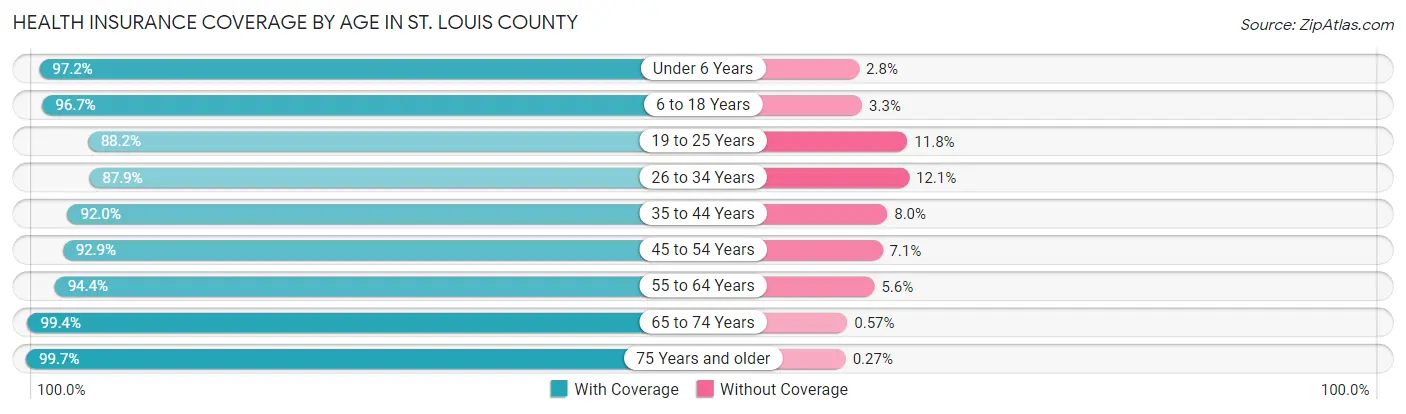
| Age Bracket | With Coverage | Without Coverage |
| Under 6 Years | 67,135 (97.2%) | 1,910 (2.8%) |
| 6 to 18 Years | 158,137 (96.7%) | 5,453 (3.3%) |
| 19 to 25 Years | 76,030 (88.2%) | 10,146 (11.8%) |
| 26 to 34 Years | 99,254 (87.9%) | 13,639 (12.1%) |
| 35 to 44 Years | 113,667 (92.0%) | 9,912 (8.0%) |
| 45 to 54 Years | 110,770 (92.9%) | 8,477 (7.1%) |
| 55 to 64 Years | 128,740 (94.4%) | 7,671 (5.6%) |
| 65 to 74 Years | 103,374 (99.4%) | 592 (0.6%) |
| 75 Years and older | 73,419 (99.7%) | 197 (0.3%) |
| Total | 930,526 (94.1%) | 57,997 (5.9%) |
Health Insurance Coverage by Citizenship Status in St. Louis County
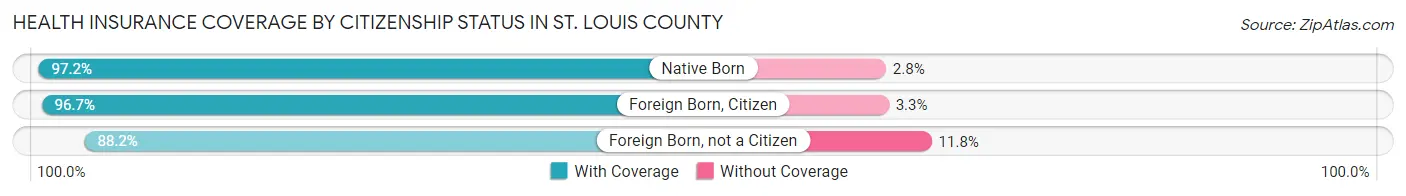
| Citizenship Status | With Coverage | Without Coverage |
| Native Born | 67,135 (97.2%) | 1,910 (2.8%) |
| Foreign Born, Citizen | 158,137 (96.7%) | 5,453 (3.3%) |
| Foreign Born, not a Citizen | 76,030 (88.2%) | 10,146 (11.8%) |
Health Insurance Coverage by Household Income in St. Louis County
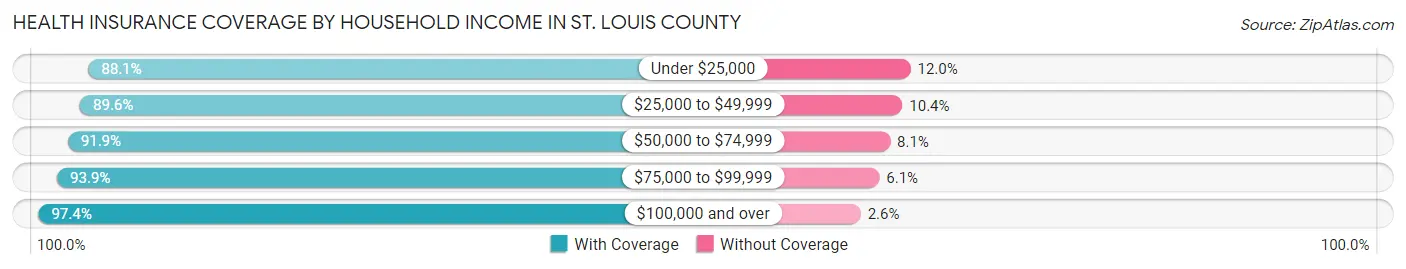
| Household Income | With Coverage | Without Coverage |
| Under $25,000 | 80,486 (88.0%) | 10,927 (11.9%) |
| $25,000 to $49,999 | 125,570 (89.6%) | 14,594 (10.4%) |
| $50,000 to $74,999 | 135,830 (91.9%) | 11,995 (8.1%) |
| $75,000 to $99,999 | 116,267 (93.9%) | 7,552 (6.1%) |
| $100,000 and over | 464,537 (97.4%) | 12,445 (2.6%) |
Public vs Private Health Insurance Coverage by Age in St. Louis County
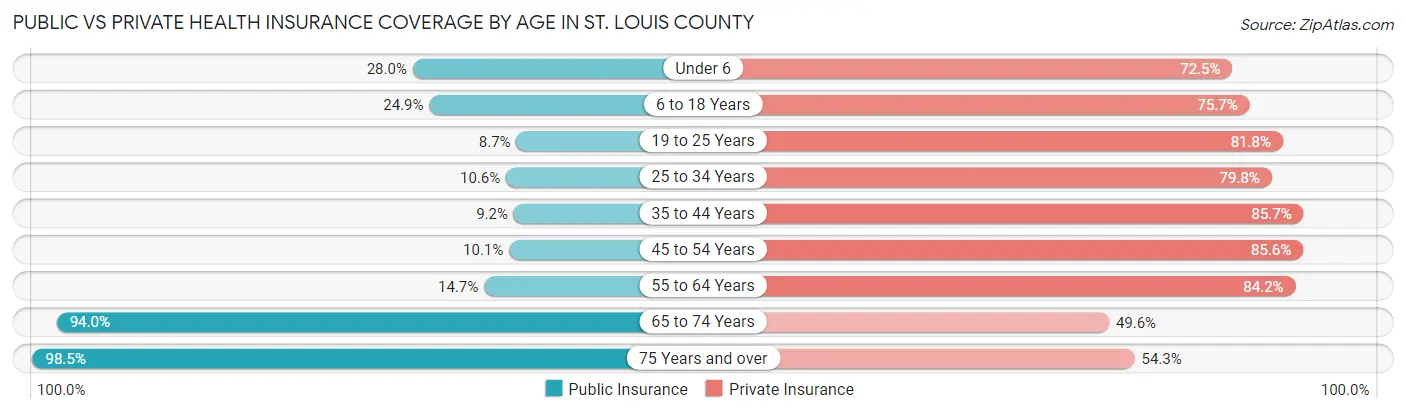
| Age Bracket | Public Insurance | Private Insurance |
| Under 6 | 19,304 (28.0%) | 50,045 (72.5%) |
| 6 to 18 Years | 40,688 (24.9%) | 123,818 (75.7%) |
| 19 to 25 Years | 7,503 (8.7%) | 70,526 (81.8%) |
| 25 to 34 Years | 11,993 (10.6%) | 90,069 (79.8%) |
| 35 to 44 Years | 11,370 (9.2%) | 105,904 (85.7%) |
| 45 to 54 Years | 12,006 (10.1%) | 102,102 (85.6%) |
| 55 to 64 Years | 20,077 (14.7%) | 114,845 (84.2%) |
| 65 to 74 Years | 97,762 (94.0%) | 51,559 (49.6%) |
| 75 Years and over | 72,530 (98.5%) | 40,006 (54.3%) |
| Total | 293,233 (29.7%) | 748,874 (75.8%) |
Disability Status by Sex by Age in St. Louis County
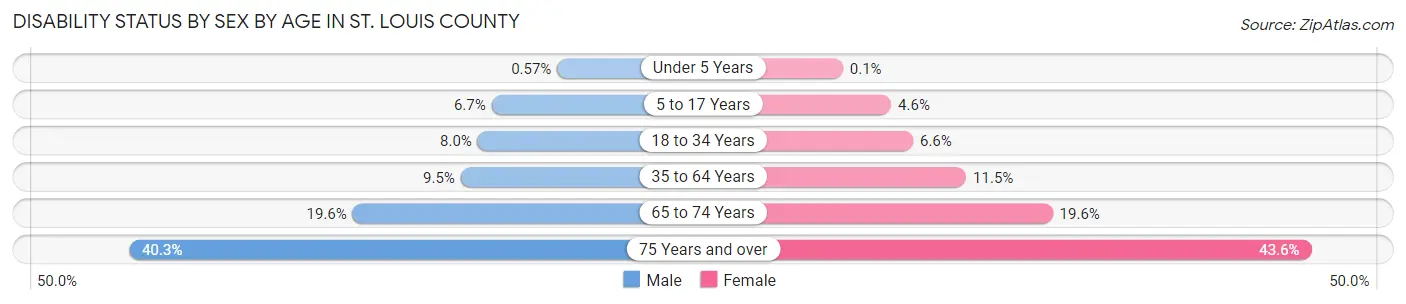
| Age Bracket | Male | Female |
| Under 5 Years | 167 (0.6%) | 28 (0.1%) |
| 5 to 17 Years | 5,510 (6.7%) | 3,621 (4.6%) |
| 18 to 34 Years | 8,314 (8.0%) | 7,150 (6.6%) |
| 35 to 64 Years | 17,214 (9.5%) | 22,915 (11.5%) |
| 65 to 74 Years | 9,160 (19.6%) | 11,180 (19.6%) |
| 75 Years and over | 11,626 (40.3%) | 19,512 (43.6%) |
Disability Class by Sex by Age in St. Louis County
Disability Class: Hearing Difficulty
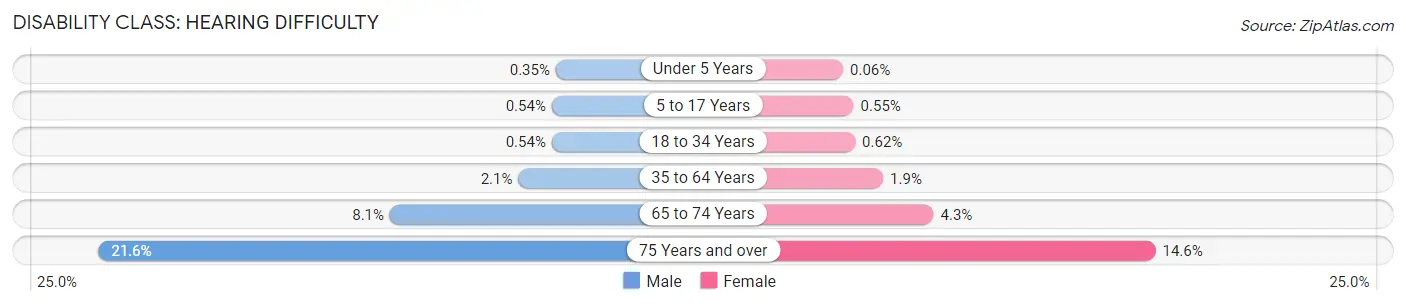
| Age Bracket | Male | Female |
| Under 5 Years | 103 (0.4%) | 17 (0.1%) |
| 5 to 17 Years | 449 (0.5%) | 439 (0.5%) |
| 18 to 34 Years | 568 (0.5%) | 668 (0.6%) |
| 35 to 64 Years | 3,778 (2.1%) | 3,820 (1.9%) |
| 65 to 74 Years | 3,771 (8.1%) | 2,435 (4.3%) |
| 75 Years and over | 6,226 (21.6%) | 6,520 (14.6%) |
Disability Class: Vision Difficulty
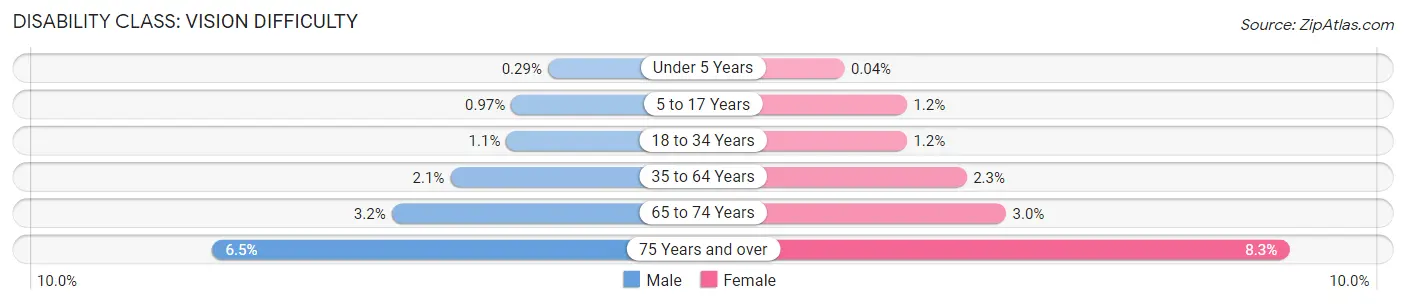
| Age Bracket | Male | Female |
| Under 5 Years | 85 (0.3%) | 11 (0.0%) |
| 5 to 17 Years | 799 (1.0%) | 947 (1.2%) |
| 18 to 34 Years | 1,108 (1.1%) | 1,301 (1.2%) |
| 35 to 64 Years | 3,790 (2.1%) | 4,592 (2.3%) |
| 65 to 74 Years | 1,495 (3.2%) | 1,739 (3.0%) |
| 75 Years and over | 1,877 (6.5%) | 3,716 (8.3%) |
Disability Class: Cognitive Difficulty
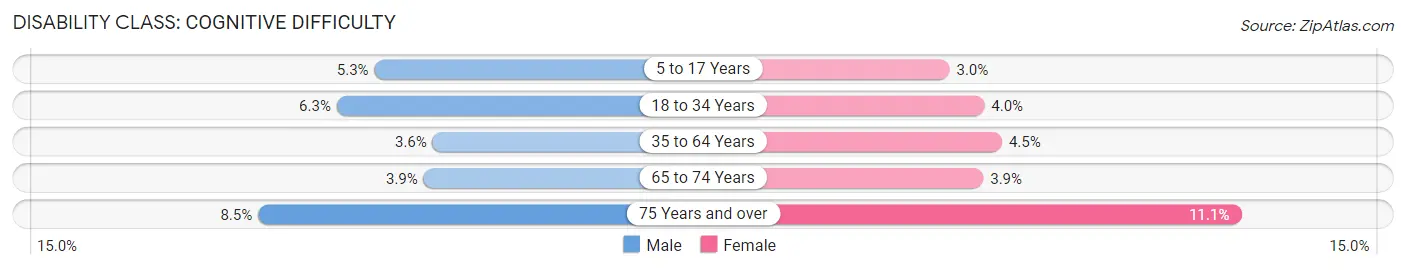
| Age Bracket | Male | Female |
| 5 to 17 Years | 4,357 (5.3%) | 2,376 (3.0%) |
| 18 to 34 Years | 6,602 (6.3%) | 4,290 (4.0%) |
| 35 to 64 Years | 6,584 (3.6%) | 8,858 (4.5%) |
| 65 to 74 Years | 1,822 (3.9%) | 2,250 (3.9%) |
| 75 Years and over | 2,452 (8.5%) | 4,978 (11.1%) |
Disability Class: Ambulatory Difficulty
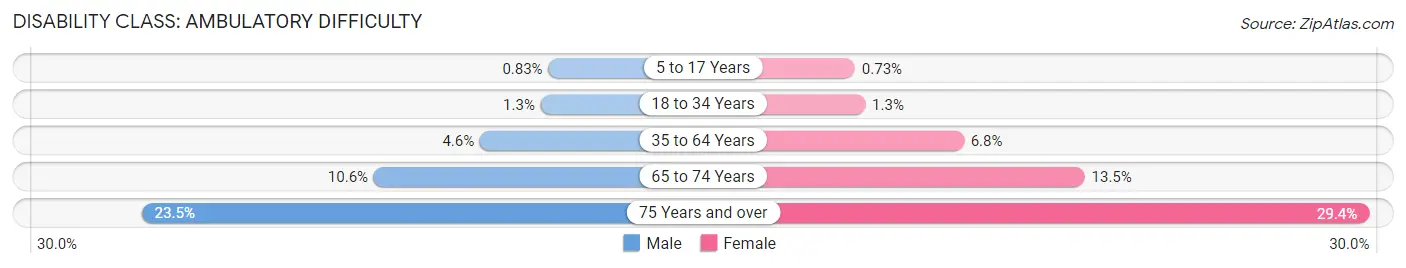
| Age Bracket | Male | Female |
| 5 to 17 Years | 687 (0.8%) | 577 (0.7%) |
| 18 to 34 Years | 1,314 (1.3%) | 1,411 (1.3%) |
| 35 to 64 Years | 8,379 (4.6%) | 13,472 (6.8%) |
| 65 to 74 Years | 4,943 (10.5%) | 7,727 (13.5%) |
| 75 Years and over | 6,772 (23.5%) | 13,147 (29.4%) |
Disability Class: Self-Care Difficulty
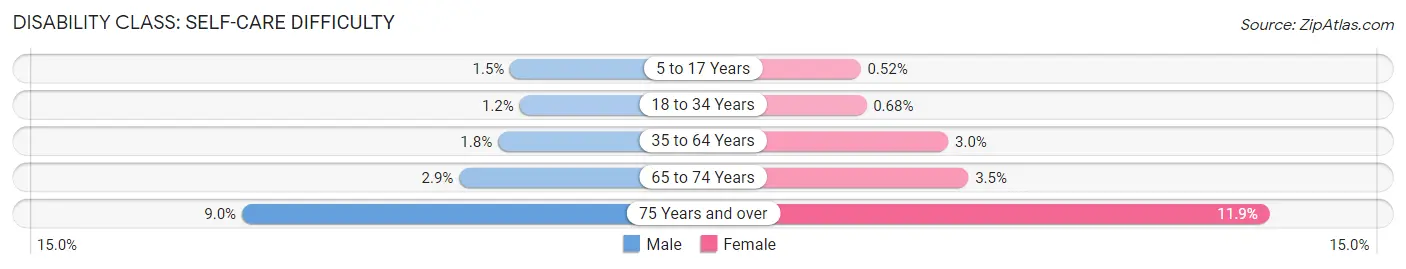
| Age Bracket | Male | Female |
| 5 to 17 Years | 1,226 (1.5%) | 414 (0.5%) |
| 18 to 34 Years | 1,275 (1.2%) | 731 (0.7%) |
| 35 to 64 Years | 3,298 (1.8%) | 5,884 (3.0%) |
| 65 to 74 Years | 1,358 (2.9%) | 2,009 (3.5%) |
| 75 Years and over | 2,581 (8.9%) | 5,332 (11.9%) |
Technology Access in St. Louis County
Computing Device Access in St. Louis County
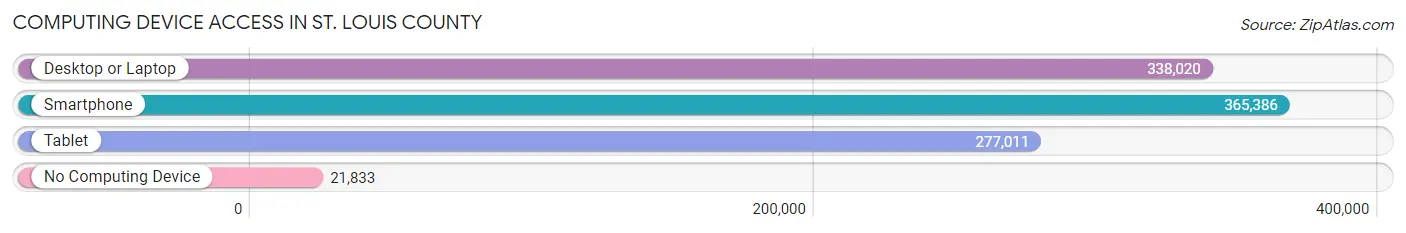
| Device Type | # Households | % Households |
| Desktop or Laptop | 338,020 | 81.8% |
| Smartphone | 365,386 | 88.4% |
| Tablet | 277,011 | 67.0% |
| No Computing Device | 21,833 | 5.3% |
| Total | 413,247 | 100.0% |
Internet Access in St. Louis County
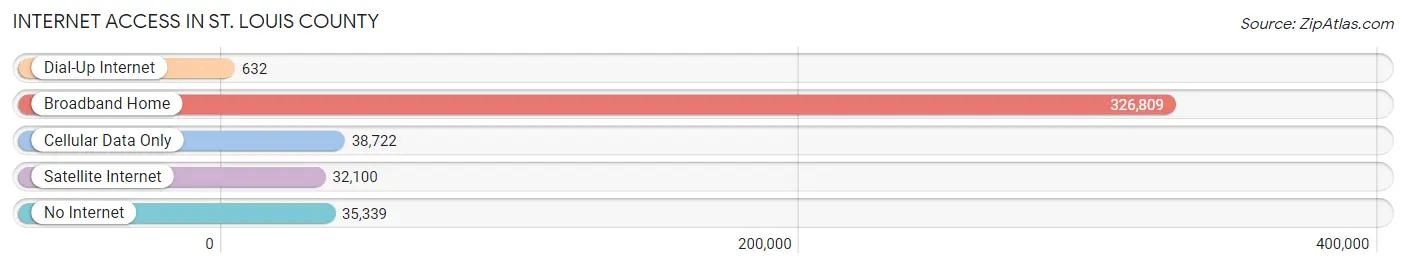
| Internet Type | # Households | % Households |
| Dial-Up Internet | 632 | 0.2% |
| Broadband Home | 326,809 | 79.1% |
| Cellular Data Only | 38,722 | 9.4% |
| Satellite Internet | 32,100 | 7.8% |
| No Internet | 35,339 | 8.6% |
| Total | 413,247 | 100.0% |
St. Louis County Summary
St. Louis County, Missouri is located in the eastern portion of the state and is the most populous county in the state. It is bordered by the Mississippi River to the east, the Missouri River to the north, and the Meramec River to the south. The county seat is Clayton, and the largest city is St. Louis.
History
St. Louis County was established in 1812, and was named after King Louis IX of France. The county was originally part of the Louisiana Purchase, and was part of the Missouri Territory until 1821. The county was originally divided into three townships, St. Louis, Carondelet, and St. Ferdinand.
In 1876, St. Louis County was divided into two parts, the City of St. Louis and the County of St. Louis. The City of St. Louis was incorporated in 1877, and the County of St. Louis was established in 1879.
Geography
St. Louis County covers an area of 523 square miles, and is located in the eastern portion of the state. The county is bordered by the Mississippi River to the east, the Missouri River to the north, and the Meramec River to the south. The county is mostly flat, with some rolling hills in the northern and western parts.
The county is home to several parks, including Forest Park, Tower Grove Park, and the Missouri Botanical Garden. The county also contains several lakes, including Creve Coeur Lake, Lake St. Louis, and Lake of the Ozarks.
Economy
St. Louis County has a diverse economy, with a variety of industries. The county is home to several Fortune 500 companies, including Express Scripts, Monsanto, and Emerson Electric. The county is also home to several major universities, including Washington University in St. Louis, Saint Louis University, and the University of Missouri-St. Louis.
The county is also home to several major sports teams, including the St. Louis Cardinals, St. Louis Blues, and St. Louis Rams. The county is also home to several major cultural attractions, including the St. Louis Zoo, the St. Louis Art Museum, and the Missouri History Museum.
Demographics
As of the 2010 census, St. Louis County had a population of 1,003,362. The population was spread out, with 24.3% under the age of 18, 10.2% from 18 to 24, 28.2% from 25 to 44, 24.3% from 45 to 64, and 12.9% who were 65 years of age or older. The median age was 36.7 years.
The racial makeup of the county was 68.2% White, 25.2% African American, 0.3% Native American, 2.3% Asian, 0.1% Pacific Islander, 1.3% from other races, and 2.6% from two or more races. Hispanic or Latino of any race were 4.2% of the population.
The median income for a household in the county was $50,817, and the median income for a family was $60,879. The per capita income for the county was $27,837. About 8.7% of families and 11.3% of the population were below the poverty line, including 16.2% of those under age 18 and 8.2% of those age 65 or over.
Common Questions
What is Per Capita Income in St. Louis County?
Per Capita income in St. Louis County is $49,009.
What is the Median Family Income in St. Louis County?
Median Family Income in St. Louis County is $104,371.
What is the Median Household income in St. Louis County?
Median Household Income in St. Louis County is $78,067.
What is Income or Wage Gap in St. Louis County?
Income or Wage Gap in St. Louis County is 28.5%.
Women in St. Louis County earn 71.5 cents for every dollar earned by a man.
What is Family Income Deficit in St. Louis County?
Family Income Deficit in St. Louis County is $10,837.
Families that are below poverty line in St. Louis County earn $10,837 less on average than the poverty threshold level.
What is Inequality or Gini Index in St. Louis County?
Inequality or Gini Index in St. Louis County is 0.50.
What is the Total Population of St. Louis County?
Total Population of St. Louis County is 999,703.
What is the Total Male Population of St. Louis County?
Total Male Population of St. Louis County is 478,717.
What is the Total Female Population of St. Louis County?
Total Female Population of St. Louis County is 520,986.
What is the Ratio of Males per 100 Females in St. Louis County?
There are 91.89 Males per 100 Females in St. Louis County.
What is the Ratio of Females per 100 Males in St. Louis County?
There are 108.83 Females per 100 Males in St. Louis County.
What is the Median Population Age in St. Louis County?
Median Population Age in St. Louis County is 40.2 Years.
What is the Average Family Size in St. Louis County
Average Family Size in St. Louis County is 3.0 People.
What is the Average Household Size in St. Louis County
Average Household Size in St. Louis County is 2.4 People.
How Large is the Labor Force in St. Louis County?
There are 522,748 People in the Labor Forcein in St. Louis County.
What is the Percentage of People in the Labor Force in St. Louis County?
64.8% of People are in the Labor Force in St. Louis County.
What is the Unemployment Rate in St. Louis County?
Unemployment Rate in St. Louis County is 4.3%.