St. Clair County, MO Map & Demographics
St. Clair County Map
St. Clair County Overview
$24,845
PER CAPITA INCOME
$58,561
AVG FAMILY INCOME
$43,483
AVG HOUSEHOLD INCOME
26.9%
WAGE / INCOME GAP [ % ]
73.1¢/ $1
WAGE / INCOME GAP [ $ ]
$8,593
FAMILY INCOME DEFICIT
0.43
INEQUALITY / GINI INDEX
9,330
TOTAL POPULATION
4,737
MALE POPULATION
4,593
FEMALE POPULATION
103.14
MALES / 100 FEMALES
96.96
FEMALES / 100 MALES
48.2
MEDIAN AGE
2.9
AVG FAMILY SIZE
2.3
AVG HOUSEHOLD SIZE
3,887
LABOR FORCE [ PEOPLE ]
50.4%
PERCENT IN LABOR FORCE
2.5%
UNEMPLOYMENT RATE
Income in St. Clair County
Income Overview in St. Clair County
Per Capita Income in St. Clair County is $24,845, while median incomes of families and households are $58,561 and $43,483 respectively.
| Characteristic | Number | Measure |
| Per Capita Income | 9,330 | $24,845 |
| Median Family Income | 2,452 | $58,561 |
| Mean Family Income | 2,452 | $70,991 |
| Median Household Income | 3,955 | $43,483 |
| Mean Household Income | 3,955 | $57,948 |
| Income Deficit | 2,452 | $8,593 |
| Wage / Income Gap (%) | 9,330 | 26.91% |
| Wage / Income Gap ($) | 9,330 | 73.09¢ per $1 |
| Gini / Inequality Index | 9,330 | 0.43 |
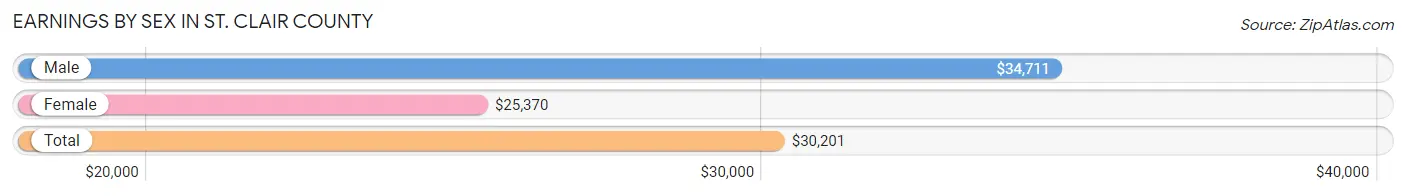
Earnings by Sex in St. Clair County
Average Earnings in St. Clair County are $30,201, $34,711 for men and $25,370 for women, a difference of 26.9%.
| Sex | Number | Average Earnings |
| Male | 2,168 (51.2%) | $34,711 |
| Female | 2,062 (48.7%) | $25,370 |
| Total | 4,230 (100.0%) | $30,201 |
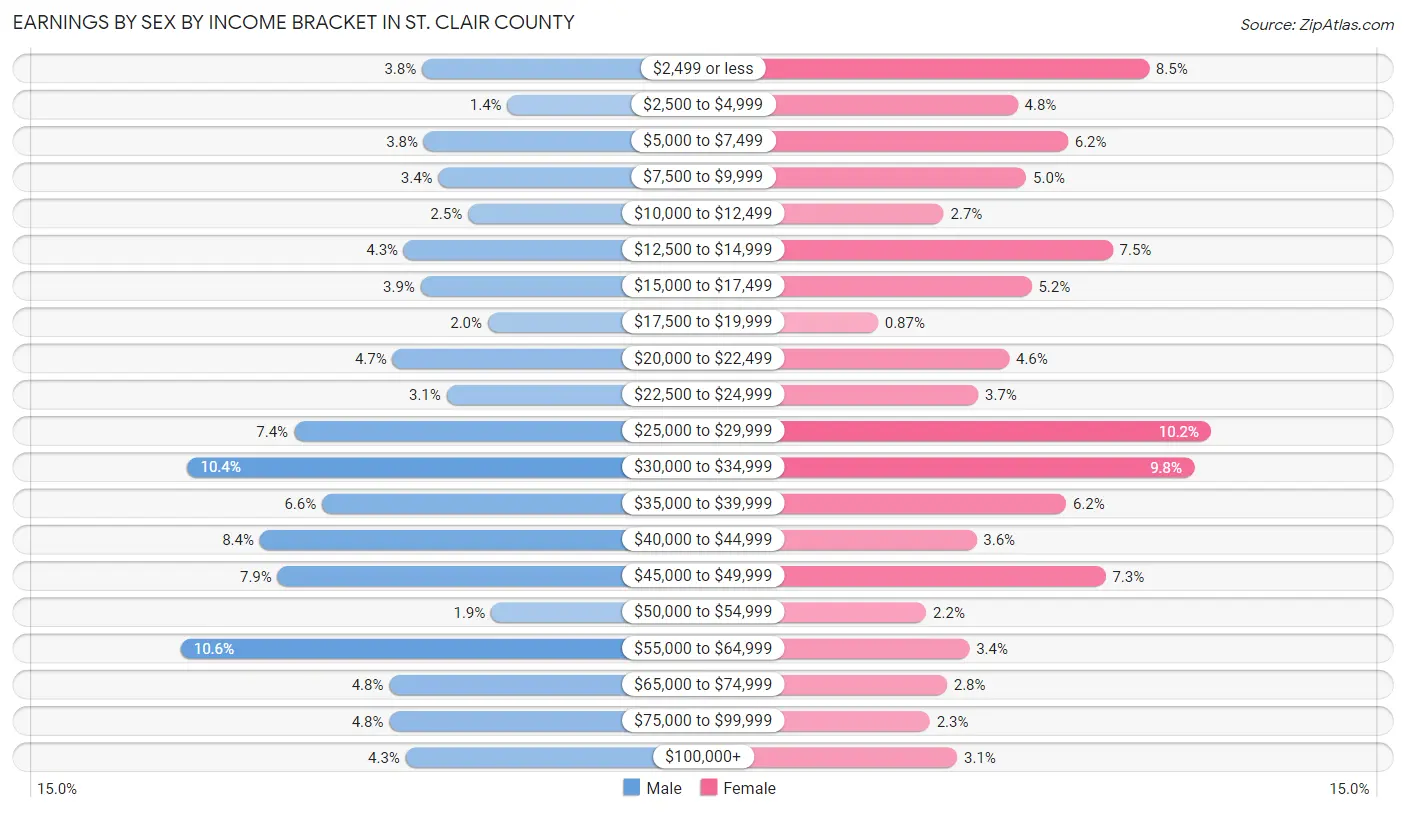
Earnings by Sex by Income Bracket in St. Clair County
The most common earnings brackets in St. Clair County are $55,000 to $64,999 for men (230 | 10.6%) and $25,000 to $29,999 for women (211 | 10.2%).
| Income | Male | Female |
| $2,499 or less | 83 (3.8%) | 175 (8.5%) |
| $2,500 to $4,999 | 31 (1.4%) | 99 (4.8%) |
| $5,000 to $7,499 | 82 (3.8%) | 128 (6.2%) |
| $7,500 to $9,999 | 73 (3.4%) | 104 (5.0%) |
| $10,000 to $12,499 | 55 (2.5%) | 56 (2.7%) |
| $12,500 to $14,999 | 94 (4.3%) | 154 (7.5%) |
| $15,000 to $17,499 | 84 (3.9%) | 107 (5.2%) |
| $17,500 to $19,999 | 43 (2.0%) | 18 (0.9%) |
| $20,000 to $22,499 | 101 (4.7%) | 94 (4.6%) |
| $22,500 to $24,999 | 68 (3.1%) | 76 (3.7%) |
| $25,000 to $29,999 | 161 (7.4%) | 211 (10.2%) |
| $30,000 to $34,999 | 226 (10.4%) | 201 (9.8%) |
| $35,000 to $39,999 | 144 (6.6%) | 127 (6.2%) |
| $40,000 to $44,999 | 182 (8.4%) | 75 (3.6%) |
| $45,000 to $49,999 | 171 (7.9%) | 150 (7.3%) |
| $50,000 to $54,999 | 41 (1.9%) | 46 (2.2%) |
| $55,000 to $64,999 | 230 (10.6%) | 71 (3.4%) |
| $65,000 to $74,999 | 103 (4.8%) | 58 (2.8%) |
| $75,000 to $99,999 | 103 (4.8%) | 48 (2.3%) |
| $100,000+ | 93 (4.3%) | 64 (3.1%) |
| Total | 2,168 (100.0%) | 2,062 (100.0%) |
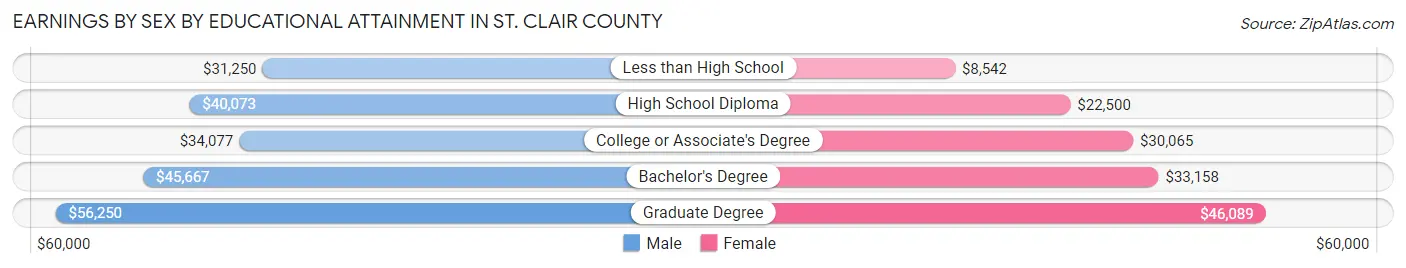
Earnings by Sex by Educational Attainment in St. Clair County
Average earnings in St. Clair County are $37,308 for men and $27,005 for women, a difference of 27.6%. Men with an educational attainment of graduate degree enjoy the highest average annual earnings of $56,250, while those with less than high school education earn the least with $31,250. Women with an educational attainment of graduate degree earn the most with the average annual earnings of $46,089, while those with less than high school education have the smallest earnings of $8,542.
| Educational Attainment | Male Income | Female Income |
| Less than High School | $31,250 | $8,542 |
| High School Diploma | $40,073 | $22,500 |
| College or Associate's Degree | $34,077 | $30,065 |
| Bachelor's Degree | $45,667 | $33,158 |
| Graduate Degree | $56,250 | $46,089 |
| Total | $37,308 | $27,005 |
Family Income in St. Clair County
Family Income Brackets in St. Clair County
According to the St. Clair County family income data, there are 525 families falling into the $50,000 to $74,999 income range, which is the most common income bracket and makes up 21.4% of all families. Conversely, the $200,000+ income bracket is the least frequent group with only 66 families (2.7%) belonging to this category.
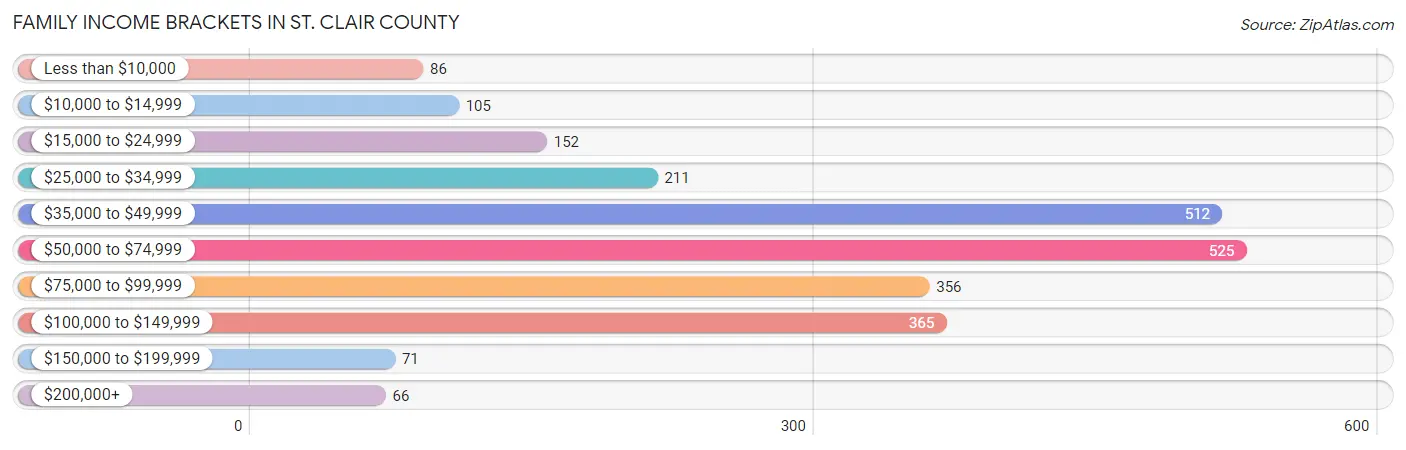
| Income Bracket | # Families | % Families |
| Less than $10,000 | 86 | 3.5% |
| $10,000 to $14,999 | 105 | 4.3% |
| $15,000 to $24,999 | 152 | 6.2% |
| $25,000 to $34,999 | 211 | 8.6% |
| $35,000 to $49,999 | 512 | 20.9% |
| $50,000 to $74,999 | 525 | 21.4% |
| $75,000 to $99,999 | 356 | 14.5% |
| $100,000 to $149,999 | 365 | 14.9% |
| $150,000 to $199,999 | 71 | 2.9% |
| $200,000+ | 66 | 2.7% |
Family Income by Famaliy Size in St. Clair County
6-person families (47 | 1.9%) account for the highest median family income in St. Clair County with $120,156 per family, while 2-person families (1,295 | 52.8%) have the highest median income of $24,146 per family member.
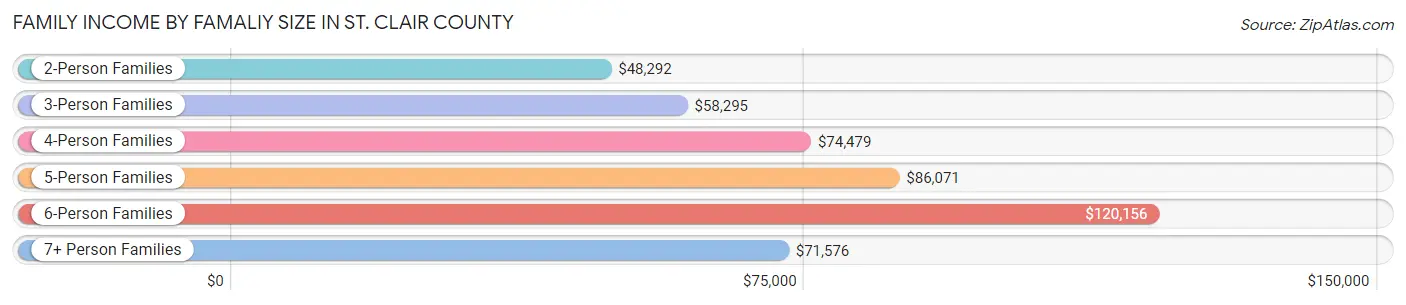
| Income Bracket | # Families | Median Income |
| 2-Person Families | 1,295 (52.8%) | $48,292 |
| 3-Person Families | 532 (21.7%) | $58,295 |
| 4-Person Families | 423 (17.2%) | $74,479 |
| 5-Person Families | 110 (4.5%) | $86,071 |
| 6-Person Families | 47 (1.9%) | $120,156 |
| 7+ Person Families | 45 (1.8%) | $71,576 |
| Total | 2,452 (100.0%) | $58,561 |
Family Income by Number of Earners in St. Clair County
The median family income in St. Clair County is $58,561, with families comprising 3+ earners (261) having the highest median family income of $86,150, while families with no earners (538) have the lowest median family income of $40,781, accounting for 10.6% and 21.9% of families, respectively.
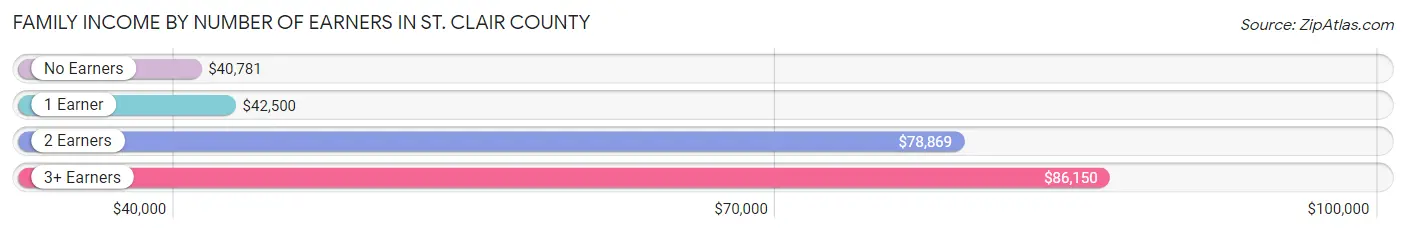
| Number of Earners | # Families | Median Income |
| No Earners | 538 (21.9%) | $40,781 |
| 1 Earner | 770 (31.4%) | $42,500 |
| 2 Earners | 883 (36.0%) | $78,869 |
| 3+ Earners | 261 (10.6%) | $86,150 |
| Total | 2,452 (100.0%) | $58,561 |
Household Income in St. Clair County
Household Income Brackets in St. Clair County
With 815 households falling in the category, the $35,000 to $49,999 income range is the most frequent in St. Clair County, accounting for 20.6% of all households. In contrast, only 75 households (1.9%) fall into the $150,000 to $199,999 income bracket, making it the least populous group.
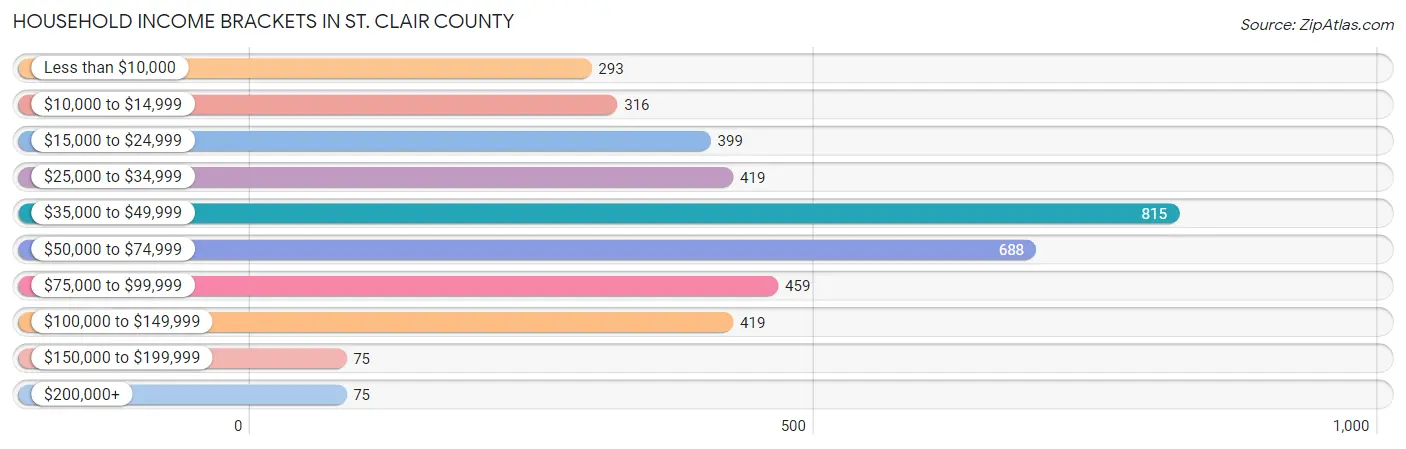
| Income Bracket | # Households | % Households |
| Less than $10,000 | 293 | 7.4% |
| $10,000 to $14,999 | 316 | 8.0% |
| $15,000 to $24,999 | 399 | 10.1% |
| $25,000 to $34,999 | 419 | 10.6% |
| $35,000 to $49,999 | 815 | 20.6% |
| $50,000 to $74,999 | 688 | 17.4% |
| $75,000 to $99,999 | 459 | 11.6% |
| $100,000 to $149,999 | 419 | 10.6% |
| $150,000 to $199,999 | 75 | 1.9% |
| $200,000+ | 75 | 1.9% |
Household Income by Householder Age in St. Clair County
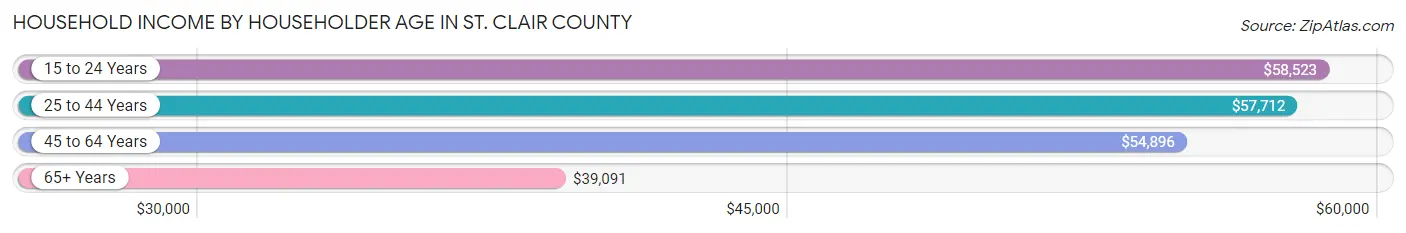
The median household income in St. Clair County is $43,483, with the highest median household income of $58,523 found in the 15 to 24 years age bracket for the primary householder. A total of 143 households (3.6%) fall into this category. Meanwhile, the 65+ years age bracket for the primary householder has the lowest median household income of $39,091, with 1,598 households (40.4%) in this group.
| Income Bracket | # Households | Median Income |
| 15 to 24 Years | 143 (3.6%) | $58,523 |
| 25 to 44 Years | 763 (19.3%) | $57,712 |
| 45 to 64 Years | 1,451 (36.7%) | $54,896 |
| 65+ Years | 1,598 (40.4%) | $39,091 |
| Total | 3,955 (100.0%) | $43,483 |
Poverty in St. Clair County
Income Below Poverty by Sex and Age in St. Clair County
With 14.6% poverty level for males and 16.9% for females among the residents of St. Clair County, 15 year old males and 15 year old females are the most vulnerable to poverty, with 11 males (28.9%) and 11 females (29.7%) in their respective age groups living below the poverty level.
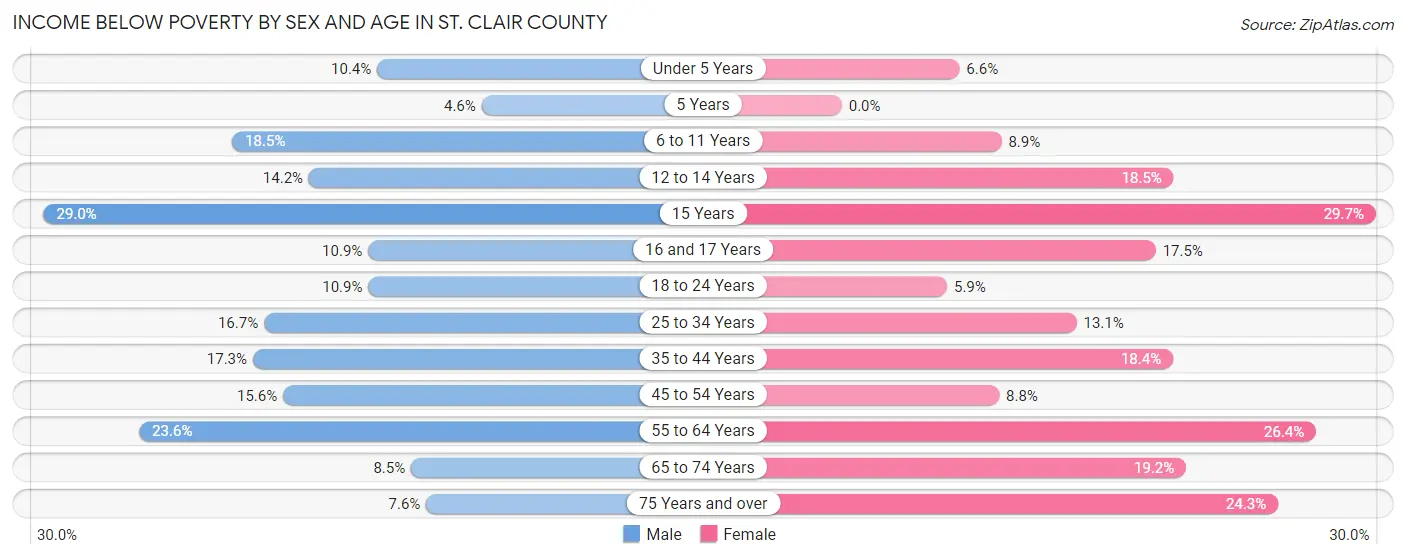
| Age Bracket | Male | Female |
| Under 5 Years | 28 (10.4%) | 15 (6.6%) |
| 5 Years | 3 (4.5%) | 0 (0.0%) |
| 6 to 11 Years | 50 (18.4%) | 20 (8.9%) |
| 12 to 14 Years | 17 (14.2%) | 39 (18.5%) |
| 15 Years | 11 (28.9%) | 11 (29.7%) |
| 16 and 17 Years | 15 (10.9%) | 25 (17.5%) |
| 18 to 24 Years | 33 (10.9%) | 16 (5.9%) |
| 25 to 34 Years | 73 (16.7%) | 57 (13.1%) |
| 35 to 44 Years | 74 (17.3%) | 83 (18.4%) |
| 45 to 54 Years | 86 (15.6%) | 46 (8.8%) |
| 55 to 64 Years | 177 (23.6%) | 187 (26.4%) |
| 65 to 74 Years | 58 (8.5%) | 124 (19.2%) |
| 75 Years and over | 35 (7.6%) | 129 (24.3%) |
| Total | 660 (14.6%) | 752 (16.9%) |
Income Above Poverty by Sex and Age in St. Clair County
According to the poverty statistics in St. Clair County, males aged 5 years and females aged 5 years are the age groups that are most secure financially, with 95.5% of males and 100.0% of females in these age groups living above the poverty line.
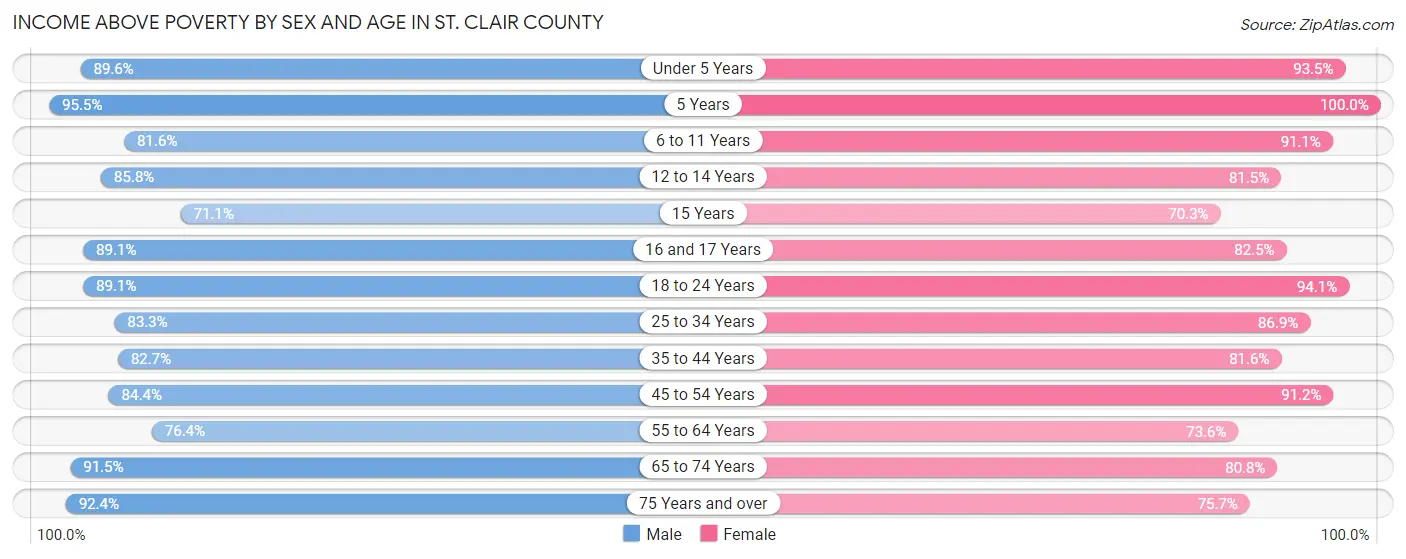
| Age Bracket | Male | Female |
| Under 5 Years | 242 (89.6%) | 214 (93.4%) |
| 5 Years | 63 (95.5%) | 41 (100.0%) |
| 6 to 11 Years | 221 (81.6%) | 205 (91.1%) |
| 12 to 14 Years | 103 (85.8%) | 172 (81.5%) |
| 15 Years | 27 (71.1%) | 26 (70.3%) |
| 16 and 17 Years | 123 (89.1%) | 118 (82.5%) |
| 18 to 24 Years | 271 (89.1%) | 257 (94.1%) |
| 25 to 34 Years | 365 (83.3%) | 379 (86.9%) |
| 35 to 44 Years | 354 (82.7%) | 367 (81.6%) |
| 45 to 54 Years | 465 (84.4%) | 479 (91.2%) |
| 55 to 64 Years | 572 (76.4%) | 521 (73.6%) |
| 65 to 74 Years | 626 (91.5%) | 523 (80.8%) |
| 75 Years and over | 423 (92.4%) | 402 (75.7%) |
| Total | 3,855 (85.4%) | 3,704 (83.1%) |
Income Below Poverty Among Married-Couple Families in St. Clair County
The poverty statistics for married-couple families in St. Clair County show that 9.1% or 173 of the total 1,910 families live below the poverty line. Families with no children have the highest poverty rate of 10.1%, comprising of 129 families. On the other hand, families with 5 or more children have the lowest poverty rate of 0.0%, which includes 0 families.
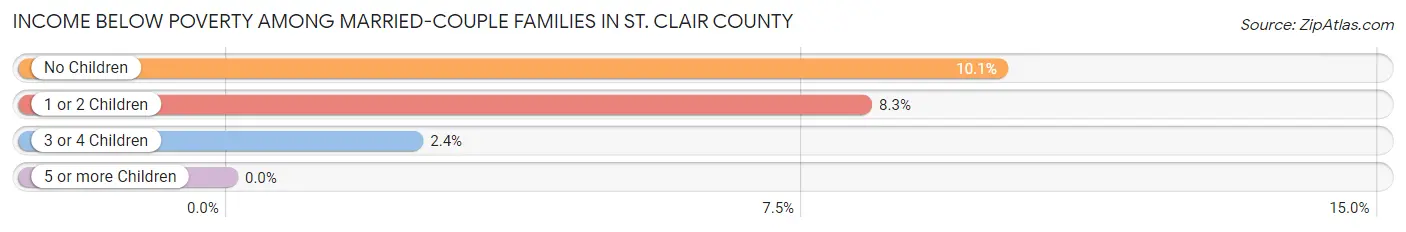
| Children | Above Poverty | Below Poverty |
| No Children | 1,153 (89.9%) | 129 (10.1%) |
| 1 or 2 Children | 454 (91.7%) | 41 (8.3%) |
| 3 or 4 Children | 121 (97.6%) | 3 (2.4%) |
| 5 or more Children | 9 (100.0%) | 0 (0.0%) |
| Total | 1,737 (90.9%) | 173 (9.1%) |
Income Below Poverty Among Single-Parent Households in St. Clair County
According to the poverty data in St. Clair County, 27.2% or 53 single-father households and 24.8% or 86 single-mother households are living below the poverty line. Among single-father households, those with 3 or 4 children have the highest poverty rate, with 26 households (96.3%) experiencing poverty. Likewise, among single-mother households, those with 5 or more children have the highest poverty rate, with 3 households (100.0%) falling below the poverty line.
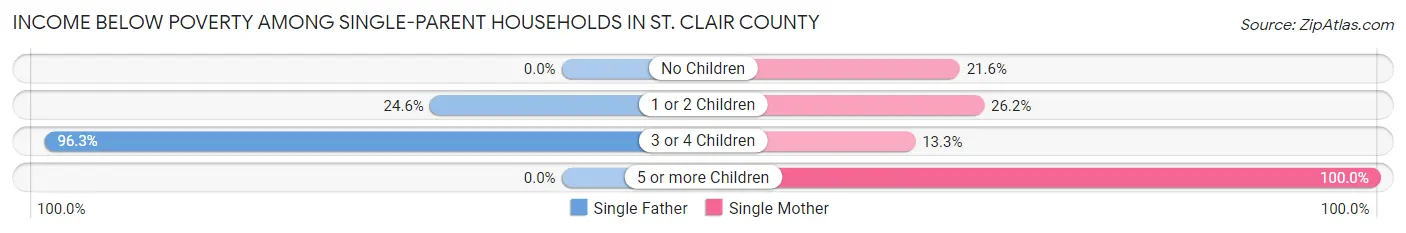
| Children | Single Father | Single Mother |
| No Children | 0 (0.0%) | 24 (21.6%) |
| 1 or 2 Children | 27 (24.5%) | 57 (26.2%) |
| 3 or 4 Children | 26 (96.3%) | 2 (13.3%) |
| 5 or more Children | 0 (0.0%) | 3 (100.0%) |
| Total | 53 (27.2%) | 86 (24.8%) |
Income Below Poverty Among Married-Couple vs Single-Parent Households in St. Clair County
The poverty data for St. Clair County shows that 173 of the married-couple family households (9.1%) and 139 of the single-parent households (25.7%) are living below the poverty level. Within the married-couple family households, those with no children have the highest poverty rate, with 129 households (10.1%) falling below the poverty line. Among the single-parent households, those with 5 or more children have the highest poverty rate, with 3 household (100.0%) living below poverty.
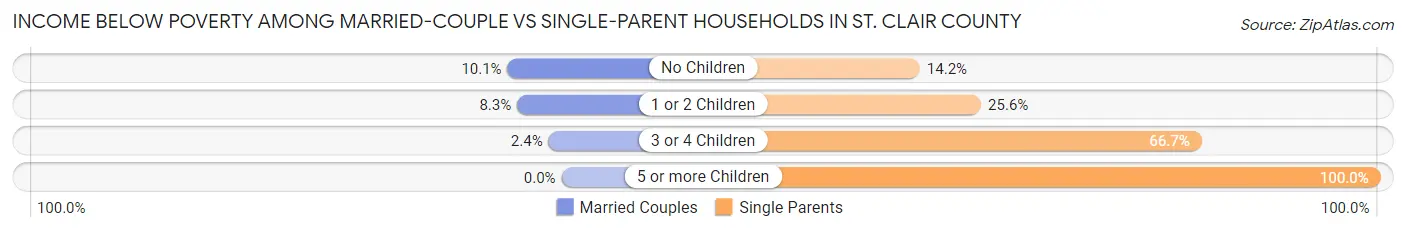
| Children | Married-Couple Families | Single-Parent Households |
| No Children | 129 (10.1%) | 24 (14.2%) |
| 1 or 2 Children | 41 (8.3%) | 84 (25.6%) |
| 3 or 4 Children | 3 (2.4%) | 28 (66.7%) |
| 5 or more Children | 0 (0.0%) | 3 (100.0%) |
| Total | 173 (9.1%) | 139 (25.7%) |
Race in St. Clair County
The most populous races in St. Clair County are White / Caucasian (8,709 | 93.3%), Two or more Races (419 | 4.5%), and Hispanic or Latino (221 | 2.4%).
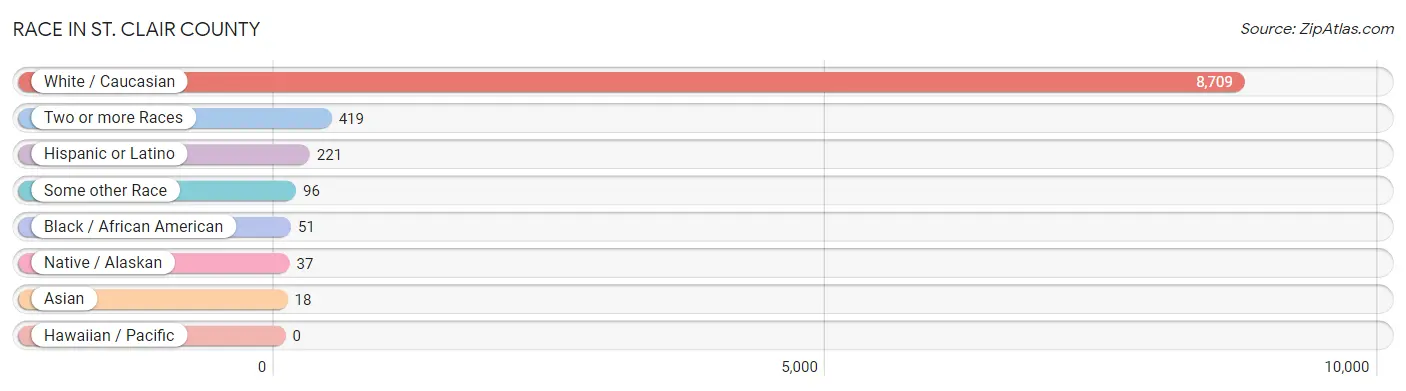
| Race | # Population | % Population |
| Asian | 18 | 0.2% |
| Black / African American | 51 | 0.5% |
| Hawaiian / Pacific | 0 | 0.0% |
| Hispanic or Latino | 221 | 2.4% |
| Native / Alaskan | 37 | 0.4% |
| White / Caucasian | 8,709 | 93.3% |
| Two or more Races | 419 | 4.5% |
| Some other Race | 96 | 1.0% |
| Total | 9,330 | 100.0% |
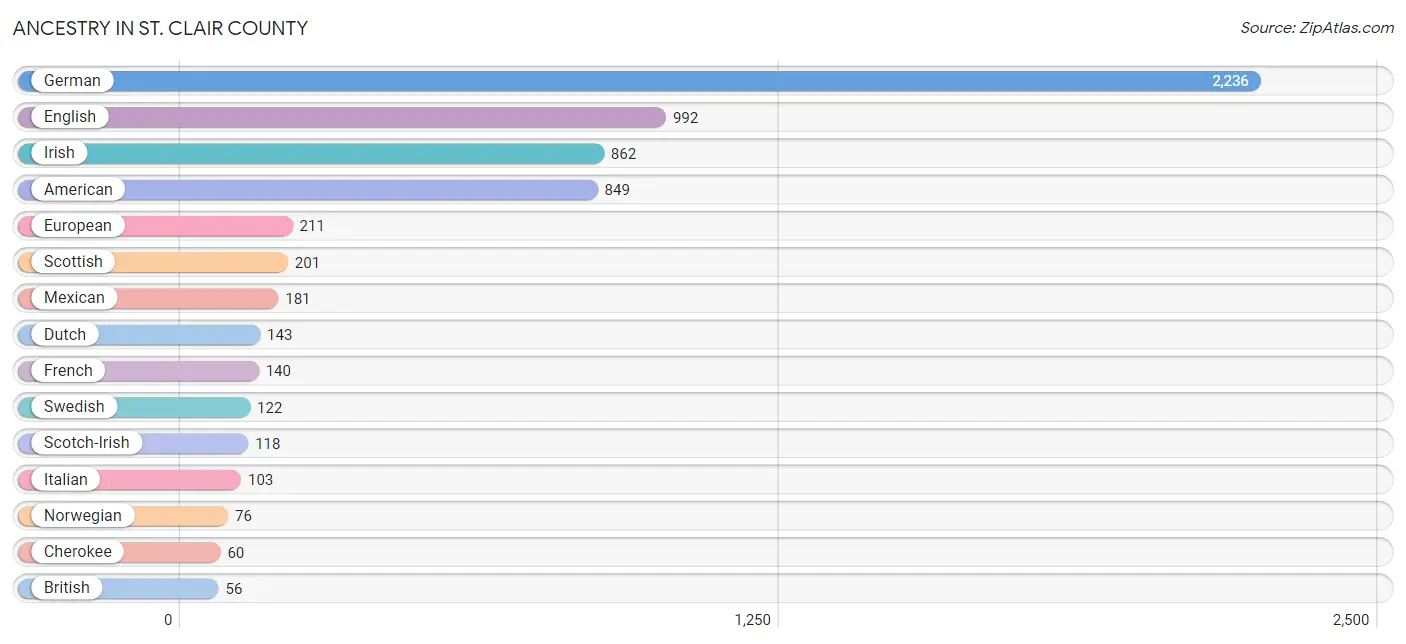
Ancestry in St. Clair County
The most populous ancestries reported in St. Clair County are German (2,236 | 24.0%), English (992 | 10.6%), Irish (862 | 9.2%), American (849 | 9.1%), and European (211 | 2.3%), together accounting for 55.2% of all St. Clair County residents.
| Ancestry | # Population | % Population |
| American | 849 | 9.1% |
| Arab | 41 | 0.4% |
| Arapaho | 20 | 0.2% |
| Austrian | 8 | 0.1% |
| Belgian | 5 | 0.1% |
| Bhutanese | 5 | 0.1% |
| Blackfeet | 2 | 0.0% |
| British | 56 | 0.6% |
| Burmese | 4 | 0.0% |
| Canadian | 20 | 0.2% |
| Central American | 16 | 0.2% |
| Cherokee | 60 | 0.6% |
| Chippewa | 12 | 0.1% |
| Choctaw | 2 | 0.0% |
| Croatian | 45 | 0.5% |
| Cuban | 2 | 0.0% |
| Czech | 33 | 0.4% |
| Danish | 22 | 0.2% |
| Dutch | 143 | 1.5% |
| English | 992 | 10.6% |
| European | 211 | 2.3% |
| Finnish | 11 | 0.1% |
| French | 140 | 1.5% |
| French Canadian | 6 | 0.1% |
| German | 2,236 | 24.0% |
| Greek | 14 | 0.2% |
| Hungarian | 13 | 0.1% |
| Irish | 862 | 9.2% |
| Israeli | 16 | 0.2% |
| Italian | 103 | 1.1% |
| Korean | 10 | 0.1% |
| Mexican | 181 | 1.9% |
| Norwegian | 76 | 0.8% |
| Osage | 3 | 0.0% |
| Panamanian | 16 | 0.2% |
| Pennsylvania German | 3 | 0.0% |
| Polish | 39 | 0.4% |
| Puerto Rican | 6 | 0.1% |
| Romanian | 23 | 0.3% |
| Russian | 2 | 0.0% |
| Scandinavian | 5 | 0.1% |
| Scotch-Irish | 118 | 1.3% |
| Scottish | 201 | 2.1% |
| Shoshone | 16 | 0.2% |
| Sioux | 7 | 0.1% |
| Slavic | 15 | 0.2% |
| South African | 3 | 0.0% |
| South American | 10 | 0.1% |
| Spaniard | 1 | 0.0% |
| Sri Lankan | 11 | 0.1% |
| Subsaharan African | 3 | 0.0% |
| Swedish | 122 | 1.3% |
| Swiss | 28 | 0.3% |
| Syrian | 41 | 0.4% |
| Turkish | 16 | 0.2% |
| Venezuelan | 10 | 0.1% |
| Welsh | 43 | 0.5% | View All 57 Rows |
Immigrants in St. Clair County
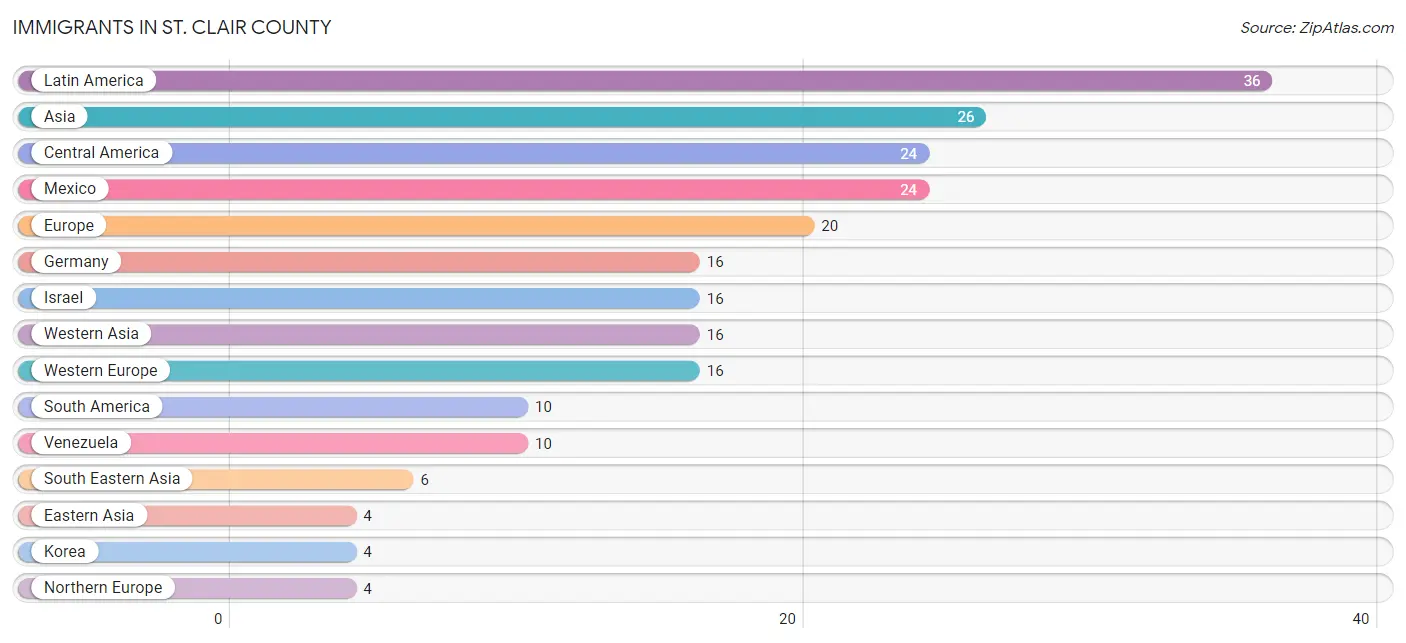
The most numerous immigrant groups reported in St. Clair County came from Latin America (36 | 0.4%), Asia (26 | 0.3%), Central America (24 | 0.3%), Mexico (24 | 0.3%), and Europe (20 | 0.2%), together accounting for 1.4% of all St. Clair County residents.
| Immigration Origin | # Population | % Population |
| Africa | 1 | 0.0% |
| Asia | 26 | 0.3% |
| Canada | 3 | 0.0% |
| Caribbean | 2 | 0.0% |
| Central America | 24 | 0.3% |
| Cuba | 2 | 0.0% |
| Eastern Asia | 4 | 0.0% |
| Europe | 20 | 0.2% |
| Germany | 16 | 0.2% |
| Ireland | 2 | 0.0% |
| Israel | 16 | 0.2% |
| Korea | 4 | 0.0% |
| Latin America | 36 | 0.4% |
| Mexico | 24 | 0.3% |
| Northern Europe | 4 | 0.0% |
| Philippines | 2 | 0.0% |
| Scotland | 1 | 0.0% |
| South Africa | 1 | 0.0% |
| South America | 10 | 0.1% |
| South Eastern Asia | 6 | 0.1% |
| Sweden | 1 | 0.0% |
| Venezuela | 10 | 0.1% |
| Vietnam | 4 | 0.0% |
| Western Asia | 16 | 0.2% |
| Western Europe | 16 | 0.2% | View All 25 Rows |
Sex and Age in St. Clair County
Sex and Age in St. Clair County
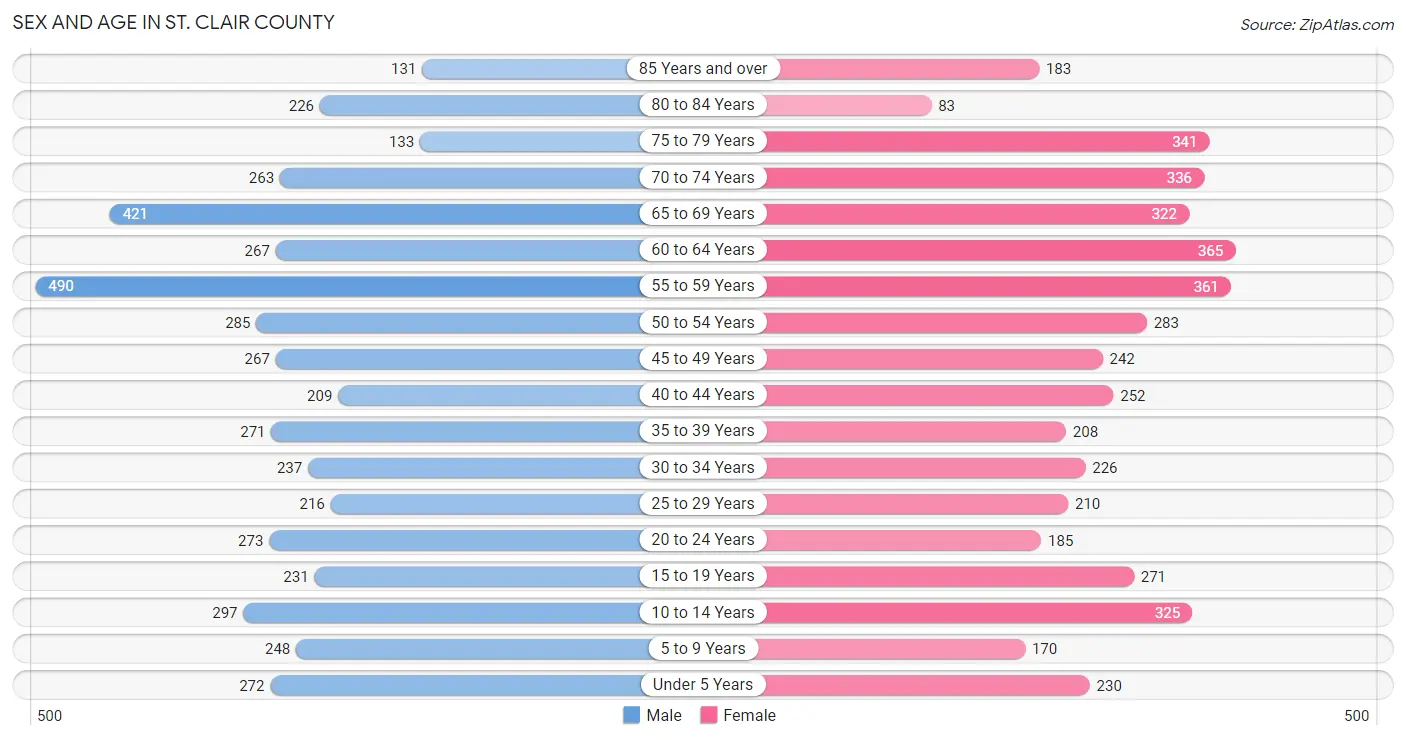
The most populous age groups in St. Clair County are 55 to 59 Years (490 | 10.3%) for men and 60 to 64 Years (365 | 8.0%) for women.
| Age Bracket | Male | Female |
| Under 5 Years | 272 (5.7%) | 230 (5.0%) |
| 5 to 9 Years | 248 (5.2%) | 170 (3.7%) |
| 10 to 14 Years | 297 (6.3%) | 325 (7.1%) |
| 15 to 19 Years | 231 (4.9%) | 271 (5.9%) |
| 20 to 24 Years | 273 (5.8%) | 185 (4.0%) |
| 25 to 29 Years | 216 (4.6%) | 210 (4.6%) |
| 30 to 34 Years | 237 (5.0%) | 226 (4.9%) |
| 35 to 39 Years | 271 (5.7%) | 208 (4.5%) |
| 40 to 44 Years | 209 (4.4%) | 252 (5.5%) |
| 45 to 49 Years | 267 (5.6%) | 242 (5.3%) |
| 50 to 54 Years | 285 (6.0%) | 283 (6.2%) |
| 55 to 59 Years | 490 (10.3%) | 361 (7.9%) |
| 60 to 64 Years | 267 (5.6%) | 365 (8.0%) |
| 65 to 69 Years | 421 (8.9%) | 322 (7.0%) |
| 70 to 74 Years | 263 (5.6%) | 336 (7.3%) |
| 75 to 79 Years | 133 (2.8%) | 341 (7.4%) |
| 80 to 84 Years | 226 (4.8%) | 83 (1.8%) |
| 85 Years and over | 131 (2.8%) | 183 (4.0%) |
| Total | 4,737 (100.0%) | 4,593 (100.0%) |
Families and Households in St. Clair County
Median Family Size in St. Clair County
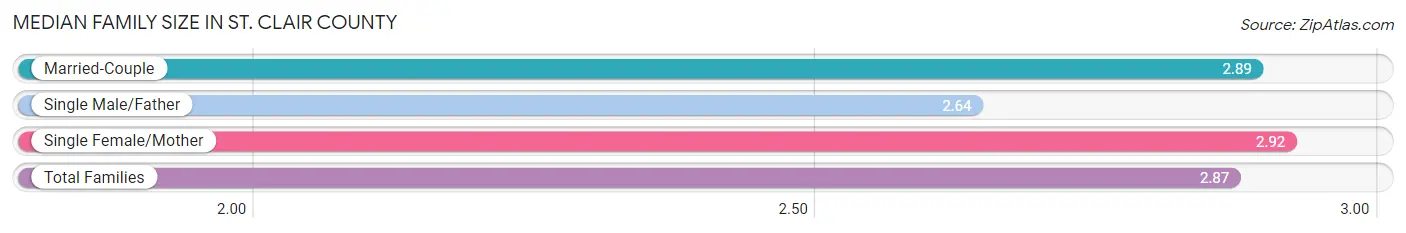
The median family size in St. Clair County is 2.87 persons per family, with single female/mother families (347 | 14.1%) accounting for the largest median family size of 2.92 persons per family. On the other hand, single male/father families (195 | 8.0%) represent the smallest median family size with 2.64 persons per family.
| Family Type | # Families | Family Size |
| Married-Couple | 1,910 (77.9%) | 2.89 |
| Single Male/Father | 195 (8.0%) | 2.64 |
| Single Female/Mother | 347 (14.1%) | 2.92 |
| Total Families | 2,452 (100.0%) | 2.87 |
Median Household Size in St. Clair County
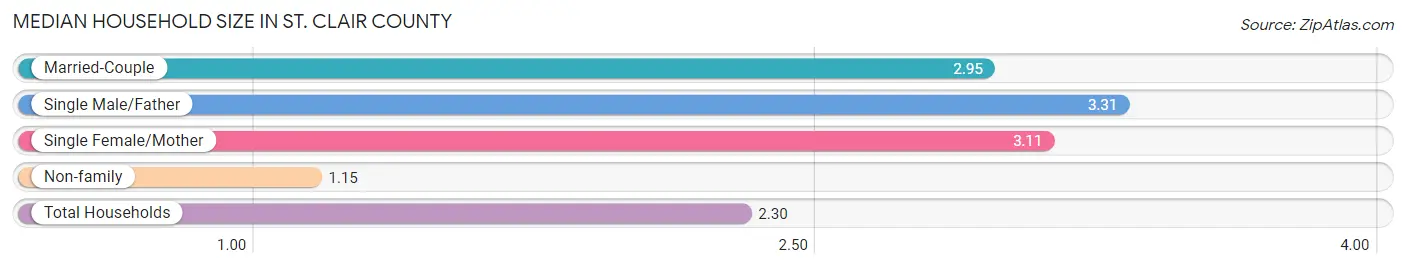
The median household size in St. Clair County is 2.30 persons per household, with single male/father households (195 | 4.9%) accounting for the largest median household size of 3.31 persons per household. non-family households (1,503 | 38.0%) represent the smallest median household size with 1.15 persons per household.
| Household Type | # Households | Household Size |
| Married-Couple | 1,910 (48.3%) | 2.95 |
| Single Male/Father | 195 (4.9%) | 3.31 |
| Single Female/Mother | 347 (8.8%) | 3.11 |
| Non-family | 1,503 (38.0%) | 1.15 |
| Total Households | 3,955 (100.0%) | 2.30 |
Household Size by Marriage Status in St. Clair County
Out of a total of 3,955 households in St. Clair County, 2,452 (62.0%) are family households, while 1,503 (38.0%) are nonfamily households. The most numerous type of family households are 2-person households, comprising 1,235, and the most common type of nonfamily households are 1-person households, comprising 1,309.
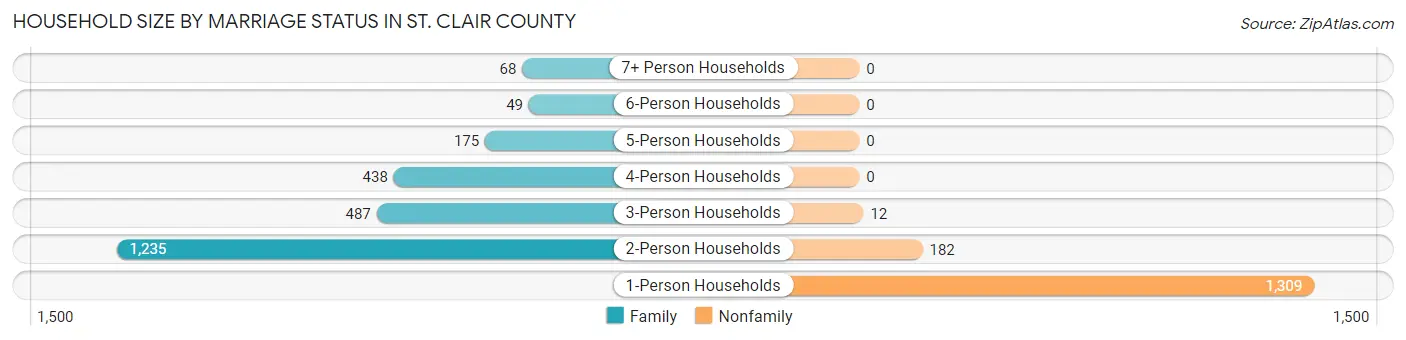
| Household Size | Family Households | Nonfamily Households |
| 1-Person Households | - | 1,309 (33.1%) |
| 2-Person Households | 1,235 (31.2%) | 182 (4.6%) |
| 3-Person Households | 487 (12.3%) | 12 (0.3%) |
| 4-Person Households | 438 (11.1%) | 0 (0.0%) |
| 5-Person Households | 175 (4.4%) | 0 (0.0%) |
| 6-Person Households | 49 (1.2%) | 0 (0.0%) |
| 7+ Person Households | 68 (1.7%) | 0 (0.0%) |
| Total | 2,452 (62.0%) | 1,503 (38.0%) |
Female Fertility in St. Clair County
Fertility by Age in St. Clair County
Average fertility rate in St. Clair County is 41.0 births per 1,000 women. Women in the age bracket of 20 to 34 years have the highest fertility rate with 87.0 births per 1,000 women. Women in the age bracket of 20 to 34 years acount for 81.8% of all women with births.
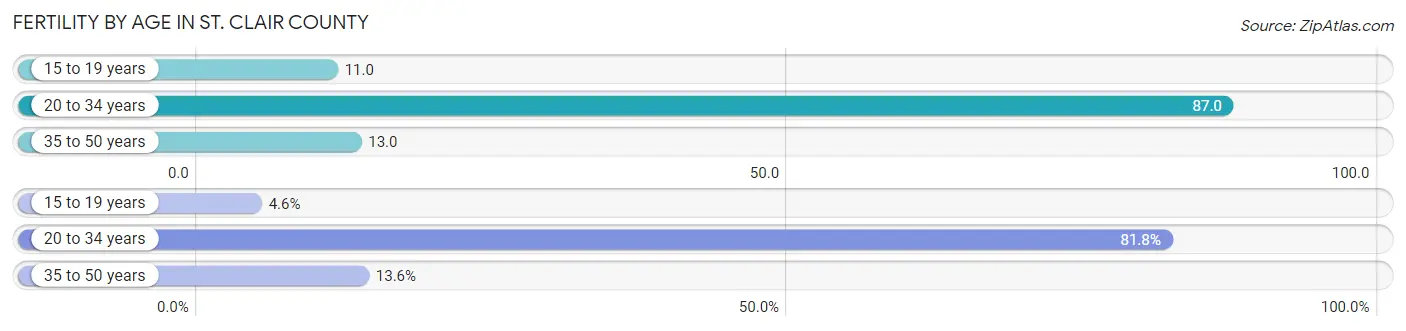
| Age Bracket | Women with Births | Births / 1,000 Women |
| 15 to 19 years | 3 (4.5%) | 11.0 |
| 20 to 34 years | 54 (81.8%) | 87.0 |
| 35 to 50 years | 9 (13.6%) | 13.0 |
| Total | 66 (100.0%) | 41.0 |
Fertility by Age by Marriage Status in St. Clair County
78.8% of women with births (66) in St. Clair County are married. The highest percentage of unmarried women with births falls into 15 to 19 years age bracket with 100.0% of them unmarried at the time of birth, while the lowest percentage of unmarried women with births belong to 35 to 50 years age bracket with 0.0% of them unmarried.
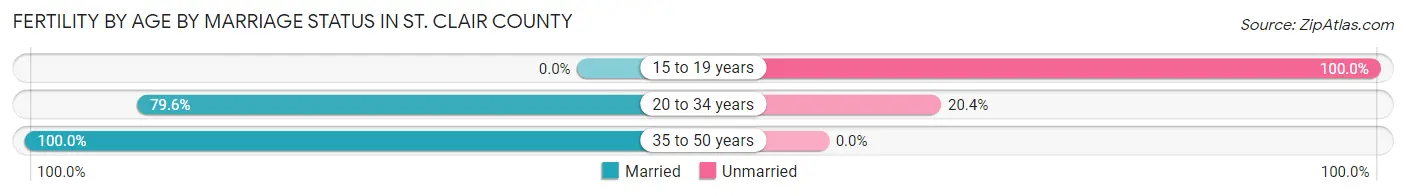
| Age Bracket | Married | Unmarried |
| 15 to 19 years | 0 (0.0%) | 3 (100.0%) |
| 20 to 34 years | 43 (79.6%) | 11 (20.4%) |
| 35 to 50 years | 9 (100.0%) | 0 (0.0%) |
| Total | 52 (78.8%) | 14 (21.2%) |
Fertility by Education in St. Clair County
Average fertility rate in St. Clair County is 41.0 births per 1,000 women. Women with the education attainment of graduate degree have the highest fertility rate of 120.0 births per 1,000 women, while women with the education attainment of bachelor's degree have the lowest fertility at 7.0 births per 1,000 women. Women with the education attainment of college or associate's degree represent 48.5% of all women with births.
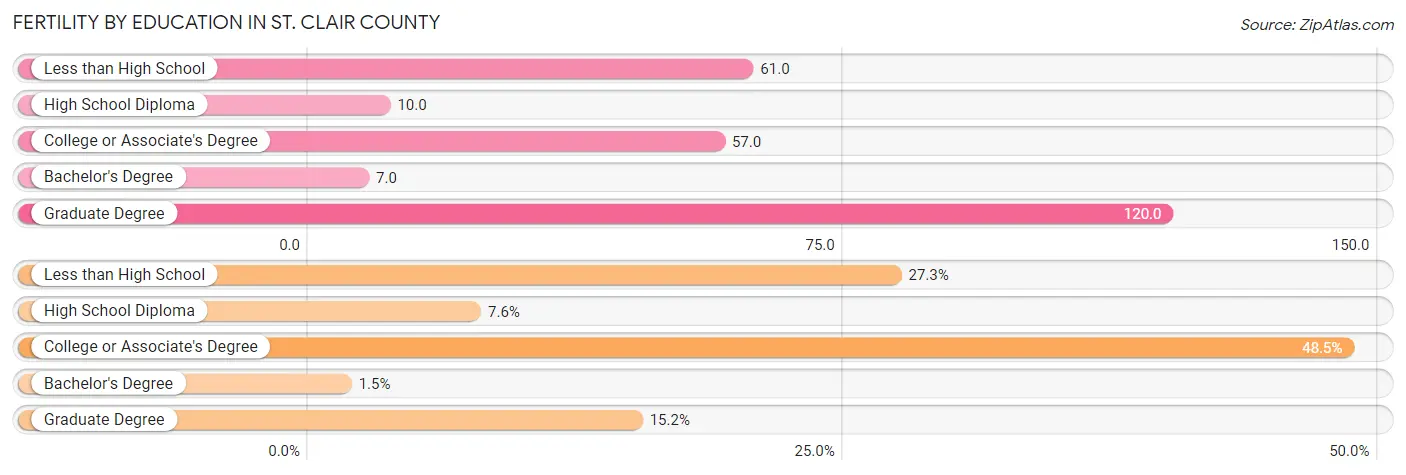
| Educational Attainment | Women with Births | Births / 1,000 Women |
| Less than High School | 18 (27.3%) | 61.0 |
| High School Diploma | 5 (7.6%) | 10.0 |
| College or Associate's Degree | 32 (48.5%) | 57.0 |
| Bachelor's Degree | 1 (1.5%) | 7.0 |
| Graduate Degree | 10 (15.1%) | 120.0 |
| Total | 66 (100.0%) | 41.0 |
Fertility by Education by Marriage Status in St. Clair County
21.2% of women with births in St. Clair County are unmarried. Women with the educational attainment of bachelor's degree are most likely to be married with 100.0% of them married at childbirth, while women with the educational attainment of college or associate's degree are least likely to be married with 31.2% of them unmarried at childbirth.
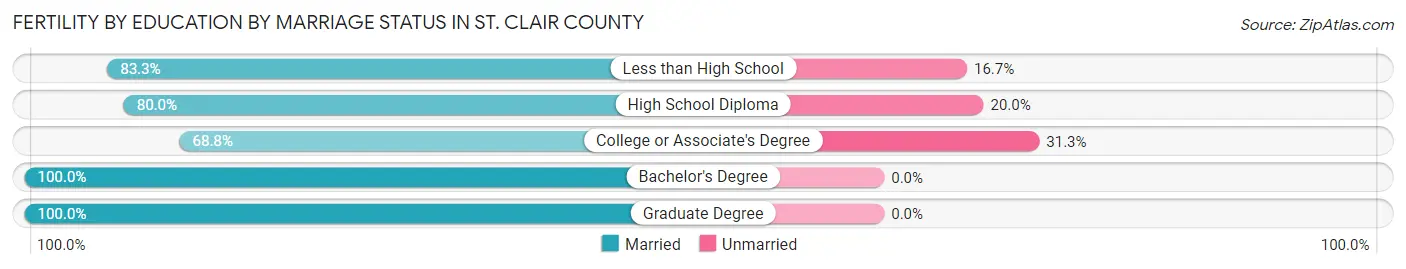
| Educational Attainment | Married | Unmarried |
| Less than High School | 15 (83.3%) | 3 (16.7%) |
| High School Diploma | 4 (80.0%) | 1 (20.0%) |
| College or Associate's Degree | 22 (68.8%) | 10 (31.2%) |
| Bachelor's Degree | 1 (100.0%) | 0 (0.0%) |
| Graduate Degree | 10 (100.0%) | 0 (0.0%) |
| Total | 52 (78.8%) | 14 (21.2%) |
Employment Characteristics in St. Clair County
Employment by Class of Employer in St. Clair County
Among the 3,728 employed individuals in St. Clair County, private company employees (2,322 | 62.3%), self-employed (not incorporated) (402 | 10.8%), and local government employees (390 | 10.5%) make up the most common classes of employment.
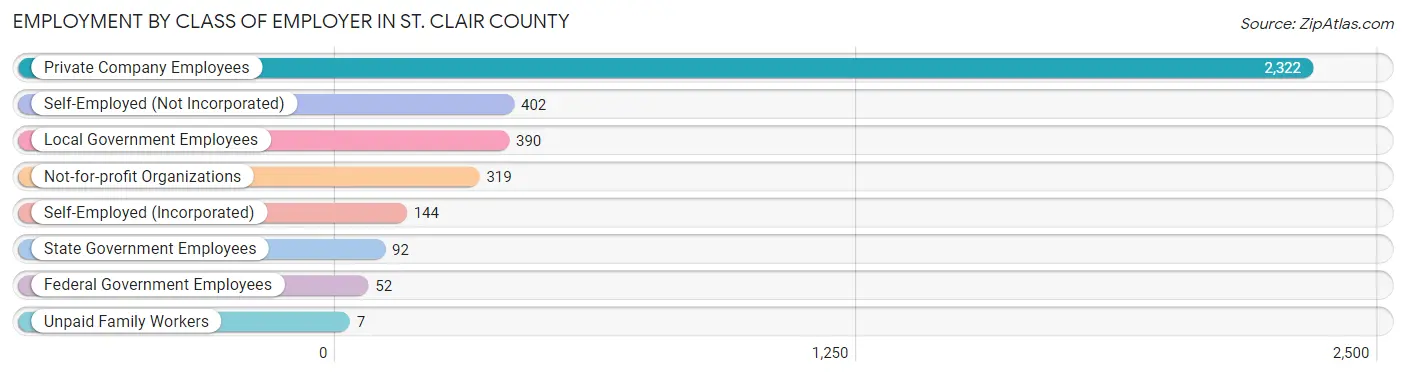
| Employer Class | # Employees | % Employees |
| Private Company Employees | 2,322 | 62.3% |
| Self-Employed (Incorporated) | 144 | 3.9% |
| Self-Employed (Not Incorporated) | 402 | 10.8% |
| Not-for-profit Organizations | 319 | 8.6% |
| Local Government Employees | 390 | 10.5% |
| State Government Employees | 92 | 2.5% |
| Federal Government Employees | 52 | 1.4% |
| Unpaid Family Workers | 7 | 0.2% |
| Total | 3,728 | 100.0% |
Employment Status by Age in St. Clair County
According to the labor force statistics for St. Clair County, out of the total population over 16 years of age (7,713), 50.4% or 3,887 individuals are in the labor force, with 2.5% or 97 of them unemployed. The age group with the highest labor force participation rate is 25 to 29 years, with 87.1% or 371 individuals in the labor force. Within the labor force, the 16 to 19 years age range has the highest percentage of unemployed individuals, with 16.7% or 28 of them being unemployed.
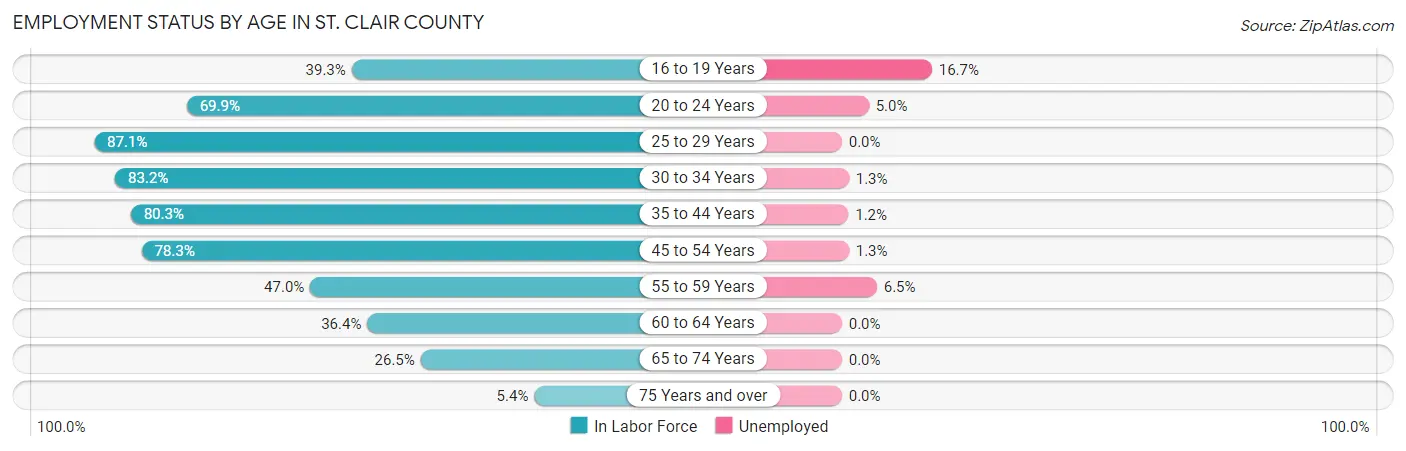
| Age Bracket | In Labor Force | Unemployed |
| 16 to 19 Years | 168 (39.3%) | 28 (16.7%) |
| 20 to 24 Years | 320 (69.9%) | 16 (5.0%) |
| 25 to 29 Years | 371 (87.1%) | 0 (0.0%) |
| 30 to 34 Years | 385 (83.2%) | 5 (1.3%) |
| 35 to 44 Years | 755 (80.3%) | 9 (1.2%) |
| 45 to 54 Years | 843 (78.3%) | 11 (1.3%) |
| 55 to 59 Years | 400 (47.0%) | 26 (6.5%) |
| 60 to 64 Years | 230 (36.4%) | 0 (0.0%) |
| 65 to 74 Years | 356 (26.5%) | 0 (0.0%) |
| 75 Years and over | 59 (5.4%) | 0 (0.0%) |
| Total | 3,887 (50.4%) | 97 (2.5%) |
Employment Status by Educational Attainment in St. Clair County
According to labor force statistics for St. Clair County, 68.0% of individuals (2,985) out of the total population between 25 and 64 years of age (4,389) are in the labor force, with 1.7% or 51 of them being unemployed. The group with the highest labor force participation rate are those with the educational attainment of bachelor's degree or higher, with 84.3% or 456 individuals in the labor force. Within the labor force, individuals with college / associate degree education have the highest percentage of unemployment, with 3.7% or 41 of them being unemployed.
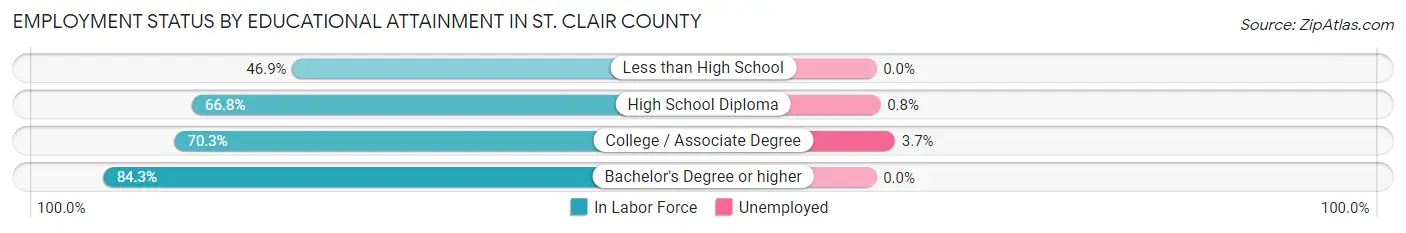
| Educational Attainment | In Labor Force | Unemployed |
| Less than High School | 231 (46.9%) | 0 (0.0%) |
| High School Diploma | 1,178 (66.8%) | 14 (0.8%) |
| College / Associate Degree | 1,118 (70.3%) | 59 (3.7%) |
| Bachelor's Degree or higher | 456 (84.3%) | 0 (0.0%) |
| Total | 2,985 (68.0%) | 75 (1.7%) |
Employment Occupations by Sex in St. Clair County
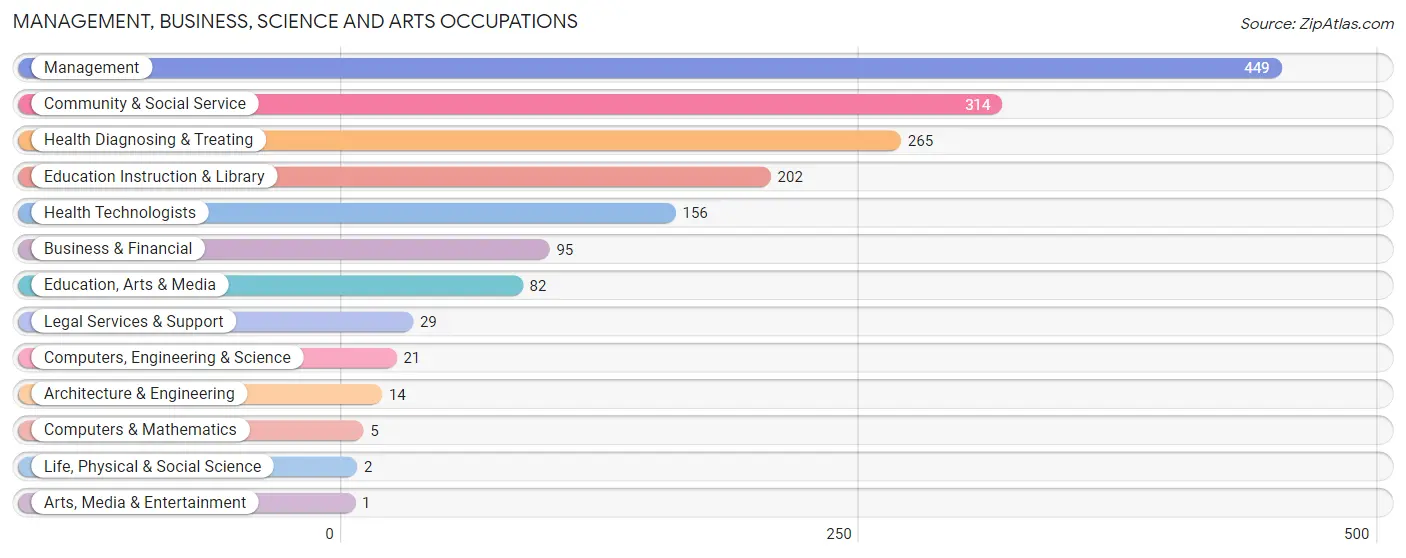
Management, Business, Science and Arts Occupations
The most common Management, Business, Science and Arts occupations in St. Clair County are Management (449 | 11.9%), Community & Social Service (314 | 8.3%), Health Diagnosing & Treating (265 | 7.0%), Education Instruction & Library (202 | 5.3%), and Health Technologists (156 | 4.1%).
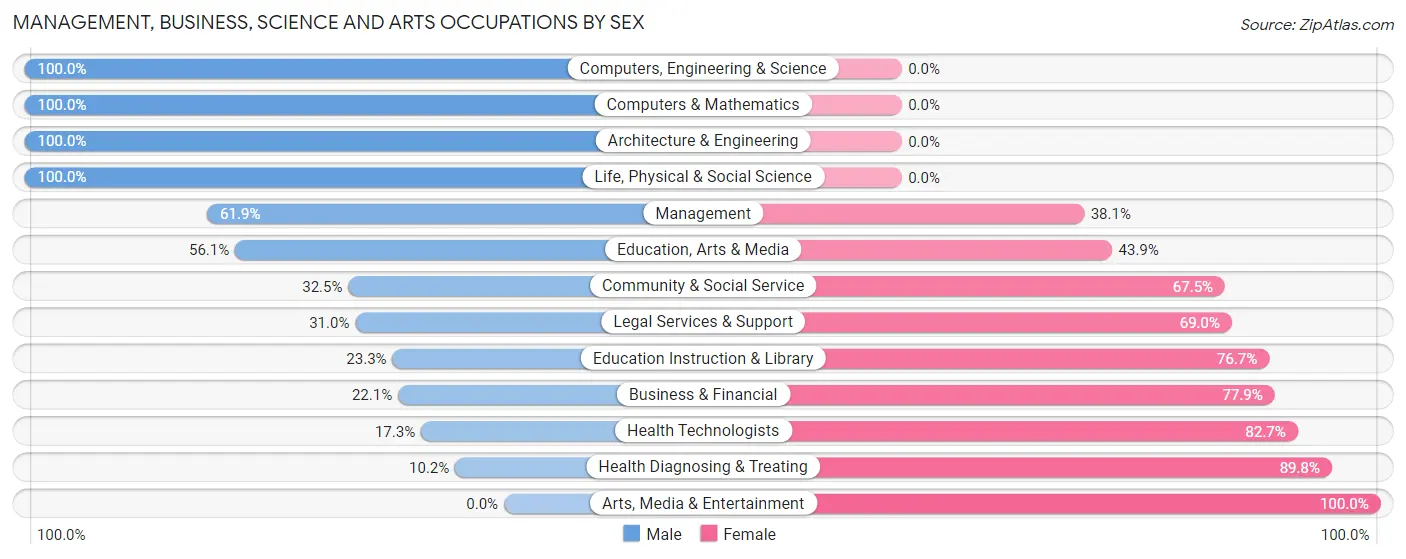
Management, Business, Science and Arts Occupations by Sex
Within the Management, Business, Science and Arts occupations in St. Clair County, the most male-oriented occupations are Computers, Engineering & Science (100.0%), Computers & Mathematics (100.0%), and Architecture & Engineering (100.0%), while the most female-oriented occupations are Arts, Media & Entertainment (100.0%), Health Diagnosing & Treating (89.8%), and Health Technologists (82.7%).
| Occupation | Male | Female |
| Management | 278 (61.9%) | 171 (38.1%) |
| Business & Financial | 21 (22.1%) | 74 (77.9%) |
| Computers, Engineering & Science | 21 (100.0%) | 0 (0.0%) |
| Computers & Mathematics | 5 (100.0%) | 0 (0.0%) |
| Architecture & Engineering | 14 (100.0%) | 0 (0.0%) |
| Life, Physical & Social Science | 2 (100.0%) | 0 (0.0%) |
| Community & Social Service | 102 (32.5%) | 212 (67.5%) |
| Education, Arts & Media | 46 (56.1%) | 36 (43.9%) |
| Legal Services & Support | 9 (31.0%) | 20 (69.0%) |
| Education Instruction & Library | 47 (23.3%) | 155 (76.7%) |
| Arts, Media & Entertainment | 0 (0.0%) | 1 (100.0%) |
| Health Diagnosing & Treating | 27 (10.2%) | 238 (89.8%) |
| Health Technologists | 27 (17.3%) | 129 (82.7%) |
| Total (Category) | 449 (39.3%) | 695 (60.8%) |
| Total (Overall) | 1,909 (50.6%) | 1,867 (49.4%) |
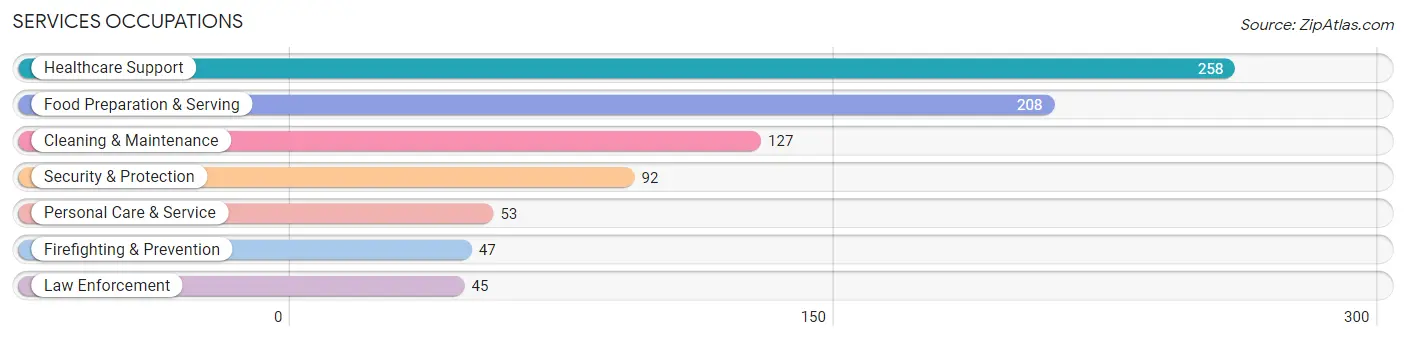
Services Occupations
The most common Services occupations in St. Clair County are Healthcare Support (258 | 6.8%), Food Preparation & Serving (208 | 5.5%), Cleaning & Maintenance (127 | 3.4%), Security & Protection (92 | 2.4%), and Personal Care & Service (53 | 1.4%).
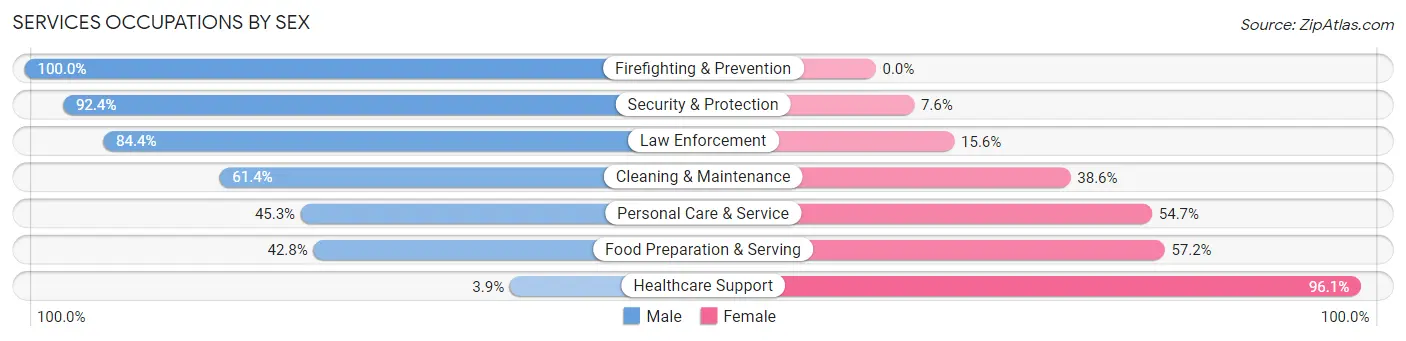
Services Occupations by Sex
Within the Services occupations in St. Clair County, the most male-oriented occupations are Firefighting & Prevention (100.0%), Security & Protection (92.4%), and Law Enforcement (84.4%), while the most female-oriented occupations are Healthcare Support (96.1%), Food Preparation & Serving (57.2%), and Personal Care & Service (54.7%).
| Occupation | Male | Female |
| Healthcare Support | 10 (3.9%) | 248 (96.1%) |
| Security & Protection | 85 (92.4%) | 7 (7.6%) |
| Firefighting & Prevention | 47 (100.0%) | 0 (0.0%) |
| Law Enforcement | 38 (84.4%) | 7 (15.6%) |
| Food Preparation & Serving | 89 (42.8%) | 119 (57.2%) |
| Cleaning & Maintenance | 78 (61.4%) | 49 (38.6%) |
| Personal Care & Service | 24 (45.3%) | 29 (54.7%) |
| Total (Category) | 286 (38.8%) | 452 (61.3%) |
| Total (Overall) | 1,909 (50.6%) | 1,867 (49.4%) |
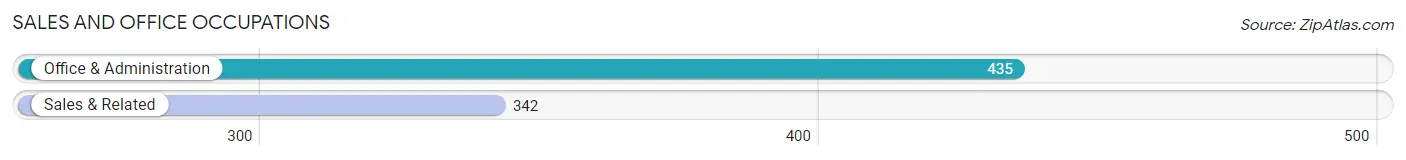
Sales and Office Occupations
The most common Sales and Office occupations in St. Clair County are Office & Administration (435 | 11.5%), and Sales & Related (342 | 9.1%).
Sales and Office Occupations by Sex
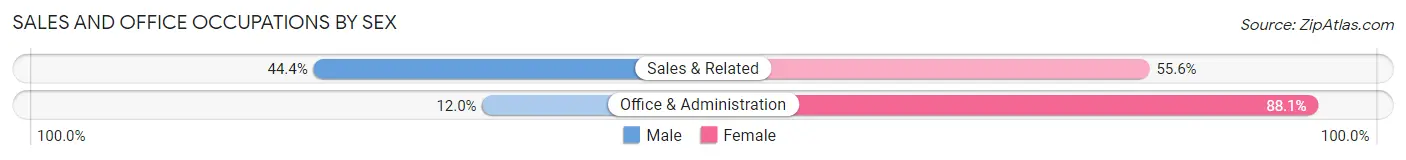
| Occupation | Male | Female |
| Sales & Related | 152 (44.4%) | 190 (55.6%) |
| Office & Administration | 52 (11.9%) | 383 (88.0%) |
| Total (Category) | 204 (26.3%) | 573 (73.8%) |
| Total (Overall) | 1,909 (50.6%) | 1,867 (49.4%) |
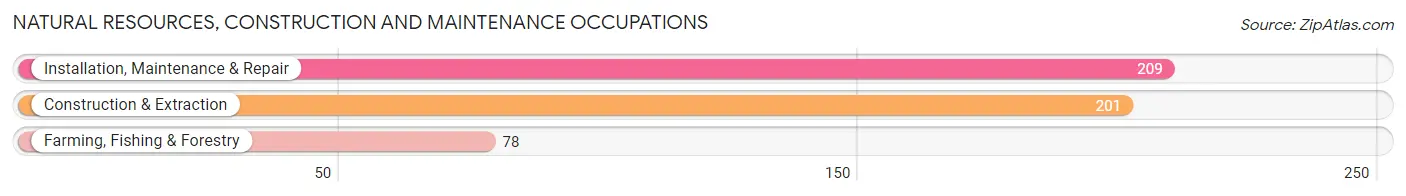
Natural Resources, Construction and Maintenance Occupations
The most common Natural Resources, Construction and Maintenance occupations in St. Clair County are Installation, Maintenance & Repair (209 | 5.5%), Construction & Extraction (201 | 5.3%), and Farming, Fishing & Forestry (78 | 2.1%).
Natural Resources, Construction and Maintenance Occupations by Sex
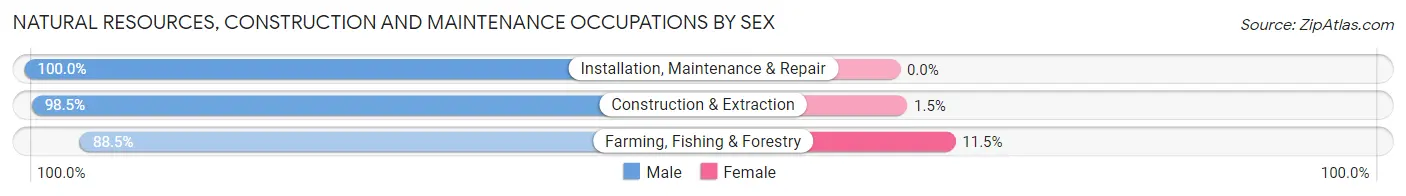
| Occupation | Male | Female |
| Farming, Fishing & Forestry | 69 (88.5%) | 9 (11.5%) |
| Construction & Extraction | 198 (98.5%) | 3 (1.5%) |
| Installation, Maintenance & Repair | 209 (100.0%) | 0 (0.0%) |
| Total (Category) | 476 (97.5%) | 12 (2.5%) |
| Total (Overall) | 1,909 (50.6%) | 1,867 (49.4%) |
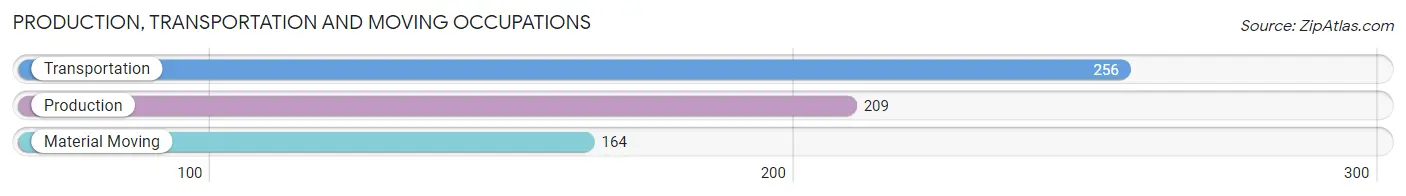
Production, Transportation and Moving Occupations
The most common Production, Transportation and Moving occupations in St. Clair County are Transportation (256 | 6.8%), Production (209 | 5.5%), and Material Moving (164 | 4.3%).
Production, Transportation and Moving Occupations by Sex
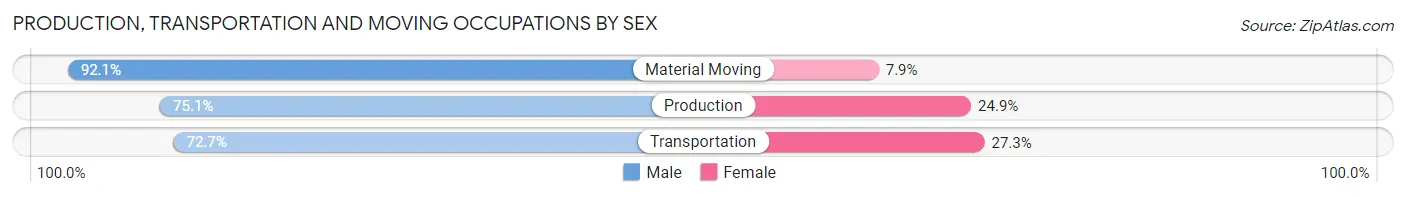
| Occupation | Male | Female |
| Production | 157 (75.1%) | 52 (24.9%) |
| Transportation | 186 (72.7%) | 70 (27.3%) |
| Material Moving | 151 (92.1%) | 13 (7.9%) |
| Total (Category) | 494 (78.5%) | 135 (21.5%) |
| Total (Overall) | 1,909 (50.6%) | 1,867 (49.4%) |
Employment Industries by Sex in St. Clair County
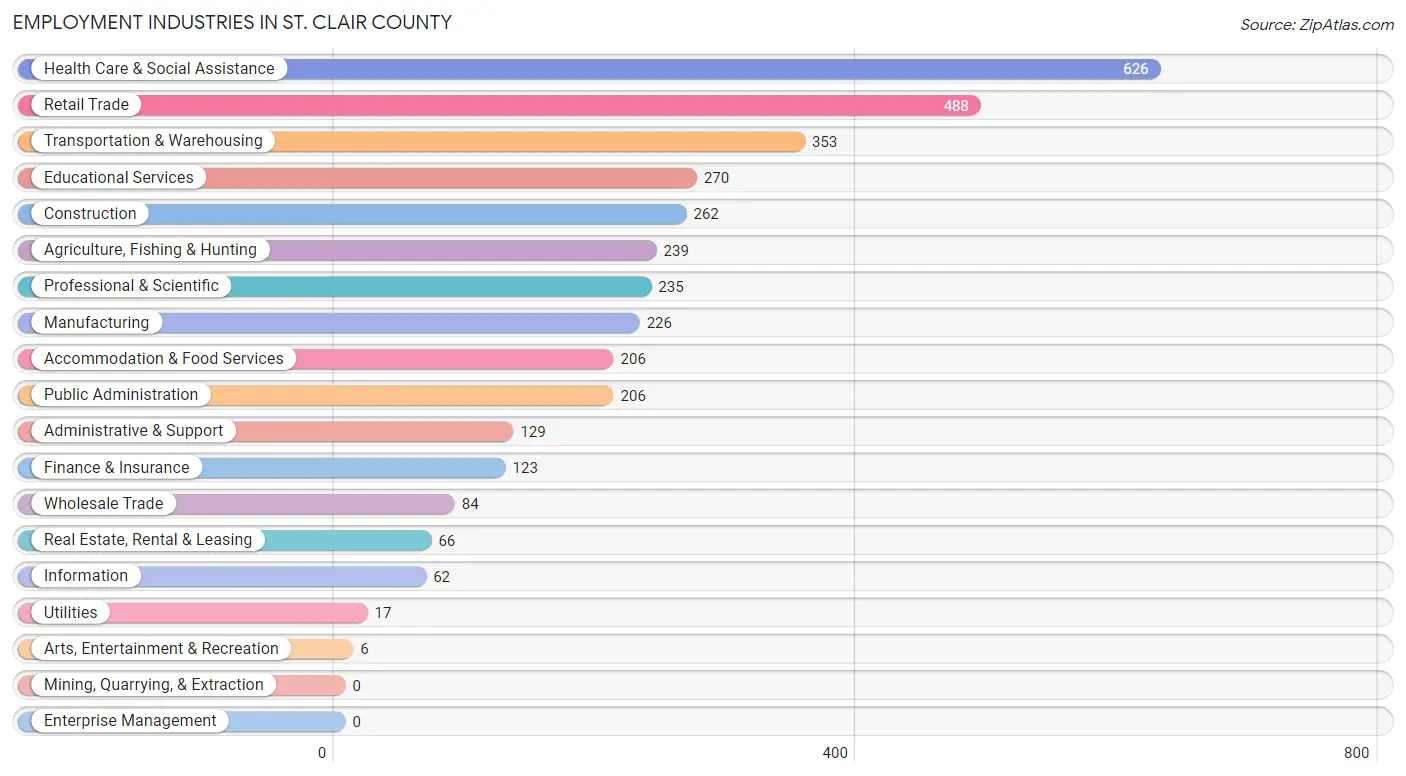
Employment Industries in St. Clair County
The major employment industries in St. Clair County include Health Care & Social Assistance (626 | 16.6%), Retail Trade (488 | 12.9%), Transportation & Warehousing (353 | 9.3%), Educational Services (270 | 7.1%), and Construction (262 | 6.9%).
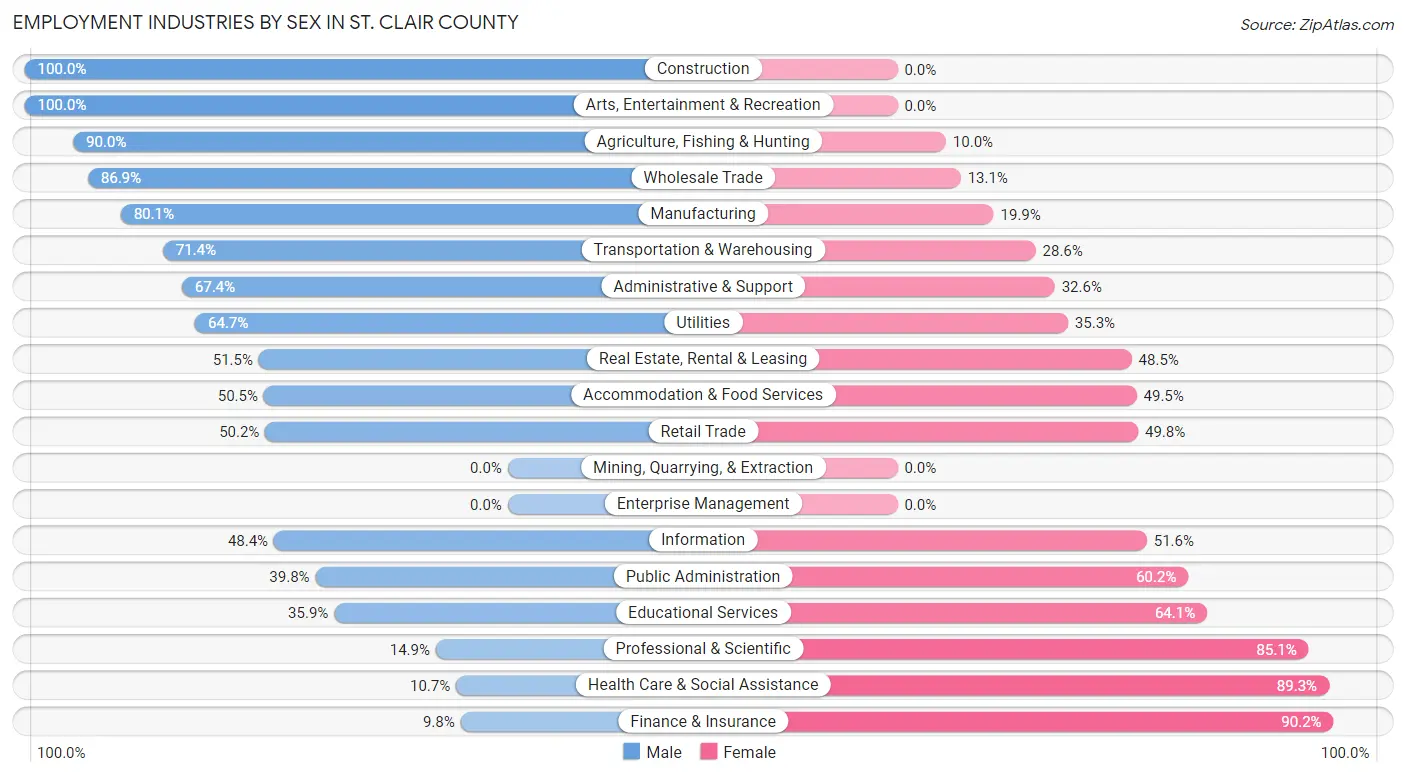
Employment Industries by Sex in St. Clair County
The St. Clair County industries that see more men than women are Construction (100.0%), Arts, Entertainment & Recreation (100.0%), and Agriculture, Fishing & Hunting (90.0%), whereas the industries that tend to have a higher number of women are Finance & Insurance (90.2%), Health Care & Social Assistance (89.3%), and Professional & Scientific (85.1%).
| Industry | Male | Female |
| Agriculture, Fishing & Hunting | 215 (90.0%) | 24 (10.0%) |
| Mining, Quarrying, & Extraction | 0 (0.0%) | 0 (0.0%) |
| Construction | 262 (100.0%) | 0 (0.0%) |
| Manufacturing | 181 (80.1%) | 45 (19.9%) |
| Wholesale Trade | 73 (86.9%) | 11 (13.1%) |
| Retail Trade | 245 (50.2%) | 243 (49.8%) |
| Transportation & Warehousing | 252 (71.4%) | 101 (28.6%) |
| Utilities | 11 (64.7%) | 6 (35.3%) |
| Information | 30 (48.4%) | 32 (51.6%) |
| Finance & Insurance | 12 (9.8%) | 111 (90.2%) |
| Real Estate, Rental & Leasing | 34 (51.5%) | 32 (48.5%) |
| Professional & Scientific | 35 (14.9%) | 200 (85.1%) |
| Enterprise Management | 0 (0.0%) | 0 (0.0%) |
| Administrative & Support | 87 (67.4%) | 42 (32.6%) |
| Educational Services | 97 (35.9%) | 173 (64.1%) |
| Health Care & Social Assistance | 67 (10.7%) | 559 (89.3%) |
| Arts, Entertainment & Recreation | 6 (100.0%) | 0 (0.0%) |
| Accommodation & Food Services | 104 (50.5%) | 102 (49.5%) |
| Public Administration | 82 (39.8%) | 124 (60.2%) |
| Total | 1,909 (50.6%) | 1,867 (49.4%) |
Education in St. Clair County
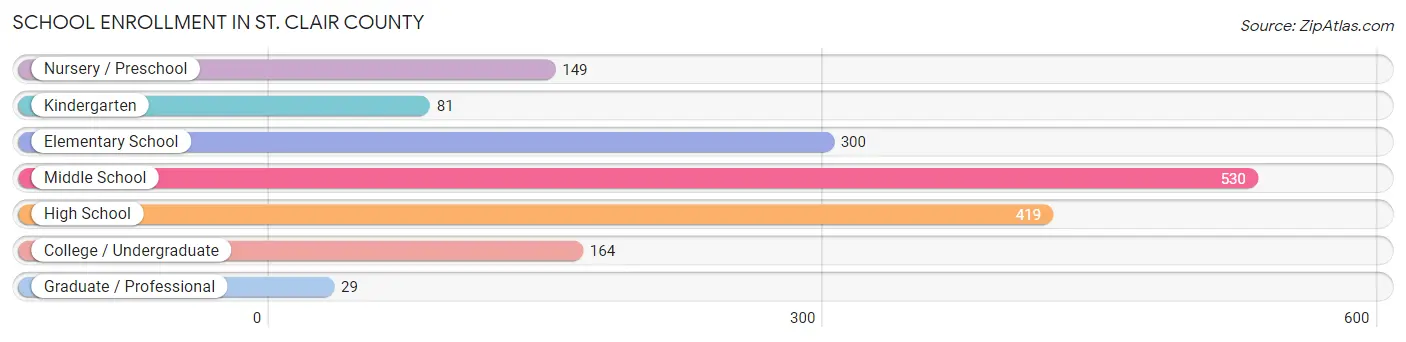
School Enrollment in St. Clair County
The most common levels of schooling among the 1,672 students in St. Clair County are middle school (530 | 31.7%), high school (419 | 25.1%), and elementary school (300 | 17.9%).
| School Level | # Students | % Students |
| Nursery / Preschool | 149 | 8.9% |
| Kindergarten | 81 | 4.8% |
| Elementary School | 300 | 17.9% |
| Middle School | 530 | 31.7% |
| High School | 419 | 25.1% |
| College / Undergraduate | 164 | 9.8% |
| Graduate / Professional | 29 | 1.7% |
| Total | 1,672 | 100.0% |
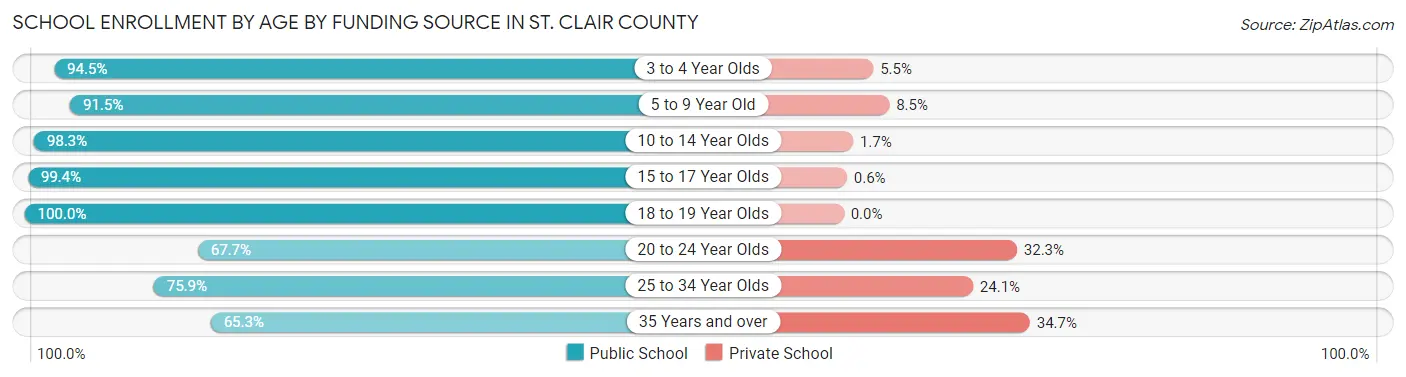
School Enrollment by Age by Funding Source in St. Clair County
Out of a total of 1,672 students who are enrolled in schools in St. Clair County, 110 (6.6%) attend a private institution, while the remaining 1,562 (93.4%) are enrolled in public schools. The age group of 35 years and over has the highest likelihood of being enrolled in private schools, with 26 (34.7% in the age bracket) enrolled. Conversely, the age group of 18 to 19 year olds has the lowest likelihood of being enrolled in a private school, with 73 (100.0% in the age bracket) attending a public institution.
| Age Bracket | Public School | Private School |
| 3 to 4 Year Olds | 103 (94.5%) | 6 (5.5%) |
| 5 to 9 Year Old | 356 (91.5%) | 33 (8.5%) |
| 10 to 14 Year Olds | 569 (98.3%) | 10 (1.7%) |
| 15 to 17 Year Olds | 329 (99.4%) | 2 (0.6%) |
| 18 to 19 Year Olds | 73 (100.0%) | 0 (0.0%) |
| 20 to 24 Year Olds | 42 (67.7%) | 20 (32.3%) |
| 25 to 34 Year Olds | 41 (75.9%) | 13 (24.1%) |
| 35 Years and over | 49 (65.3%) | 26 (34.7%) |
| Total | 1,562 (93.4%) | 110 (6.6%) |
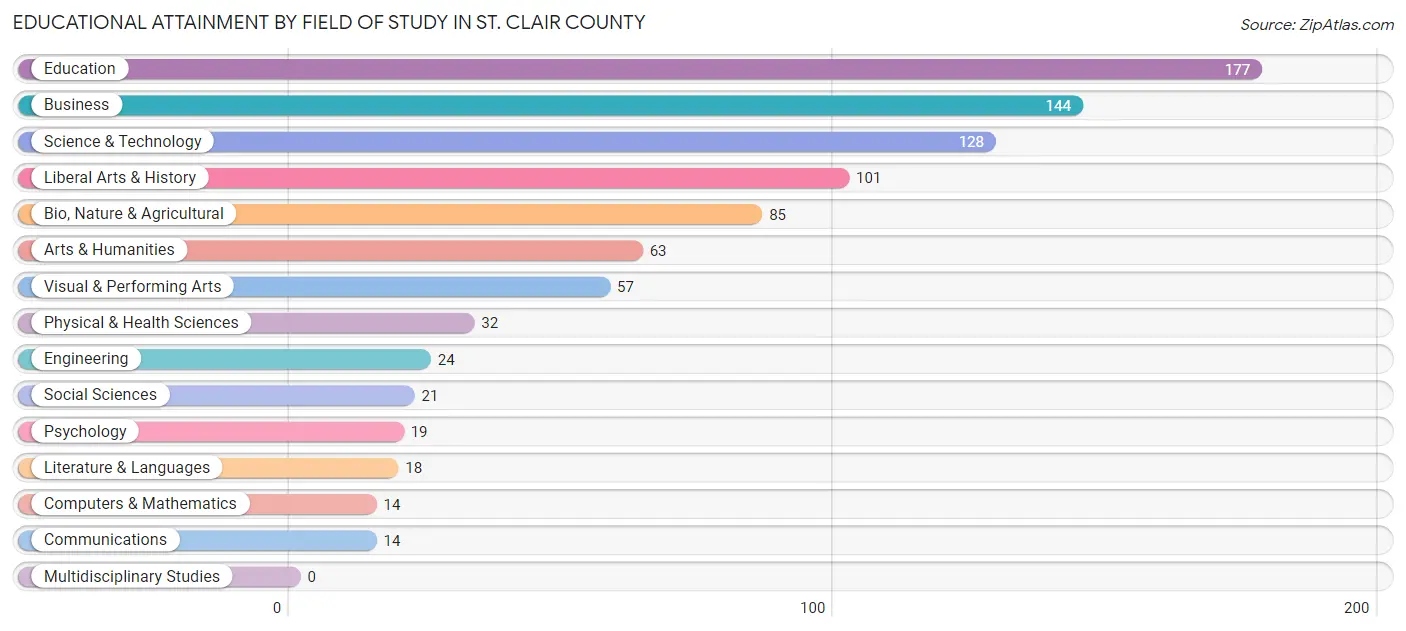
Educational Attainment by Field of Study in St. Clair County
Education (177 | 19.7%), business (144 | 16.1%), science & technology (128 | 14.3%), liberal arts & history (101 | 11.3%), and bio, nature & agricultural (85 | 9.5%) are the most common fields of study among 897 individuals in St. Clair County who have obtained a bachelor's degree or higher.
| Field of Study | # Graduates | % Graduates |
| Computers & Mathematics | 14 | 1.6% |
| Bio, Nature & Agricultural | 85 | 9.5% |
| Physical & Health Sciences | 32 | 3.6% |
| Psychology | 19 | 2.1% |
| Social Sciences | 21 | 2.3% |
| Engineering | 24 | 2.7% |
| Multidisciplinary Studies | 0 | 0.0% |
| Science & Technology | 128 | 14.3% |
| Business | 144 | 16.1% |
| Education | 177 | 19.7% |
| Literature & Languages | 18 | 2.0% |
| Liberal Arts & History | 101 | 11.3% |
| Visual & Performing Arts | 57 | 6.4% |
| Communications | 14 | 1.6% |
| Arts & Humanities | 63 | 7.0% |
| Total | 897 | 100.0% |
Transportation & Commute in St. Clair County
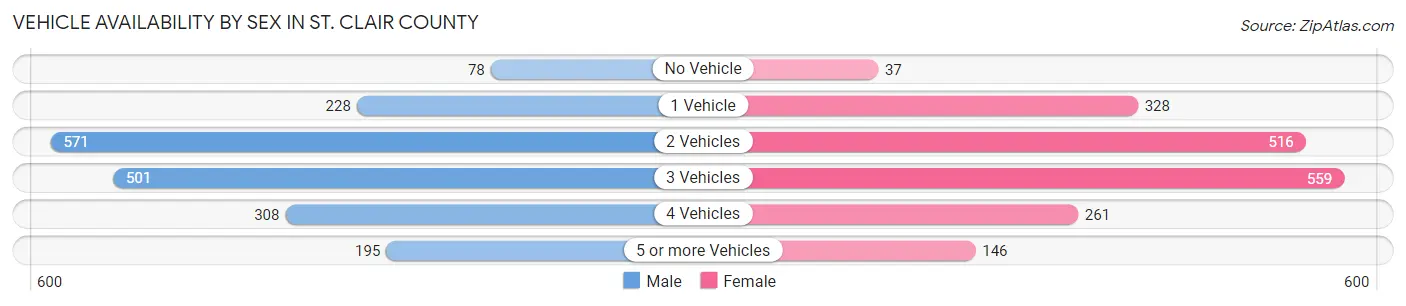
Vehicle Availability by Sex in St. Clair County
The most prevalent vehicle ownership categories in St. Clair County are males with 2 vehicles (571, accounting for 30.4%) and females with 2 vehicles (516, making up 30.9%).
| Vehicles Available | Male | Female |
| No Vehicle | 78 (4.2%) | 37 (2.0%) |
| 1 Vehicle | 228 (12.1%) | 328 (17.8%) |
| 2 Vehicles | 571 (30.4%) | 516 (27.9%) |
| 3 Vehicles | 501 (26.6%) | 559 (30.3%) |
| 4 Vehicles | 308 (16.4%) | 261 (14.1%) |
| 5 or more Vehicles | 195 (10.4%) | 146 (7.9%) |
| Total | 1,881 (100.0%) | 1,847 (100.0%) |
Commute Time in St. Clair County
The most frequently occuring commute durations in St. Clair County are 5 to 9 minutes (598 commuters, 17.2%), 30 to 34 minutes (490 commuters, 14.1%), and 15 to 19 minutes (380 commuters, 11.0%).
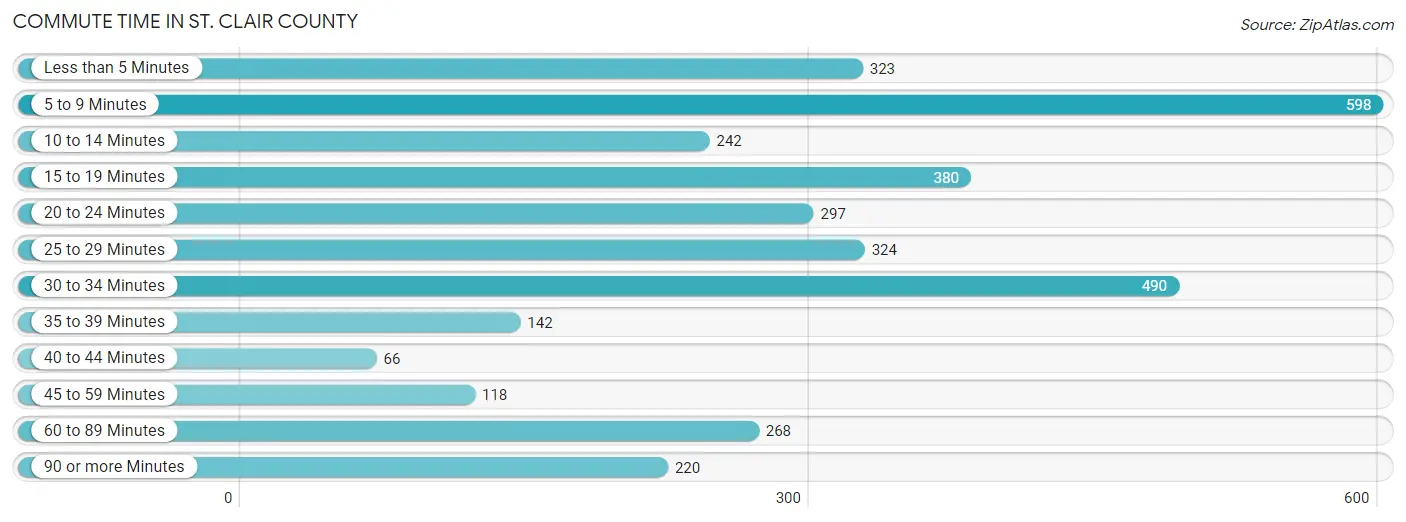
| Commute Time | # Commuters | % Commuters |
| Less than 5 Minutes | 323 | 9.3% |
| 5 to 9 Minutes | 598 | 17.2% |
| 10 to 14 Minutes | 242 | 7.0% |
| 15 to 19 Minutes | 380 | 11.0% |
| 20 to 24 Minutes | 297 | 8.6% |
| 25 to 29 Minutes | 324 | 9.3% |
| 30 to 34 Minutes | 490 | 14.1% |
| 35 to 39 Minutes | 142 | 4.1% |
| 40 to 44 Minutes | 66 | 1.9% |
| 45 to 59 Minutes | 118 | 3.4% |
| 60 to 89 Minutes | 268 | 7.7% |
| 90 or more Minutes | 220 | 6.3% |
Commute Time by Sex in St. Clair County
The most common commute times in St. Clair County are 30 to 34 minutes (308 commuters, 18.0%) for males and 5 to 9 minutes (333 commuters, 18.9%) for females.
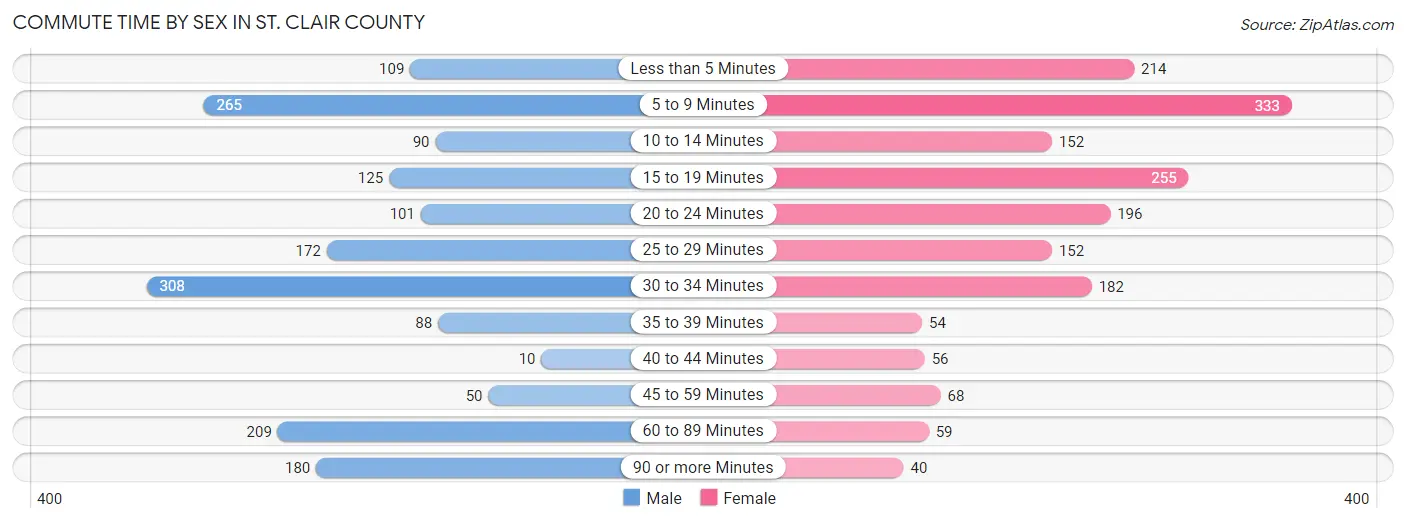
| Commute Time | Male | Female |
| Less than 5 Minutes | 109 (6.4%) | 214 (12.1%) |
| 5 to 9 Minutes | 265 (15.5%) | 333 (18.9%) |
| 10 to 14 Minutes | 90 (5.3%) | 152 (8.6%) |
| 15 to 19 Minutes | 125 (7.3%) | 255 (14.5%) |
| 20 to 24 Minutes | 101 (5.9%) | 196 (11.1%) |
| 25 to 29 Minutes | 172 (10.1%) | 152 (8.6%) |
| 30 to 34 Minutes | 308 (18.0%) | 182 (10.3%) |
| 35 to 39 Minutes | 88 (5.2%) | 54 (3.1%) |
| 40 to 44 Minutes | 10 (0.6%) | 56 (3.2%) |
| 45 to 59 Minutes | 50 (2.9%) | 68 (3.9%) |
| 60 to 89 Minutes | 209 (12.2%) | 59 (3.4%) |
| 90 or more Minutes | 180 (10.5%) | 40 (2.3%) |
Time of Departure to Work by Sex in St. Clair County
The most frequent times of departure to work in St. Clair County are 7:00 AM to 7:29 AM (280, 16.4%) for males and 7:30 AM to 7:59 AM (483, 27.4%) for females.
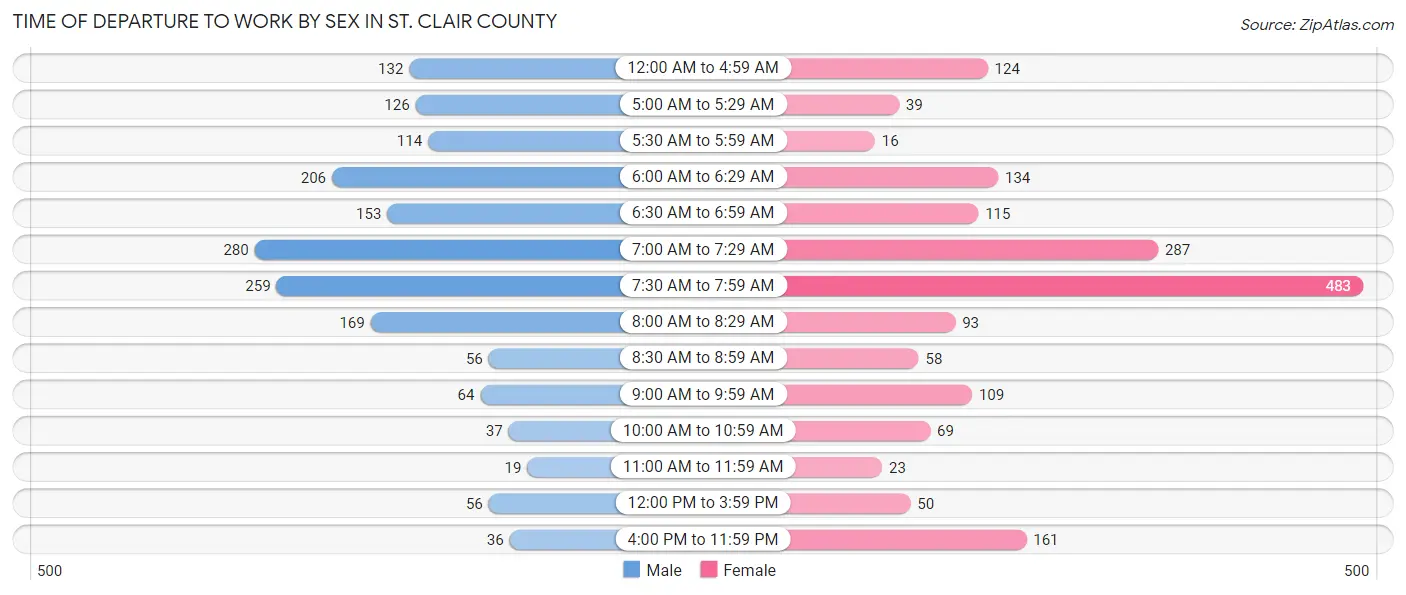
| Time of Departure | Male | Female |
| 12:00 AM to 4:59 AM | 132 (7.7%) | 124 (7.0%) |
| 5:00 AM to 5:29 AM | 126 (7.4%) | 39 (2.2%) |
| 5:30 AM to 5:59 AM | 114 (6.7%) | 16 (0.9%) |
| 6:00 AM to 6:29 AM | 206 (12.1%) | 134 (7.6%) |
| 6:30 AM to 6:59 AM | 153 (9.0%) | 115 (6.5%) |
| 7:00 AM to 7:29 AM | 280 (16.4%) | 287 (16.3%) |
| 7:30 AM to 7:59 AM | 259 (15.2%) | 483 (27.4%) |
| 8:00 AM to 8:29 AM | 169 (9.9%) | 93 (5.3%) |
| 8:30 AM to 8:59 AM | 56 (3.3%) | 58 (3.3%) |
| 9:00 AM to 9:59 AM | 64 (3.7%) | 109 (6.2%) |
| 10:00 AM to 10:59 AM | 37 (2.2%) | 69 (3.9%) |
| 11:00 AM to 11:59 AM | 19 (1.1%) | 23 (1.3%) |
| 12:00 PM to 3:59 PM | 56 (3.3%) | 50 (2.8%) |
| 4:00 PM to 11:59 PM | 36 (2.1%) | 161 (9.1%) |
| Total | 1,707 (100.0%) | 1,761 (100.0%) |
Housing Occupancy in St. Clair County
Occupancy by Ownership in St. Clair County
Of the total 3,955 dwellings in St. Clair County, owner-occupied units account for 3,023 (76.4%), while renter-occupied units make up 932 (23.6%).
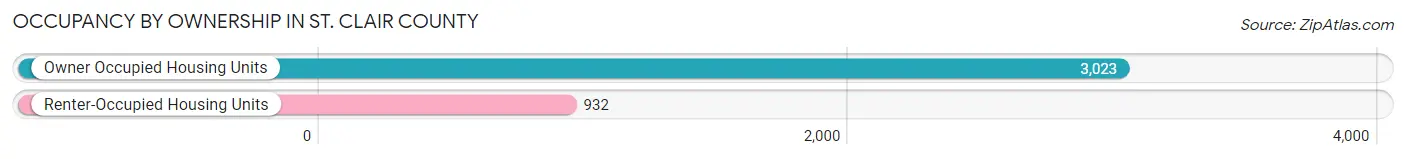
| Occupancy | # Housing Units | % Housing Units |
| Owner Occupied Housing Units | 3,023 | 76.4% |
| Renter-Occupied Housing Units | 932 | 23.6% |
| Total Occupied Housing Units | 3,955 | 100.0% |
Occupancy by Household Size in St. Clair County
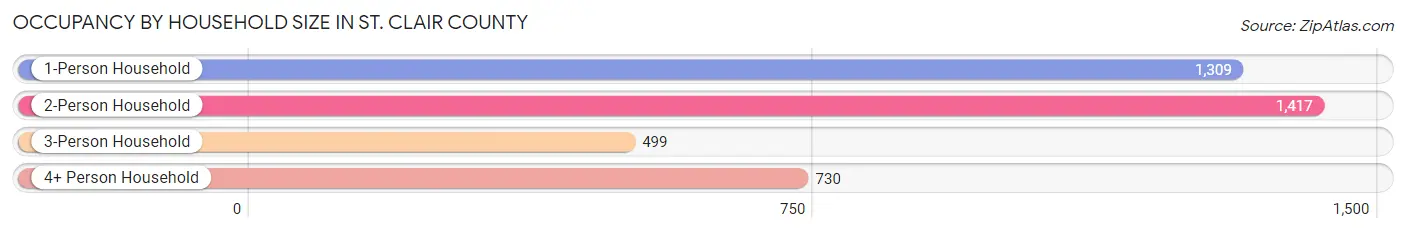
| Household Size | # Housing Units | % Housing Units |
| 1-Person Household | 1,309 | 33.1% |
| 2-Person Household | 1,417 | 35.8% |
| 3-Person Household | 499 | 12.6% |
| 4+ Person Household | 730 | 18.5% |
| Total Housing Units | 3,955 | 100.0% |
Occupancy by Ownership by Household Size in St. Clair County
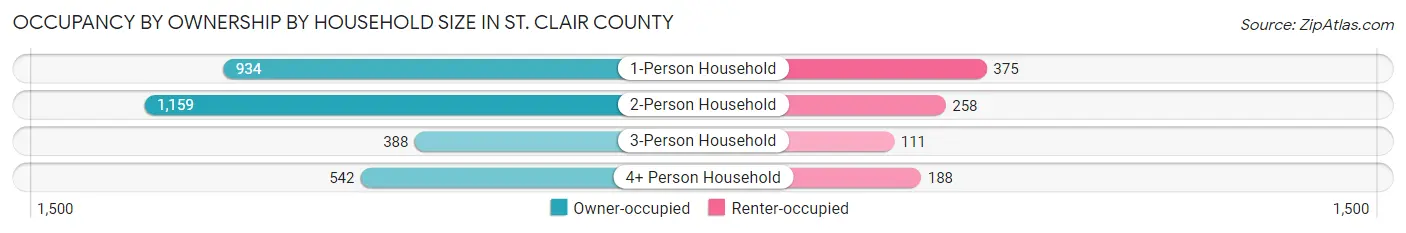
| Household Size | Owner-occupied | Renter-occupied |
| 1-Person Household | 934 (71.4%) | 375 (28.6%) |
| 2-Person Household | 1,159 (81.8%) | 258 (18.2%) |
| 3-Person Household | 388 (77.8%) | 111 (22.2%) |
| 4+ Person Household | 542 (74.3%) | 188 (25.8%) |
| Total Housing Units | 3,023 (76.4%) | 932 (23.6%) |
Occupancy by Educational Attainment in St. Clair County
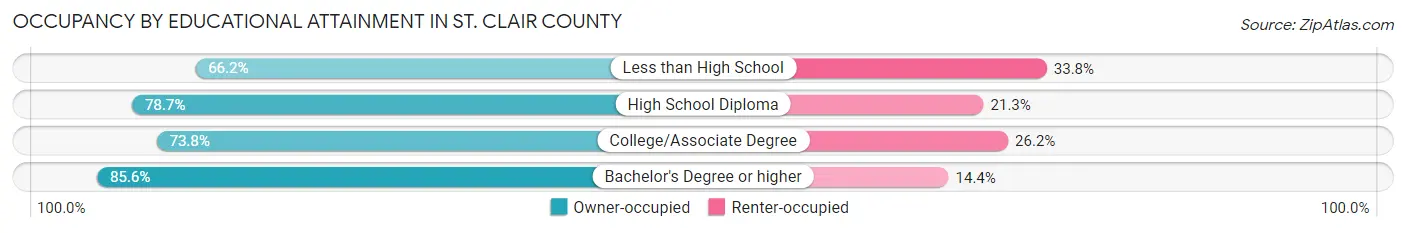
| Household Size | Owner-occupied | Renter-occupied |
| Less than High School | 305 (66.2%) | 156 (33.8%) |
| High School Diploma | 1,186 (78.7%) | 321 (21.3%) |
| College/Associate Degree | 1,061 (73.8%) | 376 (26.2%) |
| Bachelor's Degree or higher | 471 (85.6%) | 79 (14.4%) |
Occupancy by Age of Householder in St. Clair County
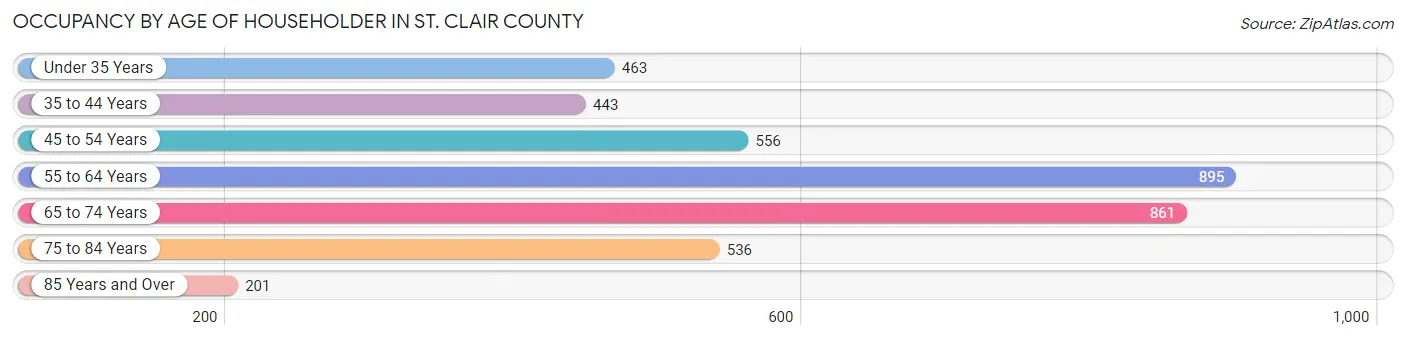
| Age Bracket | # Households | % Households |
| Under 35 Years | 463 | 11.7% |
| 35 to 44 Years | 443 | 11.2% |
| 45 to 54 Years | 556 | 14.1% |
| 55 to 64 Years | 895 | 22.6% |
| 65 to 74 Years | 861 | 21.8% |
| 75 to 84 Years | 536 | 13.6% |
| 85 Years and Over | 201 | 5.1% |
| Total | 3,955 | 100.0% |
Housing Finances in St. Clair County
Median Income by Occupancy in St. Clair County
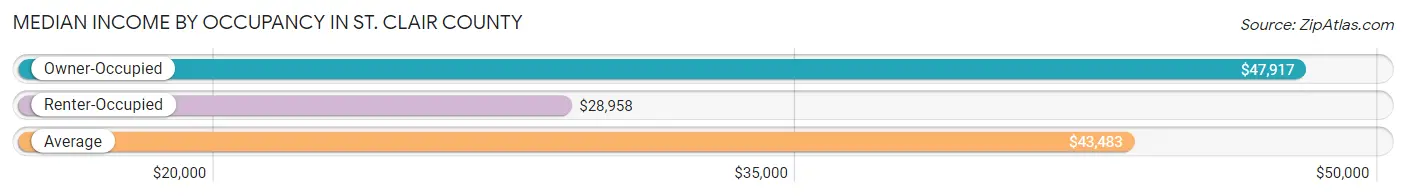
| Occupancy Type | # Households | Median Income |
| Owner-Occupied | 3,023 (76.4%) | $47,917 |
| Renter-Occupied | 932 (23.6%) | $28,958 |
| Average | 3,955 (100.0%) | $43,483 |
Occupancy by Householder Income Bracket in St. Clair County
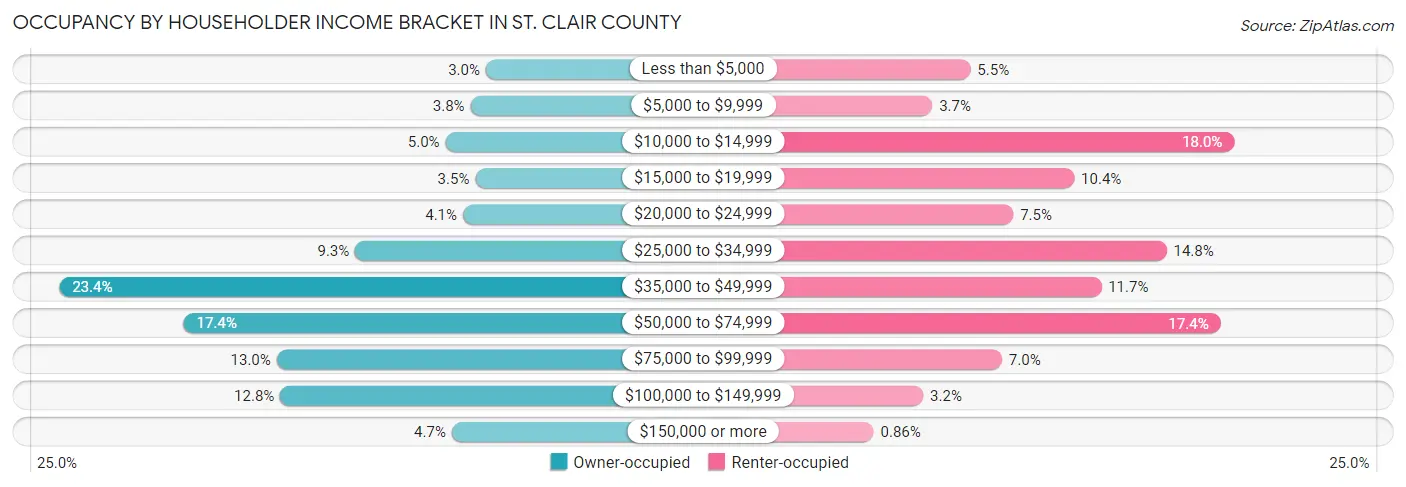
| Income Bracket | Owner-occupied | Renter-occupied |
| Less than $5,000 | 92 (3.0%) | 51 (5.5%) |
| $5,000 to $9,999 | 114 (3.8%) | 34 (3.6%) |
| $10,000 to $14,999 | 150 (5.0%) | 168 (18.0%) |
| $15,000 to $19,999 | 107 (3.5%) | 97 (10.4%) |
| $20,000 to $24,999 | 125 (4.1%) | 70 (7.5%) |
| $25,000 to $34,999 | 280 (9.3%) | 138 (14.8%) |
| $35,000 to $49,999 | 706 (23.4%) | 109 (11.7%) |
| $50,000 to $74,999 | 527 (17.4%) | 162 (17.4%) |
| $75,000 to $99,999 | 393 (13.0%) | 65 (7.0%) |
| $100,000 to $149,999 | 388 (12.8%) | 30 (3.2%) |
| $150,000 or more | 141 (4.7%) | 8 (0.9%) |
| Total | 3,023 (100.0%) | 932 (100.0%) |
Monthly Housing Cost Tiers in St. Clair County
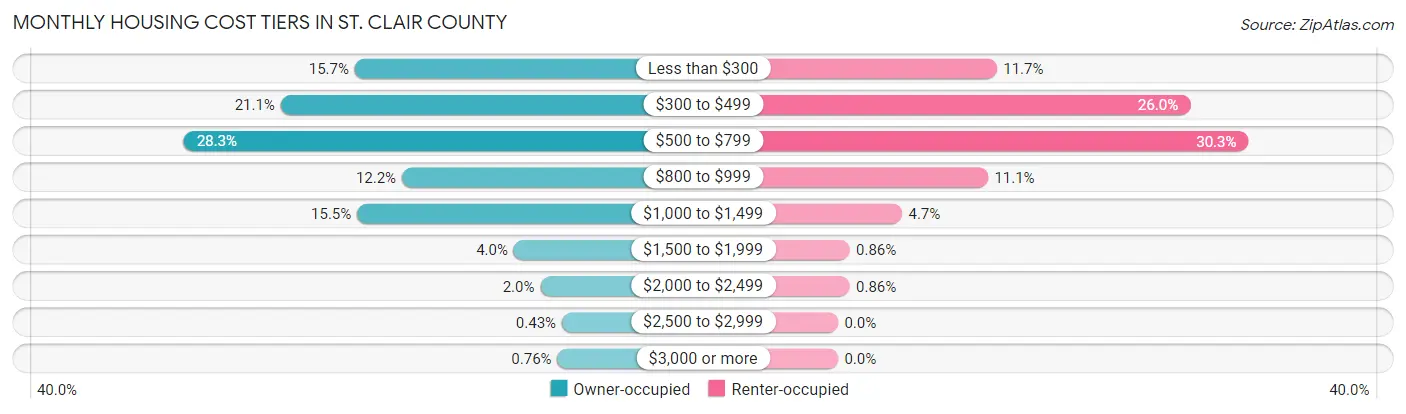
| Monthly Cost | Owner-occupied | Renter-occupied |
| Less than $300 | 474 (15.7%) | 109 (11.7%) |
| $300 to $499 | 639 (21.1%) | 242 (26.0%) |
| $500 to $799 | 855 (28.3%) | 282 (30.3%) |
| $800 to $999 | 369 (12.2%) | 103 (11.1%) |
| $1,000 to $1,499 | 469 (15.5%) | 44 (4.7%) |
| $1,500 to $1,999 | 120 (4.0%) | 8 (0.9%) |
| $2,000 to $2,499 | 61 (2.0%) | 8 (0.9%) |
| $2,500 to $2,999 | 13 (0.4%) | 0 (0.0%) |
| $3,000 or more | 23 (0.8%) | 0 (0.0%) |
| Total | 3,023 (100.0%) | 932 (100.0%) |
Physical Housing Characteristics in St. Clair County
Housing Structures in St. Clair County
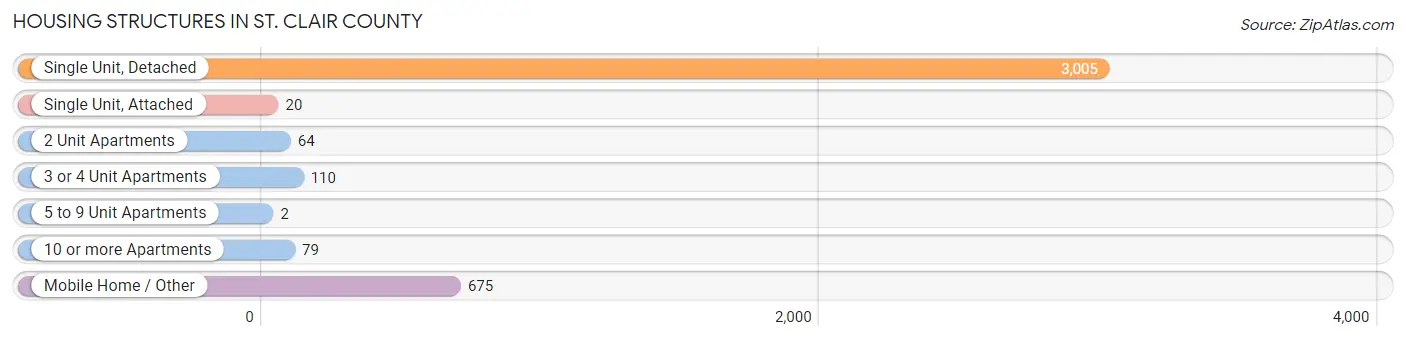
| Structure Type | # Housing Units | % Housing Units |
| Single Unit, Detached | 3,005 | 76.0% |
| Single Unit, Attached | 20 | 0.5% |
| 2 Unit Apartments | 64 | 1.6% |
| 3 or 4 Unit Apartments | 110 | 2.8% |
| 5 to 9 Unit Apartments | 2 | 0.1% |
| 10 or more Apartments | 79 | 2.0% |
| Mobile Home / Other | 675 | 17.1% |
| Total | 3,955 | 100.0% |
Housing Structures by Occupancy in St. Clair County
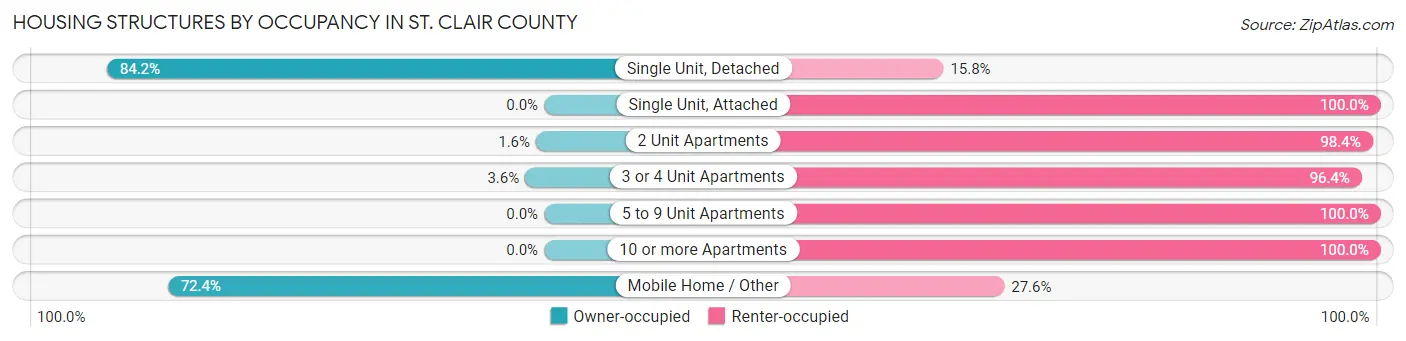
| Structure Type | Owner-occupied | Renter-occupied |
| Single Unit, Detached | 2,529 (84.2%) | 476 (15.8%) |
| Single Unit, Attached | 0 (0.0%) | 20 (100.0%) |
| 2 Unit Apartments | 1 (1.6%) | 63 (98.4%) |
| 3 or 4 Unit Apartments | 4 (3.6%) | 106 (96.4%) |
| 5 to 9 Unit Apartments | 0 (0.0%) | 2 (100.0%) |
| 10 or more Apartments | 0 (0.0%) | 79 (100.0%) |
| Mobile Home / Other | 489 (72.4%) | 186 (27.6%) |
| Total | 3,023 (76.4%) | 932 (23.6%) |
Housing Structures by Number of Rooms in St. Clair County
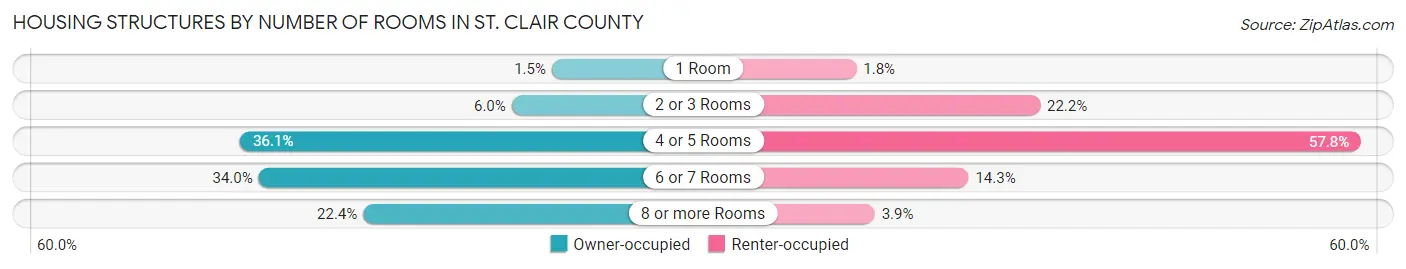
| Number of Rooms | Owner-occupied | Renter-occupied |
| 1 Room | 45 (1.5%) | 17 (1.8%) |
| 2 or 3 Rooms | 180 (5.9%) | 207 (22.2%) |
| 4 or 5 Rooms | 1,091 (36.1%) | 539 (57.8%) |
| 6 or 7 Rooms | 1,029 (34.0%) | 133 (14.3%) |
| 8 or more Rooms | 678 (22.4%) | 36 (3.9%) |
| Total | 3,023 (100.0%) | 932 (100.0%) |
Housing Structure by Heating Type in St. Clair County
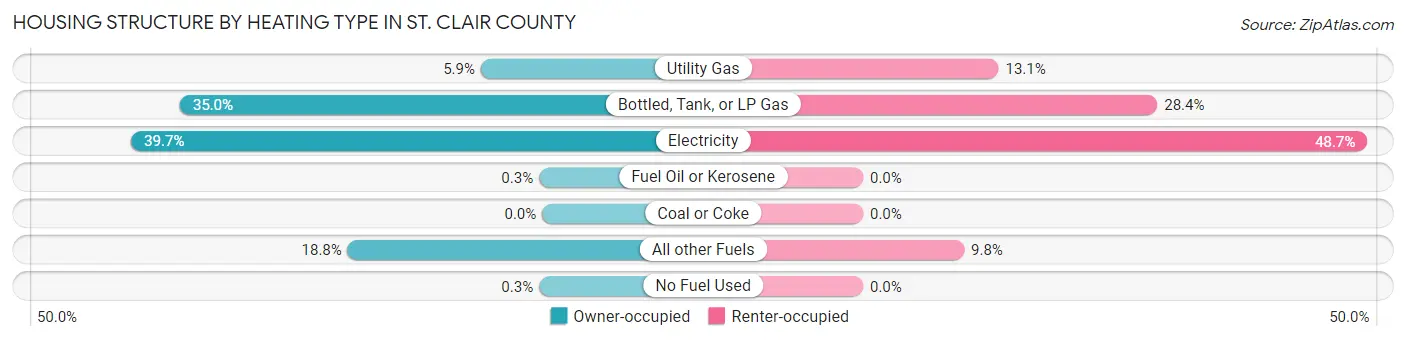
| Heating Type | Owner-occupied | Renter-occupied |
| Utility Gas | 179 (5.9%) | 122 (13.1%) |
| Bottled, Tank, or LP Gas | 1,058 (35.0%) | 265 (28.4%) |
| Electricity | 1,200 (39.7%) | 454 (48.7%) |
| Fuel Oil or Kerosene | 9 (0.3%) | 0 (0.0%) |
| Coal or Coke | 0 (0.0%) | 0 (0.0%) |
| All other Fuels | 568 (18.8%) | 91 (9.8%) |
| No Fuel Used | 9 (0.3%) | 0 (0.0%) |
| Total | 3,023 (100.0%) | 932 (100.0%) |
Household Vehicle Usage in St. Clair County
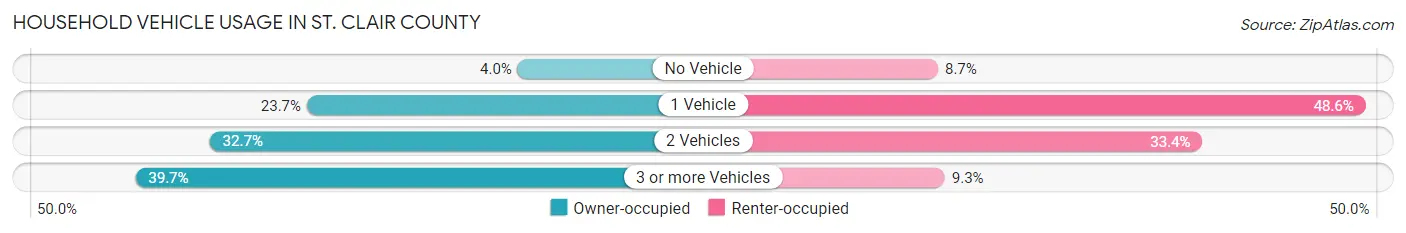
| Vehicles per Household | Owner-occupied | Renter-occupied |
| No Vehicle | 120 (4.0%) | 81 (8.7%) |
| 1 Vehicle | 715 (23.6%) | 453 (48.6%) |
| 2 Vehicles | 989 (32.7%) | 311 (33.4%) |
| 3 or more Vehicles | 1,199 (39.7%) | 87 (9.3%) |
| Total | 3,023 (100.0%) | 932 (100.0%) |
Real Estate & Mortgages in St. Clair County
Real Estate and Mortgage Overview in St. Clair County
| Characteristic | Without Mortgage | With Mortgage |
| Housing Units | 1,709 | 1,314 |
| Median Property Value | $109,600 | $155,600 |
| Median Household Income | $41,305 | $92 |
| Monthly Housing Costs | $399 | $18 |
| Real Estate Taxes | $793 | $1 |
Property Value by Mortgage Status in St. Clair County
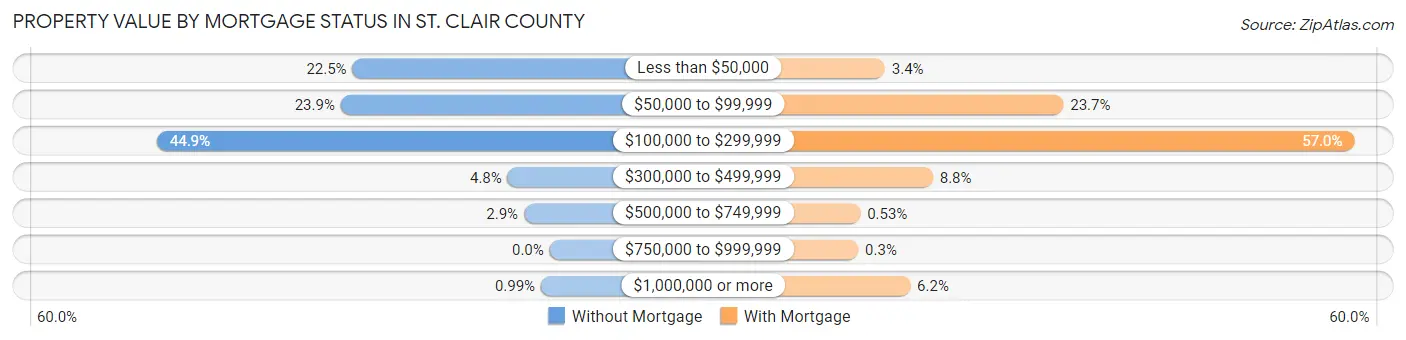
| Property Value | Without Mortgage | With Mortgage |
| Less than $50,000 | 385 (22.5%) | 44 (3.4%) |
| $50,000 to $99,999 | 408 (23.9%) | 312 (23.7%) |
| $100,000 to $299,999 | 767 (44.9%) | 749 (57.0%) |
| $300,000 to $499,999 | 82 (4.8%) | 116 (8.8%) |
| $500,000 to $749,999 | 50 (2.9%) | 7 (0.5%) |
| $750,000 to $999,999 | 0 (0.0%) | 4 (0.3%) |
| $1,000,000 or more | 17 (1.0%) | 82 (6.2%) |
| Total | 1,709 (100.0%) | 1,314 (100.0%) |
Household Income by Mortgage Status in St. Clair County
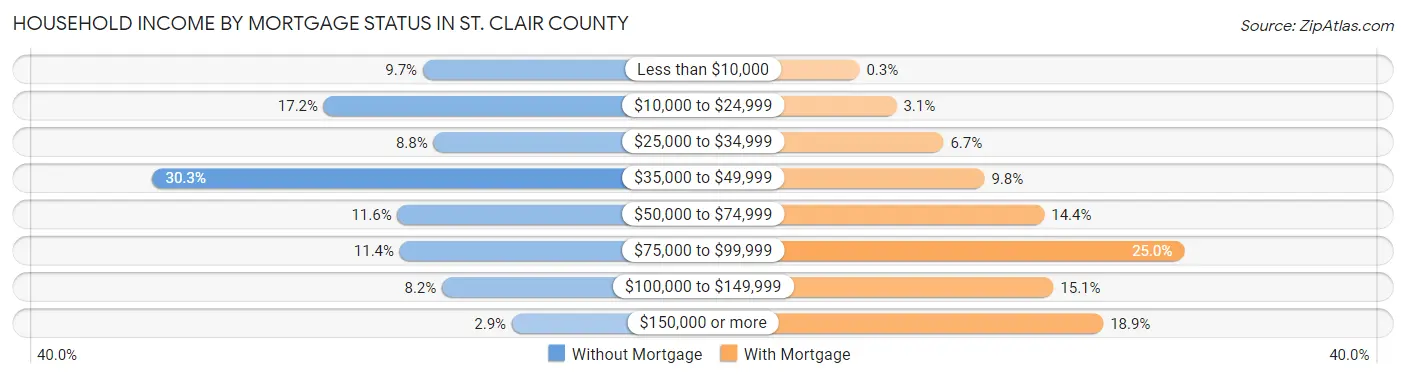
| Household Income | Without Mortgage | With Mortgage |
| Less than $10,000 | 165 (9.7%) | 4 (0.3%) |
| $10,000 to $24,999 | 294 (17.2%) | 41 (3.1%) |
| $25,000 to $34,999 | 151 (8.8%) | 88 (6.7%) |
| $35,000 to $49,999 | 517 (30.2%) | 129 (9.8%) |
| $50,000 to $74,999 | 198 (11.6%) | 189 (14.4%) |
| $75,000 to $99,999 | 195 (11.4%) | 329 (25.0%) |
| $100,000 to $149,999 | 140 (8.2%) | 198 (15.1%) |
| $150,000 or more | 49 (2.9%) | 248 (18.9%) |
| Total | 1,709 (100.0%) | 1,314 (100.0%) |
Property Value to Household Income Ratio in St. Clair County
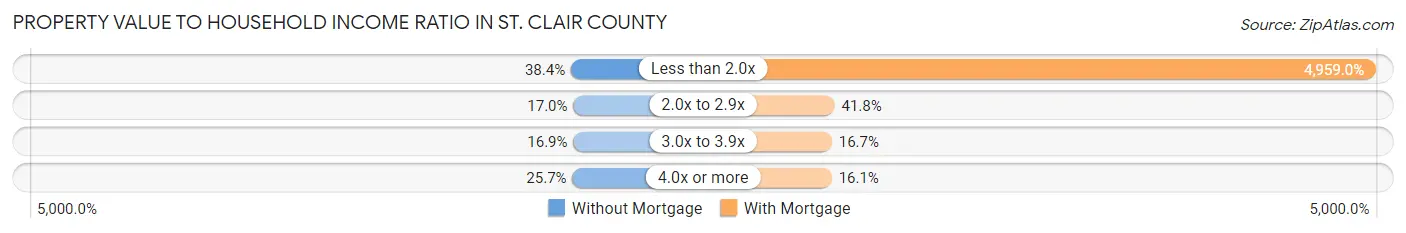
| Value-to-Income Ratio | Without Mortgage | With Mortgage |
| Less than 2.0x | 657 (38.4%) | 65,161 (4,959.0%) |
| 2.0x to 2.9x | 290 (17.0%) | 549 (41.8%) |
| 3.0x to 3.9x | 288 (16.9%) | 220 (16.7%) |
| 4.0x or more | 439 (25.7%) | 212 (16.1%) |
| Total | 1,709 (100.0%) | 1,314 (100.0%) |
Real Estate Taxes by Mortgage Status in St. Clair County
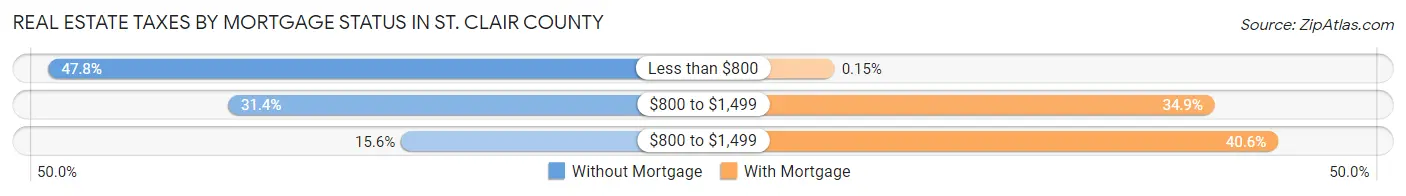
| Property Taxes | Without Mortgage | With Mortgage |
| Less than $800 | 817 (47.8%) | 2 (0.2%) |
| $800 to $1,499 | 537 (31.4%) | 458 (34.9%) |
| $800 to $1,499 | 267 (15.6%) | 534 (40.6%) |
| Total | 1,709 (100.0%) | 1,314 (100.0%) |
Health & Disability in St. Clair County
Health Insurance Coverage by Age in St. Clair County
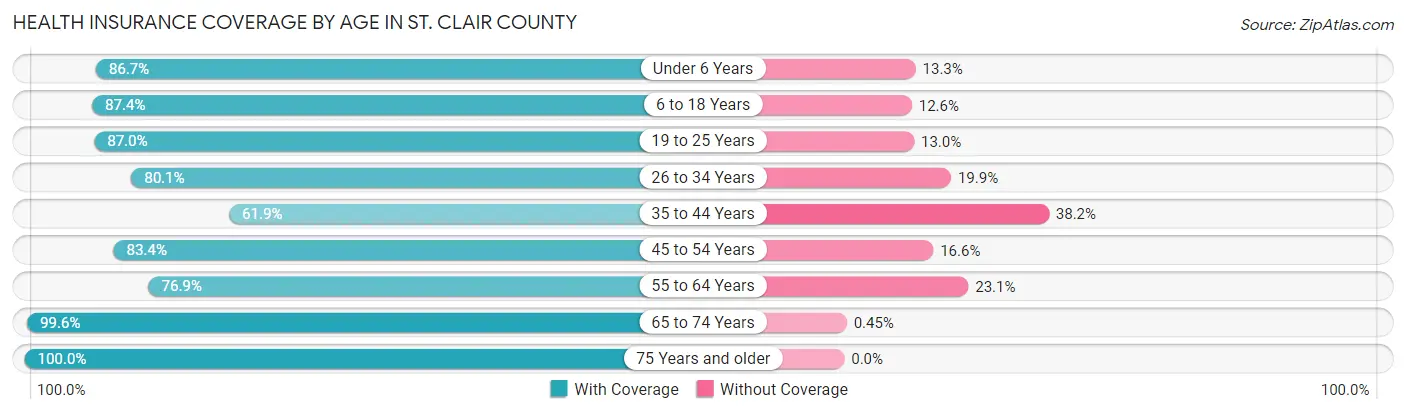
| Age Bracket | With Coverage | Without Coverage |
| Under 6 Years | 528 (86.7%) | 81 (13.3%) |
| 6 to 18 Years | 1,201 (87.4%) | 173 (12.6%) |
| 19 to 25 Years | 475 (87.0%) | 71 (13.0%) |
| 26 to 34 Years | 656 (80.1%) | 163 (19.9%) |
| 35 to 44 Years | 543 (61.9%) | 335 (38.2%) |
| 45 to 54 Years | 885 (83.4%) | 176 (16.6%) |
| 55 to 64 Years | 1,120 (76.9%) | 337 (23.1%) |
| 65 to 74 Years | 1,325 (99.6%) | 6 (0.4%) |
| 75 Years and older | 989 (100.0%) | 0 (0.0%) |
| Total | 7,722 (85.2%) | 1,342 (14.8%) |
Health Insurance Coverage by Citizenship Status in St. Clair County
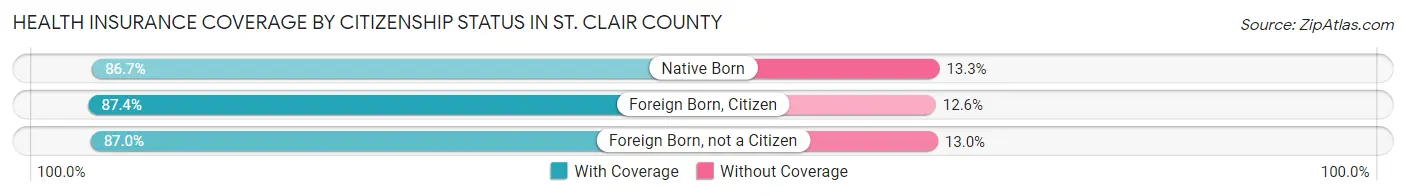
| Citizenship Status | With Coverage | Without Coverage |
| Native Born | 528 (86.7%) | 81 (13.3%) |
| Foreign Born, Citizen | 1,201 (87.4%) | 173 (12.6%) |
| Foreign Born, not a Citizen | 475 (87.0%) | 71 (13.0%) |
Health Insurance Coverage by Household Income in St. Clair County
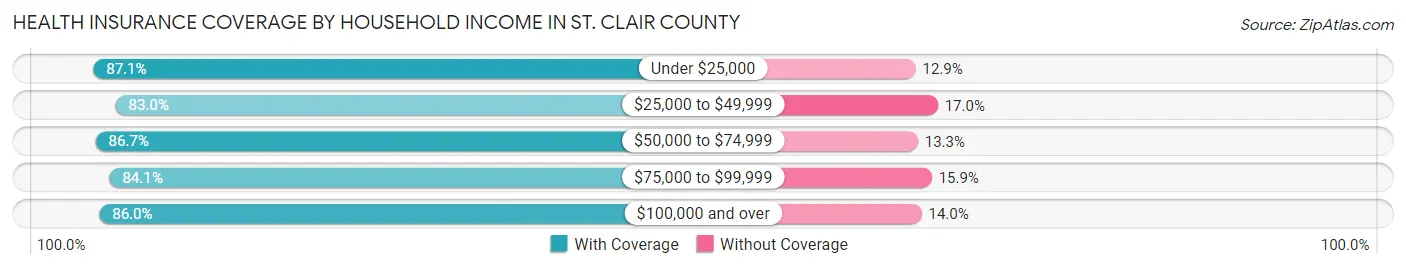
| Household Income | With Coverage | Without Coverage |
| Under $25,000 | 1,333 (87.1%) | 197 (12.9%) |
| $25,000 to $49,999 | 2,054 (83.0%) | 422 (17.0%) |
| $50,000 to $74,999 | 1,558 (86.7%) | 239 (13.3%) |
| $75,000 to $99,999 | 1,205 (84.1%) | 228 (15.9%) |
| $100,000 and over | 1,572 (86.0%) | 256 (14.0%) |
Public vs Private Health Insurance Coverage by Age in St. Clair County
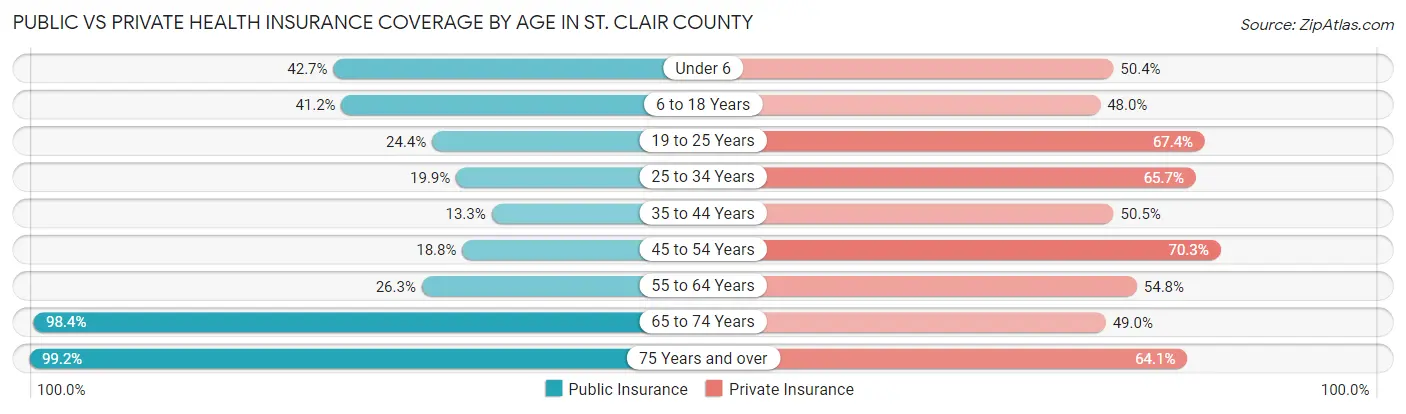
| Age Bracket | Public Insurance | Private Insurance |
| Under 6 | 260 (42.7%) | 307 (50.4%) |
| 6 to 18 Years | 566 (41.2%) | 659 (48.0%) |
| 19 to 25 Years | 133 (24.4%) | 368 (67.4%) |
| 25 to 34 Years | 163 (19.9%) | 538 (65.7%) |
| 35 to 44 Years | 117 (13.3%) | 443 (50.5%) |
| 45 to 54 Years | 199 (18.8%) | 746 (70.3%) |
| 55 to 64 Years | 383 (26.3%) | 798 (54.8%) |
| 65 to 74 Years | 1,310 (98.4%) | 652 (49.0%) |
| 75 Years and over | 981 (99.2%) | 634 (64.1%) |
| Total | 4,112 (45.4%) | 5,145 (56.8%) |
Disability Status by Sex by Age in St. Clair County
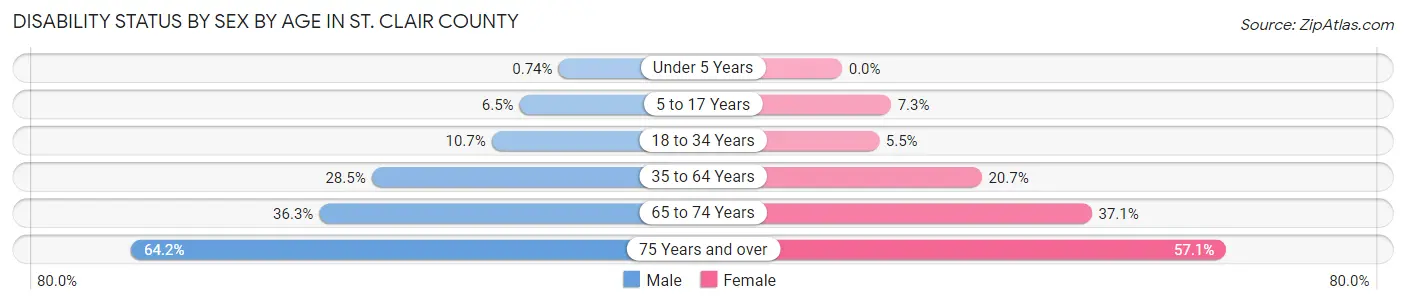
| Age Bracket | Male | Female |
| Under 5 Years | 2 (0.7%) | 0 (0.0%) |
| 5 to 17 Years | 47 (6.5%) | 49 (7.3%) |
| 18 to 34 Years | 79 (10.7%) | 39 (5.5%) |
| 35 to 64 Years | 488 (28.5%) | 349 (20.7%) |
| 65 to 74 Years | 248 (36.3%) | 240 (37.1%) |
| 75 Years and over | 294 (64.2%) | 303 (57.1%) |
Disability Class by Sex by Age in St. Clair County
Disability Class: Hearing Difficulty
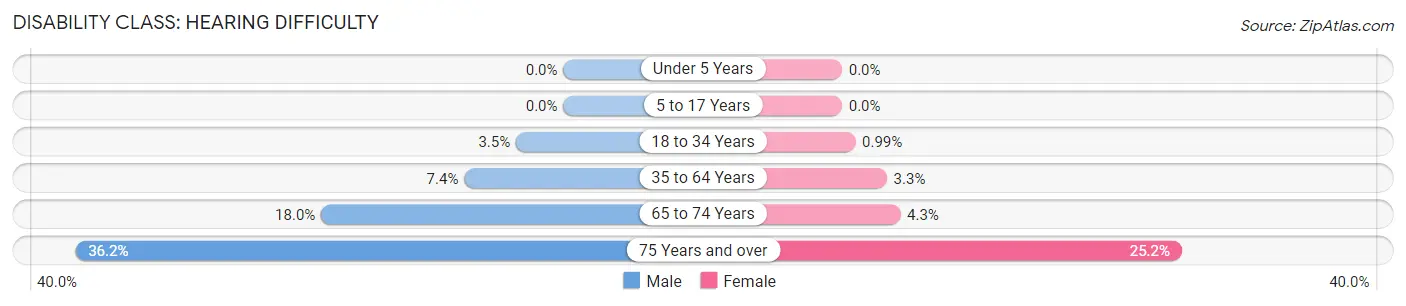
| Age Bracket | Male | Female |
| Under 5 Years | 0 (0.0%) | 0 (0.0%) |
| 5 to 17 Years | 0 (0.0%) | 0 (0.0%) |
| 18 to 34 Years | 26 (3.5%) | 7 (1.0%) |
| 35 to 64 Years | 126 (7.4%) | 56 (3.3%) |
| 65 to 74 Years | 123 (18.0%) | 28 (4.3%) |
| 75 Years and over | 166 (36.2%) | 134 (25.2%) |
Disability Class: Vision Difficulty
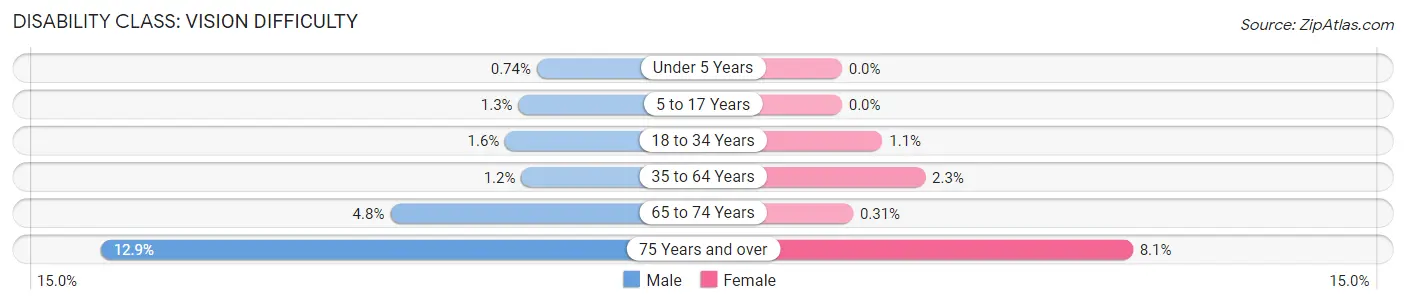
| Age Bracket | Male | Female |
| Under 5 Years | 2 (0.7%) | 0 (0.0%) |
| 5 to 17 Years | 9 (1.3%) | 0 (0.0%) |
| 18 to 34 Years | 12 (1.6%) | 8 (1.1%) |
| 35 to 64 Years | 20 (1.2%) | 39 (2.3%) |
| 65 to 74 Years | 33 (4.8%) | 2 (0.3%) |
| 75 Years and over | 59 (12.9%) | 43 (8.1%) |
Disability Class: Cognitive Difficulty
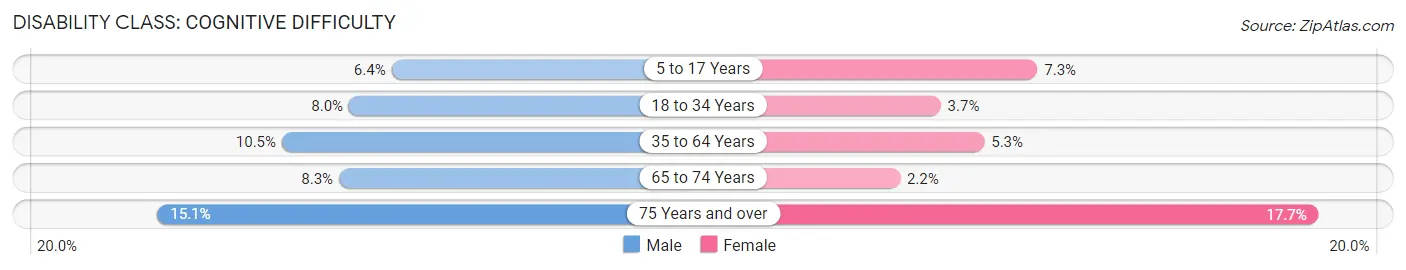
| Age Bracket | Male | Female |
| 5 to 17 Years | 46 (6.4%) | 49 (7.3%) |
| 18 to 34 Years | 59 (8.0%) | 26 (3.7%) |
| 35 to 64 Years | 179 (10.4%) | 89 (5.3%) |
| 65 to 74 Years | 57 (8.3%) | 14 (2.2%) |
| 75 Years and over | 69 (15.1%) | 94 (17.7%) |
Disability Class: Ambulatory Difficulty
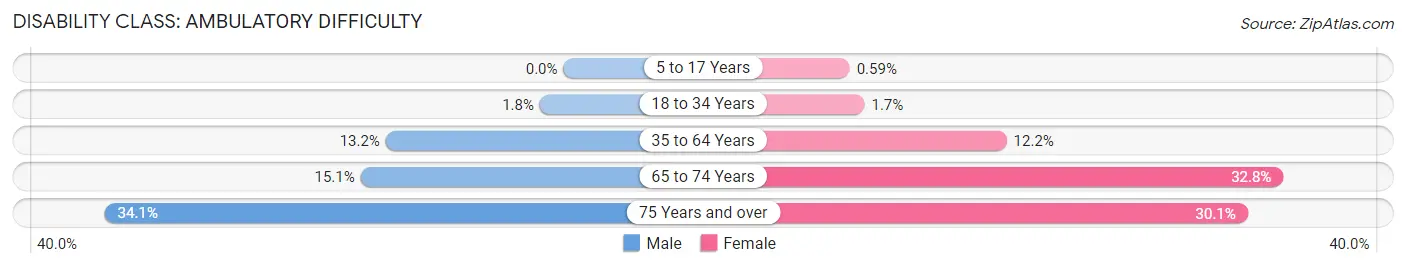
| Age Bracket | Male | Female |
| 5 to 17 Years | 0 (0.0%) | 4 (0.6%) |
| 18 to 34 Years | 13 (1.8%) | 12 (1.7%) |
| 35 to 64 Years | 226 (13.2%) | 206 (12.2%) |
| 65 to 74 Years | 103 (15.1%) | 212 (32.8%) |
| 75 Years and over | 156 (34.1%) | 160 (30.1%) |
Disability Class: Self-Care Difficulty
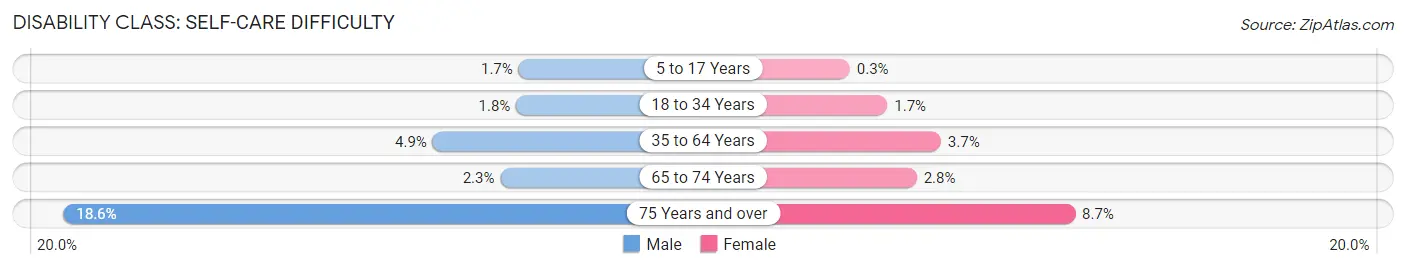
| Age Bracket | Male | Female |
| 5 to 17 Years | 12 (1.7%) | 2 (0.3%) |
| 18 to 34 Years | 13 (1.8%) | 12 (1.7%) |
| 35 to 64 Years | 83 (4.9%) | 62 (3.7%) |
| 65 to 74 Years | 16 (2.3%) | 18 (2.8%) |
| 75 Years and over | 85 (18.6%) | 46 (8.7%) |
Technology Access in St. Clair County
Computing Device Access in St. Clair County
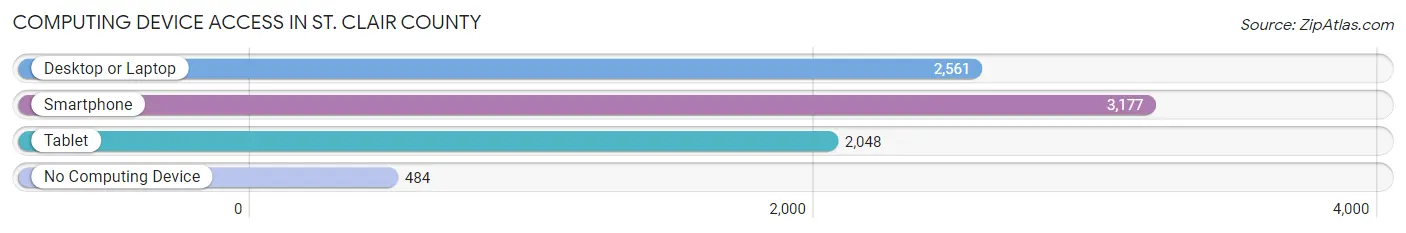
| Device Type | # Households | % Households |
| Desktop or Laptop | 2,561 | 64.7% |
| Smartphone | 3,177 | 80.3% |
| Tablet | 2,048 | 51.8% |
| No Computing Device | 484 | 12.2% |
| Total | 3,955 | 100.0% |
Internet Access in St. Clair County
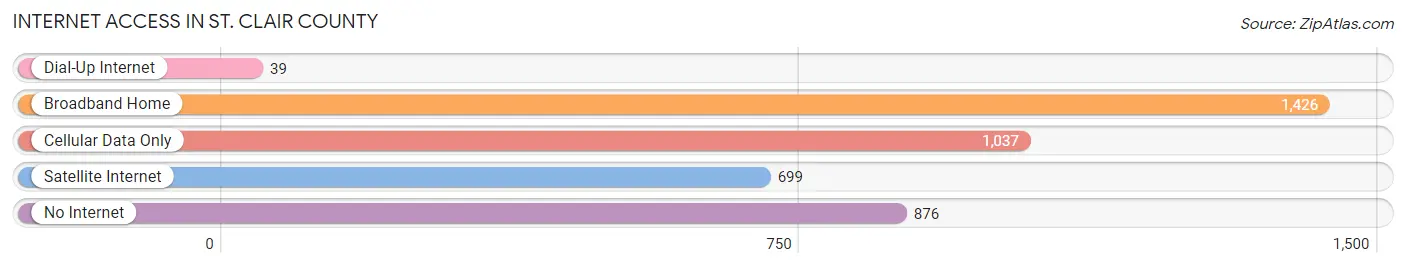
| Internet Type | # Households | % Households |
| Dial-Up Internet | 39 | 1.0% |
| Broadband Home | 1,426 | 36.1% |
| Cellular Data Only | 1,037 | 26.2% |
| Satellite Internet | 699 | 17.7% |
| No Internet | 876 | 22.2% |
| Total | 3,955 | 100.0% |
St. Clair County Summary
St. Clair County is located in the southwestern corner of Missouri, and is bordered by Cedar County to the north, Dade County to the east, and the state of Oklahoma to the south and west. The county seat is Osceola, and the largest city is Appleton City. The county was established in 1841 and named after Arthur St. Clair, a Revolutionary War general.
Geography
St. Clair County covers an area of 576 square miles, of which 574 square miles is land and 2 square miles is water. The county is located in the Ozark Plateau region of Missouri, and is characterized by rolling hills and valleys. The Sac River runs through the county, and there are several small lakes and ponds scattered throughout the area. The highest point in the county is located in the northwest corner, at an elevation of 1,200 feet.
The climate of St. Clair County is generally mild, with hot summers and cold winters. The average annual temperature is around 54 degrees Fahrenheit, and the average annual precipitation is around 40 inches.
Economy
The economy of St. Clair County is largely based on agriculture. The county is home to a variety of crops, including corn, soybeans, wheat, hay, and oats. Livestock production is also important, with beef cattle, dairy cows, and hogs being the most common.
The county also has a strong manufacturing sector, with several factories producing a variety of products, including furniture, clothing, and automotive parts. Tourism is also an important part of the economy, with several popular attractions, such as the Sac River Trail and the St. Clair County Museum.
Demographics
As of the 2010 census, St. Clair County had a population of 9,805. The population was spread out, with 48.3% male and 51.7% female. The median age was 41.7 years, and the median household income was $41,945.
The racial makeup of the county was 97.2% White, 0.7% African American, 0.3% Native American, 0.2% Asian, 0.1% Pacific Islander, 0.4% from other races, and 1.1% from two or more races. Hispanic or Latino of any race were 1.3% of the population.
The largest ancestry groups in St. Clair County were German (30.2%), English (19.2%), Irish (14.2%), and American (10.2%).
Education
St. Clair County is served by the Osceola R-1 School District, which includes one elementary school, one middle school, and one high school. The county also has several private schools, as well as a branch of Crowder College.
Conclusion
St. Clair County is a rural county located in the southwestern corner of Missouri. The county is characterized by rolling hills and valleys, and is home to a variety of crops and livestock. The economy is largely based on agriculture, manufacturing, and tourism, and the population is mostly White with a small minority population. The county is served by the Osceola R-1 School District, as well as several private schools and a branch of Crowder College.
Common Questions
What is Per Capita Income in St. Clair County?
Per Capita income in St. Clair County is $24,845.
What is the Median Family Income in St. Clair County?
Median Family Income in St. Clair County is $58,561.
What is the Median Household income in St. Clair County?
Median Household Income in St. Clair County is $43,483.
What is Income or Wage Gap in St. Clair County?
Income or Wage Gap in St. Clair County is 26.9%.
Women in St. Clair County earn 73.1 cents for every dollar earned by a man.
What is Family Income Deficit in St. Clair County?
Family Income Deficit in St. Clair County is $8,593.
Families that are below poverty line in St. Clair County earn $8,593 less on average than the poverty threshold level.
What is Inequality or Gini Index in St. Clair County?
Inequality or Gini Index in St. Clair County is 0.43.
What is the Total Population of St. Clair County?
Total Population of St. Clair County is 9,330.
What is the Total Male Population of St. Clair County?
Total Male Population of St. Clair County is 4,737.
What is the Total Female Population of St. Clair County?
Total Female Population of St. Clair County is 4,593.
What is the Ratio of Males per 100 Females in St. Clair County?
There are 103.14 Males per 100 Females in St. Clair County.
What is the Ratio of Females per 100 Males in St. Clair County?
There are 96.96 Females per 100 Males in St. Clair County.
What is the Median Population Age in St. Clair County?
Median Population Age in St. Clair County is 48.2 Years.
What is the Average Family Size in St. Clair County
Average Family Size in St. Clair County is 2.9 People.
What is the Average Household Size in St. Clair County
Average Household Size in St. Clair County is 2.3 People.
How Large is the Labor Force in St. Clair County?
There are 3,887 People in the Labor Forcein in St. Clair County.
What is the Percentage of People in the Labor Force in St. Clair County?
50.4% of People are in the Labor Force in St. Clair County.
What is the Unemployment Rate in St. Clair County?
Unemployment Rate in St. Clair County is 2.5%.