St. Charles County, MO Map & Demographics
St. Charles County Map
St. Charles County Overview
$47,746
PER CAPITA INCOME
$118,114
AVG FAMILY INCOME
$99,596
AVG HOUSEHOLD INCOME
30.8%
WAGE / INCOME GAP [ % ]
69.2¢/ $1
WAGE / INCOME GAP [ $ ]
$10,690
FAMILY INCOME DEFICIT
0.40
INEQUALITY / GINI INDEX
406,262
TOTAL POPULATION
201,131
MALE POPULATION
205,131
FEMALE POPULATION
98.05
MALES / 100 FEMALES
101.99
FEMALES / 100 MALES
39.4
MEDIAN AGE
3.0
AVG FAMILY SIZE
2.6
AVG HOUSEHOLD SIZE
225,175
LABOR FORCE [ PEOPLE ]
69.4%
PERCENT IN LABOR FORCE
3.1%
UNEMPLOYMENT RATE
Income in St. Charles County
Income Overview in St. Charles County
Per Capita Income in St. Charles County is $47,746, while median incomes of families and households are $118,114 and $99,596 respectively.
| Characteristic | Number | Measure |
| Per Capita Income | 406,262 | $47,746 |
| Median Family Income | 110,031 | $118,114 |
| Mean Family Income | 110,031 | $140,558 |
| Median Household Income | 156,381 | $99,596 |
| Mean Household Income | 156,381 | $122,330 |
| Income Deficit | 110,031 | $10,690 |
| Wage / Income Gap (%) | 406,262 | 30.81% |
| Wage / Income Gap ($) | 406,262 | 69.19¢ per $1 |
| Gini / Inequality Index | 406,262 | 0.40 |
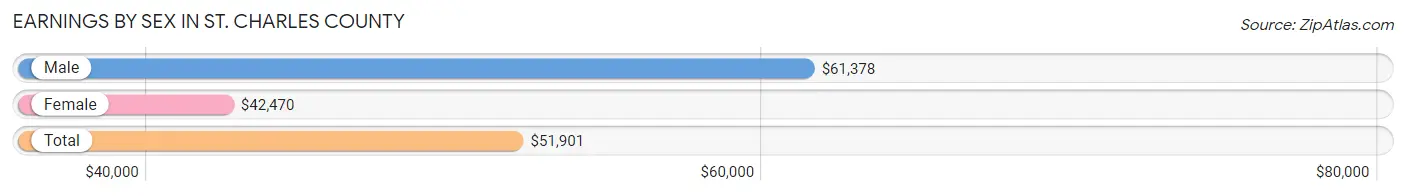
Earnings by Sex in St. Charles County
Average Earnings in St. Charles County are $51,901, $61,378 for men and $42,470 for women, a difference of 30.8%.
| Sex | Number | Average Earnings |
| Male | 122,650 (52.3%) | $61,378 |
| Female | 112,040 (47.7%) | $42,470 |
| Total | 234,690 (100.0%) | $51,901 |
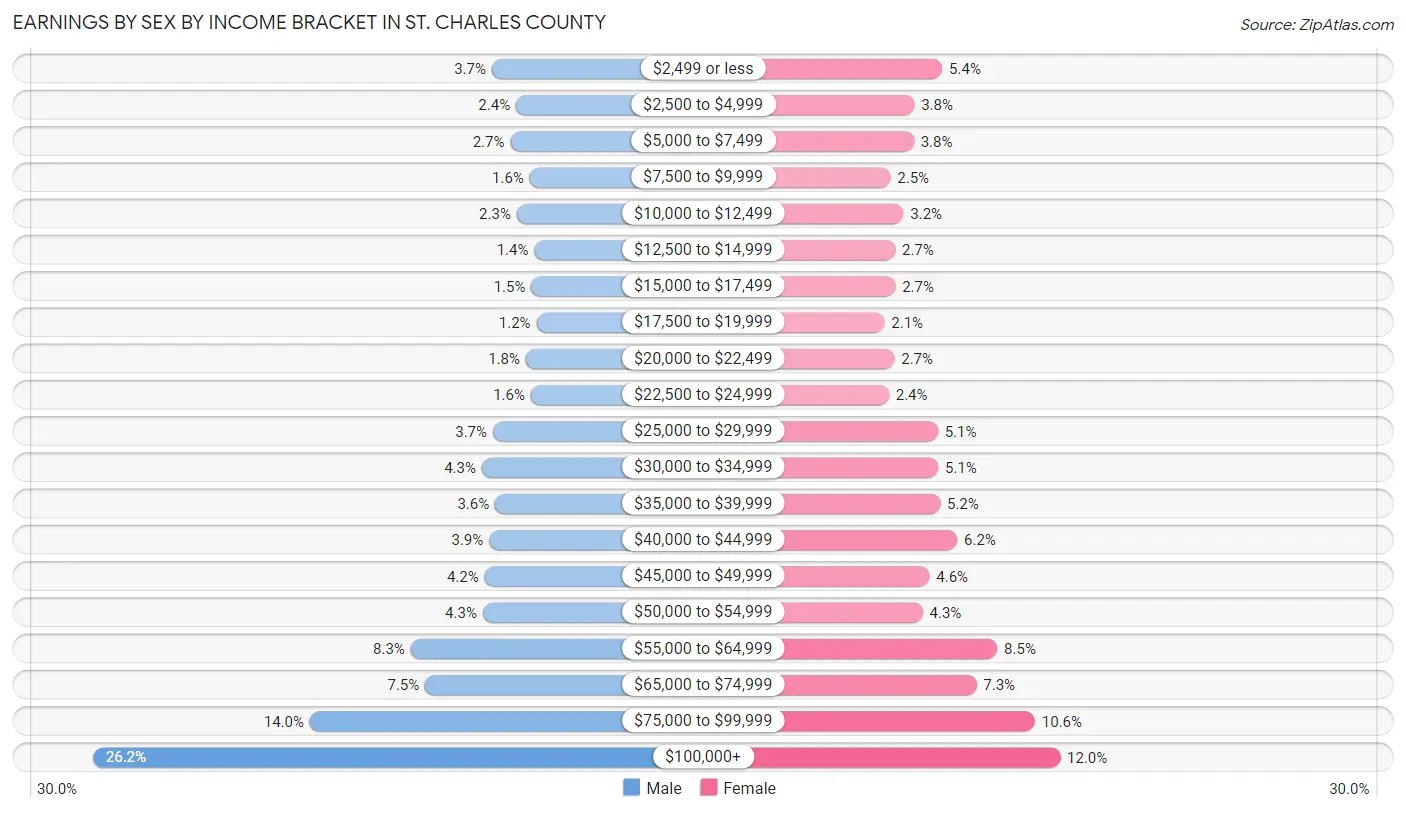
Earnings by Sex by Income Bracket in St. Charles County
The most common earnings brackets in St. Charles County are $100,000+ for men (32,082 | 26.2%) and $100,000+ for women (13,436 | 12.0%).
| Income | Male | Female |
| $2,499 or less | 4,592 (3.7%) | 6,007 (5.4%) |
| $2,500 to $4,999 | 2,916 (2.4%) | 4,250 (3.8%) |
| $5,000 to $7,499 | 3,308 (2.7%) | 4,216 (3.8%) |
| $7,500 to $9,999 | 1,970 (1.6%) | 2,749 (2.5%) |
| $10,000 to $12,499 | 2,867 (2.3%) | 3,562 (3.2%) |
| $12,500 to $14,999 | 1,659 (1.3%) | 3,038 (2.7%) |
| $15,000 to $17,499 | 1,865 (1.5%) | 3,053 (2.7%) |
| $17,500 to $19,999 | 1,509 (1.2%) | 2,364 (2.1%) |
| $20,000 to $22,499 | 2,243 (1.8%) | 2,996 (2.7%) |
| $22,500 to $24,999 | 1,898 (1.5%) | 2,646 (2.4%) |
| $25,000 to $29,999 | 4,516 (3.7%) | 5,725 (5.1%) |
| $30,000 to $34,999 | 5,279 (4.3%) | 5,746 (5.1%) |
| $35,000 to $39,999 | 4,364 (3.6%) | 5,871 (5.2%) |
| $40,000 to $44,999 | 4,772 (3.9%) | 6,941 (6.2%) |
| $45,000 to $49,999 | 5,096 (4.2%) | 5,198 (4.6%) |
| $50,000 to $54,999 | 5,213 (4.3%) | 4,773 (4.3%) |
| $55,000 to $64,999 | 10,177 (8.3%) | 9,467 (8.5%) |
| $65,000 to $74,999 | 9,188 (7.5%) | 8,157 (7.3%) |
| $75,000 to $99,999 | 17,136 (14.0%) | 11,845 (10.6%) |
| $100,000+ | 32,082 (26.2%) | 13,436 (12.0%) |
| Total | 122,650 (100.0%) | 112,040 (100.0%) |
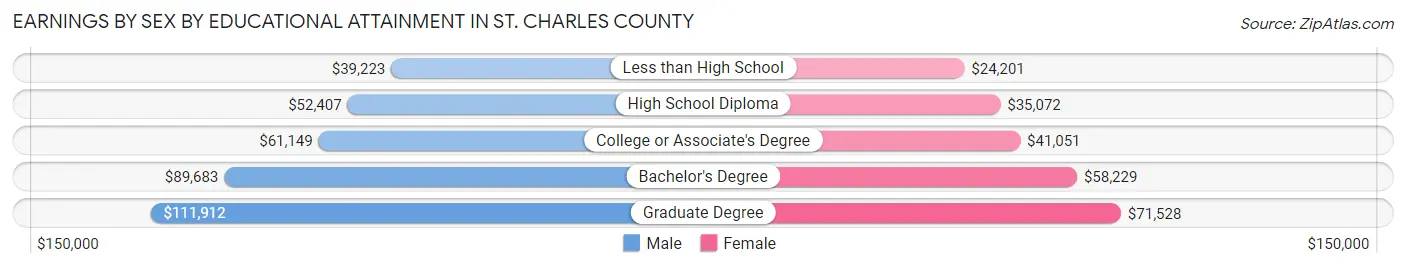
Earnings by Sex by Educational Attainment in St. Charles County
Average earnings in St. Charles County are $70,253 for men and $49,336 for women, a difference of 29.8%. Men with an educational attainment of graduate degree enjoy the highest average annual earnings of $111,912, while those with less than high school education earn the least with $39,223. Women with an educational attainment of graduate degree earn the most with the average annual earnings of $71,528, while those with less than high school education have the smallest earnings of $24,201.
| Educational Attainment | Male Income | Female Income |
| Less than High School | $39,223 | $24,201 |
| High School Diploma | $52,407 | $35,072 |
| College or Associate's Degree | $61,149 | $41,051 |
| Bachelor's Degree | $89,683 | $58,229 |
| Graduate Degree | $111,912 | $71,528 |
| Total | $70,253 | $49,336 |
Family Income in St. Charles County
Family Income Brackets in St. Charles County
According to the St. Charles County family income data, there are 28,498 families falling into the $100,000 to $149,999 income range, which is the most common income bracket and makes up 25.9% of all families. Conversely, the $10,000 to $14,999 income bracket is the least frequent group with only 660 families (0.6%) belonging to this category.
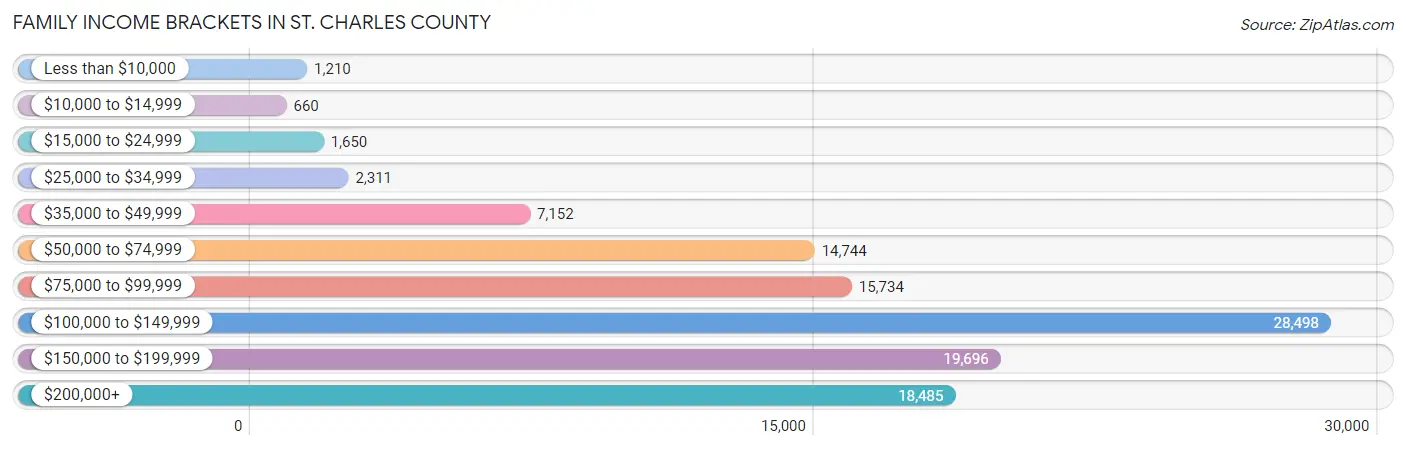
| Income Bracket | # Families | % Families |
| Less than $10,000 | 1,210 | 1.1% |
| $10,000 to $14,999 | 660 | 0.6% |
| $15,000 to $24,999 | 1,650 | 1.5% |
| $25,000 to $34,999 | 2,311 | 2.1% |
| $35,000 to $49,999 | 7,152 | 6.5% |
| $50,000 to $74,999 | 14,744 | 13.4% |
| $75,000 to $99,999 | 15,734 | 14.3% |
| $100,000 to $149,999 | 28,498 | 25.9% |
| $150,000 to $199,999 | 19,696 | 17.9% |
| $200,000+ | 18,485 | 16.8% |
Family Income by Famaliy Size in St. Charles County
5-person families (8,588 | 7.8%) account for the highest median family income in St. Charles County with $149,264 per family, while 2-person families (50,363 | 45.8%) have the highest median income of $49,061 per family member.
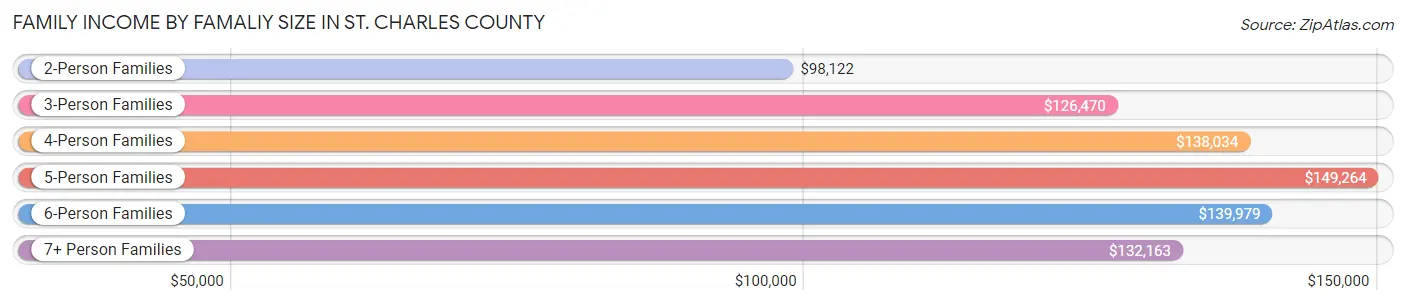
| Income Bracket | # Families | Median Income |
| 2-Person Families | 50,363 (45.8%) | $98,122 |
| 3-Person Families | 24,391 (22.2%) | $126,470 |
| 4-Person Families | 22,712 (20.6%) | $138,034 |
| 5-Person Families | 8,588 (7.8%) | $149,264 |
| 6-Person Families | 2,844 (2.6%) | $139,979 |
| 7+ Person Families | 1,133 (1.0%) | $132,163 |
| Total | 110,031 (100.0%) | $118,114 |
Family Income by Number of Earners in St. Charles County
The median family income in St. Charles County is $118,114, with families comprising 3+ earners (16,030) having the highest median family income of $163,546, while families with no earners (14,123) have the lowest median family income of $69,734, accounting for 14.6% and 12.8% of families, respectively.
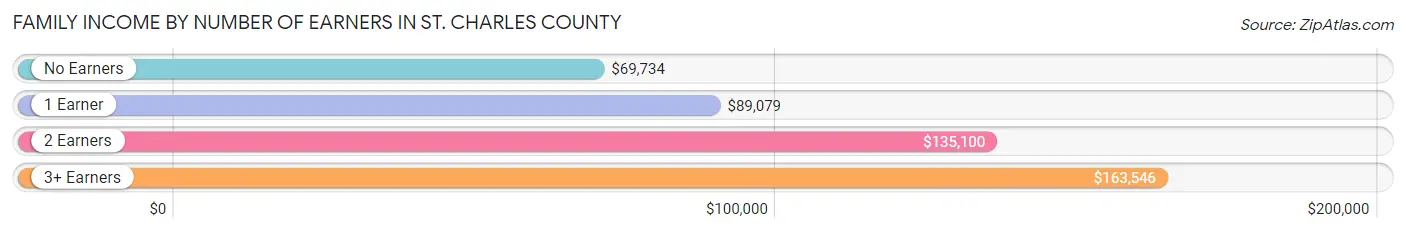
| Number of Earners | # Families | Median Income |
| No Earners | 14,123 (12.8%) | $69,734 |
| 1 Earner | 27,341 (24.8%) | $89,079 |
| 2 Earners | 52,537 (47.7%) | $135,100 |
| 3+ Earners | 16,030 (14.6%) | $163,546 |
| Total | 110,031 (100.0%) | $118,114 |
Household Income in St. Charles County
Household Income Brackets in St. Charles County
With 35,186 households falling in the category, the $100,000 to $149,999 income range is the most frequent in St. Charles County, accounting for 22.5% of all households. In contrast, only 1,877 households (1.2%) fall into the $10,000 to $14,999 income bracket, making it the least populous group.
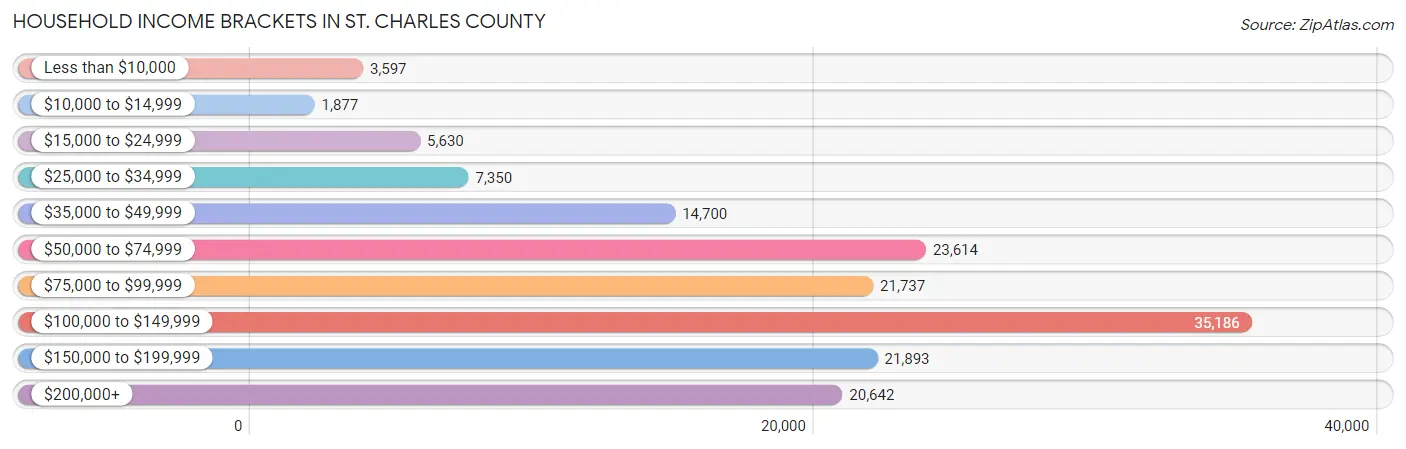
| Income Bracket | # Households | % Households |
| Less than $10,000 | 3,597 | 2.3% |
| $10,000 to $14,999 | 1,877 | 1.2% |
| $15,000 to $24,999 | 5,630 | 3.6% |
| $25,000 to $34,999 | 7,350 | 4.7% |
| $35,000 to $49,999 | 14,700 | 9.4% |
| $50,000 to $74,999 | 23,614 | 15.1% |
| $75,000 to $99,999 | 21,737 | 13.9% |
| $100,000 to $149,999 | 35,186 | 22.5% |
| $150,000 to $199,999 | 21,893 | 14.0% |
| $200,000+ | 20,642 | 13.2% |
Household Income by Householder Age in St. Charles County
The median household income in St. Charles County is $99,596, with the highest median household income of $120,943 found in the 45 to 64 years age bracket for the primary householder. A total of 58,887 households (37.7%) fall into this category. Meanwhile, the 15 to 24 years age bracket for the primary householder has the lowest median household income of $54,552, with 3,996 households (2.6%) in this group.
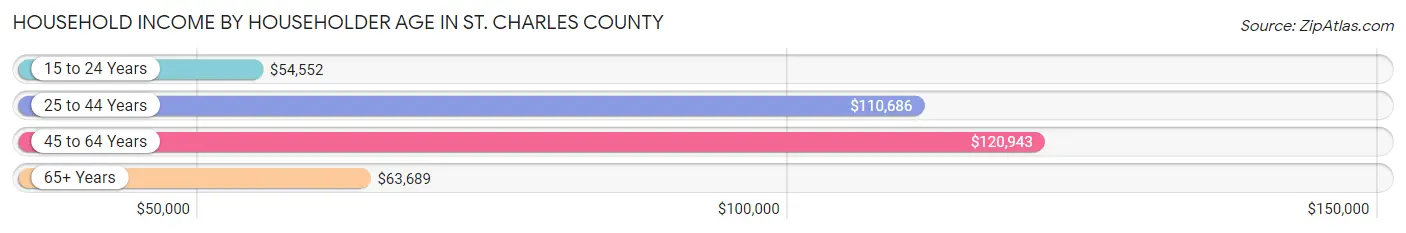
| Income Bracket | # Households | Median Income |
| 15 to 24 Years | 3,996 (2.6%) | $54,552 |
| 25 to 44 Years | 52,924 (33.8%) | $110,686 |
| 45 to 64 Years | 58,887 (37.7%) | $120,943 |
| 65+ Years | 40,574 (26.0%) | $63,689 |
| Total | 156,381 (100.0%) | $99,596 |
Poverty in St. Charles County
Income Below Poverty by Sex and Age in St. Charles County
With 3.8% poverty level for males and 5.2% for females among the residents of St. Charles County, 12 to 14 year old males and 15 year old females are the most vulnerable to poverty, with 521 males (6.3%) and 322 females (11.2%) in their respective age groups living below the poverty level.
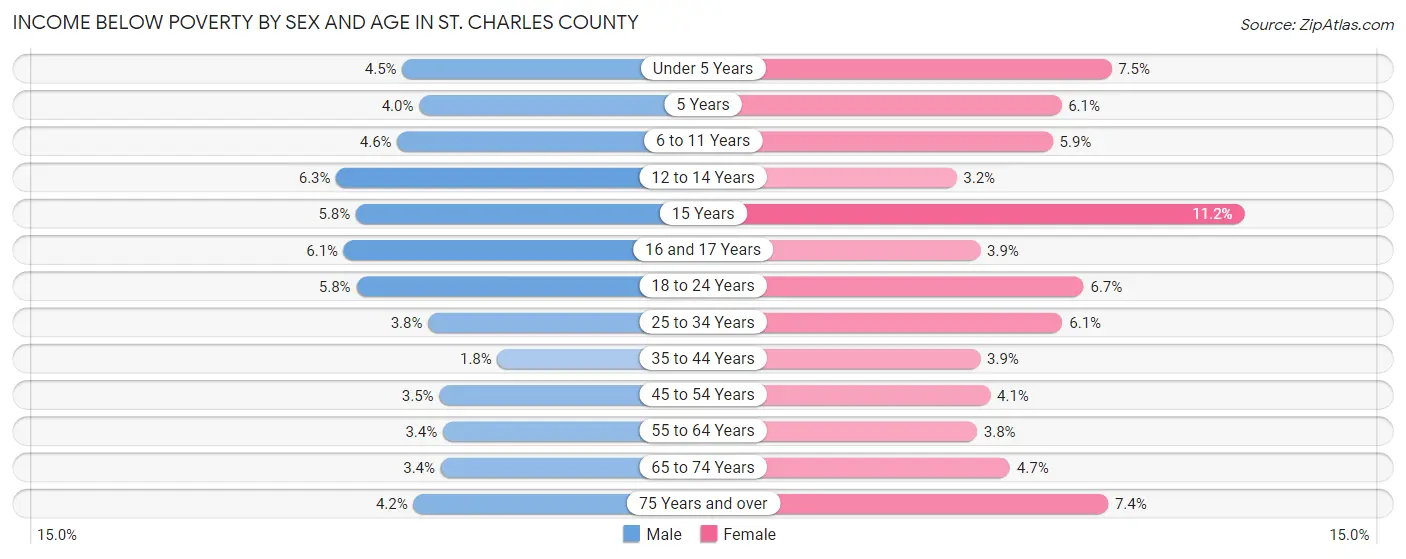
| Age Bracket | Male | Female |
| Under 5 Years | 505 (4.5%) | 825 (7.5%) |
| 5 Years | 98 (4.0%) | 175 (6.1%) |
| 6 to 11 Years | 738 (4.6%) | 884 (5.9%) |
| 12 to 14 Years | 521 (6.3%) | 244 (3.2%) |
| 15 Years | 180 (5.8%) | 322 (11.2%) |
| 16 and 17 Years | 332 (6.1%) | 207 (3.8%) |
| 18 to 24 Years | 888 (5.8%) | 978 (6.7%) |
| 25 to 34 Years | 959 (3.8%) | 1,539 (6.1%) |
| 35 to 44 Years | 524 (1.8%) | 1,069 (3.8%) |
| 45 to 54 Years | 888 (3.5%) | 1,065 (4.1%) |
| 55 to 64 Years | 909 (3.4%) | 1,052 (3.8%) |
| 65 to 74 Years | 609 (3.4%) | 961 (4.7%) |
| 75 Years and over | 445 (4.2%) | 1,109 (7.4%) |
| Total | 7,596 (3.8%) | 10,430 (5.2%) |
Income Above Poverty by Sex and Age in St. Charles County
According to the poverty statistics in St. Charles County, males aged 35 to 44 years and females aged 12 to 14 years are the age groups that are most secure financially, with 98.2% of males and 96.8% of females in these age groups living above the poverty line.
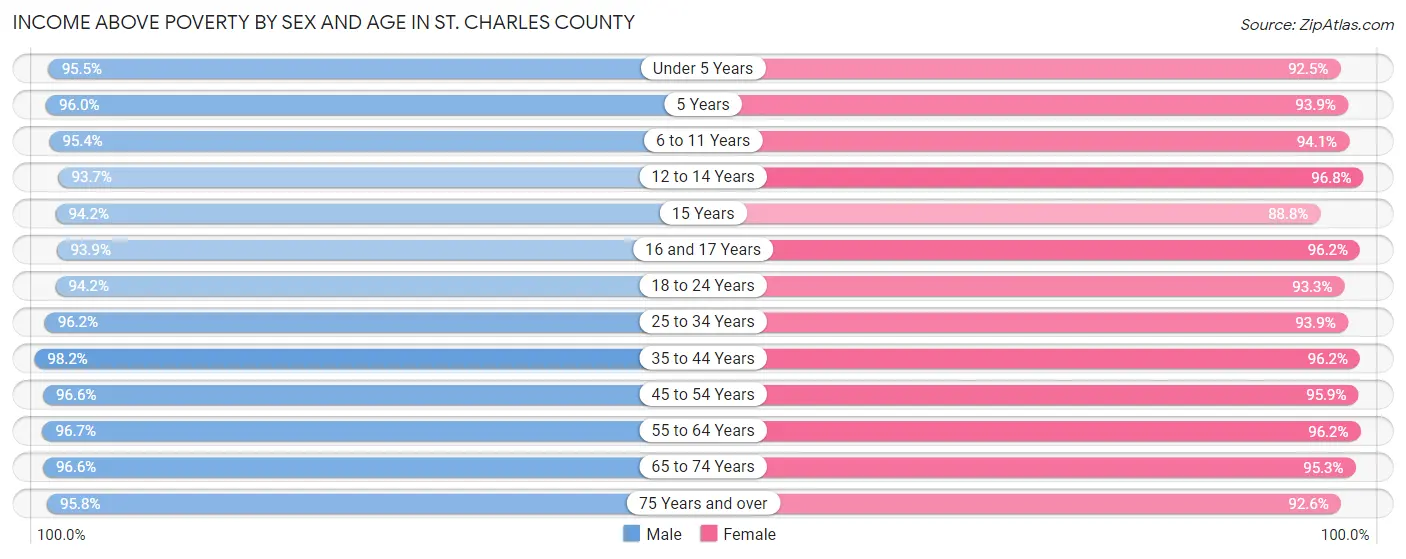
| Age Bracket | Male | Female |
| Under 5 Years | 10,773 (95.5%) | 10,180 (92.5%) |
| 5 Years | 2,346 (96.0%) | 2,687 (93.9%) |
| 6 to 11 Years | 15,246 (95.4%) | 14,177 (94.1%) |
| 12 to 14 Years | 7,728 (93.7%) | 7,397 (96.8%) |
| 15 Years | 2,942 (94.2%) | 2,550 (88.8%) |
| 16 and 17 Years | 5,105 (93.9%) | 5,174 (96.2%) |
| 18 to 24 Years | 14,537 (94.2%) | 13,549 (93.3%) |
| 25 to 34 Years | 24,567 (96.2%) | 23,530 (93.9%) |
| 35 to 44 Years | 28,063 (98.2%) | 26,733 (96.2%) |
| 45 to 54 Years | 24,880 (96.6%) | 24,751 (95.9%) |
| 55 to 64 Years | 26,251 (96.7%) | 26,903 (96.2%) |
| 65 to 74 Years | 17,264 (96.6%) | 19,553 (95.3%) |
| 75 Years and over | 10,236 (95.8%) | 13,851 (92.6%) |
| Total | 189,938 (96.2%) | 191,035 (94.8%) |
Income Below Poverty Among Married-Couple Families in St. Charles County
The poverty statistics for married-couple families in St. Charles County show that 1.7% or 1,577 of the total 90,814 families live below the poverty line. Families with 3 or 4 children have the highest poverty rate of 2.9%, comprising of 219 families. On the other hand, families with 5 or more children have the lowest poverty rate of 1.2%, which includes 4 families.
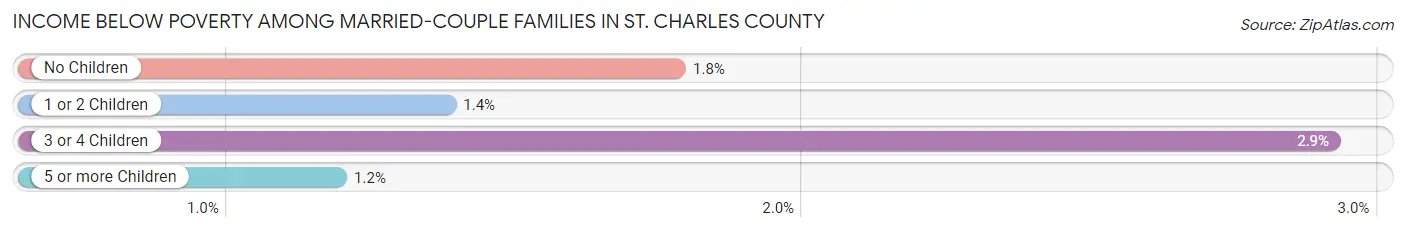
| Children | Above Poverty | Below Poverty |
| No Children | 51,705 (98.2%) | 936 (1.8%) |
| 1 or 2 Children | 29,928 (98.6%) | 418 (1.4%) |
| 3 or 4 Children | 7,271 (97.1%) | 219 (2.9%) |
| 5 or more Children | 333 (98.8%) | 4 (1.2%) |
| Total | 89,237 (98.3%) | 1,577 (1.7%) |
Income Below Poverty Among Single-Parent Households in St. Charles County
According to the poverty data in St. Charles County, 5.2% or 319 single-father households and 10.2% or 1,323 single-mother households are living below the poverty line. Among single-father households, those with 1 or 2 children have the highest poverty rate, with 256 households (7.7%) experiencing poverty. Likewise, among single-mother households, those with 5 or more children have the highest poverty rate, with 146 households (82.5%) falling below the poverty line.
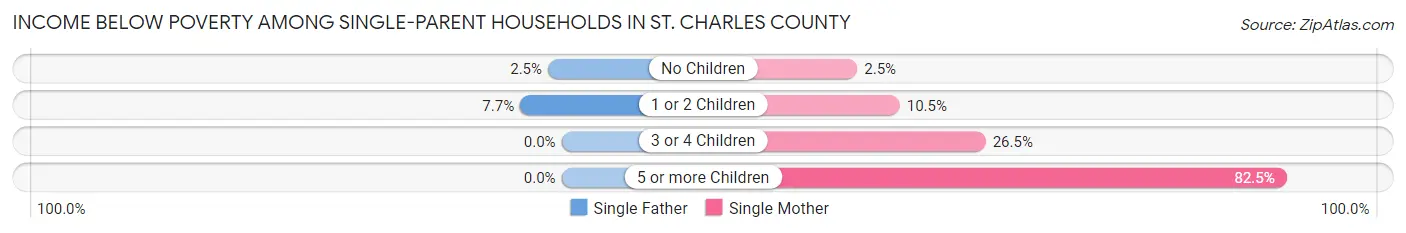
| Children | Single Father | Single Mother |
| No Children | 63 (2.5%) | 123 (2.5%) |
| 1 or 2 Children | 256 (7.7%) | 695 (10.4%) |
| 3 or 4 Children | 0 (0.0%) | 359 (26.5%) |
| 5 or more Children | 0 (0.0%) | 146 (82.5%) |
| Total | 319 (5.2%) | 1,323 (10.2%) |
Income Below Poverty Among Married-Couple vs Single-Parent Households in St. Charles County
The poverty data for St. Charles County shows that 1,577 of the married-couple family households (1.7%) and 1,642 of the single-parent households (8.5%) are living below the poverty level. Within the married-couple family households, those with 3 or 4 children have the highest poverty rate, with 219 households (2.9%) falling below the poverty line. Among the single-parent households, those with 5 or more children have the highest poverty rate, with 146 household (80.7%) living below poverty.
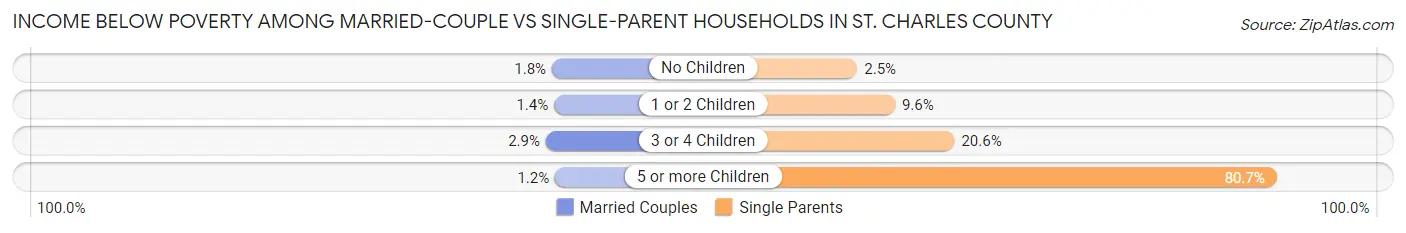
| Children | Married-Couple Families | Single-Parent Households |
| No Children | 936 (1.8%) | 186 (2.5%) |
| 1 or 2 Children | 418 (1.4%) | 951 (9.6%) |
| 3 or 4 Children | 219 (2.9%) | 359 (20.6%) |
| 5 or more Children | 4 (1.2%) | 146 (80.7%) |
| Total | 1,577 (1.7%) | 1,642 (8.5%) |
Race in St. Charles County
The most populous races in St. Charles County are White / Caucasian (351,477 | 86.5%), Black / African American (20,467 | 5.0%), and Two or more Races (18,580 | 4.6%).
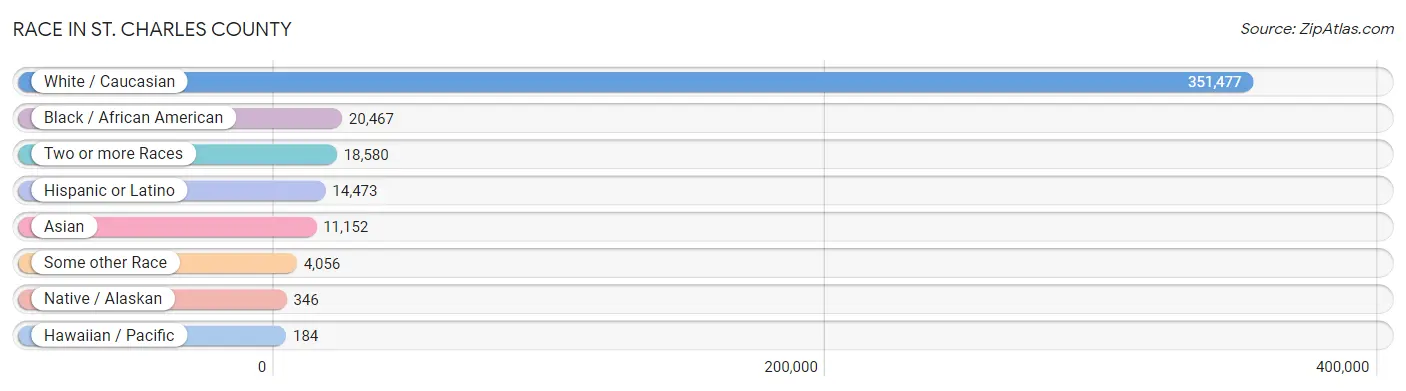
| Race | # Population | % Population |
| Asian | 11,152 | 2.8% |
| Black / African American | 20,467 | 5.0% |
| Hawaiian / Pacific | 184 | 0.1% |
| Hispanic or Latino | 14,473 | 3.6% |
| Native / Alaskan | 346 | 0.1% |
| White / Caucasian | 351,477 | 86.5% |
| Two or more Races | 18,580 | 4.6% |
| Some other Race | 4,056 | 1.0% |
| Total | 406,262 | 100.0% |
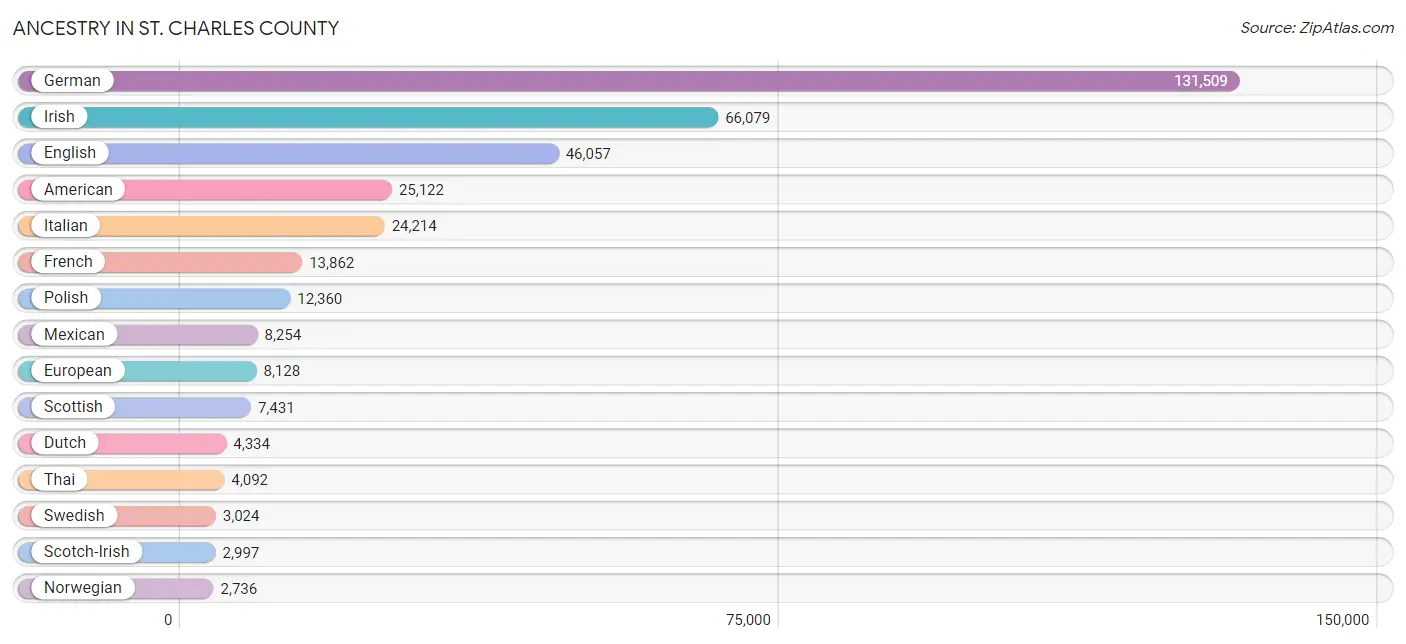
Ancestry in St. Charles County
The most populous ancestries reported in St. Charles County are German (131,509 | 32.4%), Irish (66,079 | 16.3%), English (46,057 | 11.3%), American (25,122 | 6.2%), and Italian (24,214 | 6.0%), together accounting for 72.1% of all St. Charles County residents.
| Ancestry | # Population | % Population |
| Afghan | 12 | 0.0% |
| African | 879 | 0.2% |
| Albanian | 32 | 0.0% |
| Aleut | 5 | 0.0% |
| Alsatian | 19 | 0.0% |
| American | 25,122 | 6.2% |
| Apache | 46 | 0.0% |
| Arab | 1,446 | 0.4% |
| Argentinean | 139 | 0.0% |
| Armenian | 198 | 0.1% |
| Australian | 98 | 0.0% |
| Austrian | 960 | 0.2% |
| Bangladeshi | 24 | 0.0% |
| Belgian | 450 | 0.1% |
| Bhutanese | 830 | 0.2% |
| Blackfeet | 136 | 0.0% |
| Bolivian | 49 | 0.0% |
| Brazilian | 282 | 0.1% |
| British | 2,299 | 0.6% |
| British West Indian | 131 | 0.0% |
| Bulgarian | 104 | 0.0% |
| Burmese | 1,773 | 0.4% |
| Cajun | 66 | 0.0% |
| Canadian | 409 | 0.1% |
| Central American | 1,375 | 0.3% |
| Central American Indian | 64 | 0.0% |
| Cherokee | 1,246 | 0.3% |
| Cheyenne | 25 | 0.0% |
| Chickasaw | 14 | 0.0% |
| Chilean | 50 | 0.0% |
| Chippewa | 4 | 0.0% |
| Choctaw | 158 | 0.0% |
| Colombian | 564 | 0.1% |
| Costa Rican | 171 | 0.0% |
| Creek | 37 | 0.0% |
| Croatian | 860 | 0.2% |
| Crow | 8 | 0.0% |
| Cuban | 434 | 0.1% |
| Czech | 1,645 | 0.4% |
| Czechoslovakian | 468 | 0.1% |
| Danish | 1,101 | 0.3% |
| Dominican | 232 | 0.1% |
| Dutch | 4,334 | 1.1% |
| Eastern European | 726 | 0.2% |
| Ecuadorian | 62 | 0.0% |
| Egyptian | 420 | 0.1% |
| English | 46,057 | 11.3% |
| Estonian | 14 | 0.0% |
| Ethiopian | 191 | 0.1% |
| European | 8,128 | 2.0% |
| Filipino | 118 | 0.0% |
| Finnish | 350 | 0.1% |
| French | 13,862 | 3.4% |
| French American Indian | 29 | 0.0% |
| French Canadian | 1,187 | 0.3% |
| German | 131,509 | 32.4% |
| German Russian | 2 | 0.0% |
| Greek | 932 | 0.2% |
| Guatemalan | 631 | 0.2% |
| Haitian | 68 | 0.0% |
| Honduran | 223 | 0.1% |
| Hungarian | 1,321 | 0.3% |
| Indian (Asian) | 2,169 | 0.5% |
| Inupiat | 20 | 0.0% |
| Iranian | 453 | 0.1% |
| Irish | 66,079 | 16.3% |
| Israeli | 130 | 0.0% |
| Italian | 24,214 | 6.0% |
| Jamaican | 174 | 0.0% |
| Japanese | 43 | 0.0% |
| Jordanian | 9 | 0.0% |
| Kenyan | 62 | 0.0% |
| Korean | 2,230 | 0.5% |
| Laotian | 28 | 0.0% |
| Latvian | 85 | 0.0% |
| Lebanese | 453 | 0.1% |
| Lithuanian | 856 | 0.2% |
| Lumbee | 3 | 0.0% |
| Luxembourger | 124 | 0.0% |
| Macedonian | 58 | 0.0% |
| Malaysian | 51 | 0.0% |
| Maltese | 52 | 0.0% |
| Mexican | 8,254 | 2.0% |
| Mexican American Indian | 98 | 0.0% |
| Mongolian | 1 | 0.0% |
| Moroccan | 7 | 0.0% |
| Native Hawaiian | 83 | 0.0% |
| Navajo | 52 | 0.0% |
| New Zealander | 82 | 0.0% |
| Nicaraguan | 33 | 0.0% |
| Nigerian | 441 | 0.1% |
| Northern European | 667 | 0.2% |
| Norwegian | 2,736 | 0.7% |
| Okinawan | 8 | 0.0% |
| Osage | 13 | 0.0% |
| Pakistani | 376 | 0.1% |
| Palestinian | 359 | 0.1% |
| Panamanian | 270 | 0.1% |
| Pennsylvania German | 130 | 0.0% |
| Peruvian | 399 | 0.1% |
| Polish | 12,360 | 3.0% |
| Portuguese | 398 | 0.1% |
| Potawatomi | 2 | 0.0% |
| Puerto Rican | 1,251 | 0.3% |
| Romanian | 209 | 0.1% |
| Russian | 1,338 | 0.3% |
| Salvadoran | 47 | 0.0% |
| Samoan | 141 | 0.0% |
| Scandinavian | 1,276 | 0.3% |
| Scotch-Irish | 2,997 | 0.7% |
| Scottish | 7,431 | 1.8% |
| Serbian | 79 | 0.0% |
| Sioux | 44 | 0.0% |
| Slavic | 78 | 0.0% |
| Slovak | 315 | 0.1% |
| Slovene | 118 | 0.0% |
| Somali | 10 | 0.0% |
| South African | 45 | 0.0% |
| South American | 1,480 | 0.4% |
| South American Indian | 2 | 0.0% |
| Spaniard | 327 | 0.1% |
| Spanish | 672 | 0.2% |
| Sri Lankan | 1,799 | 0.4% |
| Subsaharan African | 1,756 | 0.4% |
| Sudanese | 22 | 0.0% |
| Swedish | 3,024 | 0.7% |
| Swiss | 1,101 | 0.3% |
| Syrian | 17 | 0.0% |
| Thai | 4,092 | 1.0% |
| Tohono O'Odham | 32 | 0.0% |
| Trinidadian and Tobagonian | 34 | 0.0% |
| Turkish | 139 | 0.0% |
| Ugandan | 42 | 0.0% |
| Ukrainian | 835 | 0.2% |
| Ute | 94 | 0.0% |
| Venezuelan | 200 | 0.1% |
| Vietnamese | 75 | 0.0% |
| Welsh | 1,927 | 0.5% |
| West Indian | 2 | 0.0% |
| Yugoslavian | 171 | 0.0% | View All 140 Rows |
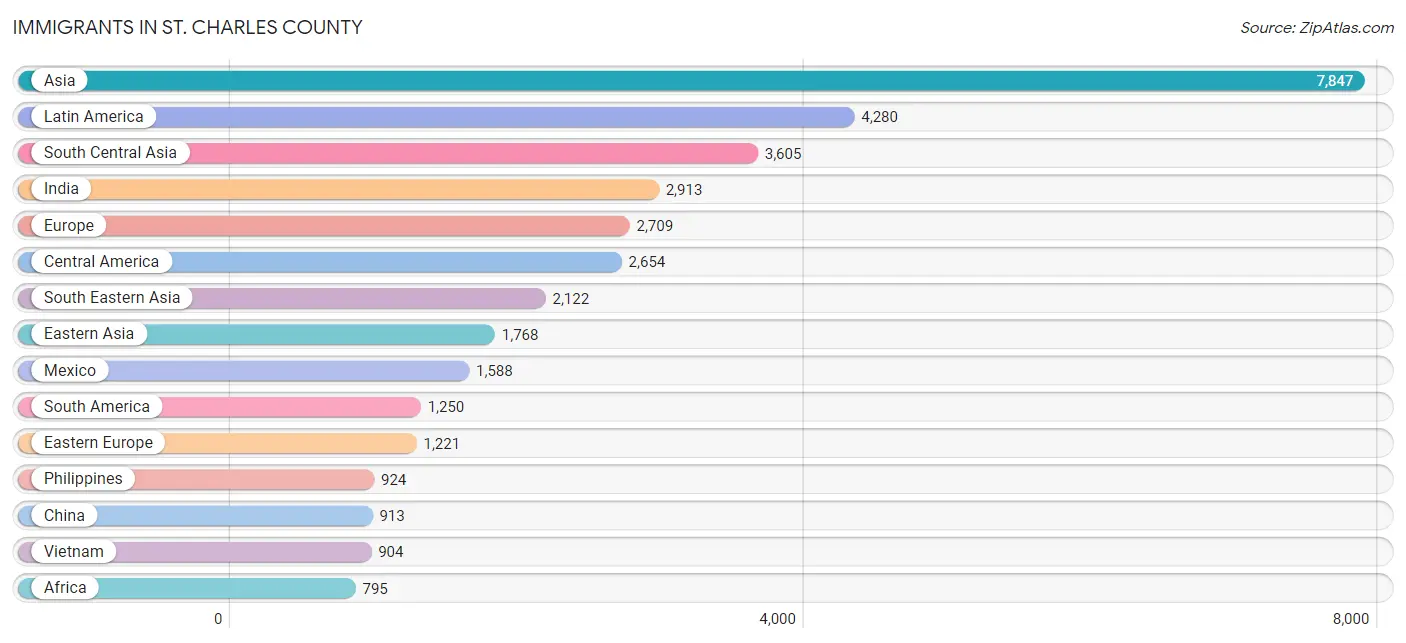
Immigrants in St. Charles County
The most numerous immigrant groups reported in St. Charles County came from Asia (7,847 | 1.9%), Latin America (4,280 | 1.1%), South Central Asia (3,605 | 0.9%), India (2,913 | 0.7%), and Europe (2,709 | 0.7%), together accounting for 5.3% of all St. Charles County residents.
| Immigration Origin | # Population | % Population |
| Afghanistan | 8 | 0.0% |
| Africa | 795 | 0.2% |
| Albania | 21 | 0.0% |
| Argentina | 77 | 0.0% |
| Armenia | 26 | 0.0% |
| Asia | 7,847 | 1.9% |
| Australia | 110 | 0.0% |
| Austria | 36 | 0.0% |
| Bahamas | 15 | 0.0% |
| Bangladesh | 33 | 0.0% |
| Belarus | 210 | 0.1% |
| Belgium | 66 | 0.0% |
| Bolivia | 29 | 0.0% |
| Bosnia and Herzegovina | 78 | 0.0% |
| Brazil | 230 | 0.1% |
| Bulgaria | 51 | 0.0% |
| Cameroon | 4 | 0.0% |
| Canada | 401 | 0.1% |
| Caribbean | 376 | 0.1% |
| Central America | 2,654 | 0.6% |
| Chile | 78 | 0.0% |
| China | 913 | 0.2% |
| Colombia | 239 | 0.1% |
| Congo | 24 | 0.0% |
| Costa Rica | 145 | 0.0% |
| Croatia | 16 | 0.0% |
| Cuba | 80 | 0.0% |
| Czechoslovakia | 5 | 0.0% |
| Denmark | 35 | 0.0% |
| Dominican Republic | 133 | 0.0% |
| Eastern Africa | 202 | 0.1% |
| Eastern Asia | 1,768 | 0.4% |
| Eastern Europe | 1,221 | 0.3% |
| Ecuador | 251 | 0.1% |
| Egypt | 27 | 0.0% |
| El Salvador | 39 | 0.0% |
| England | 195 | 0.1% |
| Ethiopia | 113 | 0.0% |
| Europe | 2,709 | 0.7% |
| France | 16 | 0.0% |
| Germany | 528 | 0.1% |
| Ghana | 16 | 0.0% |
| Greece | 32 | 0.0% |
| Guatemala | 510 | 0.1% |
| Haiti | 59 | 0.0% |
| Honduras | 164 | 0.0% |
| Hong Kong | 69 | 0.0% |
| Hungary | 15 | 0.0% |
| India | 2,913 | 0.7% |
| Indonesia | 28 | 0.0% |
| Iran | 138 | 0.0% |
| Ireland | 15 | 0.0% |
| Israel | 101 | 0.0% |
| Italy | 56 | 0.0% |
| Jamaica | 34 | 0.0% |
| Japan | 178 | 0.0% |
| Jordan | 30 | 0.0% |
| Kazakhstan | 2 | 0.0% |
| Kenya | 43 | 0.0% |
| Korea | 657 | 0.2% |
| Kuwait | 17 | 0.0% |
| Laos | 16 | 0.0% |
| Latin America | 4,280 | 1.1% |
| Lebanon | 23 | 0.0% |
| Malaysia | 2 | 0.0% |
| Mexico | 1,588 | 0.4% |
| Middle Africa | 44 | 0.0% |
| Morocco | 19 | 0.0% |
| Nepal | 38 | 0.0% |
| Netherlands | 22 | 0.0% |
| Nigeria | 394 | 0.1% |
| Northern Africa | 68 | 0.0% |
| Northern Europe | 651 | 0.2% |
| Norway | 23 | 0.0% |
| Oceania | 174 | 0.0% |
| Pakistan | 410 | 0.1% |
| Panama | 208 | 0.1% |
| Peru | 190 | 0.1% |
| Philippines | 924 | 0.2% |
| Poland | 115 | 0.0% |
| Romania | 40 | 0.0% |
| Russia | 243 | 0.1% |
| Scotland | 45 | 0.0% |
| Serbia | 17 | 0.0% |
| Singapore | 8 | 0.0% |
| South Africa | 20 | 0.0% |
| South America | 1,250 | 0.3% |
| South Central Asia | 3,605 | 0.9% |
| South Eastern Asia | 2,122 | 0.5% |
| Southern Europe | 158 | 0.0% |
| Spain | 52 | 0.0% |
| St. Vincent and the Grenadines | 10 | 0.0% |
| Sudan | 22 | 0.0% |
| Sweden | 54 | 0.0% |
| Switzerland | 11 | 0.0% |
| Syria | 8 | 0.0% |
| Taiwan | 95 | 0.0% |
| Thailand | 240 | 0.1% |
| Trinidad and Tobago | 17 | 0.0% |
| Turkey | 85 | 0.0% |
| Uganda | 37 | 0.0% |
| Ukraine | 340 | 0.1% |
| Venezuela | 156 | 0.0% |
| Vietnam | 904 | 0.2% |
| Western Africa | 411 | 0.1% |
| Western Asia | 313 | 0.1% |
| Western Europe | 679 | 0.2% |
| Zaire | 16 | 0.0% | View All 108 Rows |
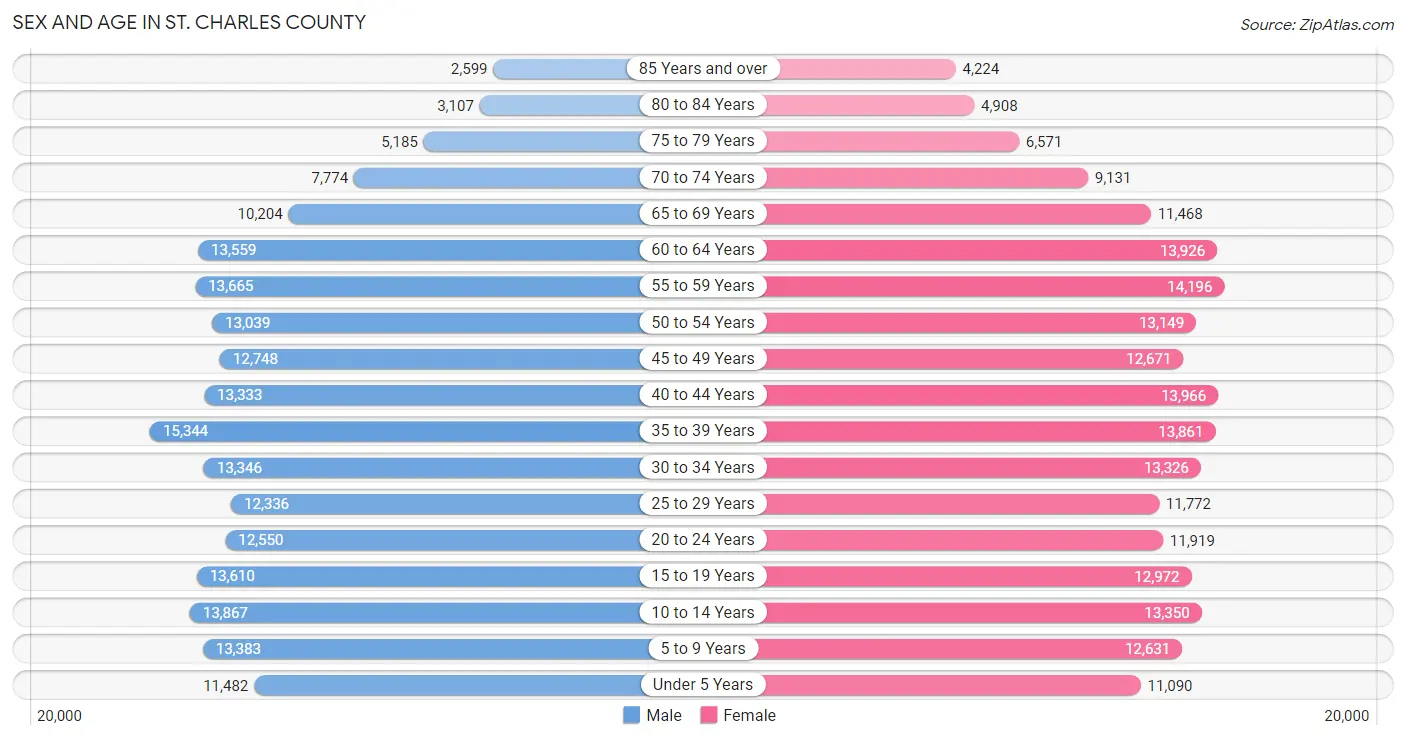
Sex and Age in St. Charles County
Sex and Age in St. Charles County
The most populous age groups in St. Charles County are 35 to 39 Years (15,344 | 7.6%) for men and 55 to 59 Years (14,196 | 6.9%) for women.
| Age Bracket | Male | Female |
| Under 5 Years | 11,482 (5.7%) | 11,090 (5.4%) |
| 5 to 9 Years | 13,383 (6.7%) | 12,631 (6.2%) |
| 10 to 14 Years | 13,867 (6.9%) | 13,350 (6.5%) |
| 15 to 19 Years | 13,610 (6.8%) | 12,972 (6.3%) |
| 20 to 24 Years | 12,550 (6.2%) | 11,919 (5.8%) |
| 25 to 29 Years | 12,336 (6.1%) | 11,772 (5.7%) |
| 30 to 34 Years | 13,346 (6.6%) | 13,326 (6.5%) |
| 35 to 39 Years | 15,344 (7.6%) | 13,861 (6.8%) |
| 40 to 44 Years | 13,333 (6.6%) | 13,966 (6.8%) |
| 45 to 49 Years | 12,748 (6.3%) | 12,671 (6.2%) |
| 50 to 54 Years | 13,039 (6.5%) | 13,149 (6.4%) |
| 55 to 59 Years | 13,665 (6.8%) | 14,196 (6.9%) |
| 60 to 64 Years | 13,559 (6.7%) | 13,926 (6.8%) |
| 65 to 69 Years | 10,204 (5.1%) | 11,468 (5.6%) |
| 70 to 74 Years | 7,774 (3.9%) | 9,131 (4.4%) |
| 75 to 79 Years | 5,185 (2.6%) | 6,571 (3.2%) |
| 80 to 84 Years | 3,107 (1.5%) | 4,908 (2.4%) |
| 85 Years and over | 2,599 (1.3%) | 4,224 (2.1%) |
| Total | 201,131 (100.0%) | 205,131 (100.0%) |
Families and Households in St. Charles County
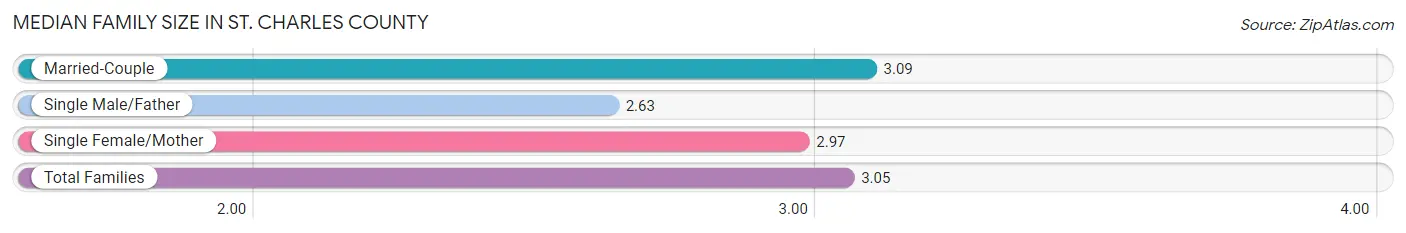
Median Family Size in St. Charles County
The median family size in St. Charles County is 3.05 persons per family, with married-couple families (90,814 | 82.5%) accounting for the largest median family size of 3.09 persons per family. On the other hand, single male/father families (6,188 | 5.6%) represent the smallest median family size with 2.63 persons per family.
| Family Type | # Families | Family Size |
| Married-Couple | 90,814 (82.5%) | 3.09 |
| Single Male/Father | 6,188 (5.6%) | 2.63 |
| Single Female/Mother | 13,029 (11.8%) | 2.97 |
| Total Families | 110,031 (100.0%) | 3.05 |
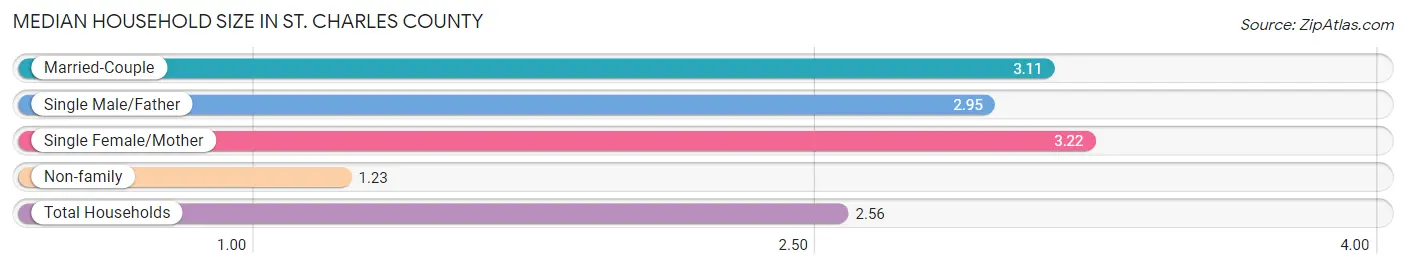
Median Household Size in St. Charles County
The median household size in St. Charles County is 2.56 persons per household, with single female/mother households (13,029 | 8.3%) accounting for the largest median household size of 3.22 persons per household. non-family households (46,350 | 29.6%) represent the smallest median household size with 1.23 persons per household.
| Household Type | # Households | Household Size |
| Married-Couple | 90,814 (58.1%) | 3.11 |
| Single Male/Father | 6,188 (4.0%) | 2.95 |
| Single Female/Mother | 13,029 (8.3%) | 3.22 |
| Non-family | 46,350 (29.6%) | 1.23 |
| Total Households | 156,381 (100.0%) | 2.56 |
Household Size by Marriage Status in St. Charles County
Out of a total of 156,381 households in St. Charles County, 110,031 (70.4%) are family households, while 46,350 (29.6%) are nonfamily households. The most numerous type of family households are 2-person households, comprising 48,122, and the most common type of nonfamily households are 1-person households, comprising 37,375.
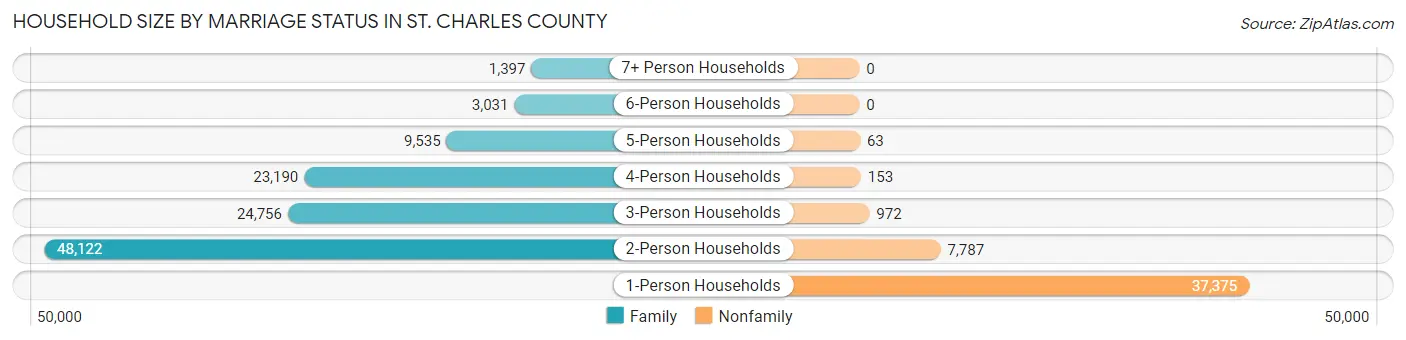
| Household Size | Family Households | Nonfamily Households |
| 1-Person Households | - | 37,375 (23.9%) |
| 2-Person Households | 48,122 (30.8%) | 7,787 (5.0%) |
| 3-Person Households | 24,756 (15.8%) | 972 (0.6%) |
| 4-Person Households | 23,190 (14.8%) | 153 (0.1%) |
| 5-Person Households | 9,535 (6.1%) | 63 (0.0%) |
| 6-Person Households | 3,031 (1.9%) | 0 (0.0%) |
| 7+ Person Households | 1,397 (0.9%) | 0 (0.0%) |
| Total | 110,031 (70.4%) | 46,350 (29.6%) |
Female Fertility in St. Charles County
Fertility by Age in St. Charles County
Average fertility rate in St. Charles County is 50.0 births per 1,000 women. Women in the age bracket of 20 to 34 years have the highest fertility rate with 80.0 births per 1,000 women. Women in the age bracket of 20 to 34 years acount for 63.6% of all women with births.
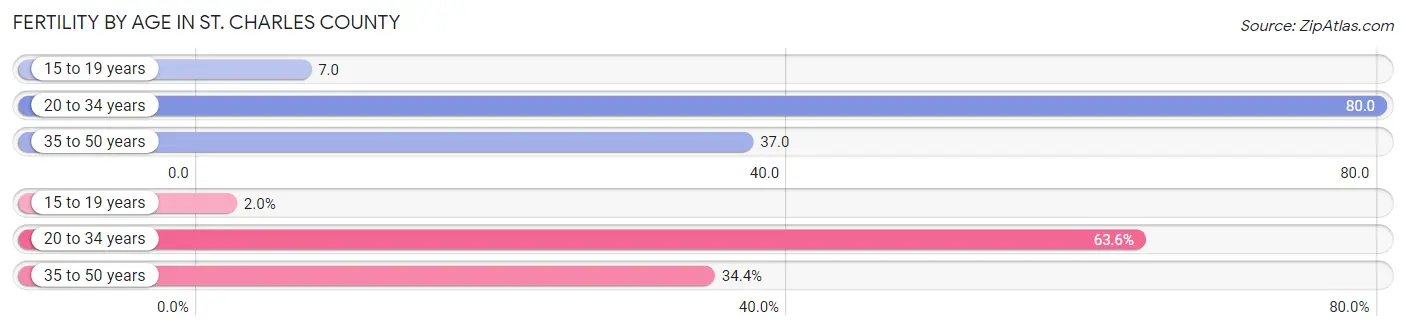
| Age Bracket | Women with Births | Births / 1,000 Women |
| 15 to 19 years | 91 (2.0%) | 7.0 |
| 20 to 34 years | 2,958 (63.6%) | 80.0 |
| 35 to 50 years | 1,599 (34.4%) | 37.0 |
| Total | 4,648 (100.0%) | 50.0 |
Fertility by Age by Marriage Status in St. Charles County
79.6% of women with births (4,648) in St. Charles County are married. The highest percentage of unmarried women with births falls into 15 to 19 years age bracket with 100.0% of them unmarried at the time of birth, while the lowest percentage of unmarried women with births belong to 35 to 50 years age bracket with 14.6% of them unmarried.
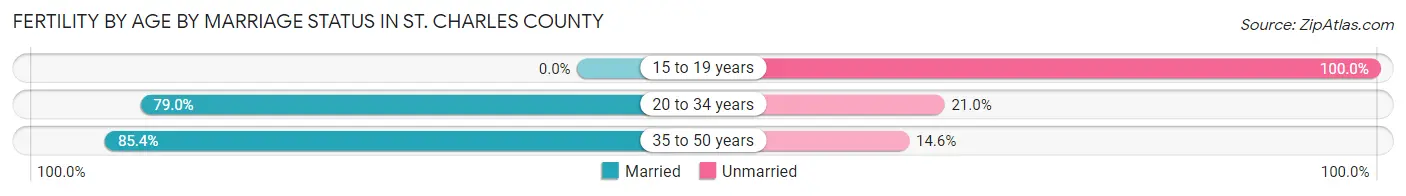
| Age Bracket | Married | Unmarried |
| 15 to 19 years | 0 (0.0%) | 91 (100.0%) |
| 20 to 34 years | 2,337 (79.0%) | 621 (21.0%) |
| 35 to 50 years | 1,366 (85.4%) | 233 (14.6%) |
| Total | 3,700 (79.6%) | 948 (20.4%) |
Fertility by Education in St. Charles County
Average fertility rate in St. Charles County is 50.0 births per 1,000 women. Women with the education attainment of graduate degree have the highest fertility rate of 68.0 births per 1,000 women, while women with the education attainment of less than high school have the lowest fertility at 13.0 births per 1,000 women. Women with the education attainment of bachelor's degree represent 32.5% of all women with births.
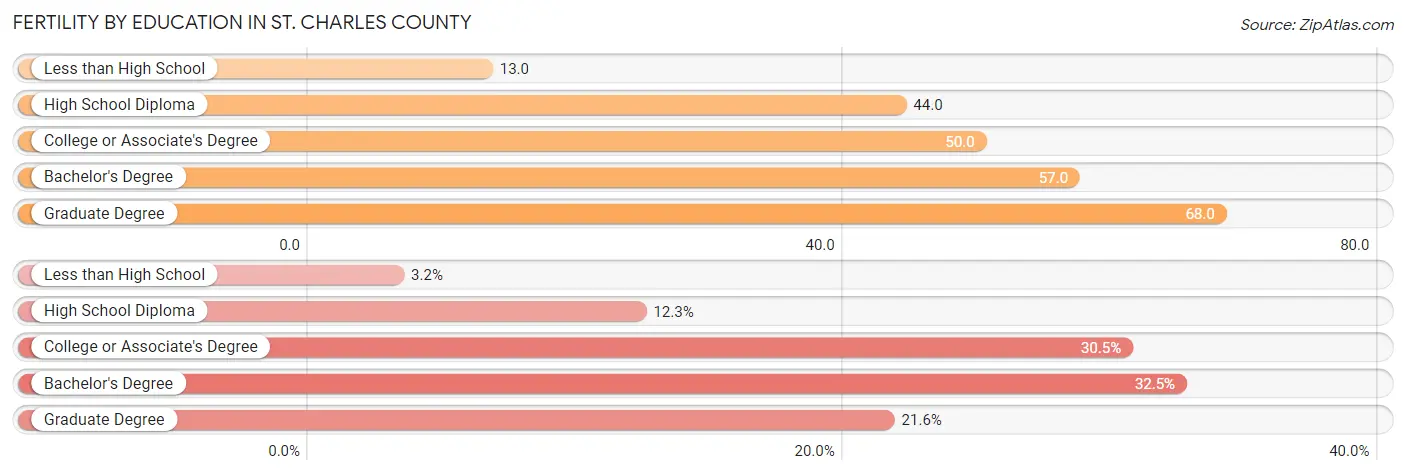
| Educational Attainment | Women with Births | Births / 1,000 Women |
| Less than High School | 148 (3.2%) | 13.0 |
| High School Diploma | 570 (12.3%) | 44.0 |
| College or Associate's Degree | 1,417 (30.5%) | 50.0 |
| Bachelor's Degree | 1,511 (32.5%) | 57.0 |
| Graduate Degree | 1,002 (21.6%) | 68.0 |
| Total | 4,648 (100.0%) | 50.0 |
Fertility by Education by Marriage Status in St. Charles County
20.4% of women with births in St. Charles County are unmarried. Women with the educational attainment of bachelor's degree are most likely to be married with 95.1% of them married at childbirth, while women with the educational attainment of less than high school are least likely to be married with 71.6% of them unmarried at childbirth.
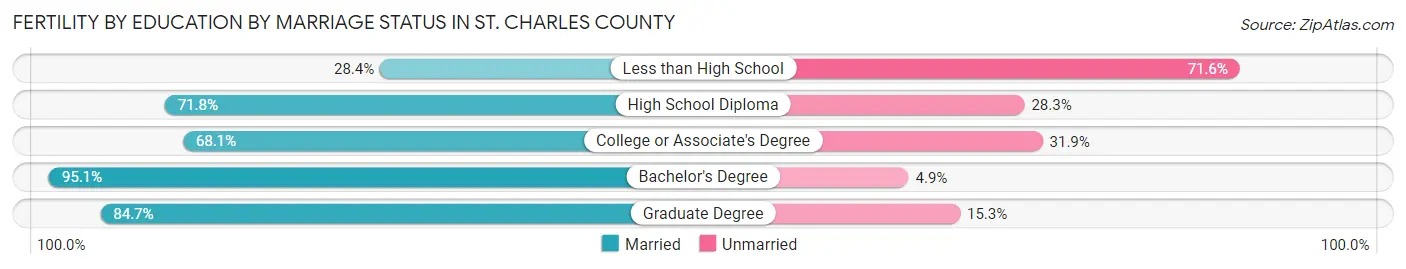
| Educational Attainment | Married | Unmarried |
| Less than High School | 42 (28.4%) | 106 (71.6%) |
| High School Diploma | 409 (71.8%) | 161 (28.2%) |
| College or Associate's Degree | 965 (68.1%) | 452 (31.9%) |
| Bachelor's Degree | 1,437 (95.1%) | 74 (4.9%) |
| Graduate Degree | 849 (84.7%) | 153 (15.3%) |
| Total | 3,700 (79.6%) | 948 (20.4%) |
Employment Characteristics in St. Charles County
Employment by Class of Employer in St. Charles County
Among the 215,074 employed individuals in St. Charles County, private company employees (158,246 | 73.6%), not-for-profit organizations (18,896 | 8.8%), and local government employees (15,268 | 7.1%) make up the most common classes of employment.
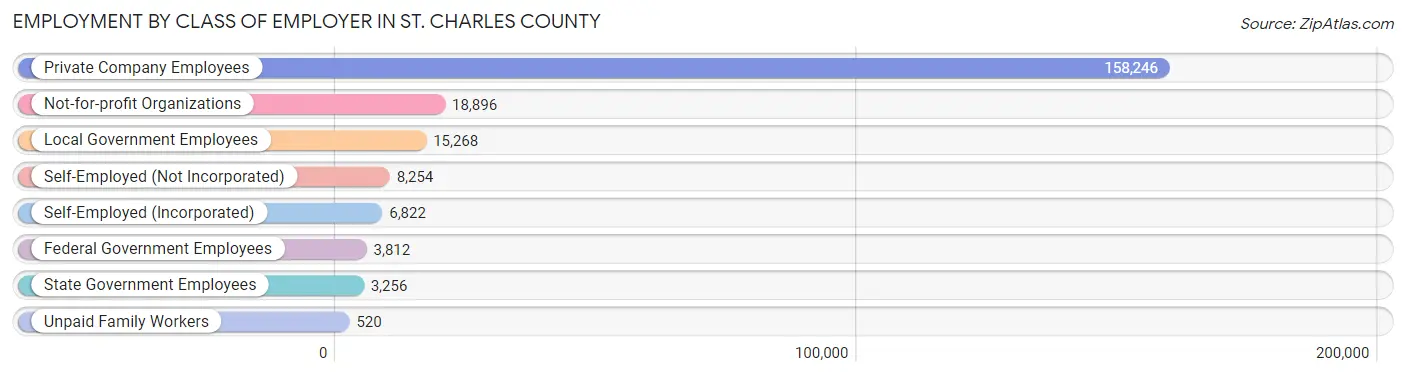
| Employer Class | # Employees | % Employees |
| Private Company Employees | 158,246 | 73.6% |
| Self-Employed (Incorporated) | 6,822 | 3.2% |
| Self-Employed (Not Incorporated) | 8,254 | 3.8% |
| Not-for-profit Organizations | 18,896 | 8.8% |
| Local Government Employees | 15,268 | 7.1% |
| State Government Employees | 3,256 | 1.5% |
| Federal Government Employees | 3,812 | 1.8% |
| Unpaid Family Workers | 520 | 0.2% |
| Total | 215,074 | 100.0% |
Employment Status by Age in St. Charles County
According to the labor force statistics for St. Charles County, out of the total population over 16 years of age (324,459), 69.4% or 225,175 individuals are in the labor force, with 3.1% or 6,980 of them unemployed. The age group with the highest labor force participation rate is 25 to 29 years, with 92.5% or 22,300 individuals in the labor force. Within the labor force, the 16 to 19 years age range has the highest percentage of unemployed individuals, with 7.8% or 822 of them being unemployed.
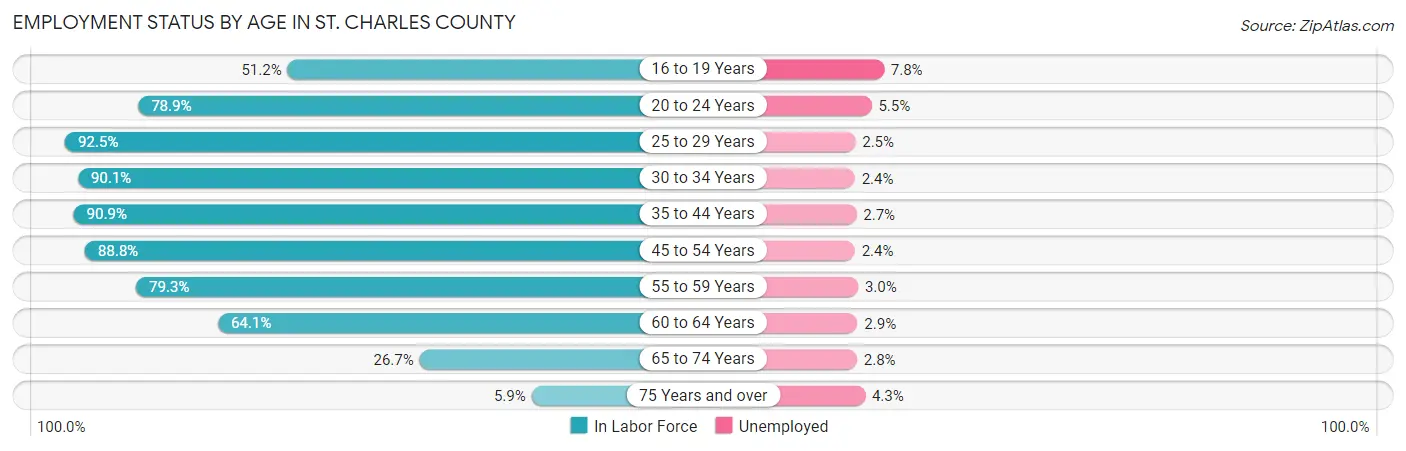
| Age Bracket | In Labor Force | Unemployed |
| 16 to 19 Years | 10,538 (51.2%) | 822 (7.8%) |
| 20 to 24 Years | 19,306 (78.9%) | 1,062 (5.5%) |
| 25 to 29 Years | 22,300 (92.5%) | 558 (2.5%) |
| 30 to 34 Years | 24,031 (90.1%) | 577 (2.4%) |
| 35 to 44 Years | 51,362 (90.9%) | 1,387 (2.7%) |
| 45 to 54 Years | 45,827 (88.8%) | 1,100 (2.4%) |
| 55 to 59 Years | 22,094 (79.3%) | 663 (3.0%) |
| 60 to 64 Years | 17,618 (64.1%) | 511 (2.9%) |
| 65 to 74 Years | 10,300 (26.7%) | 288 (2.8%) |
| 75 Years and over | 1,569 (5.9%) | 67 (4.3%) |
| Total | 225,175 (69.4%) | 6,980 (3.1%) |
Employment Status by Educational Attainment in St. Charles County
According to labor force statistics for St. Charles County, 85.6% of individuals (183,387) out of the total population between 25 and 64 years of age (214,237) are in the labor force, with 2.6% or 4,768 of them being unemployed. The group with the highest labor force participation rate are those with the educational attainment of bachelor's degree or higher, with 90.4% or 89,769 individuals in the labor force. Within the labor force, individuals with less than high school education have the highest percentage of unemployment, with 5.1% or 274 of them being unemployed.
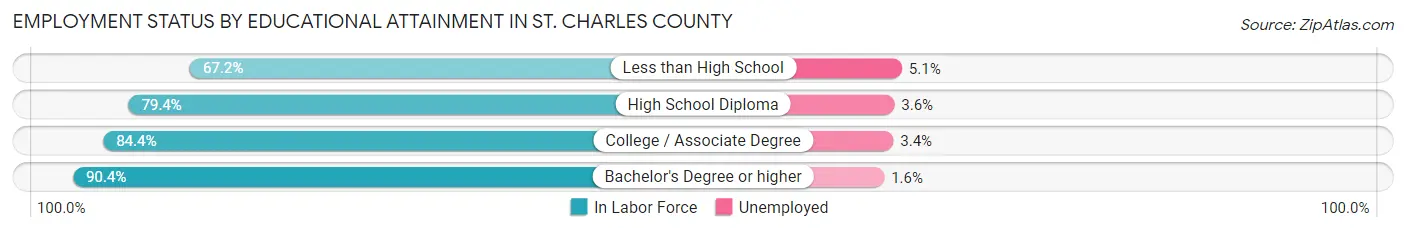
| Educational Attainment | In Labor Force | Unemployed |
| Less than High School | 5,369 (67.2%) | 407 (5.1%) |
| High School Diploma | 33,097 (79.4%) | 1,501 (3.6%) |
| College / Associate Degree | 55,081 (84.4%) | 2,219 (3.4%) |
| Bachelor's Degree or higher | 89,769 (90.4%) | 1,589 (1.6%) |
| Total | 183,387 (85.6%) | 5,570 (2.6%) |
Employment Occupations by Sex in St. Charles County
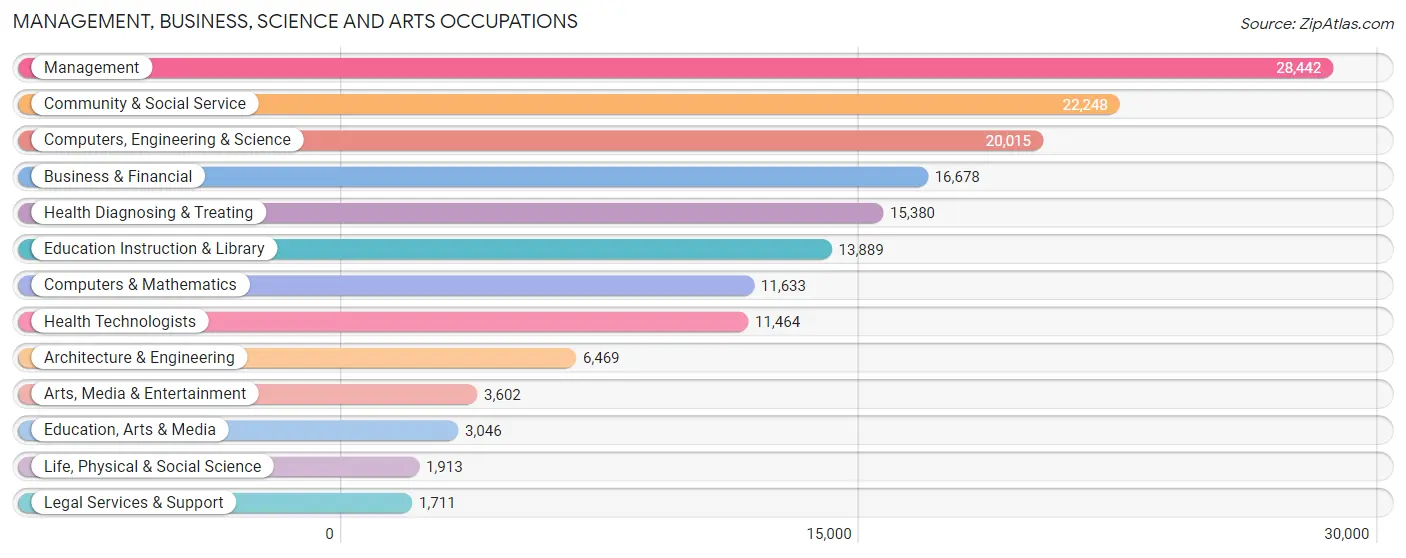
Management, Business, Science and Arts Occupations
The most common Management, Business, Science and Arts occupations in St. Charles County are Management (28,442 | 13.1%), Community & Social Service (22,248 | 10.2%), Computers, Engineering & Science (20,015 | 9.2%), Business & Financial (16,678 | 7.7%), and Health Diagnosing & Treating (15,380 | 7.1%).
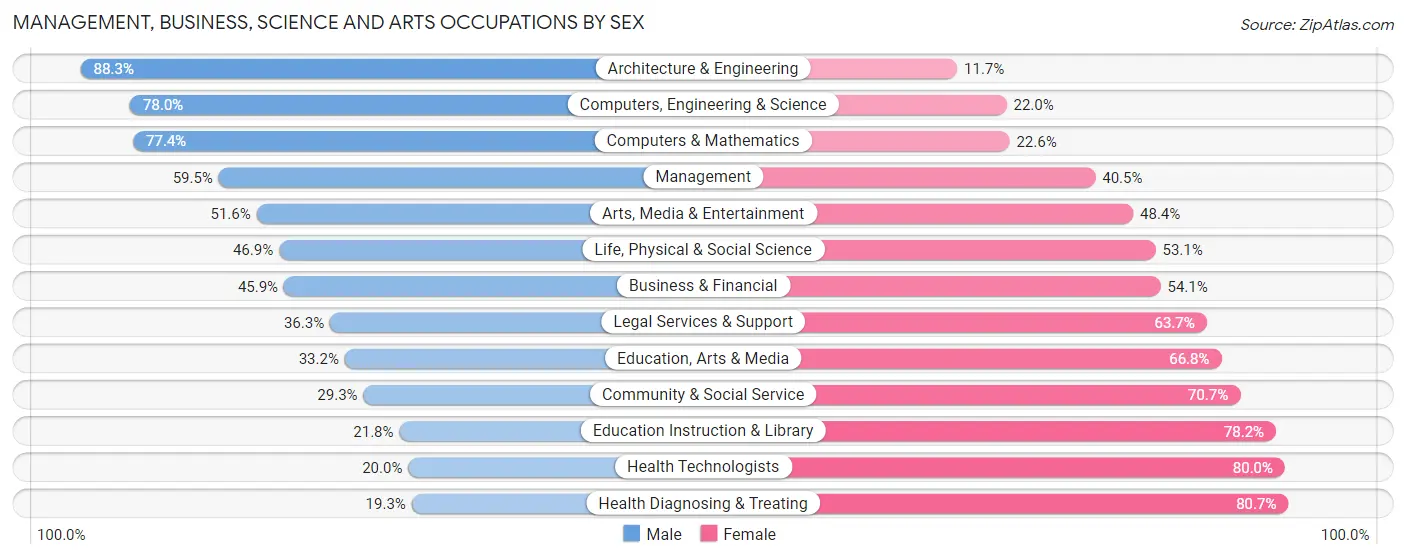
Management, Business, Science and Arts Occupations by Sex
Within the Management, Business, Science and Arts occupations in St. Charles County, the most male-oriented occupations are Architecture & Engineering (88.3%), Computers, Engineering & Science (78.0%), and Computers & Mathematics (77.4%), while the most female-oriented occupations are Health Diagnosing & Treating (80.7%), Health Technologists (80.0%), and Education Instruction & Library (78.2%).
| Occupation | Male | Female |
| Management | 16,927 (59.5%) | 11,515 (40.5%) |
| Business & Financial | 7,656 (45.9%) | 9,022 (54.1%) |
| Computers, Engineering & Science | 15,616 (78.0%) | 4,399 (22.0%) |
| Computers & Mathematics | 9,004 (77.4%) | 2,629 (22.6%) |
| Architecture & Engineering | 5,714 (88.3%) | 755 (11.7%) |
| Life, Physical & Social Science | 898 (46.9%) | 1,015 (53.1%) |
| Community & Social Service | 6,524 (29.3%) | 15,724 (70.7%) |
| Education, Arts & Media | 1,012 (33.2%) | 2,034 (66.8%) |
| Legal Services & Support | 621 (36.3%) | 1,090 (63.7%) |
| Education Instruction & Library | 3,032 (21.8%) | 10,857 (78.2%) |
| Arts, Media & Entertainment | 1,859 (51.6%) | 1,743 (48.4%) |
| Health Diagnosing & Treating | 2,962 (19.3%) | 12,418 (80.7%) |
| Health Technologists | 2,289 (20.0%) | 9,175 (80.0%) |
| Total (Category) | 49,685 (48.3%) | 53,078 (51.6%) |
| Total (Overall) | 114,389 (52.5%) | 103,467 (47.5%) |
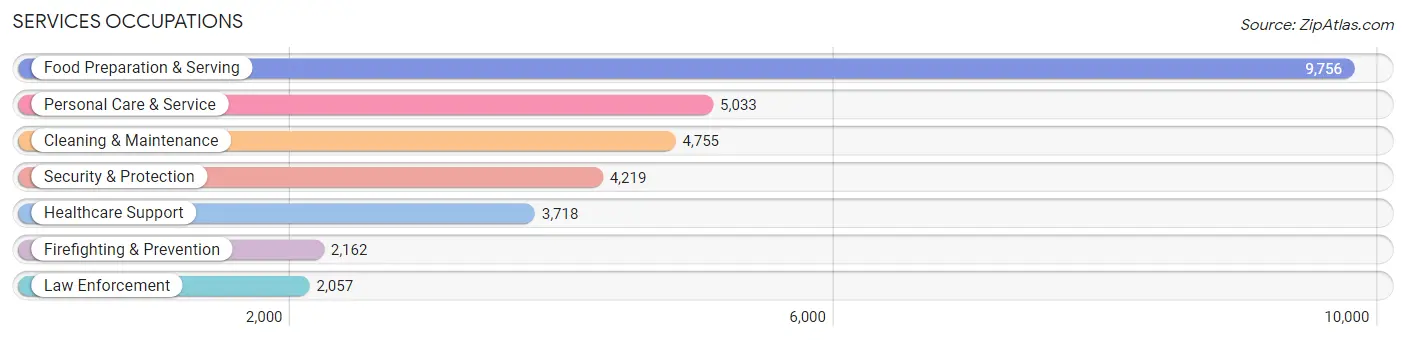
Services Occupations
The most common Services occupations in St. Charles County are Food Preparation & Serving (9,756 | 4.5%), Personal Care & Service (5,033 | 2.3%), Cleaning & Maintenance (4,755 | 2.2%), Security & Protection (4,219 | 1.9%), and Healthcare Support (3,718 | 1.7%).
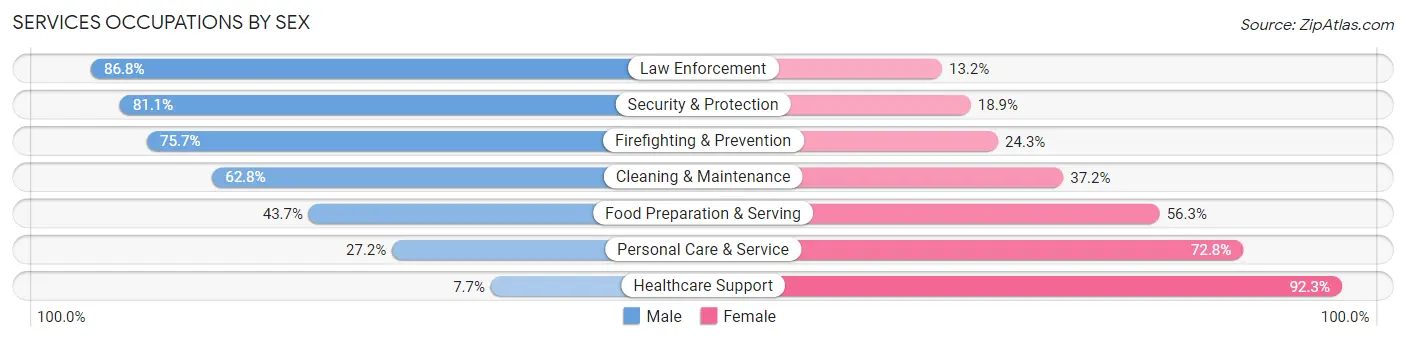
Services Occupations by Sex
Within the Services occupations in St. Charles County, the most male-oriented occupations are Law Enforcement (86.8%), Security & Protection (81.1%), and Firefighting & Prevention (75.7%), while the most female-oriented occupations are Healthcare Support (92.3%), Personal Care & Service (72.8%), and Food Preparation & Serving (56.3%).
| Occupation | Male | Female |
| Healthcare Support | 286 (7.7%) | 3,432 (92.3%) |
| Security & Protection | 3,423 (81.1%) | 796 (18.9%) |
| Firefighting & Prevention | 1,637 (75.7%) | 525 (24.3%) |
| Law Enforcement | 1,786 (86.8%) | 271 (13.2%) |
| Food Preparation & Serving | 4,266 (43.7%) | 5,490 (56.3%) |
| Cleaning & Maintenance | 2,987 (62.8%) | 1,768 (37.2%) |
| Personal Care & Service | 1,370 (27.2%) | 3,663 (72.8%) |
| Total (Category) | 12,332 (44.9%) | 15,149 (55.1%) |
| Total (Overall) | 114,389 (52.5%) | 103,467 (47.5%) |
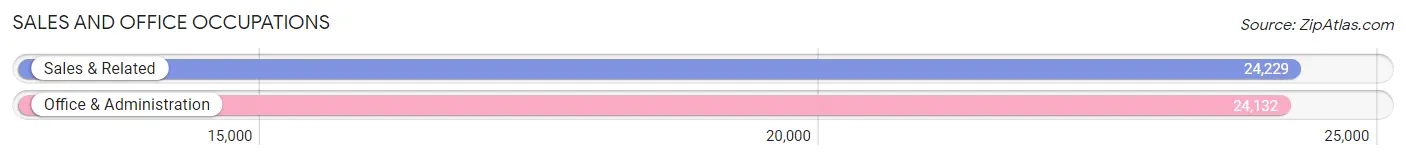
Sales and Office Occupations
The most common Sales and Office occupations in St. Charles County are Sales & Related (24,229 | 11.1%), and Office & Administration (24,132 | 11.1%).
Sales and Office Occupations by Sex
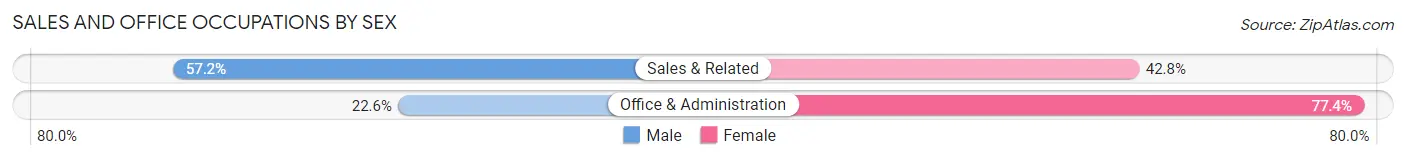
| Occupation | Male | Female |
| Sales & Related | 13,857 (57.2%) | 10,372 (42.8%) |
| Office & Administration | 5,450 (22.6%) | 18,682 (77.4%) |
| Total (Category) | 19,307 (39.9%) | 29,054 (60.1%) |
| Total (Overall) | 114,389 (52.5%) | 103,467 (47.5%) |
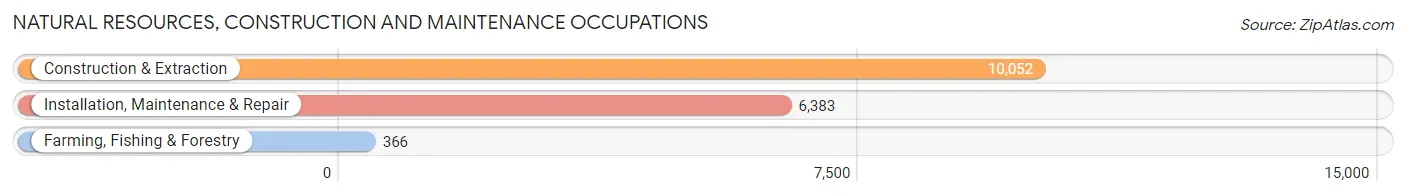
Natural Resources, Construction and Maintenance Occupations
The most common Natural Resources, Construction and Maintenance occupations in St. Charles County are Construction & Extraction (10,052 | 4.6%), Installation, Maintenance & Repair (6,383 | 2.9%), and Farming, Fishing & Forestry (366 | 0.2%).
Natural Resources, Construction and Maintenance Occupations by Sex
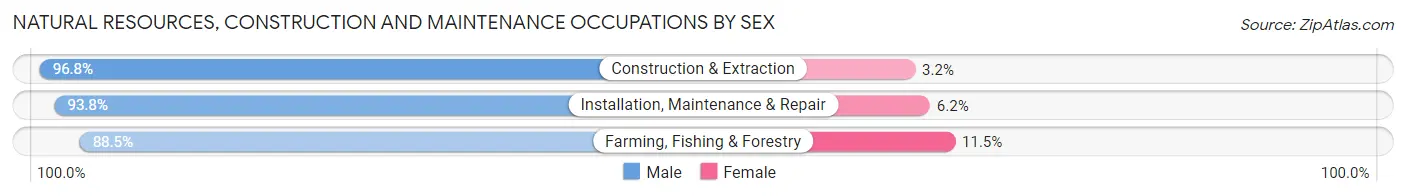
| Occupation | Male | Female |
| Farming, Fishing & Forestry | 324 (88.5%) | 42 (11.5%) |
| Construction & Extraction | 9,733 (96.8%) | 319 (3.2%) |
| Installation, Maintenance & Repair | 5,985 (93.8%) | 398 (6.2%) |
| Total (Category) | 16,042 (95.5%) | 759 (4.5%) |
| Total (Overall) | 114,389 (52.5%) | 103,467 (47.5%) |
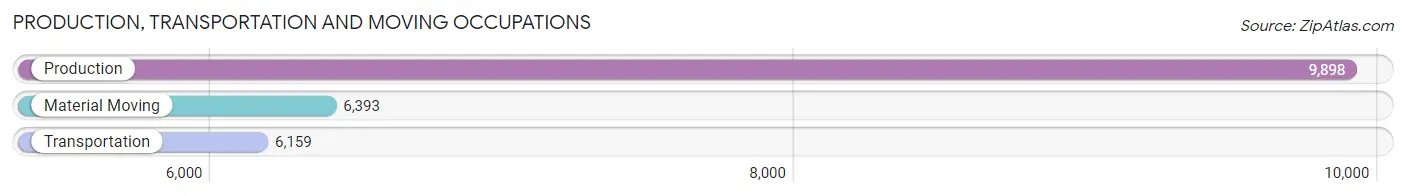
Production, Transportation and Moving Occupations
The most common Production, Transportation and Moving occupations in St. Charles County are Production (9,898 | 4.5%), Material Moving (6,393 | 2.9%), and Transportation (6,159 | 2.8%).
Production, Transportation and Moving Occupations by Sex
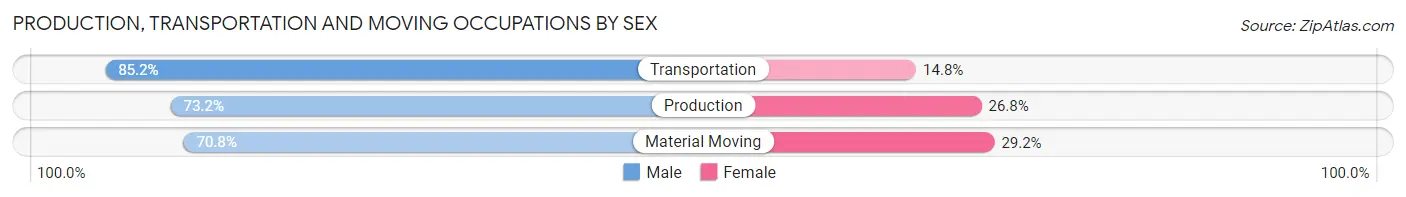
| Occupation | Male | Female |
| Production | 7,246 (73.2%) | 2,652 (26.8%) |
| Transportation | 5,248 (85.2%) | 911 (14.8%) |
| Material Moving | 4,529 (70.8%) | 1,864 (29.2%) |
| Total (Category) | 17,023 (75.8%) | 5,427 (24.2%) |
| Total (Overall) | 114,389 (52.5%) | 103,467 (47.5%) |
Employment Industries by Sex in St. Charles County
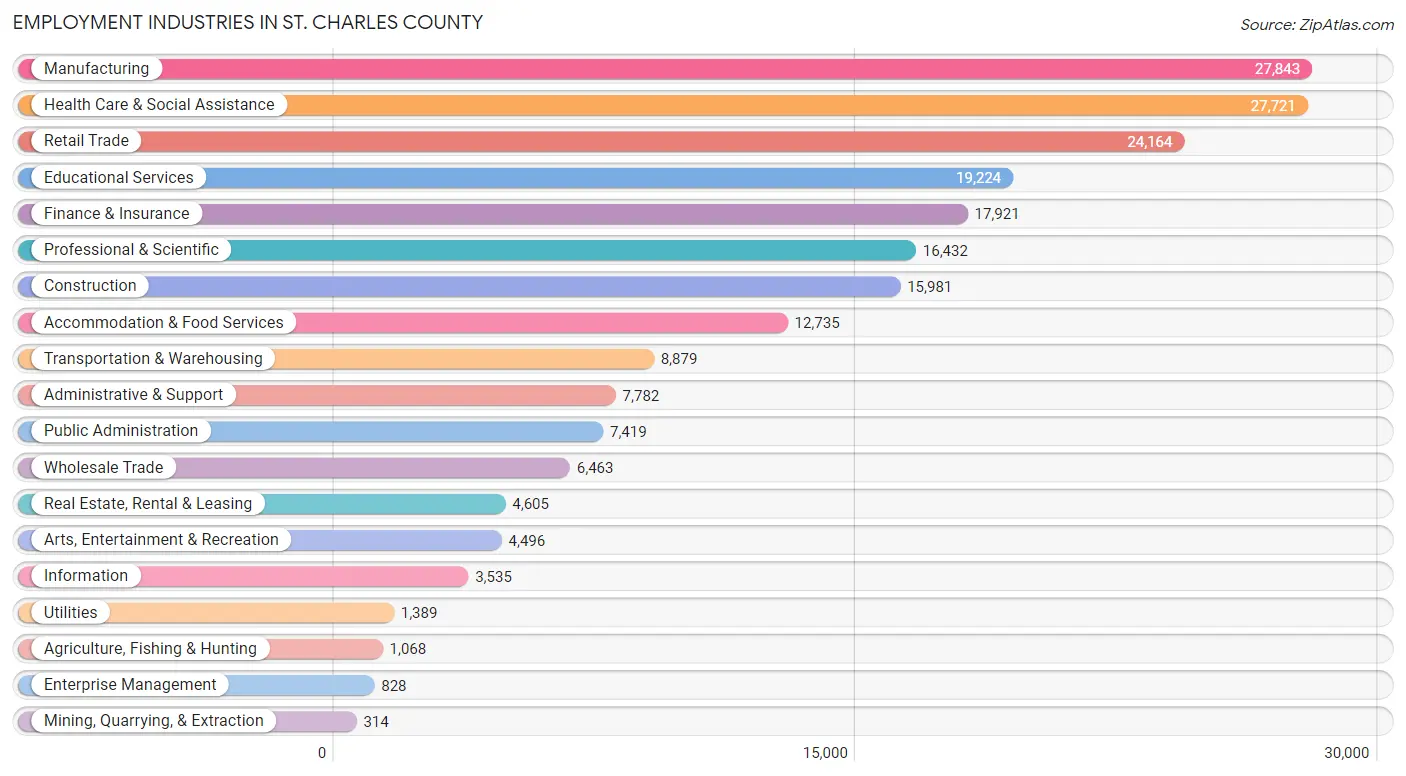
Employment Industries in St. Charles County
The major employment industries in St. Charles County include Manufacturing (27,843 | 12.8%), Health Care & Social Assistance (27,721 | 12.7%), Retail Trade (24,164 | 11.1%), Educational Services (19,224 | 8.8%), and Finance & Insurance (17,921 | 8.2%).
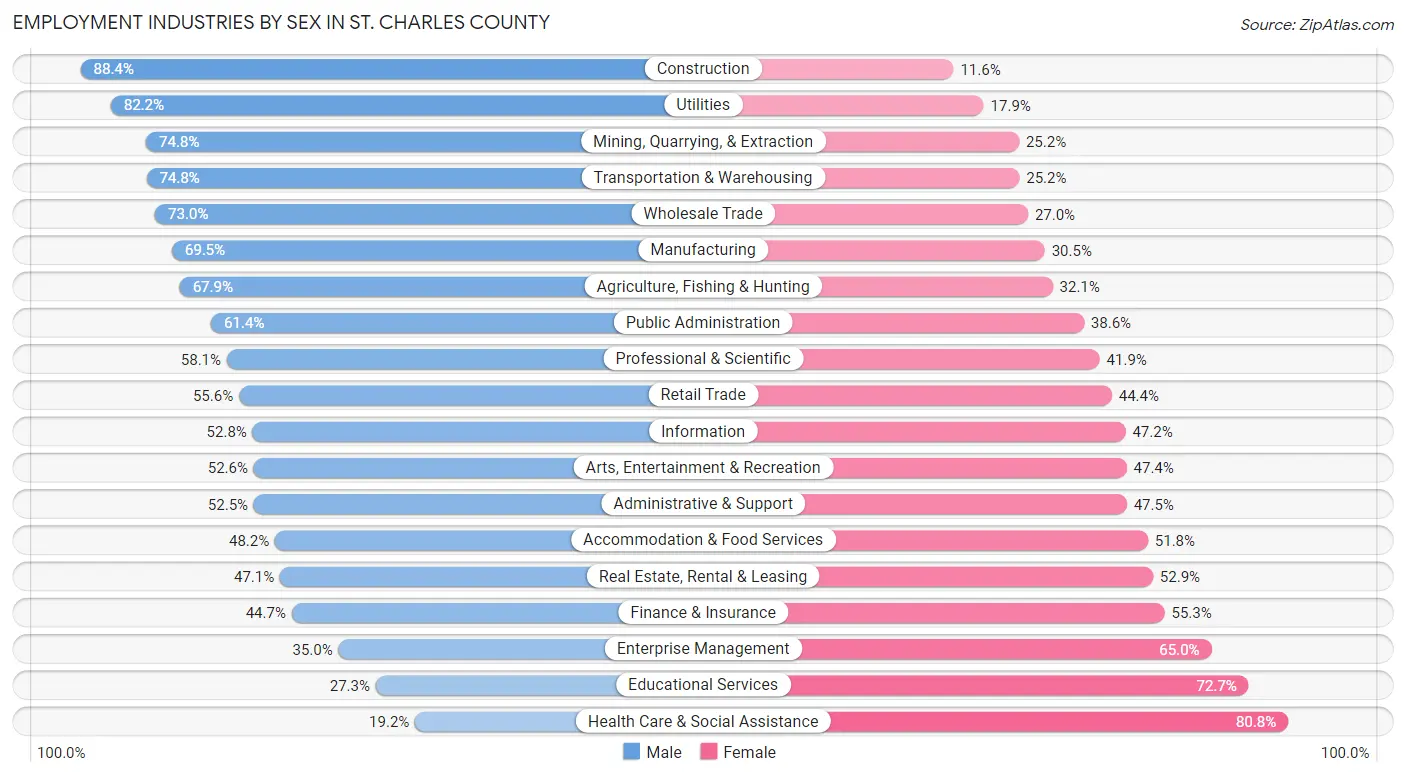
Employment Industries by Sex in St. Charles County
The St. Charles County industries that see more men than women are Construction (88.4%), Utilities (82.2%), and Mining, Quarrying, & Extraction (74.8%), whereas the industries that tend to have a higher number of women are Health Care & Social Assistance (80.8%), Educational Services (72.7%), and Enterprise Management (65.0%).
| Industry | Male | Female |
| Agriculture, Fishing & Hunting | 725 (67.9%) | 343 (32.1%) |
| Mining, Quarrying, & Extraction | 235 (74.8%) | 79 (25.2%) |
| Construction | 14,127 (88.4%) | 1,854 (11.6%) |
| Manufacturing | 19,355 (69.5%) | 8,488 (30.5%) |
| Wholesale Trade | 4,717 (73.0%) | 1,746 (27.0%) |
| Retail Trade | 13,442 (55.6%) | 10,722 (44.4%) |
| Transportation & Warehousing | 6,639 (74.8%) | 2,240 (25.2%) |
| Utilities | 1,141 (82.2%) | 248 (17.8%) |
| Information | 1,866 (52.8%) | 1,669 (47.2%) |
| Finance & Insurance | 8,013 (44.7%) | 9,908 (55.3%) |
| Real Estate, Rental & Leasing | 2,170 (47.1%) | 2,435 (52.9%) |
| Professional & Scientific | 9,553 (58.1%) | 6,879 (41.9%) |
| Enterprise Management | 290 (35.0%) | 538 (65.0%) |
| Administrative & Support | 4,089 (52.5%) | 3,693 (47.5%) |
| Educational Services | 5,251 (27.3%) | 13,973 (72.7%) |
| Health Care & Social Assistance | 5,311 (19.2%) | 22,410 (80.8%) |
| Arts, Entertainment & Recreation | 2,363 (52.6%) | 2,133 (47.4%) |
| Accommodation & Food Services | 6,133 (48.2%) | 6,602 (51.8%) |
| Public Administration | 4,555 (61.4%) | 2,864 (38.6%) |
| Total | 114,389 (52.5%) | 103,467 (47.5%) |
Education in St. Charles County
School Enrollment in St. Charles County
The most common levels of schooling among the 100,095 students in St. Charles County are high school (21,982 | 22.0%), middle school (21,432 | 21.4%), and elementary school (20,502 | 20.5%).
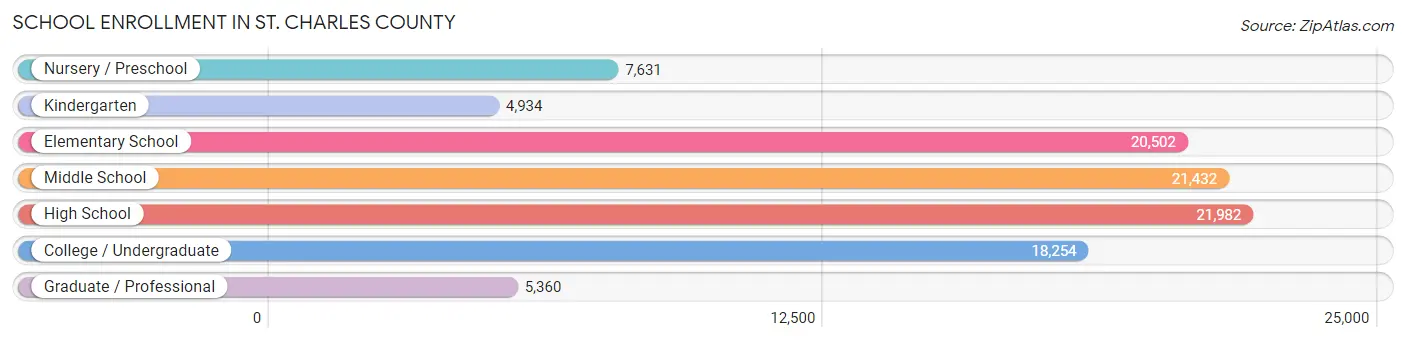
| School Level | # Students | % Students |
| Nursery / Preschool | 7,631 | 7.6% |
| Kindergarten | 4,934 | 4.9% |
| Elementary School | 20,502 | 20.5% |
| Middle School | 21,432 | 21.4% |
| High School | 21,982 | 22.0% |
| College / Undergraduate | 18,254 | 18.2% |
| Graduate / Professional | 5,360 | 5.3% |
| Total | 100,095 | 100.0% |
School Enrollment by Age by Funding Source in St. Charles County
Out of a total of 100,095 students who are enrolled in schools in St. Charles County, 24,023 (24.0%) attend a private institution, while the remaining 76,072 (76.0%) are enrolled in public schools. The age group of 3 to 4 year olds has the highest likelihood of being enrolled in private schools, with 2,615 (48.8% in the age bracket) enrolled. Conversely, the age group of 15 to 17 year olds has the lowest likelihood of being enrolled in a private school, with 14,396 (87.8% in the age bracket) attending a public institution.
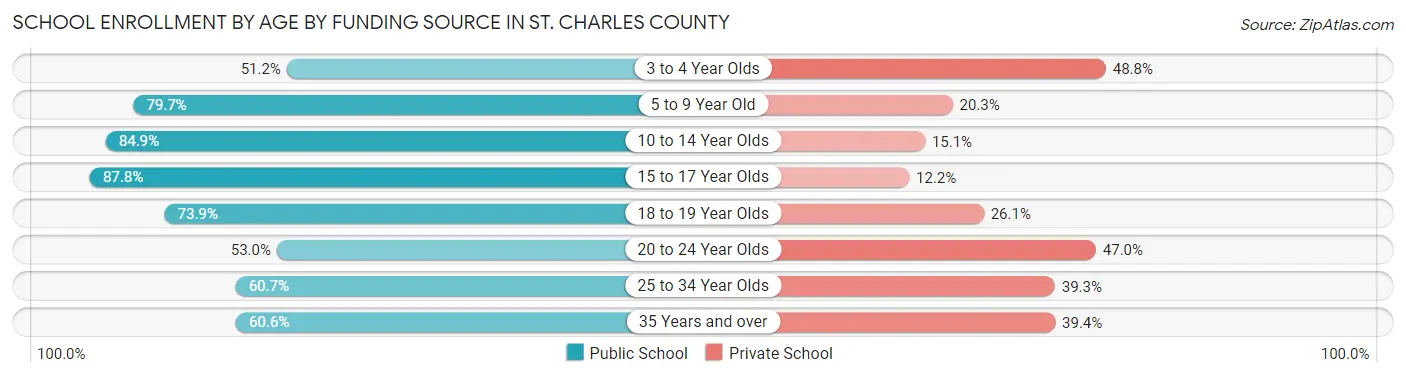
| Age Bracket | Public School | Private School |
| 3 to 4 Year Olds | 2,741 (51.2%) | 2,615 (48.8%) |
| 5 to 9 Year Old | 19,836 (79.7%) | 5,046 (20.3%) |
| 10 to 14 Year Olds | 22,604 (84.9%) | 4,034 (15.1%) |
| 15 to 17 Year Olds | 14,396 (87.8%) | 1,999 (12.2%) |
| 18 to 19 Year Olds | 5,806 (73.9%) | 2,049 (26.1%) |
| 20 to 24 Year Olds | 5,391 (53.0%) | 4,774 (47.0%) |
| 25 to 34 Year Olds | 2,644 (60.7%) | 1,714 (39.3%) |
| 35 Years and over | 2,695 (60.6%) | 1,751 (39.4%) |
| Total | 76,072 (76.0%) | 24,023 (24.0%) |
Educational Attainment by Field of Study in St. Charles County
Business (34,707 | 27.6%), education (15,923 | 12.7%), science & technology (12,838 | 10.2%), engineering (10,248 | 8.2%), and arts & humanities (8,435 | 6.7%) are the most common fields of study among 125,720 individuals in St. Charles County who have obtained a bachelor's degree or higher.
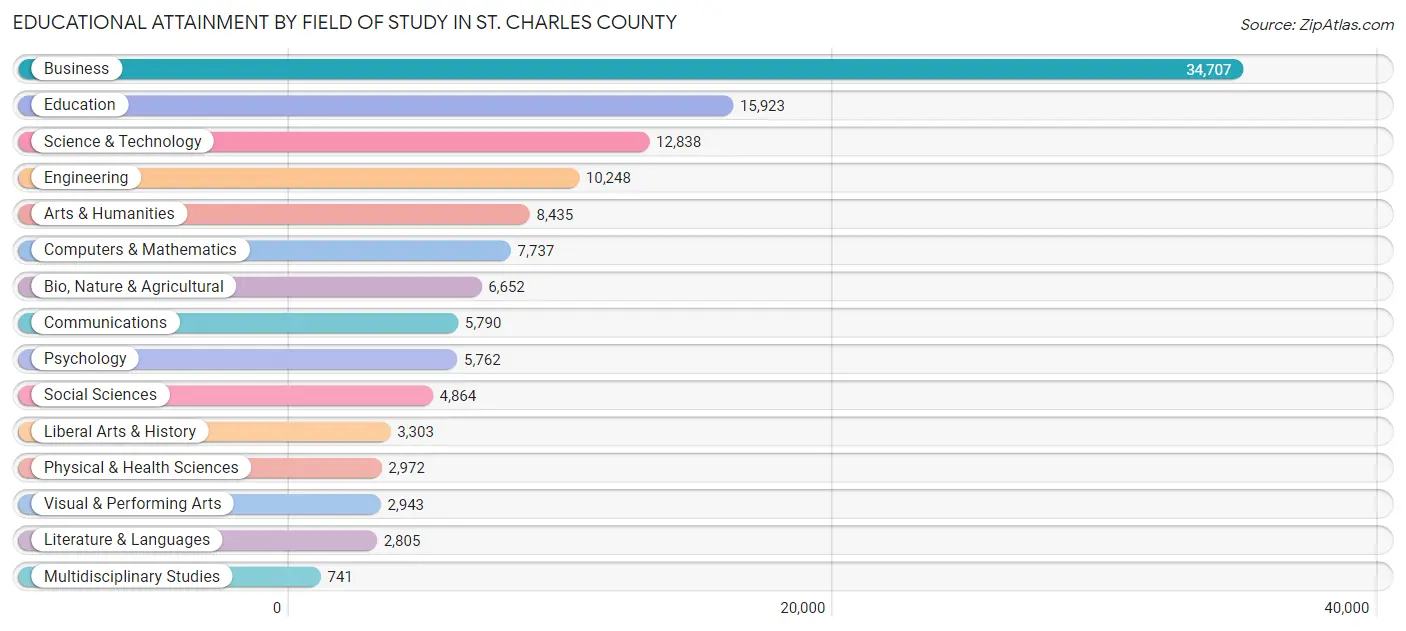
| Field of Study | # Graduates | % Graduates |
| Computers & Mathematics | 7,737 | 6.1% |
| Bio, Nature & Agricultural | 6,652 | 5.3% |
| Physical & Health Sciences | 2,972 | 2.4% |
| Psychology | 5,762 | 4.6% |
| Social Sciences | 4,864 | 3.9% |
| Engineering | 10,248 | 8.2% |
| Multidisciplinary Studies | 741 | 0.6% |
| Science & Technology | 12,838 | 10.2% |
| Business | 34,707 | 27.6% |
| Education | 15,923 | 12.7% |
| Literature & Languages | 2,805 | 2.2% |
| Liberal Arts & History | 3,303 | 2.6% |
| Visual & Performing Arts | 2,943 | 2.3% |
| Communications | 5,790 | 4.6% |
| Arts & Humanities | 8,435 | 6.7% |
| Total | 125,720 | 100.0% |
Transportation & Commute in St. Charles County
Vehicle Availability by Sex in St. Charles County
The most prevalent vehicle ownership categories in St. Charles County are males with 2 vehicles (53,314, accounting for 47.2%) and females with 2 vehicles (44,504, making up 52.8%).
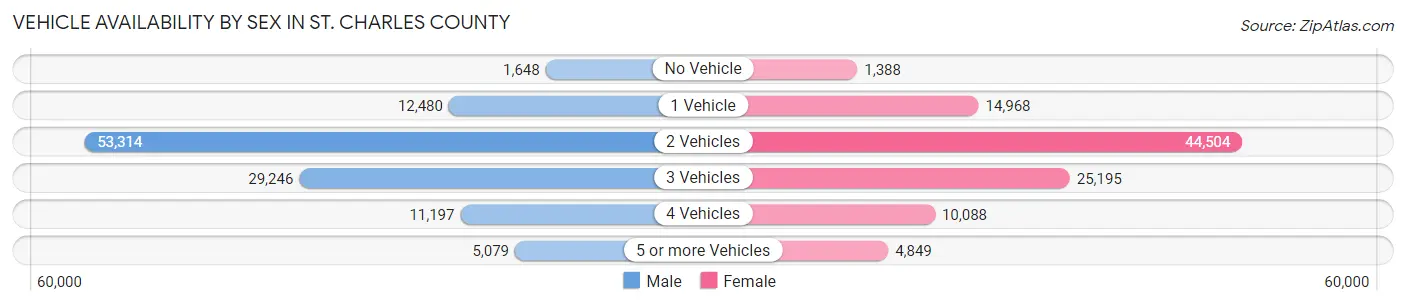
| Vehicles Available | Male | Female |
| No Vehicle | 1,648 (1.5%) | 1,388 (1.4%) |
| 1 Vehicle | 12,480 (11.1%) | 14,968 (14.8%) |
| 2 Vehicles | 53,314 (47.2%) | 44,504 (44.1%) |
| 3 Vehicles | 29,246 (25.9%) | 25,195 (24.9%) |
| 4 Vehicles | 11,197 (9.9%) | 10,088 (10.0%) |
| 5 or more Vehicles | 5,079 (4.5%) | 4,849 (4.8%) |
| Total | 112,964 (100.0%) | 100,992 (100.0%) |
Commute Time in St. Charles County
The most frequently occuring commute durations in St. Charles County are 20 to 24 minutes (30,812 commuters, 16.7%), 15 to 19 minutes (29,490 commuters, 15.9%), and 30 to 34 minutes (29,070 commuters, 15.7%).
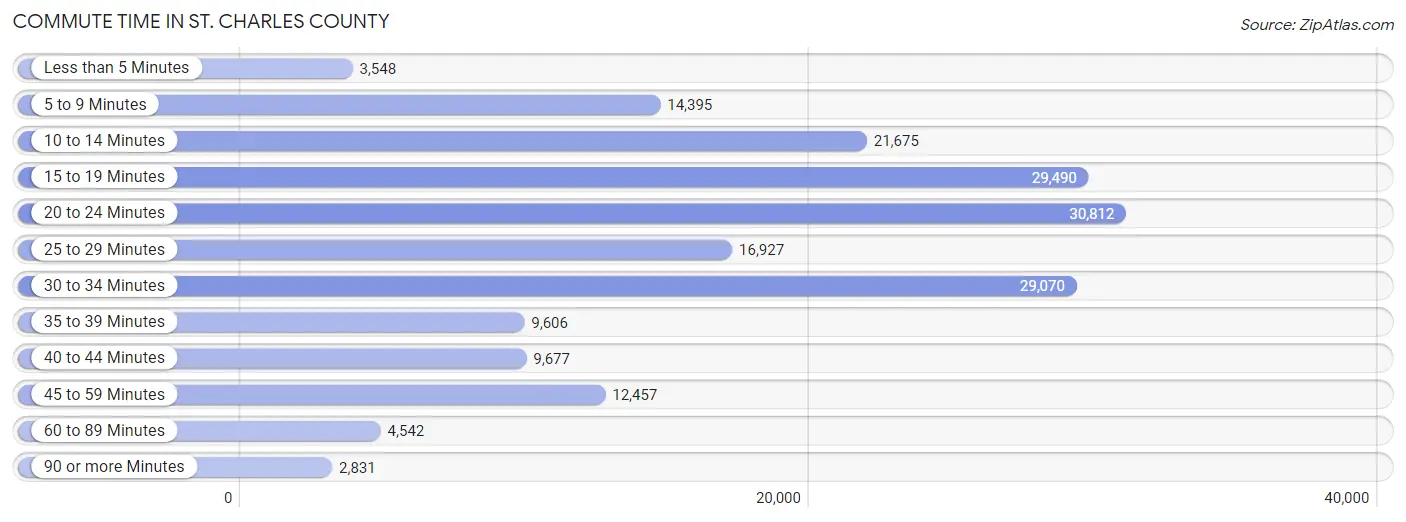
| Commute Time | # Commuters | % Commuters |
| Less than 5 Minutes | 3,548 | 1.9% |
| 5 to 9 Minutes | 14,395 | 7.8% |
| 10 to 14 Minutes | 21,675 | 11.7% |
| 15 to 19 Minutes | 29,490 | 15.9% |
| 20 to 24 Minutes | 30,812 | 16.7% |
| 25 to 29 Minutes | 16,927 | 9.1% |
| 30 to 34 Minutes | 29,070 | 15.7% |
| 35 to 39 Minutes | 9,606 | 5.2% |
| 40 to 44 Minutes | 9,677 | 5.2% |
| 45 to 59 Minutes | 12,457 | 6.7% |
| 60 to 89 Minutes | 4,542 | 2.5% |
| 90 or more Minutes | 2,831 | 1.5% |
Commute Time by Sex in St. Charles County
The most common commute times in St. Charles County are 30 to 34 minutes (17,464 commuters, 17.5%) for males and 15 to 19 minutes (14,228 commuters, 16.7%) for females.
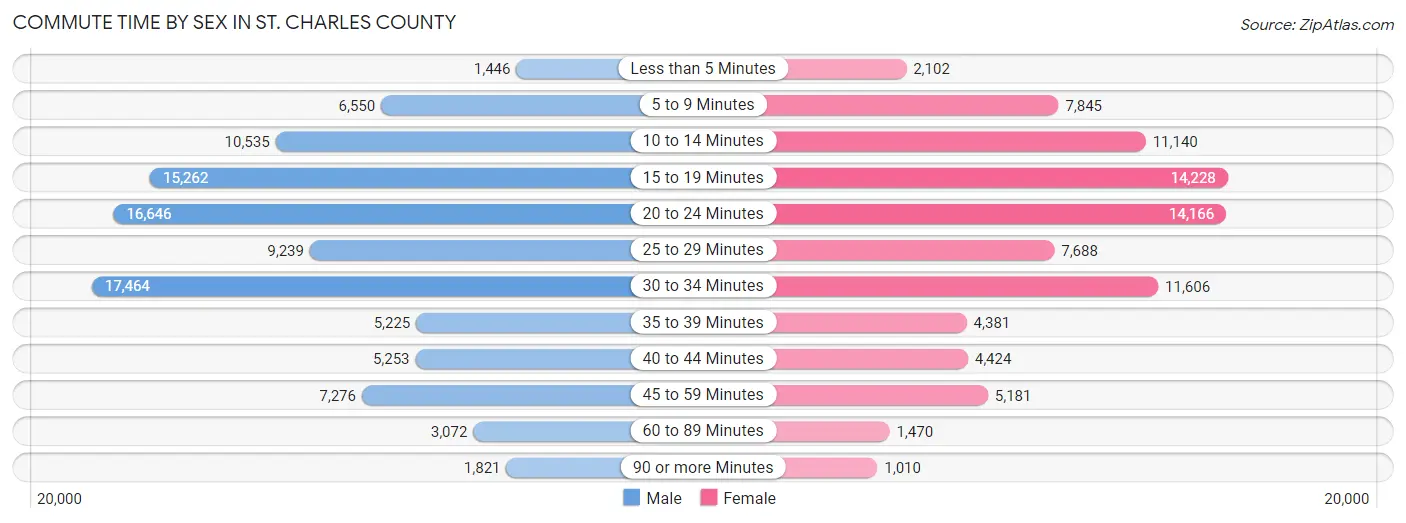
| Commute Time | Male | Female |
| Less than 5 Minutes | 1,446 (1.5%) | 2,102 (2.5%) |
| 5 to 9 Minutes | 6,550 (6.6%) | 7,845 (9.2%) |
| 10 to 14 Minutes | 10,535 (10.6%) | 11,140 (13.1%) |
| 15 to 19 Minutes | 15,262 (15.3%) | 14,228 (16.7%) |
| 20 to 24 Minutes | 16,646 (16.7%) | 14,166 (16.6%) |
| 25 to 29 Minutes | 9,239 (9.3%) | 7,688 (9.0%) |
| 30 to 34 Minutes | 17,464 (17.5%) | 11,606 (13.6%) |
| 35 to 39 Minutes | 5,225 (5.2%) | 4,381 (5.1%) |
| 40 to 44 Minutes | 5,253 (5.3%) | 4,424 (5.2%) |
| 45 to 59 Minutes | 7,276 (7.3%) | 5,181 (6.1%) |
| 60 to 89 Minutes | 3,072 (3.1%) | 1,470 (1.7%) |
| 90 or more Minutes | 1,821 (1.8%) | 1,010 (1.2%) |
Time of Departure to Work by Sex in St. Charles County
The most frequent times of departure to work in St. Charles County are 7:00 AM to 7:29 AM (13,693, 13.7%) for males and 7:00 AM to 7:29 AM (13,488, 15.8%) for females.
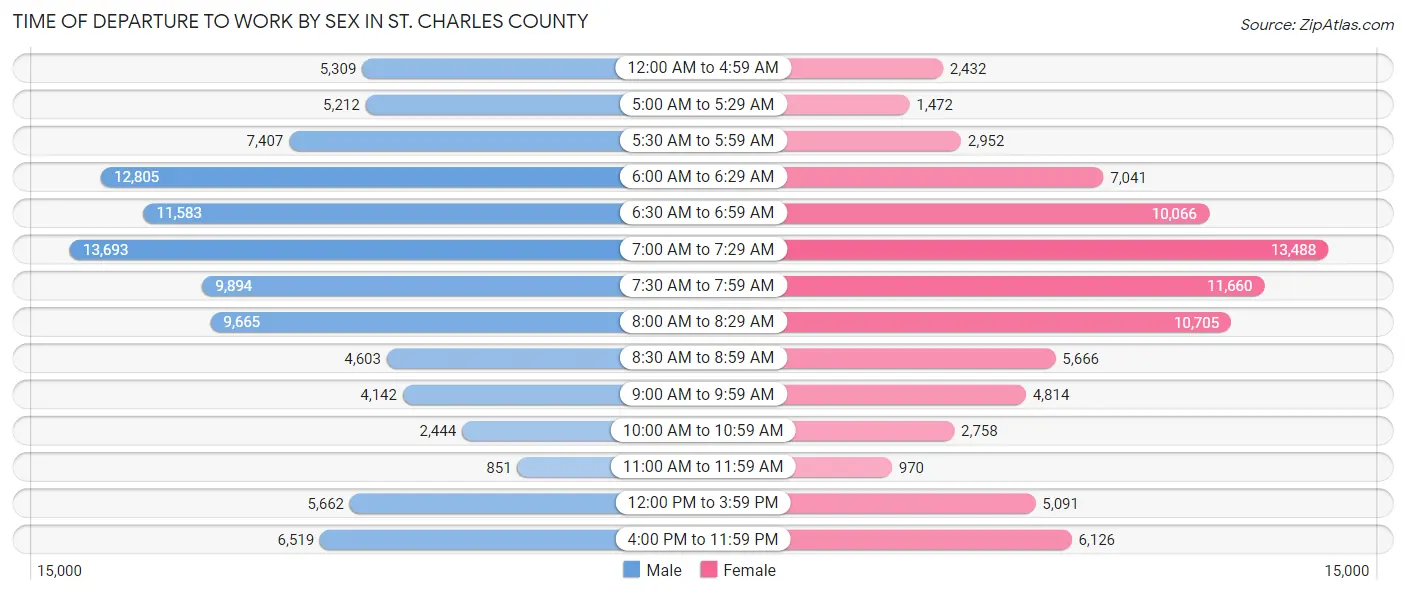
| Time of Departure | Male | Female |
| 12:00 AM to 4:59 AM | 5,309 (5.3%) | 2,432 (2.9%) |
| 5:00 AM to 5:29 AM | 5,212 (5.2%) | 1,472 (1.7%) |
| 5:30 AM to 5:59 AM | 7,407 (7.4%) | 2,952 (3.5%) |
| 6:00 AM to 6:29 AM | 12,805 (12.8%) | 7,041 (8.3%) |
| 6:30 AM to 6:59 AM | 11,583 (11.6%) | 10,066 (11.8%) |
| 7:00 AM to 7:29 AM | 13,693 (13.7%) | 13,488 (15.8%) |
| 7:30 AM to 7:59 AM | 9,894 (9.9%) | 11,660 (13.7%) |
| 8:00 AM to 8:29 AM | 9,665 (9.7%) | 10,705 (12.6%) |
| 8:30 AM to 8:59 AM | 4,603 (4.6%) | 5,666 (6.7%) |
| 9:00 AM to 9:59 AM | 4,142 (4.2%) | 4,814 (5.7%) |
| 10:00 AM to 10:59 AM | 2,444 (2.5%) | 2,758 (3.2%) |
| 11:00 AM to 11:59 AM | 851 (0.9%) | 970 (1.1%) |
| 12:00 PM to 3:59 PM | 5,662 (5.7%) | 5,091 (6.0%) |
| 4:00 PM to 11:59 PM | 6,519 (6.5%) | 6,126 (7.2%) |
| Total | 99,789 (100.0%) | 85,241 (100.0%) |
Housing Occupancy in St. Charles County
Occupancy by Ownership in St. Charles County
Of the total 156,381 dwellings in St. Charles County, owner-occupied units account for 126,256 (80.7%), while renter-occupied units make up 30,125 (19.3%).
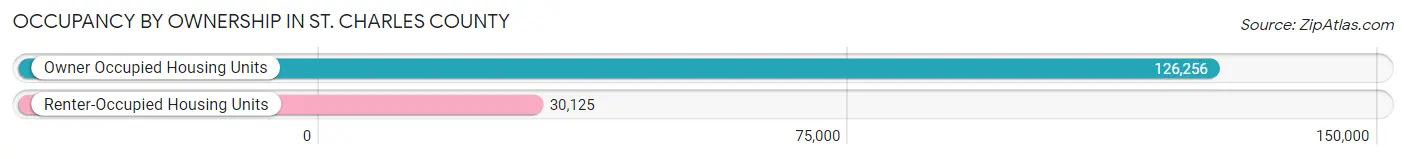
| Occupancy | # Housing Units | % Housing Units |
| Owner Occupied Housing Units | 126,256 | 80.7% |
| Renter-Occupied Housing Units | 30,125 | 19.3% |
| Total Occupied Housing Units | 156,381 | 100.0% |
Occupancy by Household Size in St. Charles County
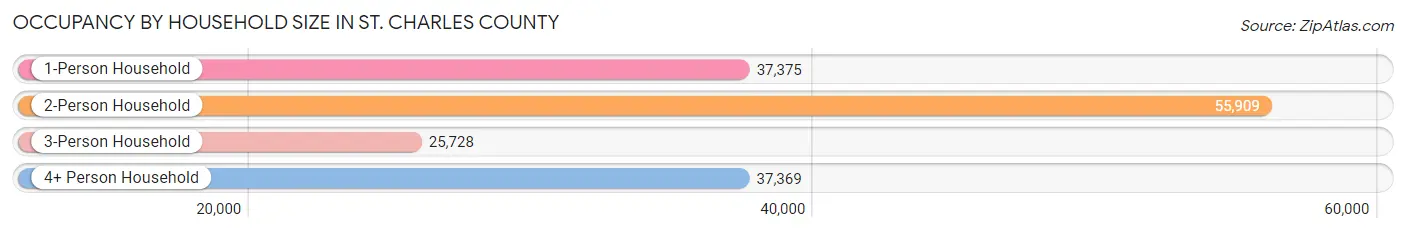
| Household Size | # Housing Units | % Housing Units |
| 1-Person Household | 37,375 | 23.9% |
| 2-Person Household | 55,909 | 35.7% |
| 3-Person Household | 25,728 | 16.5% |
| 4+ Person Household | 37,369 | 23.9% |
| Total Housing Units | 156,381 | 100.0% |
Occupancy by Ownership by Household Size in St. Charles County
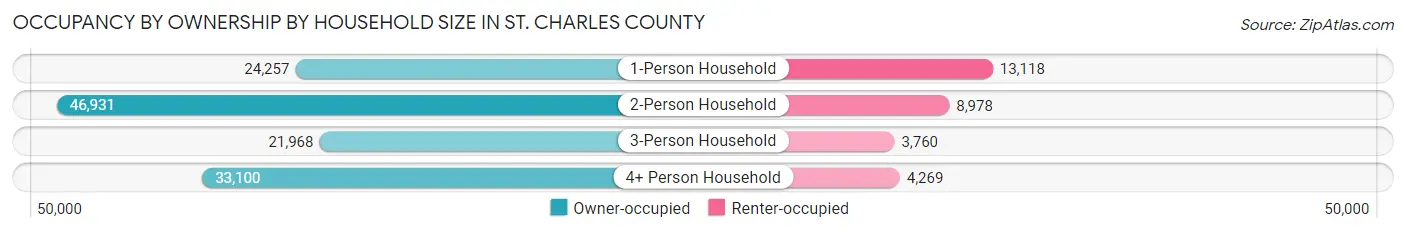
| Household Size | Owner-occupied | Renter-occupied |
| 1-Person Household | 24,257 (64.9%) | 13,118 (35.1%) |
| 2-Person Household | 46,931 (83.9%) | 8,978 (16.1%) |
| 3-Person Household | 21,968 (85.4%) | 3,760 (14.6%) |
| 4+ Person Household | 33,100 (88.6%) | 4,269 (11.4%) |
| Total Housing Units | 126,256 (80.7%) | 30,125 (19.3%) |
Occupancy by Educational Attainment in St. Charles County
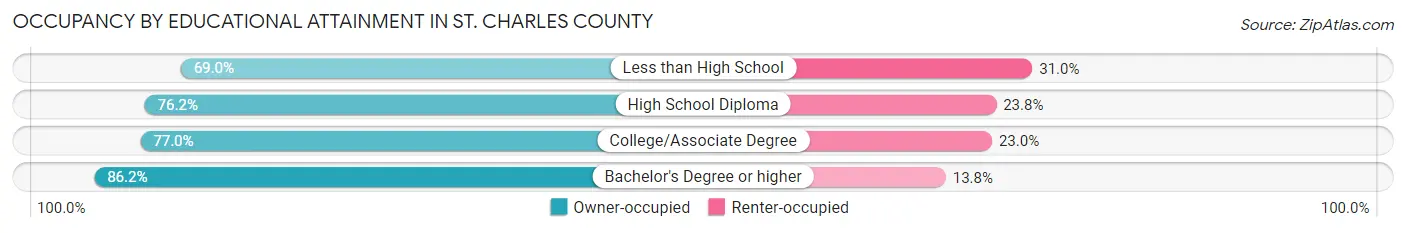
| Household Size | Owner-occupied | Renter-occupied |
| Less than High School | 4,034 (69.0%) | 1,809 (31.0%) |
| High School Diploma | 23,459 (76.2%) | 7,328 (23.8%) |
| College/Associate Degree | 37,462 (77.0%) | 11,163 (23.0%) |
| Bachelor's Degree or higher | 61,301 (86.2%) | 9,825 (13.8%) |
Occupancy by Age of Householder in St. Charles County
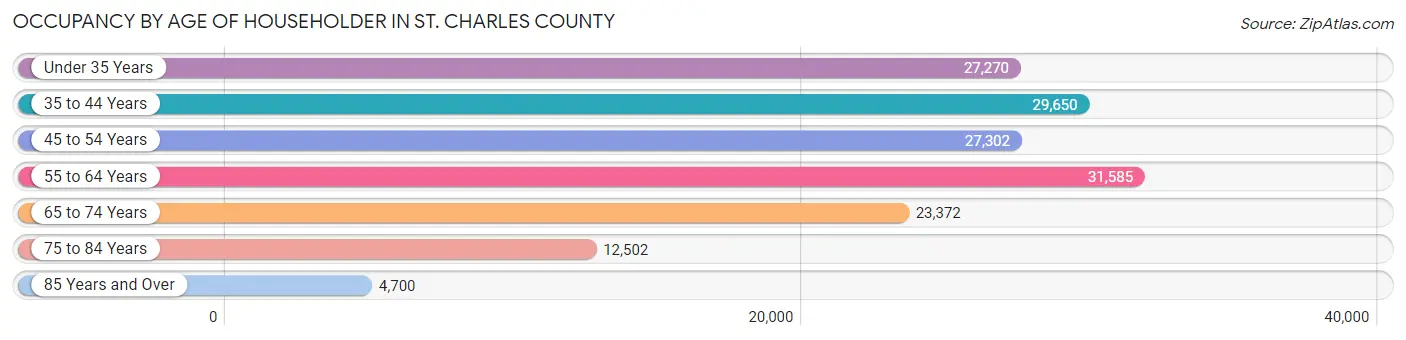
| Age Bracket | # Households | % Households |
| Under 35 Years | 27,270 | 17.4% |
| 35 to 44 Years | 29,650 | 19.0% |
| 45 to 54 Years | 27,302 | 17.5% |
| 55 to 64 Years | 31,585 | 20.2% |
| 65 to 74 Years | 23,372 | 14.9% |
| 75 to 84 Years | 12,502 | 8.0% |
| 85 Years and Over | 4,700 | 3.0% |
| Total | 156,381 | 100.0% |
Housing Finances in St. Charles County
Median Income by Occupancy in St. Charles County
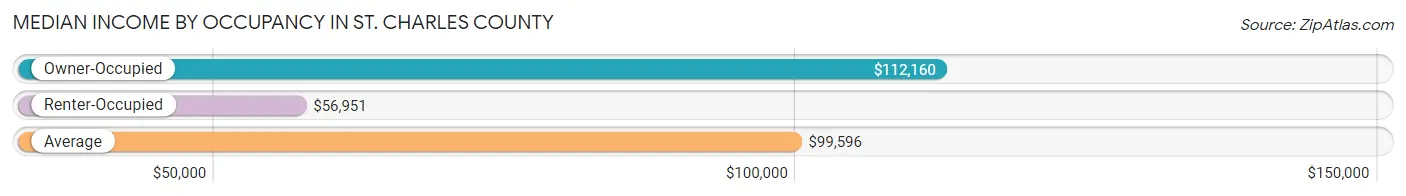
| Occupancy Type | # Households | Median Income |
| Owner-Occupied | 126,256 (80.7%) | $112,160 |
| Renter-Occupied | 30,125 (19.3%) | $56,951 |
| Average | 156,381 (100.0%) | $99,596 |
Occupancy by Householder Income Bracket in St. Charles County
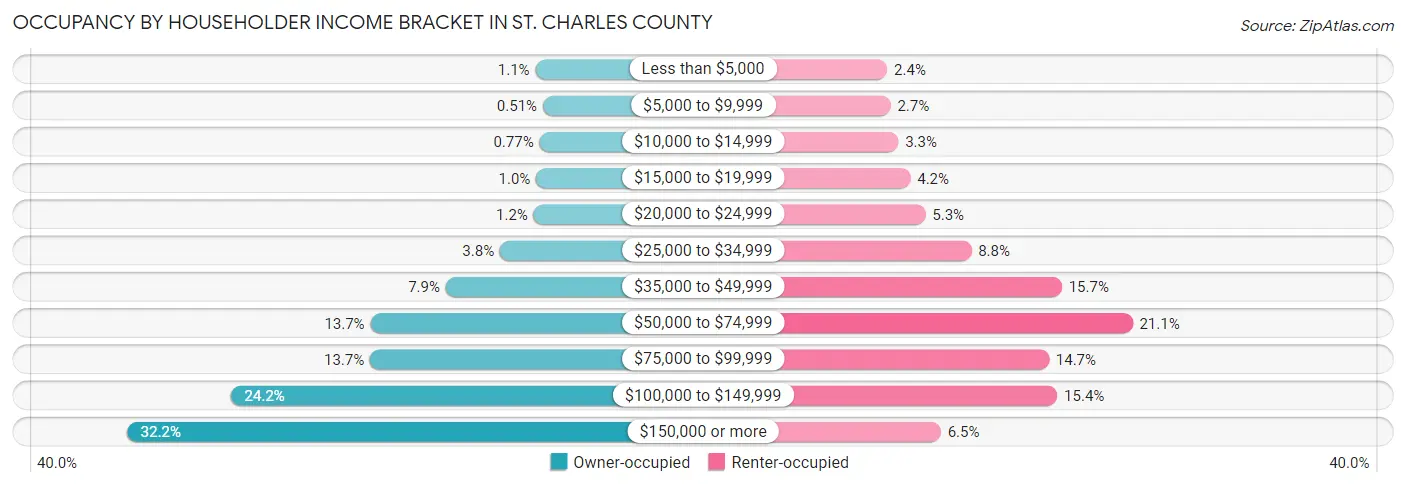
| Income Bracket | Owner-occupied | Renter-occupied |
| Less than $5,000 | 1,362 (1.1%) | 725 (2.4%) |
| $5,000 to $9,999 | 642 (0.5%) | 802 (2.7%) |
| $10,000 to $14,999 | 969 (0.8%) | 980 (3.3%) |
| $15,000 to $19,999 | 1,292 (1.0%) | 1,255 (4.2%) |
| $20,000 to $24,999 | 1,529 (1.2%) | 1,604 (5.3%) |
| $25,000 to $34,999 | 4,773 (3.8%) | 2,653 (8.8%) |
| $35,000 to $49,999 | 9,986 (7.9%) | 4,732 (15.7%) |
| $50,000 to $74,999 | 17,230 (13.7%) | 6,355 (21.1%) |
| $75,000 to $99,999 | 17,277 (13.7%) | 4,437 (14.7%) |
| $100,000 to $149,999 | 30,606 (24.2%) | 4,626 (15.4%) |
| $150,000 or more | 40,590 (32.2%) | 1,956 (6.5%) |
| Total | 126,256 (100.0%) | 30,125 (100.0%) |
Monthly Housing Cost Tiers in St. Charles County
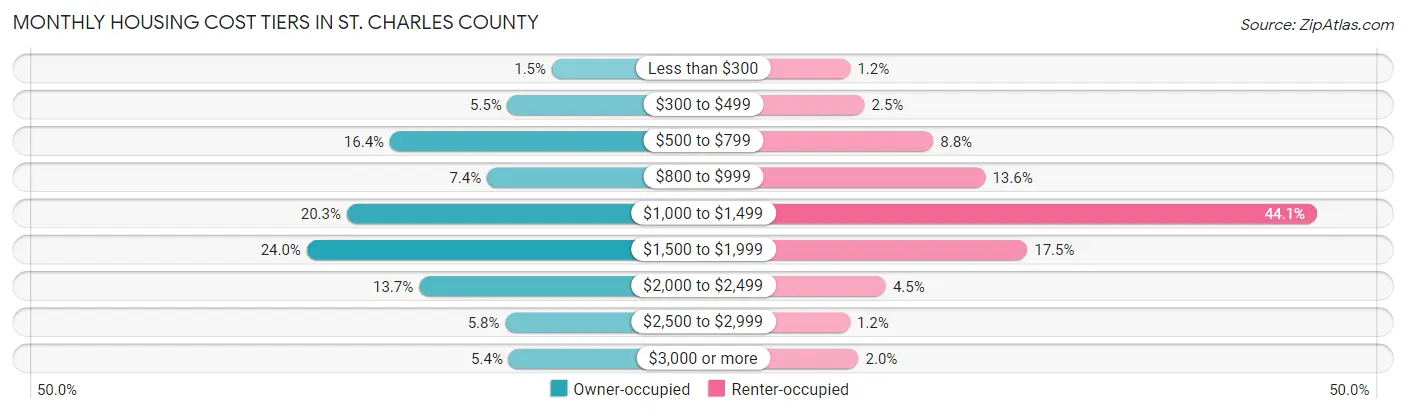
| Monthly Cost | Owner-occupied | Renter-occupied |
| Less than $300 | 1,838 (1.5%) | 362 (1.2%) |
| $300 to $499 | 6,976 (5.5%) | 753 (2.5%) |
| $500 to $799 | 20,667 (16.4%) | 2,661 (8.8%) |
| $800 to $999 | 9,366 (7.4%) | 4,106 (13.6%) |
| $1,000 to $1,499 | 25,676 (20.3%) | 13,297 (44.1%) |
| $1,500 to $1,999 | 30,342 (24.0%) | 5,265 (17.5%) |
| $2,000 to $2,499 | 17,279 (13.7%) | 1,346 (4.5%) |
| $2,500 to $2,999 | 7,260 (5.8%) | 350 (1.2%) |
| $3,000 or more | 6,852 (5.4%) | 587 (1.9%) |
| Total | 126,256 (100.0%) | 30,125 (100.0%) |
Physical Housing Characteristics in St. Charles County
Housing Structures in St. Charles County
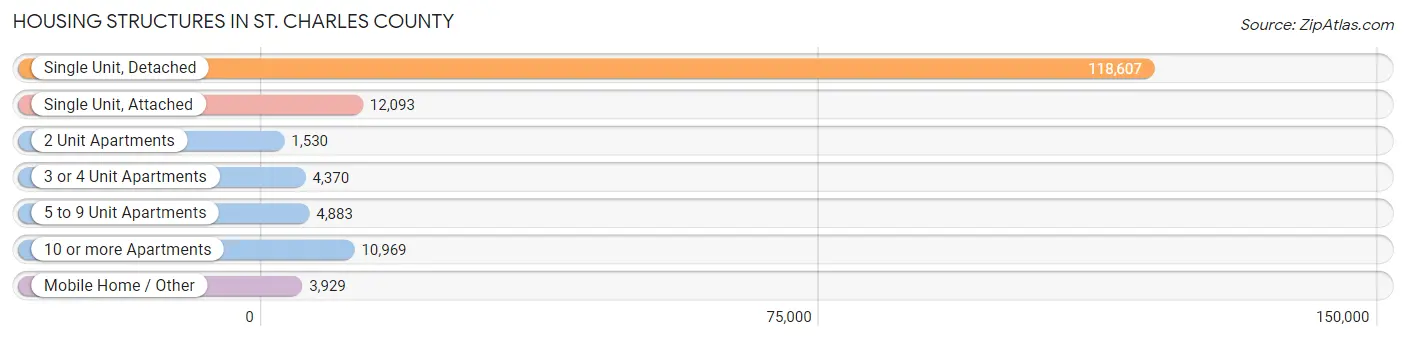
| Structure Type | # Housing Units | % Housing Units |
| Single Unit, Detached | 118,607 | 75.8% |
| Single Unit, Attached | 12,093 | 7.7% |
| 2 Unit Apartments | 1,530 | 1.0% |
| 3 or 4 Unit Apartments | 4,370 | 2.8% |
| 5 to 9 Unit Apartments | 4,883 | 3.1% |
| 10 or more Apartments | 10,969 | 7.0% |
| Mobile Home / Other | 3,929 | 2.5% |
| Total | 156,381 | 100.0% |
Housing Structures by Occupancy in St. Charles County
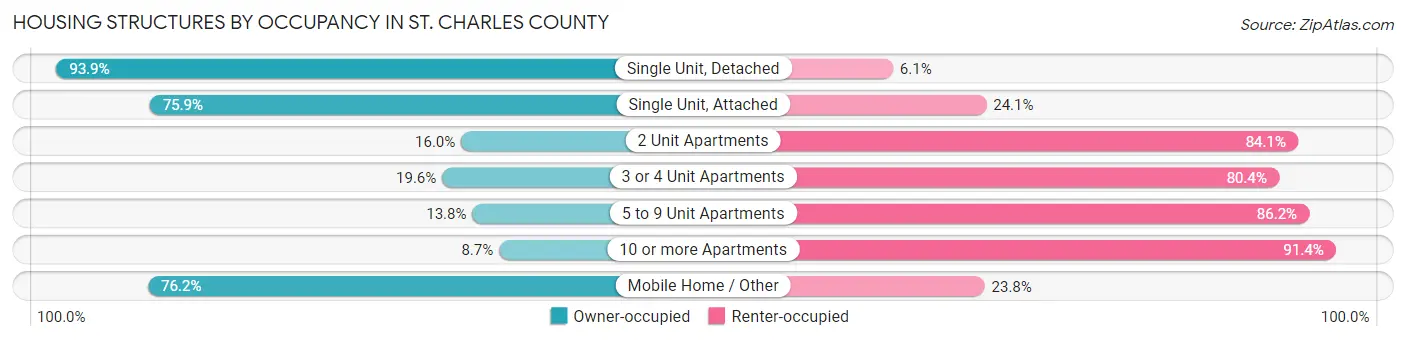
| Structure Type | Owner-occupied | Renter-occupied |
| Single Unit, Detached | 111,357 (93.9%) | 7,250 (6.1%) |
| Single Unit, Attached | 9,180 (75.9%) | 2,913 (24.1%) |
| 2 Unit Apartments | 244 (16.0%) | 1,286 (84.1%) |
| 3 or 4 Unit Apartments | 857 (19.6%) | 3,513 (80.4%) |
| 5 to 9 Unit Apartments | 674 (13.8%) | 4,209 (86.2%) |
| 10 or more Apartments | 949 (8.6%) | 10,020 (91.3%) |
| Mobile Home / Other | 2,995 (76.2%) | 934 (23.8%) |
| Total | 126,256 (80.7%) | 30,125 (19.3%) |
Housing Structures by Number of Rooms in St. Charles County
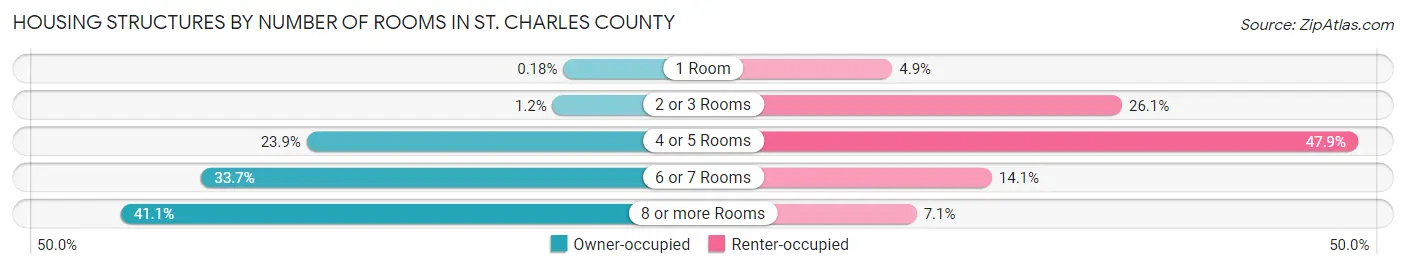
| Number of Rooms | Owner-occupied | Renter-occupied |
| 1 Room | 222 (0.2%) | 1,462 (4.9%) |
| 2 or 3 Rooms | 1,471 (1.2%) | 7,861 (26.1%) |
| 4 or 5 Rooms | 30,191 (23.9%) | 14,430 (47.9%) |
| 6 or 7 Rooms | 42,486 (33.7%) | 4,232 (14.1%) |
| 8 or more Rooms | 51,886 (41.1%) | 2,140 (7.1%) |
| Total | 126,256 (100.0%) | 30,125 (100.0%) |
Housing Structure by Heating Type in St. Charles County
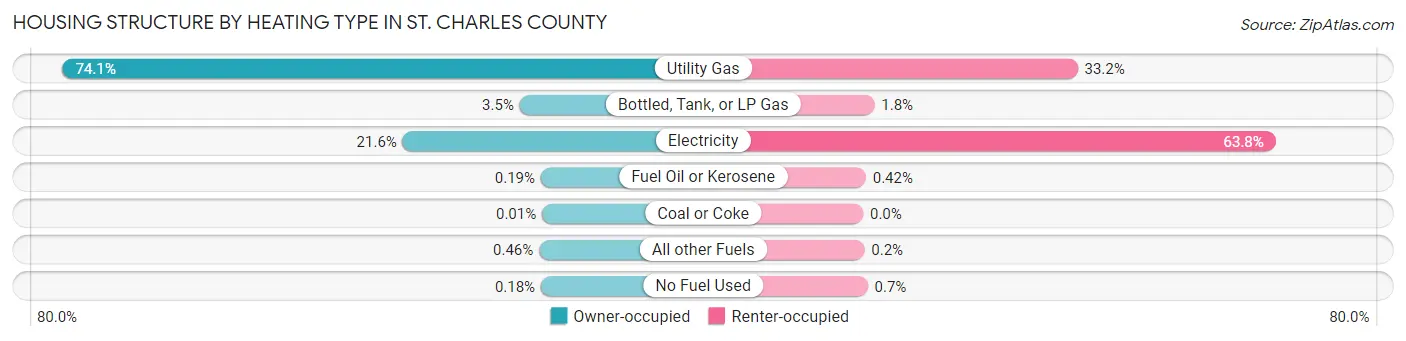
| Heating Type | Owner-occupied | Renter-occupied |
| Utility Gas | 93,610 (74.1%) | 9,989 (33.2%) |
| Bottled, Tank, or LP Gas | 4,373 (3.5%) | 528 (1.8%) |
| Electricity | 27,223 (21.6%) | 19,211 (63.8%) |
| Fuel Oil or Kerosene | 238 (0.2%) | 126 (0.4%) |
| Coal or Coke | 8 (0.0%) | 0 (0.0%) |
| All other Fuels | 576 (0.5%) | 59 (0.2%) |
| No Fuel Used | 228 (0.2%) | 212 (0.7%) |
| Total | 126,256 (100.0%) | 30,125 (100.0%) |
Household Vehicle Usage in St. Charles County
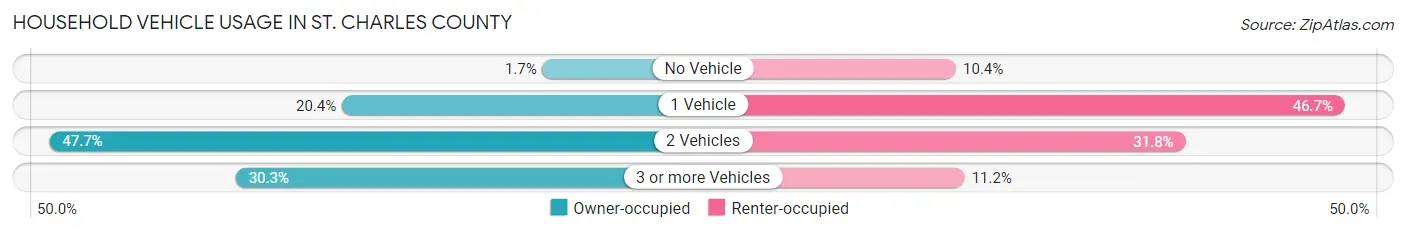
| Vehicles per Household | Owner-occupied | Renter-occupied |
| No Vehicle | 2,085 (1.7%) | 3,128 (10.4%) |
| 1 Vehicle | 25,720 (20.4%) | 14,057 (46.7%) |
| 2 Vehicles | 60,204 (47.7%) | 9,573 (31.8%) |
| 3 or more Vehicles | 38,247 (30.3%) | 3,367 (11.2%) |
| Total | 126,256 (100.0%) | 30,125 (100.0%) |
Real Estate & Mortgages in St. Charles County
Real Estate and Mortgage Overview in St. Charles County
| Characteristic | Without Mortgage | With Mortgage |
| Housing Units | 35,541 | 90,715 |
| Median Property Value | $266,200 | $282,500 |
| Median Household Income | $83,140 | $33,261 |
| Monthly Housing Costs | $641 | $6,755 |
| Real Estate Taxes | $3,132 | $1,336 |
Property Value by Mortgage Status in St. Charles County
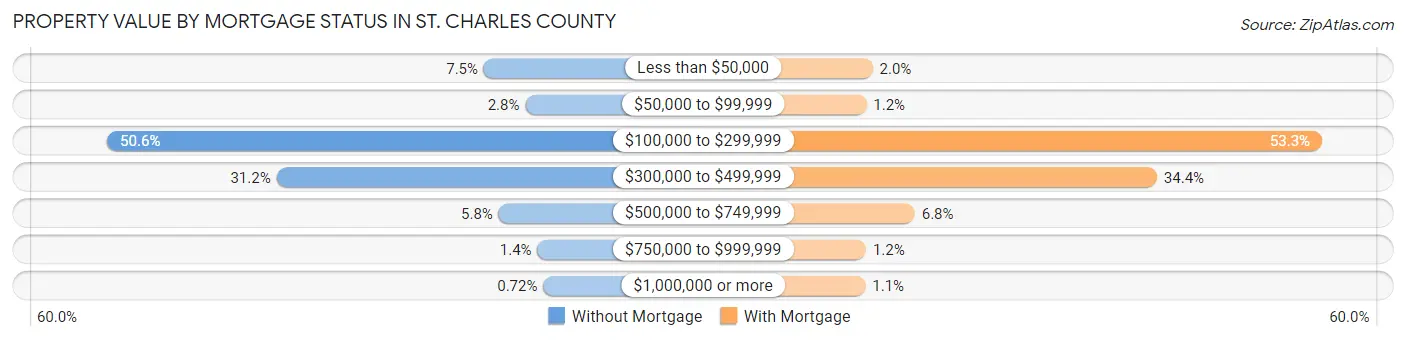
| Property Value | Without Mortgage | With Mortgage |
| Less than $50,000 | 2,670 (7.5%) | 1,770 (1.9%) |
| $50,000 to $99,999 | 988 (2.8%) | 1,119 (1.2%) |
| $100,000 to $299,999 | 17,969 (50.6%) | 48,349 (53.3%) |
| $300,000 to $499,999 | 11,094 (31.2%) | 31,244 (34.4%) |
| $500,000 to $749,999 | 2,069 (5.8%) | 6,139 (6.8%) |
| $750,000 to $999,999 | 494 (1.4%) | 1,080 (1.2%) |
| $1,000,000 or more | 257 (0.7%) | 1,014 (1.1%) |
| Total | 35,541 (100.0%) | 90,715 (100.0%) |
Household Income by Mortgage Status in St. Charles County
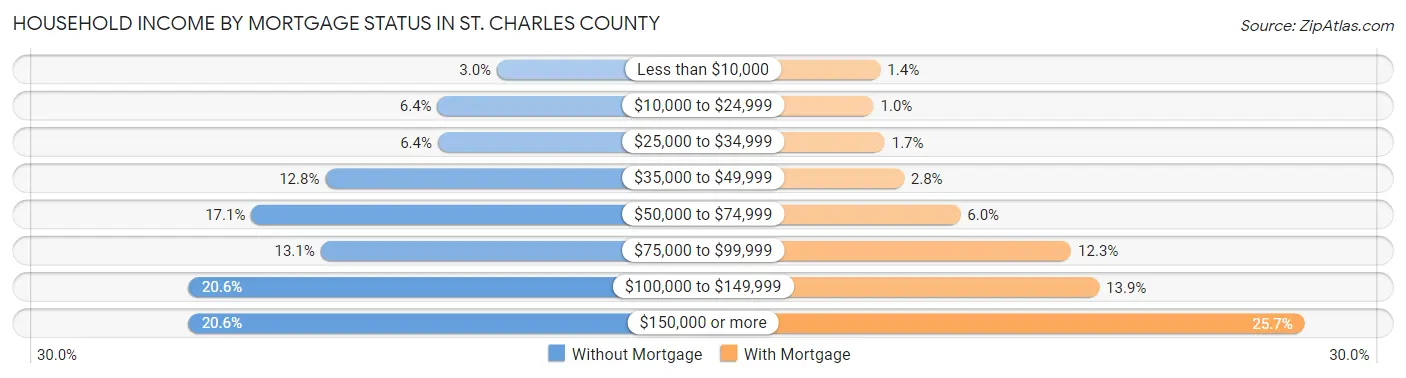
| Household Income | Without Mortgage | With Mortgage |
| Less than $10,000 | 1,071 (3.0%) | 1,289 (1.4%) |
| $10,000 to $24,999 | 2,279 (6.4%) | 933 (1.0%) |
| $25,000 to $34,999 | 2,271 (6.4%) | 1,511 (1.7%) |
| $35,000 to $49,999 | 4,555 (12.8%) | 2,502 (2.8%) |
| $50,000 to $74,999 | 6,058 (17.1%) | 5,431 (6.0%) |
| $75,000 to $99,999 | 4,652 (13.1%) | 11,172 (12.3%) |
| $100,000 to $149,999 | 7,326 (20.6%) | 12,625 (13.9%) |
| $150,000 or more | 7,329 (20.6%) | 23,280 (25.7%) |
| Total | 35,541 (100.0%) | 90,715 (100.0%) |
Property Value to Household Income Ratio in St. Charles County
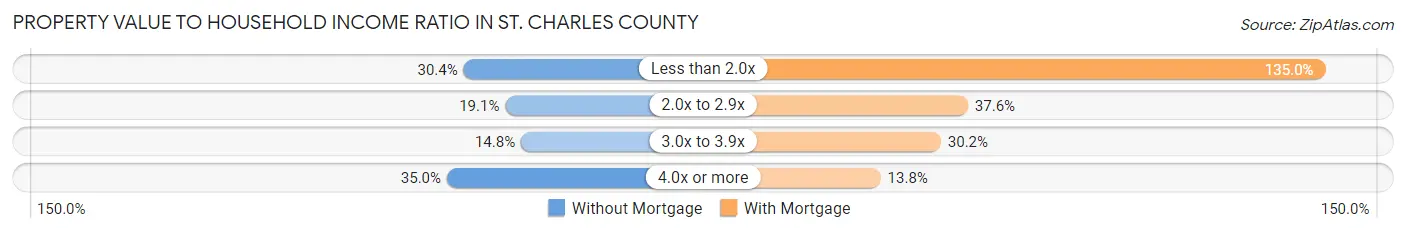
| Value-to-Income Ratio | Without Mortgage | With Mortgage |
| Less than 2.0x | 10,811 (30.4%) | 122,436 (135.0%) |
| 2.0x to 2.9x | 6,776 (19.1%) | 34,101 (37.6%) |
| 3.0x to 3.9x | 5,254 (14.8%) | 27,410 (30.2%) |
| 4.0x or more | 12,429 (35.0%) | 12,540 (13.8%) |
| Total | 35,541 (100.0%) | 90,715 (100.0%) |
Real Estate Taxes by Mortgage Status in St. Charles County
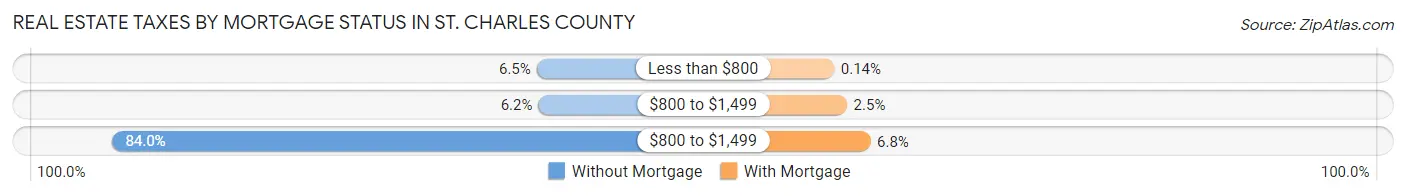
| Property Taxes | Without Mortgage | With Mortgage |
| Less than $800 | 2,303 (6.5%) | 125 (0.1%) |
| $800 to $1,499 | 2,198 (6.2%) | 2,256 (2.5%) |
| $800 to $1,499 | 29,838 (84.0%) | 6,140 (6.8%) |
| Total | 35,541 (100.0%) | 90,715 (100.0%) |
Health & Disability in St. Charles County
Health Insurance Coverage by Age in St. Charles County
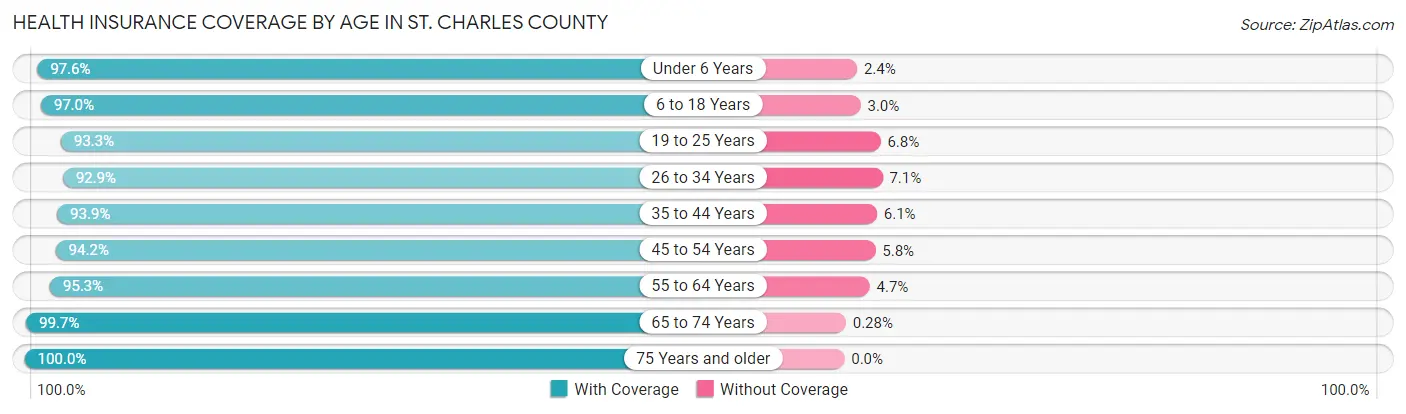
| Age Bracket | With Coverage | Without Coverage |
| Under 6 Years | 27,429 (97.6%) | 664 (2.4%) |
| 6 to 18 Years | 67,663 (97.0%) | 2,117 (3.0%) |
| 19 to 25 Years | 31,289 (93.2%) | 2,266 (6.8%) |
| 26 to 34 Years | 42,647 (92.9%) | 3,262 (7.1%) |
| 35 to 44 Years | 52,936 (93.9%) | 3,421 (6.1%) |
| 45 to 54 Years | 48,570 (94.2%) | 2,984 (5.8%) |
| 55 to 64 Years | 52,511 (95.3%) | 2,604 (4.7%) |
| 65 to 74 Years | 38,281 (99.7%) | 106 (0.3%) |
| 75 Years and older | 25,641 (100.0%) | 0 (0.0%) |
| Total | 386,967 (95.7%) | 17,424 (4.3%) |
Health Insurance Coverage by Citizenship Status in St. Charles County
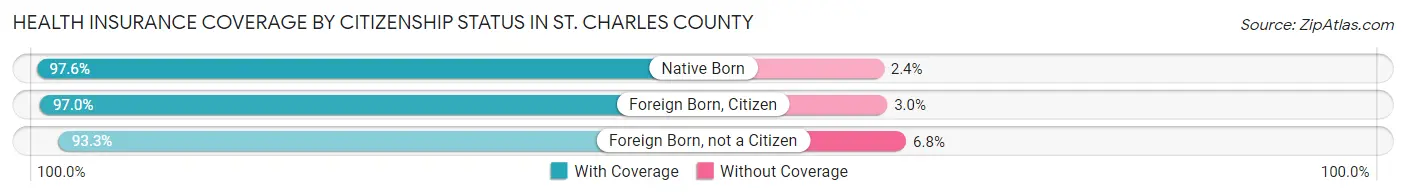
| Citizenship Status | With Coverage | Without Coverage |
| Native Born | 27,429 (97.6%) | 664 (2.4%) |
| Foreign Born, Citizen | 67,663 (97.0%) | 2,117 (3.0%) |
| Foreign Born, not a Citizen | 31,289 (93.2%) | 2,266 (6.8%) |
Health Insurance Coverage by Household Income in St. Charles County
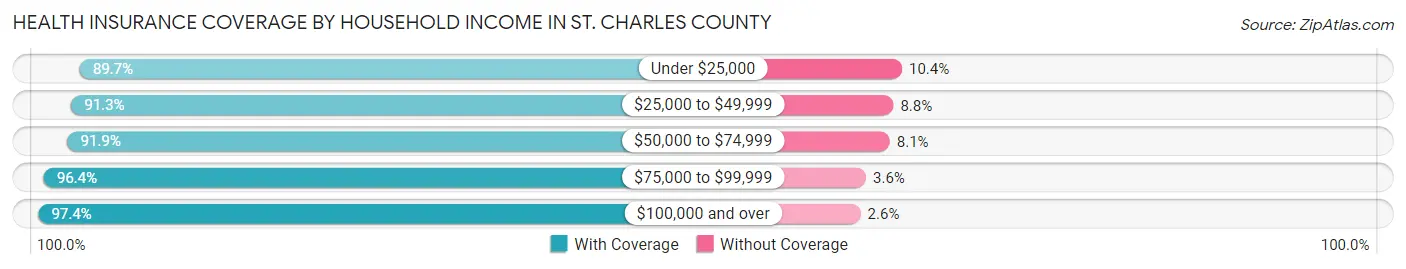
| Household Income | With Coverage | Without Coverage |
| Under $25,000 | 15,497 (89.6%) | 1,790 (10.3%) |
| $25,000 to $49,999 | 34,233 (91.2%) | 3,282 (8.7%) |
| $50,000 to $74,999 | 45,328 (91.9%) | 3,976 (8.1%) |
| $75,000 to $99,999 | 52,233 (96.4%) | 1,955 (3.6%) |
| $100,000 and over | 235,062 (97.4%) | 6,274 (2.6%) |
Public vs Private Health Insurance Coverage by Age in St. Charles County
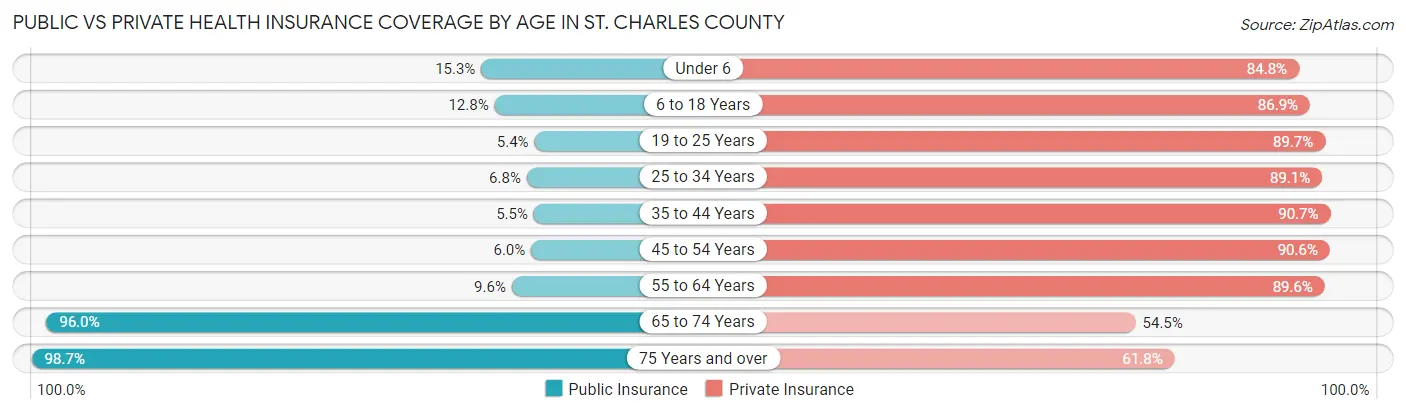
| Age Bracket | Public Insurance | Private Insurance |
| Under 6 | 4,284 (15.2%) | 23,834 (84.8%) |
| 6 to 18 Years | 8,916 (12.8%) | 60,623 (86.9%) |
| 19 to 25 Years | 1,801 (5.4%) | 30,095 (89.7%) |
| 25 to 34 Years | 3,122 (6.8%) | 40,922 (89.1%) |
| 35 to 44 Years | 3,095 (5.5%) | 51,093 (90.7%) |
| 45 to 54 Years | 3,083 (6.0%) | 46,689 (90.6%) |
| 55 to 64 Years | 5,281 (9.6%) | 49,397 (89.6%) |
| 65 to 74 Years | 36,837 (96.0%) | 20,935 (54.5%) |
| 75 Years and over | 25,313 (98.7%) | 15,833 (61.8%) |
| Total | 91,732 (22.7%) | 339,421 (83.9%) |
Disability Status by Sex by Age in St. Charles County
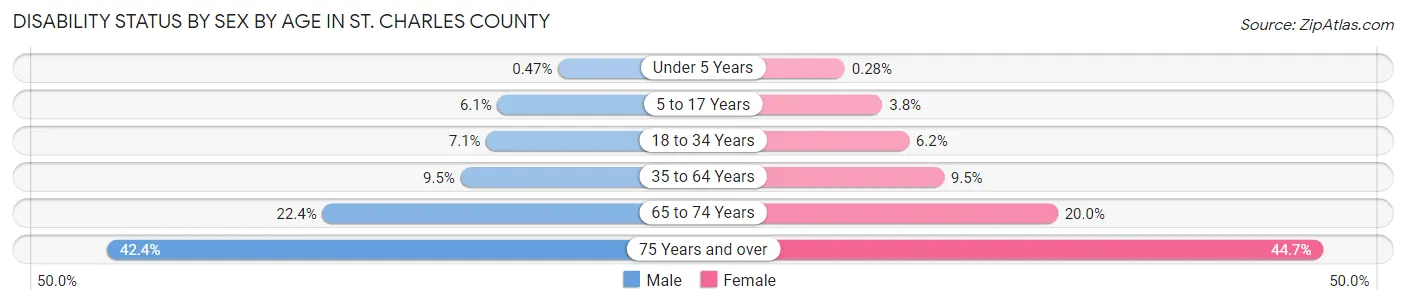
| Age Bracket | Male | Female |
| Under 5 Years | 54 (0.5%) | 31 (0.3%) |
| 5 to 17 Years | 2,185 (6.1%) | 1,287 (3.8%) |
| 18 to 34 Years | 3,073 (7.1%) | 2,596 (6.2%) |
| 35 to 64 Years | 7,761 (9.5%) | 7,728 (9.5%) |
| 65 to 74 Years | 3,994 (22.4%) | 4,112 (20.0%) |
| 75 Years and over | 4,523 (42.3%) | 6,685 (44.7%) |
Disability Class by Sex by Age in St. Charles County
Disability Class: Hearing Difficulty
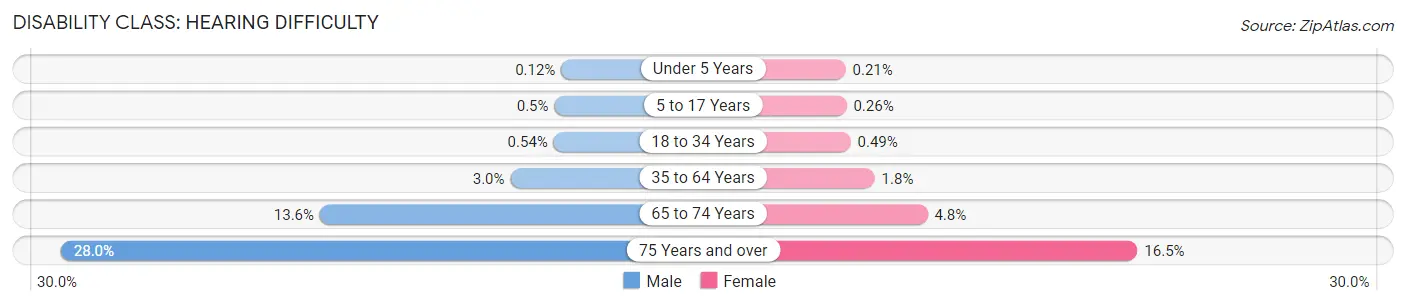
| Age Bracket | Male | Female |
| Under 5 Years | 14 (0.1%) | 23 (0.2%) |
| 5 to 17 Years | 180 (0.5%) | 89 (0.3%) |
| 18 to 34 Years | 234 (0.5%) | 204 (0.5%) |
| 35 to 64 Years | 2,406 (2.9%) | 1,495 (1.8%) |
| 65 to 74 Years | 2,424 (13.6%) | 979 (4.8%) |
| 75 Years and over | 2,989 (28.0%) | 2,463 (16.5%) |
Disability Class: Vision Difficulty
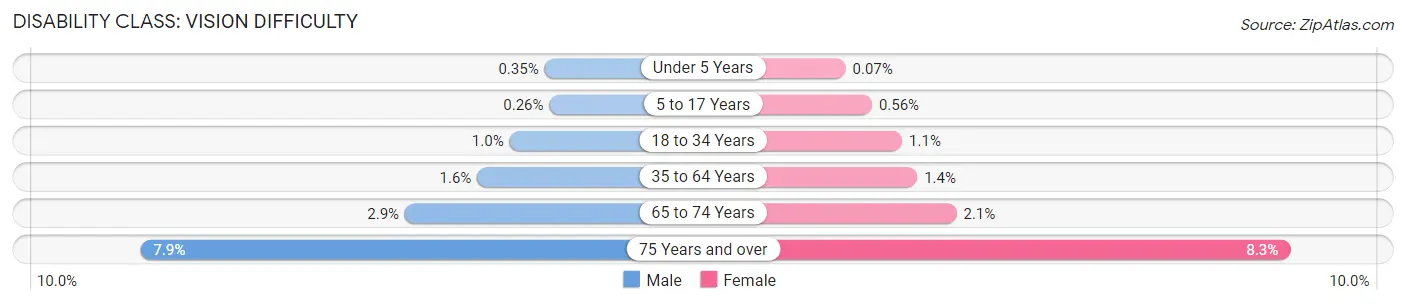
| Age Bracket | Male | Female |
| Under 5 Years | 40 (0.4%) | 8 (0.1%) |
| 5 to 17 Years | 93 (0.3%) | 192 (0.6%) |
| 18 to 34 Years | 432 (1.0%) | 465 (1.1%) |
| 35 to 64 Years | 1,302 (1.6%) | 1,138 (1.4%) |
| 65 to 74 Years | 525 (2.9%) | 437 (2.1%) |
| 75 Years and over | 838 (7.9%) | 1,244 (8.3%) |
Disability Class: Cognitive Difficulty
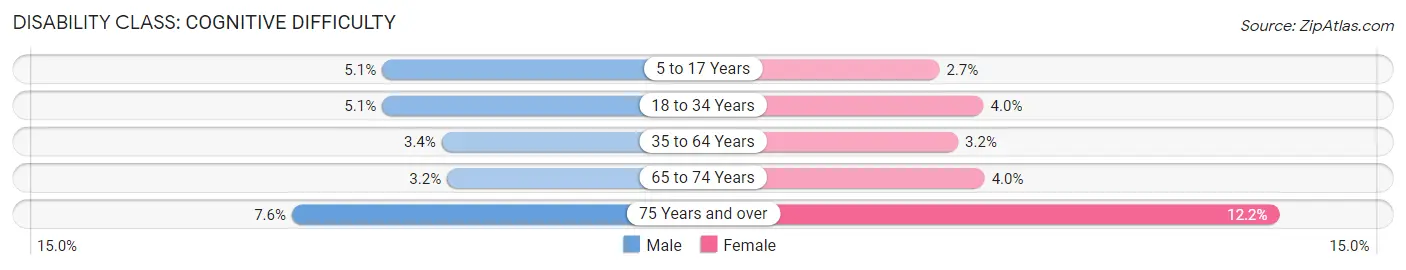
| Age Bracket | Male | Female |
| 5 to 17 Years | 1,809 (5.1%) | 930 (2.7%) |
| 18 to 34 Years | 2,175 (5.1%) | 1,648 (4.0%) |
| 35 to 64 Years | 2,761 (3.4%) | 2,643 (3.2%) |
| 65 to 74 Years | 579 (3.2%) | 817 (4.0%) |
| 75 Years and over | 808 (7.6%) | 1,822 (12.2%) |
Disability Class: Ambulatory Difficulty
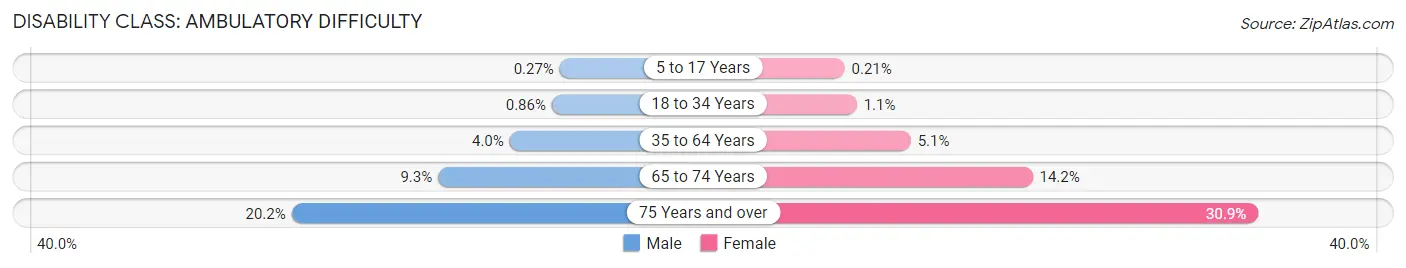
| Age Bracket | Male | Female |
| 5 to 17 Years | 98 (0.3%) | 71 (0.2%) |
| 18 to 34 Years | 370 (0.9%) | 464 (1.1%) |
| 35 to 64 Years | 3,250 (4.0%) | 4,173 (5.1%) |
| 65 to 74 Years | 1,662 (9.3%) | 2,904 (14.2%) |
| 75 Years and over | 2,155 (20.2%) | 4,624 (30.9%) |
Disability Class: Self-Care Difficulty
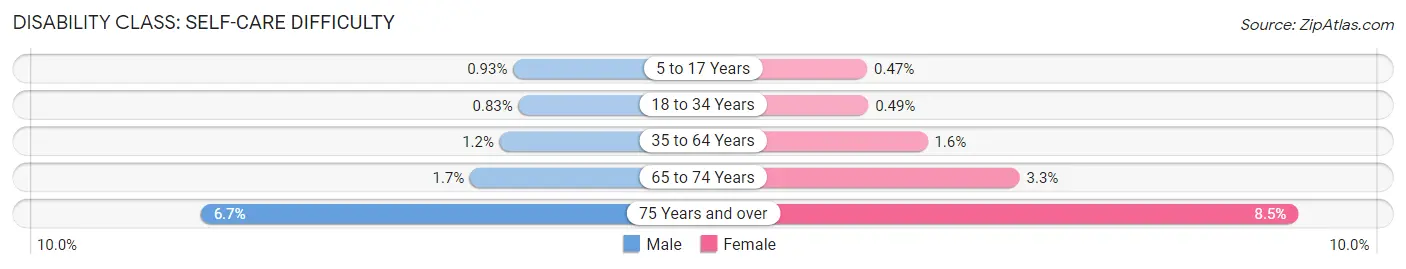
| Age Bracket | Male | Female |
| 5 to 17 Years | 333 (0.9%) | 162 (0.5%) |
| 18 to 34 Years | 359 (0.8%) | 204 (0.5%) |
| 35 to 64 Years | 961 (1.2%) | 1,300 (1.6%) |
| 65 to 74 Years | 310 (1.7%) | 677 (3.3%) |
| 75 Years and over | 719 (6.7%) | 1,267 (8.5%) |
Technology Access in St. Charles County
Computing Device Access in St. Charles County
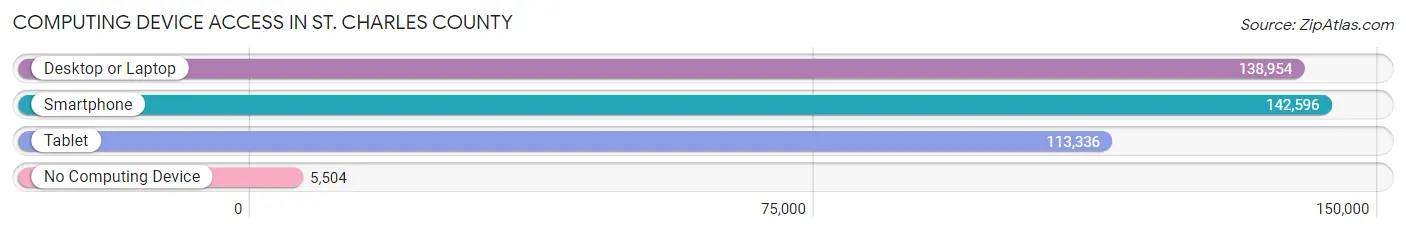
| Device Type | # Households | % Households |
| Desktop or Laptop | 138,954 | 88.9% |
| Smartphone | 142,596 | 91.2% |
| Tablet | 113,336 | 72.5% |
| No Computing Device | 5,504 | 3.5% |
| Total | 156,381 | 100.0% |
Internet Access in St. Charles County
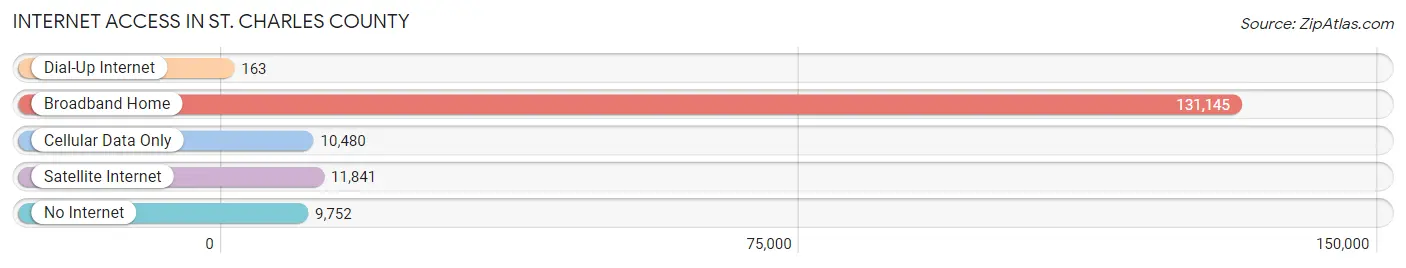
| Internet Type | # Households | % Households |
| Dial-Up Internet | 163 | 0.1% |
| Broadband Home | 131,145 | 83.9% |
| Cellular Data Only | 10,480 | 6.7% |
| Satellite Internet | 11,841 | 7.6% |
| No Internet | 9,752 | 6.2% |
| Total | 156,381 | 100.0% |
St. Charles County Summary
St. Charles County, Missouri is located in the eastern part of the state, just west of St. Louis. It is the fourth most populous county in Missouri, with a population of 360,485 as of the 2010 census. The county seat is St. Charles, and the largest city is O'Fallon.
Geography
St. Charles County is located in the eastern part of Missouri, just west of St. Louis. It is bordered by Lincoln County to the north, Warren County to the east, Franklin County to the south, and St. Louis County to the west. The county covers an area of 526 square miles, with a population density of 690 people per square mile. The county is mostly flat, with some rolling hills in the northern and western parts. The Missouri River forms the western border of the county, and the Mississippi River forms the eastern border.
Economy
St. Charles County has a diverse economy, with a mix of manufacturing, retail, and service industries. The county is home to several large employers, including Boeing, MasterCard, and Express Scripts. The county also has a strong agricultural sector, with corn, soybeans, and hay being the main crops. The county is also home to several wineries and breweries, as well as a number of tourist attractions.
Demographics
As of the 2010 census, St. Charles County had a population of 360,485. The racial makeup of the county was 87.3% White, 8.2% African American, 0.7% Native American, 1.7% Asian, 0.2% Pacific Islander, 0.7% from other races, and 1.4% from two or more races. Hispanic or Latino of any race were 2.9% of the population.
The median income for a household in the county was $63,945, and the median income for a family was $76,945. The per capita income for the county was $30,945. About 6.2% of families and 8.3% of the population were below the poverty line, including 10.2% of those under age 18 and 6.2% of those age 65 or over.
Conclusion
St. Charles County, Missouri is a diverse and vibrant county located in the eastern part of the state. It is home to a mix of manufacturing, retail, and service industries, as well as a strong agricultural sector. The county has a population of 360,485, with a median household income of $63,945. St. Charles County is a great place to live, work, and play, and is sure to continue to grow and thrive in the years to come.
Common Questions
What is Per Capita Income in St. Charles County?
Per Capita income in St. Charles County is $47,746.
What is the Median Family Income in St. Charles County?
Median Family Income in St. Charles County is $118,114.
What is the Median Household income in St. Charles County?
Median Household Income in St. Charles County is $99,596.
What is Income or Wage Gap in St. Charles County?
Income or Wage Gap in St. Charles County is 30.8%.
Women in St. Charles County earn 69.2 cents for every dollar earned by a man.
What is Family Income Deficit in St. Charles County?
Family Income Deficit in St. Charles County is $10,690.
Families that are below poverty line in St. Charles County earn $10,690 less on average than the poverty threshold level.
What is Inequality or Gini Index in St. Charles County?
Inequality or Gini Index in St. Charles County is 0.40.
What is the Total Population of St. Charles County?
Total Population of St. Charles County is 406,262.
What is the Total Male Population of St. Charles County?
Total Male Population of St. Charles County is 201,131.
What is the Total Female Population of St. Charles County?
Total Female Population of St. Charles County is 205,131.
What is the Ratio of Males per 100 Females in St. Charles County?
There are 98.05 Males per 100 Females in St. Charles County.
What is the Ratio of Females per 100 Males in St. Charles County?
There are 101.99 Females per 100 Males in St. Charles County.
What is the Median Population Age in St. Charles County?
Median Population Age in St. Charles County is 39.4 Years.
What is the Average Family Size in St. Charles County
Average Family Size in St. Charles County is 3.0 People.
What is the Average Household Size in St. Charles County
Average Household Size in St. Charles County is 2.6 People.
How Large is the Labor Force in St. Charles County?
There are 225,175 People in the Labor Forcein in St. Charles County.
What is the Percentage of People in the Labor Force in St. Charles County?
69.4% of People are in the Labor Force in St. Charles County.
What is the Unemployment Rate in St. Charles County?
Unemployment Rate in St. Charles County is 3.1%.